mol scientific magazine sd & hse special issue
DESCRIPTION
Interesting articles about sustainable Development.TRANSCRIPT

MO
L S
CIE
NTI
FIC
MA
GA
ZIN
E S
D &
HS
E s
pecia
l is
sue
MOL Scientific Magazine SD & HSE special issue
1The Climate and Renewable Energy Package of the EU1Emerging Technologies for Second Generation Biofuels1Green Trends – Concept for the Future Filling Station

3
SD & HSE special issue
1MOL GROUP
MOL Scientific Magazine
ContentsEditorial 6
Pál Kapusy: Business case of sustainable development? 8
Gábor Bacskay – Gergely Orbán: Govern companies on sustainable way 15
László Rácz: Birth and development of product stewardship 25
István Pócs – Iván Katona: Be among the firsts or dropped behind – The renewable challenge 36
Ilona Vári: The climate and renewable energy – (CARE) Package of the EU, 20:20:20 by 2020 46
Vojtech Harča – Boris Cavrak: Process Safety Management in the MOL Group 58
Michal Šingliar – Miroslav Dolnák: Emerging Technologics for second Generation of Biofules 67
Dóra Somlyai – Ágnes Kelenvölgyi – Andrea Haáz: Sustainable development in corporate giving 81
Iván Bakos: Social Impact Assessment (SIA) – Upcoming challenge during project implementation 87
Viktória Márton – Deborah M. Namugere: Biodiversity and the oil and gas industry 92
Dr. István Miniska – Attila Incze: Beyond what is required 101
Péter Suba – Dr. Gábor Nagy – Kinga Lovas Kiss: Development of biodegradable polymers 115
Péter Kubus: CO2 storage possibilities in Hungary 120
Dr. Máté Zöldy: Significance of application technique of fuel containing biocomponents 133
László Bartha – Béla Csorba: Green Trends – Future Under MOL Canopy – Concept for the Future Filling Station 140

4
1MOL GROUP
MOL Scientific Magazine
Editorial Board: Béla Csorba; Gábor Kis Dr.; Jenô Hancsók, Dr.; Horváth Péter; László Isaák; Pál Kapusy; Zoltán Kocsis; Márta Krámer, Dr.; László Lázár; Zoltán Marton; Zsolt Molnár; Attila Plecskó; László Rácz, Dr.; László Rácz, Jr.; Nóra Saláta; Dóra Somlyai; Gabriella Szalmás, Dr.; Artur TherneszManaging editor: Virág SimonChairman of the Editorial Board: György Mosonyi
ISSN 2060-338X
SD & HSE special issue

6
1MOL GROUP
SD & HSE special issueMOL Scientific Magazine
Beköszöntô
A MOL népszerû szakmai kiadványa elsô alka-lommal jelenik meg egy fenntartható fejlôdésnek dedikált különszámmal, követve a MOL Csoport elsô, 2008.évi Integrált Éves Jelentését.
Van ennek a két dolognak bármilyen üzenete? Azt gondoljuk igen, van! A Társaságunk rálépett arra az útra, amelyen minden üzleti döntés a fenntarthatóság próbáján esik át, amikor a fenntartható fejlôdés, a vállalati fenntarthatóság megközelítés mindennapi üzleti kérdés! Ezen az úton azonban számos és lényeges kérdést, dilemmát kell megválaszolni, amire mi is keressük a legjobb válaszokat, választásokat, megoldásokat másokhoz hasonlóan.
A különszám legjobb szakértôink közül publikáló szerzôi kiváló tudással foglalják össze ezeket a kérdéseket, és lehetséges válaszokat globális és társasági kitekintésben egyaránt:
az olaj-, gáz- és energia ipar klímaváltozásból ere dô kihívásai, energiabiztonság és a megú ju-
ló energiahordozók, fenntarthatóság – ver seny-képesség – profittermelés, a mûködés átlát-hatósága és az erôs társaságirányítási rendszer, a jelen és jövôbeli termékeink életciklus szemléletû, felelôs gondozása, technológiai megújulási kényszer a környezetterhelés csökkentése ér-dekében, fokozott figyelem igénye a szûkebb és tágabb mûködési környezetre, a társadalmi hatásokra, a biológiai diverzitás megôrzésének fontosságára, a munkahelyi biztonságra és egészségfejlesztésre.
És ezek csak az általunk önkényesen kiemelt, talán legfontosabb témák, de Ön, kedves Olvasó bizonyára továbbiakat is találni fog…
A különszám cikkei gondolatébresztô, nyitott kérdéseket is hagynak, de azokat a válaszokat és választásokat is kiválóan bemutatják, amelyekkel társaságunk fenntarthatóságát, a fenntartható fejlôdést célozzuk.
Jó szívvel ajánljuk elolvasásra és együtt gon dol-kodásra a következô oldalakat!
Kedves Olvasó!
Mosonyi György Vezérigazgató, a FF Bizottság elnöke
Cseh BélaCsoport FF&EBK igazgató

7
SD & HSE special issue
1MOL GROUP
MOL Scientific Magazine
Editorial
The popular scientific magazine of MOL issued the first time its special edition dedicated to sustainable development, following the first Integrated Annual Report 2008 of MOL Group.
Do these two things are carrying any message at all? We think yes, they do!
Our company took the road, where all business decisions pass the proof of sustainability, where corporate sustainability forms a „business as usual” issue!
There are several essential questions and dilemmas to answer on this road, and we are in search of the best answers, choices and solutions as well as others.
The authors from our best experts publishing in this special edition summarize these questions and potential answers with excellent knowledge and outlook on both, global and corporate horizon: challenges of the oil, gas and energy sector derived from the climate change, security of the energy and the renewable energy sources,
sustainability – competitiveness – profit making, operational transparency and strong corporate governance, responsible care of our recent and future products following the life-cycle approach, the pressure for technology renewal in order to reduce the environmental pollution, the need for increased focus on both, the closer and broader environment of our operations, on the social impacts, on the importance of preserving biodiversity, on the work safety and on workplace health promotion.
All these above are highlighted arbitrarily by us only as probably the most important topics, but you, dear Reader may surely find many other more …
The articles of this special edition leave stimulating, open questions too, however present prominently those answers and choices which we aim the sustainability of our company and the sustainable development with.
I recommend you with all my heart the reading and co-thinking of all the next pages!
Dear Reader,
György Mosonyi GCEO, Chairman of the SD Committee
Béla CsehVP Group SD&HSE

8
1MOL GROUP
AbstractThe goal of this article is to introduce the MOL Group business optimization process and its supporter tool PIMS (Process Industry Modeling System) modeling and optimizing program package. PIMS is an efficient aid in the group level planning and business optimization of the supply chain for MOL Group Downstream. This software is the most widely used one in the oil industry. We have presented how the supplies to the markets can be optimized, how PIMS can be of assistance to us in project economics studies, how production plan, inter-refinery transfer plan and inventory plan can be prepared, and how we can used it for price sensitivity studies and in many other applications.It is essential that Downstream has been integrated into one single model, and now we are able to define the complete business optimum for Downstream. This means that the optimum feedstock purchases, the transfers between production units, details of the processing, production, blending structures and various materials, the stockpiling or distribution quantities, the marketing quantities, and the associated variable costs and prices can all be obtained from one single PIMS result. All this information is available by refineries.We are convinced that optimization is
an efficient tool to support in achieving our strategic and business targets. We improve our optimization and planning methods continuously to exploit better and better our opportunities in the future.
ÖsszefoglalásA cikk célja megismertetni az olvasót a MOL Csoport üzleti optimalizálásának folyamatával és az azt támogató szoftver eszközzel, a PIMS (Process Industry Modeling System) modellezô és optimalizáló programcsomaggal. A PIMS hatékony segédeszköze a MOL Csoport Downstream ellátási lánc csoportszintû tervezésének és üzleti optimalizálásának. Ez a szoftver a legelterjedtebb az olajiparban. Bemutattuk, hogyan optimalizálható a piacok ellátása, hogy lehet a PIMS beruházás gazdaságossági vizsgálatokban a segítségünkre, miként készíthetô termelési terv, finomítók közötti transzfer terv és készletterv, végezhetünk vele árérzékenység vizsgálatokat és még számos más területen alkalmazható. Lényeges, hogy a Downstream-et egyetlen modellbe integráltuk és így képesek vagyunk a tejes Downstream üzleti optimumát meghatározni. Ez azt jelenti, hogy egyetlen PIMS eredménybôl kinyerhetôk az optimális alapanyag beszerzések, a termelô egységek közötti transzferek, a feldolgozási, termelési, keverési struktúrák és a különféle anyagok minôségi adatai, a készletezési, szállítási mennyiségek, az értékesítési mennyiségek és ezekhez kapcsolódó változó költségek és árak. Ezek
Mészöly Csaba (44)Long Term Planning SCM DSokl. szervezô vegyészmérnök, mérnök-közgazdászMOL Csop./Termékelôállítás és Kereskedelem Divízió/SCM/Hosszú távú Tervezés
SD & HSE special issueSzakmai Tudományos Közlemények
REQUIREDBeyond what is
9
SD & HSE special issue
1MOL GROUP
MOL Scientific Magazine
SUSTaInaBLEBusiness case of
Development?
AbstractThis paper gives an introduction to the topic of sustainable development (SD) for this special SD&HSE edition of MOL Scientific Magazine. It aims to briefly summarise the basic concepts of SD, with a special focus on companies, i.e. the difference between SD, corporate sustainability and CSR. This clarification process of these concepts seems to be too theoretical, but the related misunderstandings can have significant consequences. Then the key areas of SD activities of the oil and gas industry are briefly presented, and finally the outline of MOL’s approach is described. In the end of the article the dilemma about the financial benefits of SD is discussed.
ÖsszefoglalásAz alábbi cikk egy bevezetô jellegû írás a MOL Szakmai Tudományos Közle mé-nyek FF és EBK különszámához. Elôbb rö vi den összefoglalja a fenntartható fej-lôdés (FF) gondolatkörével kapcsolatos válla lati alapfogalmakat, úgy mint FF, CSR, vagy vállalati fenntarthatóság. Ezek az elméletinek tûnô fogalmi tisz-tázások való jában nagyon fontos gya-korlati kö vet kezménnyel bírnak. Ezután röviden bemutatásra kerül, hogy az olaj- és gázi par számára melyek a leg-fontosabb területek a FF témájában, és végül kitér a MOL megközelítésének alapjaira. A cikk vé gén felveti a kérdést,
vajon pénzügyi szempontból megéri-e a FF-sel foglalkozni vállalati szinten.
IntroductionThe special edition of MOL Scientific is dedicated to the topics of Sustainable Development (SD) and Health, Safety and Environment (HSE). What gives the actuality of these issues?
Sustainable Development is becoming a more and more important concept: in the last years of economic growth environmental questions came into the spotlight, such as climate change or loss of biodiversity. The current financial and economic crisis and recession brought increased attention also to other topics related to SD, such as corporate governance and transparency, accountability.
Sustainable development has never been such a compelling issue: we need to solve the economic, social and environmental crisis of our times.Definitions are essential elements of an intro-ductory article. The most commonly known definition of SD dates back to 1987:
„…development which meets the needs of the present without compromising the ability of future generations to meet their own needs”
Brundtland-report (UN): Our Common Future,1987
A more practical, business-oriented concept was defined in 2002:
“We need to make sustainable development happen by generating economic growth with greater resource efficiency, while minimising environmental impacts and with maximum social well-being for more people. We also welcome the growing realisation that business is an indispensable part of the solution to the problems
Pál Kapusy Head of Sustainable DevelopmentMOL Group SD & HSEE-mail: [email protected]

10
SD & HSE special issueMOL Scientific Magazine
1MOL GROUP
of the world. We have improved our relationships with governments, NGOs and others. Together we will turn the idea of sustainable development through practical partnerships into a growing reality on the ground.”
Business Action for Sustainable Development, World Summit on Sustainable Development,
Johannesburg 2002
It is worth to mention the definition of “Sustainability Performance” of one of the most known SD related standard, the AA1000 [4]:
“Sustainability performance refers to an orga-nisation’s total performance, which might include its policies, decisions, and actions that create social, environmental and/or economic (including financial) outcomes.”
MOL understands SD as it follows:„Sustainable Development, for us, means a corporate commitment to the balanced integra-tion of economic, environmental and social factors into our everyday business operations, to maximise long-term stakeholder value and to safeguard our licence to operate.”
Why this special edition is called SD&HSE? In 2008 the management of MOL has decided to integrate SD into the HSE organisation to improve operational efficiency and make use of the potential synergies. Why? Health, safety and environmental issues cover important areas of the social and environmental dimension of SD, while SD can give an impetus to existing HSE practices in terms of continuous improvement and challenging targets.
The drivers of SDThe main reason why SD is becoming a more and more accepted approach is that the current way of development (on a global scale) is not sustainable. It is simply because our planet is a closed system in terms of material, thus continuously depleting natural resources should provide the basis of an ever increasing standard of living for a dynamically growing population on our planet. This all is happening at the expense of future generations: our children will have to live in a world where the climate is changed, water is a scarce resource, biodiversity is poor, and billions of people live in poverty.
There are two types of reasoning why a company should deal with SD: moral arguments (normative approach) and business motives (instrumental approach).
The main drivers and the potential benefits for companies are summarised in Table 2. Following business (instrumental) arguments, these benefits are the most commonly used ones, even if their achievement can be extremely challenging and depend on many external preconditions (market demand, taxes and incentives, etc.).
Moral / ethical / Business / normative instrumental arguments arguments
Claimed by Civil organisations SD (CSR)
(NGOs), academics consultants, professionals Responsible/sustainable SD (CSR) operations even by is a “tool” forObjective decreased profitability in maximising the short run, SD is a profit value itself without profit considerations Unrealistic, idealistic Very limited
Problems demand on companies change can be achieved if the focus is only on short-term benefits;
Table 1. Two types of arguments for SD.
Driver (threat) Benefit (opportunity)Natural resource Increased resourcedepletion efficiency, cost-efficiencyClimate change New business opportunities (energy-efficiency, renewables)Water scarcity Increased resource efficiency, cost-efficiencyDemographic change New market segmentsEnvironmental taxes Being proactive and gainand regulations competitive advantageChanging consumer New green/premiumbehaviour productsEmployee expectations Employee branding, towards SD talent attraction and retention, increased loyalty and engagementGrowing expectation Increased brand value, of society image, reputationTransparency, Better investoraccountability relationships, lower risks
Table 2. Main drivers of SD and the potential benefits for companies.

11
MOL Scientific MagazineSD & HSE special issue
1MOL GROUP
Corporate Sustainability or Sustainable Development?The original term of SD refers to the complex, macro-level process of development. For example Herman Daly, ex-senior economist of the World Bank, when criticising the “growth-mania”, focuses on country-level or regional development, claiming the inappropriateness of the “blind” pursuit of increasing the GDP. On this “macro-level” the main challenge of SD is how to balance between its three pillars, economic, social and environmental. In practice it means how to integrate social and environmental aspects in decision-making procedures.
In case of corporations, seeking to reach a “macro-optimum”, thus going beyond the horizon of corporate objectives for the sake of the whole society, can be problematic. The raison d'être1 of a for-profit company is not to save the world or to replace the function of governmental institutions. However, if the sustainability of the development (of the whole society) is not secured, ecological and social problems arise, the long-term success of a company can be also put under risk. The key is the timeframe: in the long run there is a common goal, the sustainable development.
The meaning of the term “corporate sustain-ability” is slightly different. It is mainly used by financial analysts as an umbrella term covering the three dimensions they are investigating: environmental, social and governance (“ESG”).
As the definition of SAM Research (Dow Jones Sustainability Indexes) says: “corporate sustainability is a business approach to create long term shareholder value by embracing opportunities and managing risks deriving from economic, environmental and social developments.”2 Apparently this definition is less theoretical than the “traditional” SD concept (defined by the Brundtland Committee, see above), it is business-focused and ignores ethical considerations.
SD or CSR?It is a general misunderstanding to think that the approach called “Corporate Social Responsibility” (CSR) is identical with the social pillar of sustainability. In Europe, CSR tends to mean a broader concept to describe the new role of companies in the 21st century:
“CSR is a concept whereby companies integrate social and environmental concerns in their business operations and in their interaction with their stakeholders on a voluntary basis.”
EU Commission [3]
The concept of CSR is even broader than SD. From a responsibility point of view, being committed to SD is one of the most important responsibilities of a company. Instead of the triple bottom line (continuously improving performance in economic, social and environmental areas) CSR puts the interest of stakeholders in the focus. The basis of the responsibility is to listen to, being engaged with stakeholders including not only suppliers, employees, shareholders, etc, but the so-called voiceless stakeholders such as the nature, the climate, or future generations. The latter are generally represented by non-governmental organisations (NGO).
Consequently CSR is not about donations, charity actions but it denotes almost the same activities as SD, namely integrating environmental and social considerations in business processes for the long-term success of the company and for the benefit of the society. As the saying goes: “not about giving back, but making right”.
In the U.S. the term “Corporate Citizenship” is the most commonly used expression to cover this area.
MOL opted for using “SD” to avoid the potential misunderstandings related to “CSR” which are also due to the fact that in Hungarian language the term “social” can be translated in two ways with slightly different meaning (“szociális” vs. “társadalmi”).
But what matters is the content, not the name: the public reports of companies disclosing their SD related performance can have different titles, but the topics covered, the structure, the used guidelines (e.g. GRI) are more or less identical.
1 Reason for being2 www.sam-group.com

12
SD & HSE special issueMOL Scientific Magazine
1MOL GROUP
Companies might change the umbrella term (title of the report) from CSR to SD or vice versa, as for instance it occurred in OMV.
In the following table you can find some examples:
The oil industry and SDThe oil and gas industry can be easily criticised from an SD point of view: it is based on non-renewable natural resources, therefore it can not be sustainable. Moreover, burning fossil fuels leads to an increased concentration of greenhouse-gases in the atmosphere resulting in global warming.
What does SD mean for the oil and gas sector? One of the most widely used argument is that our industry generates indispensable economic and social value today and thus allows society to move towards more sustainable energy-consumption patterns by using forms of alternative energy in the future. Since this is a long “journey”, today our industry should focus on minimising negative environmental and social impacts and maximising the benefits generated for the society.
This article cannot give a comprehensive, detailed overview about the scenarios of the future of energy and the transformation into a low-carbon economy. There are several thorough analysis available, e.g. on www.shell.com (“The energy challenge”) or www.energyblueprint.info (by Greenpeace). In this introductory paper we can only provide a list of the main impacts and areas a company from our industry has to focus on:
MOL and Sustainable DevelopmentSustainable Development is a long journey for all companies and this is especially true for those operating in such industries as oil and gas or energy.
Here are some milestones in the history of MOL’s SD operation:
• 1996 – MOL is the first Hungarian company who publishes an “HSE Report”
• 2002 – MOL’s first SD Report following the GRI Guidelines
• 2006 – Establishment of SD Committee, as a new committee of the Board of the Directors in order to represent and supervise SD on the highest level
• 2007 – Announcement of the 7 strategic SD initiatives for 2007-2010
The values related to SD are embedded in the main governing documents of MOL:
• SD is one of our core values, as it is described in OOR (Organisational and Operational Rules): “Health, safety, environmental and social commitment: we want to fulfil our responsibilities towards our employees, host communities and societies, therefore we aspire to perform
Concept Companies Sustainable Development Conoco, Statoil Sustainability BP, Shell, ENI Corporate Social OMV (from 2008 SD), Responsibility (CSR) Petrochina, Tullow Corporate Responsibility BG Group, Repsol, Total Corporate Citizenship Exxon
Jobs CreatedSkills Enhancement
Local Economic ImpactsSocial Investments
Business EthicsTaxes/Royalties
Safety & HealthLocal Environmental Impact
Global Climate ChangeResource Management
EamingsNet Cash Flow
Shareholder Return
Resource EfficiencyProduct StewardshipLife‐Cycle Analysis
Waste MinimalizationEmission Reduction
Regulatory CompilanceBiodiversity
Spill Prevention
DiversityEmployee Satisfaction
Human RightCommunity Dialogue
Labor Standards
SocialProgress
Socio‐Economic
Environmental Stewardship
Eco‐Efficiency
Sustainability
Socio‐Environmental
Economic Growth
Figure 1. The main areas of SD in the „triple bottom line” concept. Source: IPIECA-API [1]
Table 3. Different titles, similar content.

13
MOL Scientific MagazineSD & HSE special issue
1MOL GROUP
beyond the legally required standards.”• One of the 11 standard principles of MOL
Group is about SD (standard principle ~ policy).
• The Code of Ethics of the Group serves as a guideline about the ethical questions connected to all stakeholders (e.g. suppliers, customers, environment, etc.).
Our 7 strategic SD initiatives defined in 2007:
1. Strengthen good governance and risk management
2. Concentrate on future portfolio steering3. Focus on internal and external customer
relations4. Enhance trust & credibility among
stakeholders5. Reduce environmental footprint6. Manage opportunities, risk & liabilities in
the value chain7. Capitalize on human resources
In 2007 MOL’s management selected the assessment related to Dow Jones Sustainability Index (DJSI)3 to benchmark our SD performance. It is a huge effort and a challenging cross-divisional project to respond the 112 detailed questions of the DJSI survey. It is due in May, via an on-line surface. The results are published in September, and based on the detailed evaluation and identified area for improvements we launch new actions to follow international good practices. This is a powerful tool to track our progress in SD, conduct a self-assessment and see ourselves in a “mirror”, in the light of our peers and competitors.
Based on our performance in 2007, MOL positioned itself amongst the top 20% companies in the oil and gas sector.
For more information about the SD performance of MOL, please refer to our website: www.mol.hu/sd.
Business case of SD?There has been a long debate about the business case of SD or CSR. Consultants like to emphasize that SD/CSR pays off, it improves competitiveness and increases the value of a corporation. However, to prove the correlation between the SD performance and the financial success of the company is very problematic.Some SD projects, like energy-efficiency measures or actions with direct impact on consumption (e.g. introducing 2-side printing) might lead to immediate savings. Others can have an acceptable 2-3 years of payback period.
But what about SD projects with 15-20 years of payback period? Can a company afford to make huge investments and have only a low annual return as the case is for example in most of the renewable energy projects? Or those bringing only intangible, non-financial and hardly measurable benefits, such as increased employee engagement? These are the real dilemmas when a company is committed to SD. Obviously the devil is in the details, there are many factors to consider in such decisions. A company can have strong corporate commitments, either internal, like policies (“standard principles” in case of MOL), values and guidelines, either external like being signatory to the United Nations Global Compact4 (MOL has signed it in 2005). Specific actions under the frame of a publicly announced commitment can “guarantee” intangible benefits in terms of enhanced reputation, employee loyalty etc. In many cases committed, environmentally or socially sensitive managers play crucial role in overcoming barriers and find smart ways of transforming the company more sustainable while maintaining or even increasing long-term profitability. Is it true that the market pays a premium for investments in SD/CSR?
Sustainability analysts and investors claim that an SRI fund – i.e. portfolio consisting of companies with better sustainability performance5 – outperforms its peers. However, the universal correlation, i.e. SD or CSR always pays off, could never been demonstrated.
3 Examples for other SD ratings and indexes: FTSE4Good, Goldman Sachs ESG rating, Ethibel, Vigeo4 „The United Nations Global Compact is a strategic policy initiative for businesses that are committed to aligning their
operations and strategies with ten universally accepted principles in the areas of human rights, labour, environment and anti-corruption.” (www.unglobalcompact.org)
5 SRI = Social Responsible Investments. There are different types of these funds: (1) negative screening, when following a set of criteria companies/industries are excluded (e.g. gambling, tobacco), (2) positive screening, when the portfolio includes the sustainability leaders (e.g. Dow Jones Sustainability Index), (3) advocacy, when the shareholders influence the strategy of a company for the sake of sustainability.
14
SD & HSE special issueMOL Scientific Magazine
1MOL GROUP
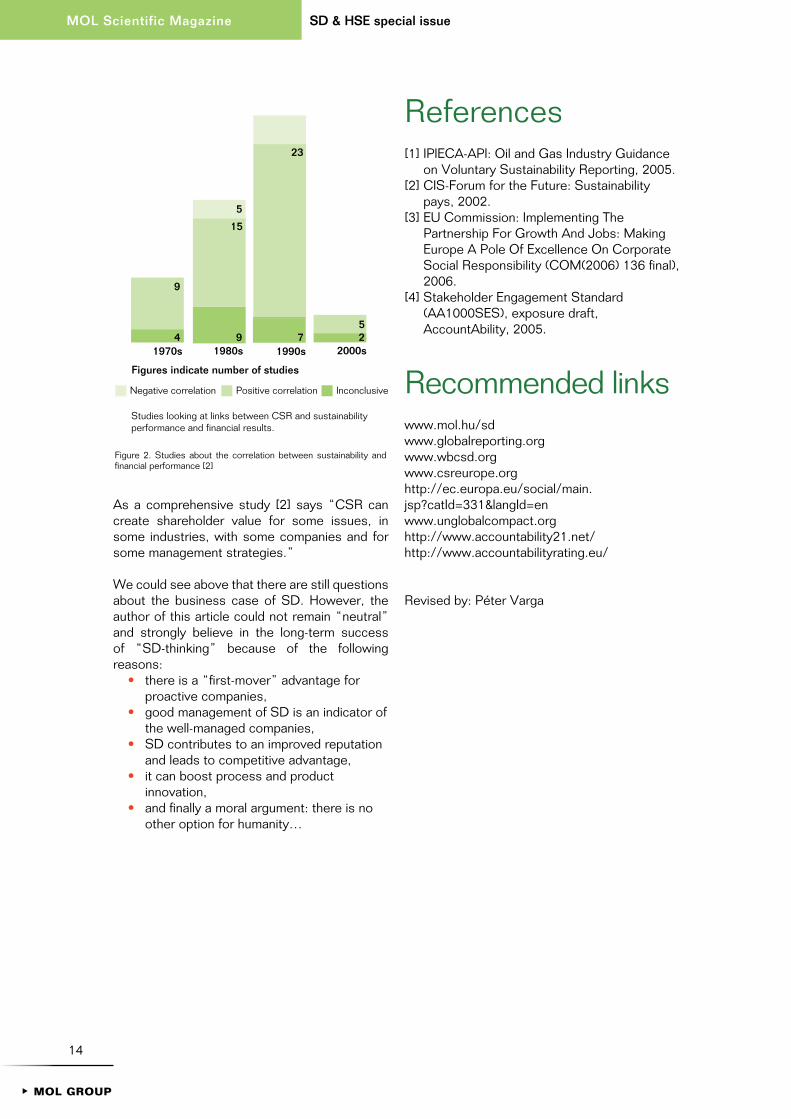
As a comprehensive study [2] says “CSR can create shareholder value for some issues, in some industries, with some companies and for some management strategies.”
We could see above that there are still questions about the business case of SD. However, the author of this article could not remain “neutral” and strongly believe in the long-term success of “SD-thinking” because of the following reasons:
• there is a “first-mover” advantage for proactive companies,
• good management of SD is an indicator of the well-managed companies,
• SD contributes to an improved reputation and leads to competitive advantage,
• it can boost process and product innovation,
• and finally a moral argument: there is no other option for humanity…
References[1] IPIECA-API: Oil and Gas Industry Guidance
on Voluntary Sustainability Reporting, 2005.[2] CIS-Forum for the Future: Sustainability
pays, 2002. [3] EU Commission: Implementing The
Partnership For Growth And Jobs: Making Europe A Pole Of Excellence On Corporate Social Responsibility (COM(2006) 136 final), 2006.
[4] Stakeholder Engagement Standard (AA1000SES), exposure draft, AccountAbility, 2005.
Recommended linkswww.mol.hu/sdwww.globalreporting.orgwww.wbcsd.orgwww.csreurope.orghttp://ec.europa.eu/social/main.jsp?catId=331&langId=enwww.unglobalcompact.orghttp://www.accountability21.net/http://www.accountabilityrating.eu/
Revised by: Péter Varga
1970s 1980s 1990s 2000s
9
4 9 7 2
15
5
23
5
Figures indicate number of studies
Negative correlation Positive correlation Inconclusive
Studies looking at links between CSR and sustainabilityperformance and financial results.
Figure 2. Studies about the correlation between sustainability and financial performance [2]

15
SD & HSE special issue
1MOL GROUP
MOL Scientific Magazine
AbstractIn the past decade, due to several issues (e.g. Enron, Worldcom and re-cent stories of the financial sector), corporate governance came in the lime-light of the business world.In the beginning of the century McKinsey undertook a survey called 'Global Inves tor Opinion Survey' of over 200 institutional investors. Results showed that 80% of the respondents would pay a premium for well-governed companies. Why corporate governance is so im-portant that 80 % of involved investors would pay more for shares where, beside strong fundamentals of course, the governance of a company provides transparency and accountability in its operation and follow certain measures important for the market? In this article we would like to examine this question and show briefly the concept of corporate governance, its importance, its approach from the sustainable development philosophy point of view and close our article with a short view on MOL’s approach.
ÖsszefoglalásAz elmúlt évtizedben, számos ügynek köszönhetôen (pl. Enron, Worldcom és az elmúlt idôszak történései a pénz ü gyi szektorban) középpontba ke rült a Tár-saságirányítási Rendszer kérdés köre. A McKinsey a század elején 200 intéz-ményi befektetô megkérdezésével le bo -nyo lítot egy felmérést “Globális be fektetôi vélemények feltárása” ('Global Investor Opinion Survey') cím mel. Az eredmények azt mutatták, hogy a válaszadók 80%- a hajlandó lenne prémiumot fizetni olyan társaságok részvényeiért, ame-lyek Társaságirányítási Rendszere meg felelô minôségû. Miért annyira fon tos a vállalatok Társaságirányítási Rendszerének kérdésköre, hogy a meg-kérdezett befektetôk 80 %-a hajlandó lenne többet fizetni azon cégek rész-vé nyeiért, ahol – természetesen erôs fun damentumok megléte mellett –, az Irányítási Rendszer átlátható, szá-mon kérhetô mûködést biztosít és bi-zonyos, a piac szempontjából fontos in-tézkedések bevezetésre kerültek? Cikkünkben ezt a kérdést szeretnénk meg vizsgálni, illetve röviden be sze-ret nénk mutatni a Társaságirányítási Rend szer kereteit, annak fontosságát, kitérünk a Fenntartható Fejlôdéssel való kapcsolatára és egy rövid betekintést adunk a MOL gyakorlatába.
Gábor BacskaySenior expert in organisational designMOL Group OD&PME-mail: [email protected]
Gergely OrbánExpert in organisational designMOL Group OD&PME-mail: [email protected]
companies on sustainable way
GOvERn

16
SD & HSE special issueMOL Scientific Magazine
1MOL GROUP

17
MOL Scientific MagazineSD & HSE special issue
1MOL GROUP
Why corporate governance is important?Corporate governance involves all those processes, policies and laws which define how a corporation is directed, controlled, administered. It provides accountability, transparency in a way to minimize principal-agent problem. The principal-agent problem is the problem circle where the ownership and the management of a certain corporation is divided and the interests of the management and the owners (shareholders) (can) stand in conflict.
It includes the relationships with the different stakeholders (employees, customers, creditors, suppliers, buyers as primary stakeholders, and regulators, governmental, non governmental organizations, environment, future generations, etc as secondary stakeholders). It is also related to economic efficiency.
Many lecturers state that the advantage of a good corporate governance system for a company cannot be measured in an explicit way, however the lack of a (good) corporate governance system results visible effects, destroys value. We can quote a few value destroying incidents from the past, the Enron, Worldcom, or Andersen scandals at the beginning of the millennia and the recent bankruptcy of major financial institutions in the US that shocked the financial world.
Definition of corporate governanceAs for the definition we will never find a short and stable definition, as all people, corporate citizens, or to get answer from the top, the CEOs – understand the issue, based on their knowledge, educational and company background, at least slightly, different.
Gabrielle O'Donovan defines corporate gover-nance as "an internal system encompassing policies, processes and people, which serves the needs of shareholders and other stakeholders, by directing and controlling management activities with good business savvy, objectivity, accountability and integrity. Sound corporate governance is reliant on external marketplace
commitment and legislation, plus a healthy board culture which safeguards policies and processes". (O’Donovan, 2003) To show an example of this slightly different understanding, we can mention a broader definition: “The system by which companies are directed and controlled” or a narrower definition “Corporate governance deals with the ways in which suppliers of finance to corporations assure themselves of getting a return on their investment.” (Lukács, 2007)
From these three definitions we can see that, in the middle point of any corporate governance system the focus is on the interest of the shareholder and other stakeholders, and the adherence of the legal expectation towards the companies.
Parties in corporate governanceParties involved in corporate governance include the Chief Executive Officer, the Board of Directors (BoD), Supervisory Board (SB), Audit Committee (AC), executive management and shareholders. Other stakeholders who take part include suppliers, employees, creditors, customers and the community at large.
In corporations, the shareholder delegates decision rights to the manager to act in the principal's best interests. This separation of ownership from control results a loss of effective control by shareholders over managerial decisions. Partly as a result of this separation between the two parties, a system of corporate governance controls should be implemented to assist in aligning the incentives of managers with those of shareholders.
A Board of Directors often plays a key role in corporate governance. It is their responsibility to endorse the organisation's strategy, develop directional policy, appoint, supervise and remunerate senior executives and to ensure accountability of the organisation to its owners and authorities.
All parties to corporate governance have an interest, direct or indirect, in the effective per-formance of the organisation. Directors, workers and management receive salaries, benefits and reputation, while shareholders, investors receive
18
SD & HSE special issueMOL Scientific Magazine
1MOL GROUP
capital return. Customers receive goods and services; suppliers receive compensation for their goods or services. In return these individuals provide value in the form of natural, human, social and other forms of capital. (This network of connections also shows the necessity of corporate governance form sustainable development point-of-view).
Background of corporate governance systemsTheoretical background of the corporate go-vernance is derived from Ronald Coase’s (1937) “Transaction costs theory”, from the “Agency theory” (Fama, Jensen, 1983), and the “Stakeholder theory” (Freeman, 1984).
We can make distinction between the one-tier system (Anglo-Saxon model), where the control, evaluation of the Board of Directors, Managing Directors performance is the task of the Board of Directors (who were elected by the owners), and the two-tier system where the control of the Board of Directors is in the hand of a different body, the Supervisory Board (German model). There are debates on the effectiveness of the two types, but as analyses of the two systems shows neither can be superior to the other in this aspect (Jungman, 2006)
In the last sixty years as corporate structures became more and more complicated, the number of multi/transnational companies grew at a never before seen pace. This led to the various issues, debates which made corporate governance one of the important issues in the eyes of investors as the demand for having transparent, accountable operations has grown amongst them to protect their interests, investments too.
Problems in the business world, from time to time, further shape corporate governance practices. As previously written, the lack of corporate governance is value destroying. The 1997 East Asian Financial Crisis reflected on the institutional discrepancy of the institutions in the most affected Asian countries (Thailand, Indonesia, South Korea, Malaysia and the Philippines). At the beginning of the decade the bankruptcy of Enron and Worldcom put the corporate governance issues in limelight again (to be discussed later).
The current financial crisis also shows the im-portance of good corporate governance. It highlighted the lack of good corporate go-vernance where proper Risk Management sys-tems and remuneration guidelines at affected financial institutions were not properly matched and addressed. The instant lesson learned from this crisis for the OECD countries is to review again (after 2004) their corporate governance guidelines, policies. The standards of accounting and external regulations were also insufficient in these areas, and the risk taking, remuneration policies of certain companies, institutions we-re not in line with the long term interests. (Kirkpatrick, 2009)
The ultimate outcome of a good corporate governance system in general means a transparent and efficient institution/corporation which helps the development of the society and common good.
Also the lack of a well established corporate governance system can be felt on share prices of companies, as investors are willing to pay a premium for shares of a well governed company, the market is pricing any disfunctionalities which can be traced back to a bad corporate governance system. (Dallas, 2003) In its 'Global Investor Opinion Survey' of over 200 institutional investors undertaken in 2000 and a few years later again, McKinsey found that 80% of the respondents would pay a premium for well-governed companies. They defined a well-governed company as one that had mostly out-side (non-executive) directors, who had no management ties, undertook formal evaluation of its directors, and was responsive to investors' requests for information on governance issues. The size of the premium varied by market, from 11% for Canadian companies to around 40% for companies where the regulatory backdrop was least certain (those in Morocco, Egypt and Russia).
Although, it has to be mentioned that it cannot be said explicitly by which percentage are investors taking the corporate governance system of any company into account when pricing the fundamentals of the company, investing into it. It must be mentioned also that the corporate governance system is only one pillar in the building of corporate success, a competitive advantage, core competence, extreme expertise in the business of the company is also requisite for success. (Leuscher, 2006)

19
MOL Scientific MagazineSD & HSE special issue
1MOL GROUP
Main principles, controls of corporate governanceA good corporate governance system is honest, open, transparent, accountable and towards the owners of the company gives them an oversight. All these have to be manifested in the corporate governance documents of the companies. As these are very general comments on the major principles, these can be put explicit in the following (not complete) capitulation:
• Rights and equitable treatment of shareholders
• Interests of other stakeholders to be taken into account
• Role and responsibilities of the board must be set clearly, the mixture of executive/non-executive directors must be healthy to ensure real control
• Integrity and ethical behavior• Disclosure and transparency
Also clear policies must be developed for the following corporate governance related issues:
• selection procedure of independent auditor,
• risk management, • oversight of the preparation of the entity’s
financial statements, • dividend policy, • procedure for nominations of Board of
Directors, Supervisory Board, Audit Committee
• remuneration of the executive officers.
There are certain internal and/or external control methods for corporate governance systems. The before mentioned one-tier and two-tier system can be a good control process, monitoring system over the executive management; also healthy Board structure (proportion of executive, non-executive directors) as internal control mechanism. External controls, as seen from different managerial theories, include competition, debt covenants, government regulation, media pressure, takeover attempts or even the managerial labour market.
Sustainable development and corporate governanceThe connection of corporate governance issues and Sustainable development are multiple. The corporate governance system is one of the most important economical pillars of a company or institution operating in a given business-social environment.
Sustainable Development is connected corpo-rate governance as a good corporate go v-ernance system is essential for the control of any institution/corporation, and in this way it can ensure its long term successful performance, it eliminates the possibilities of fraud, corruption, blackmail, unethical behavior, etc. serving the good of stakeholders.
Corporate governance and Sustainable Devel op-ment cannot be viewed only as an internal policy or regulation package of a company. Based on the ideas of the stakeholder theory, the effects of a corporate governance system are felt not just among the primary stakeholders of the company, but as well as through the whole stakeholder map (with secondary stakeholders). Different metrics evolved in recent years for the measurement of SD performance, although we have to highlight these aren’t followed in a unified manner by all companies and have different meanings all over the world. Also they have currently a short history regarding reliability on performance of the companies. These performance measuring methods focus on the Natural Capital (energy usage, pollution, recyclability), Human Capital (Development, diversity and equal opportunity, workplace safety and relation), Social Capital (community engagement, corporate philosophy, costs/benefits to local economy) (Leuscher, 2006) and also on the economic dimensions of the company (risk Management, corporate governance, etc). The so-called ESG performance measuring is one of such. ESG reflects on the environmental, social and corporate governance performance of the companies.
The benchmarking, measuring of corporate governance as part of Sustainable Development is yet short lived, but more companies are taking part each year in such surveys on a voluntary

20
SD & HSE special issueMOL Scientific Magazine
1MOL GROUP
basis. As mentioned before these are just one part of every industries global participant, but the participants number is growing each year in the industries.
A N O T H E R C O N N E C T I O N O F C O R P O R A T E G O V E R N A N C E A N D S U S T A I N A B L E D E V E L O P M E N T
The beforehand mentioned approach to corporate governance is based on the assumption that a good corporate governance system of a company or institution is good for its performance, “development” in classic terms, thus helping to develop a sustainable operation of the company which is also in favor of other stakeholders.
If we approach corporate governance principles from the Sustainable Development side we can see, that it has now a majority part in the way a 21st century publicly traded company is governed, managed. The impact of various events, international agreements in the past (environmental movements, effects of en-viron mental catastrophes, Kyoto Protocol, demonstrations, etc) can be felt in the policy
making of the companies, corporate governance systems (e.g.: the establishment of MOL Groups Sustainable Development Committee of the Board of Directors can be seen as the mani-festation of Sustainable Development infiltrate into Mol Groups culture). Also the establishment of Investment Funds by companies dedicated to Sustainable Development, and the previously mentioned SD performance measurement/scoring systems can be seen as the SD being more and more part of corporate cultures.
The adoption of the following principles by the International Council on Mining & Minerals shows clearly the spreading of this view on global level (www.icmm.com):1. Implement and maintain ethical business
practices and sound systems of corporate governance.
2. Integrate sustainable development considerations within the corporate decision-making process.
3. Uphold fundamental human rights and respect cultures, customs and values in dealings with employees and others who are affected by our activities.
4. Implement risk management strategies
21
MOL Scientific MagazineSD & HSE special issue
1MOL GROUP
based on valid data and sound science. 5. Seek continual improvement of our health
and safety performance 6. Seek continual improvement of our
environmental performance 7. Contribute to conservation of biodiversity
and integrated approaches to land use planning
8. Facilitate and encourage responsible product design, use, re-use, recycling and disposal of our products
9. Contribute to the social, economic and institutional development of the communities in which we operate
10. Implement effective and transparent engagement, communication and independently verified reporting arrangements with our stakeholders
The 1st, 2nd and 4th principle are clearly issues which affect all the stakeholders, and must be set in the corporate governance System of the mining companies.
T H E E N R O N S C A N D A L A N D I T S C O N S E q U E N C E S
In the following paragraphs we would like to show a short case study about the importance of corporate governance systems, and the need for an effective legislation about related issues in any country’s legal environment.
The Enron scandal was a financial scandal involving Enron Corporation and its accounting firm Arthur Andersen, that was revealed in late 2001. Lack of proper control, mainly as a result of insufficient regulatory background backing the free-market system led to investors losing their money on Enron.
Enron was one of the most successful companies of all time. Success followed success at the energy trader company, which was highly backed by favorable regulatory framework also (as a result of strong lobbying power). Enron’s share price was soaring, the company looked unstoppable. Fortune magazine awarded Enron for five consecutive years with the “America’s most innovative company” title (www.lycos.com).
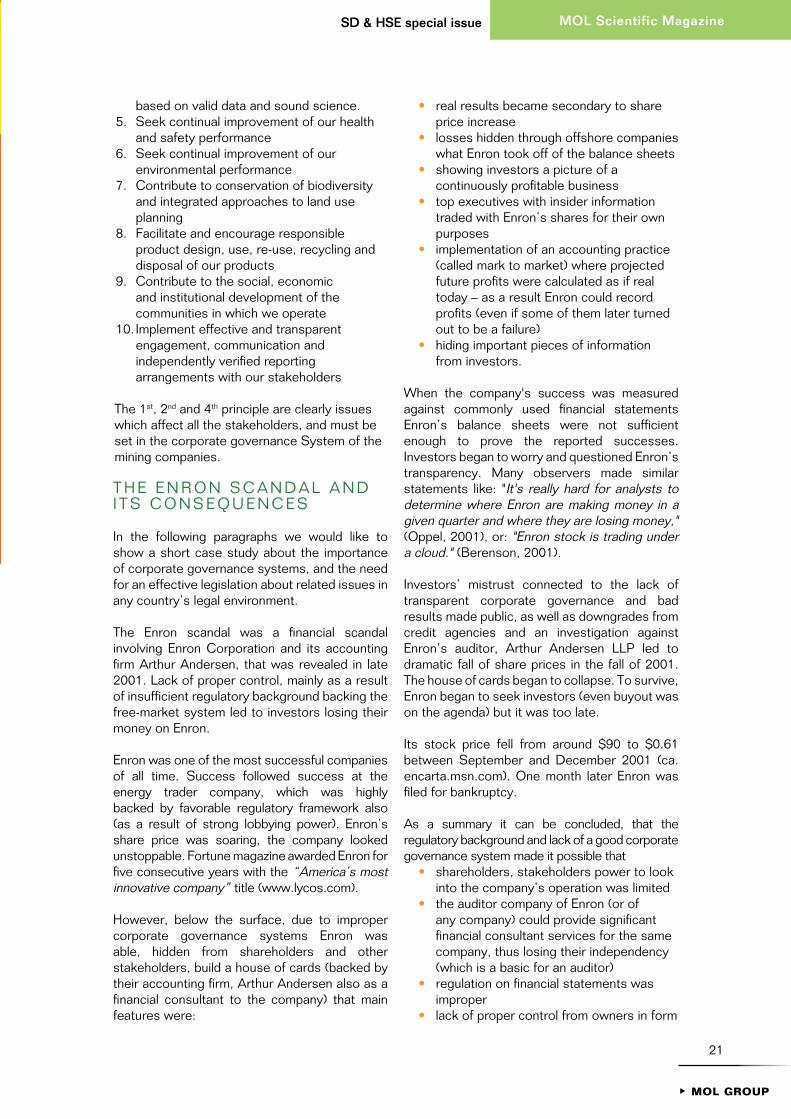
However, below the surface, due to improper corporate governance systems Enron was able, hidden from shareholders and other stakeholders, build a house of cards (backed by their accounting firm, Arthur Andersen also as a financial consultant to the company) that main features were:
• real results became secondary to share price increase
• losses hidden through offshore companies what Enron took off of the balance sheets
• showing investors a picture of a continuously profitable business
• top executives with insider information traded with Enron’s shares for their own purposes
• implementation of an accounting practice (called mark to market) where projected future profits were calculated as if real today – as a result Enron could record profits (even if some of them later turned out to be a failure)
• hiding important pieces of information from investors.
When the company's success was measured against commonly used financial statements Enron’s balance sheets were not sufficient enough to prove the reported successes. Investors began to worry and questioned Enron’s transparency. Many observers made similar statements like: "It's really hard for analysts to determine where Enron are making money in a given quarter and where they are losing money," (Oppel, 2001), or: "Enron stock is trading under a cloud." (Berenson, 2001).
Investors’ mistrust connected to the lack of transparent corporate governance and bad results made public, as well as downgrades from credit agencies and an investigation against Enron’s auditor, Arthur Andersen LLP led to dramatic fall of share prices in the fall of 2001. The house of cards began to collapse. To survive, Enron began to seek investors (even buyout was on the agenda) but it was too late.
Its stock price fell from around $90 to $0.61 between September and December 2001 (ca.encarta.msn.com). One month later Enron was filed for bankruptcy.
As a summary it can be concluded, that the regulatory background and lack of a good corporate governance system made it possible that
• shareholders, stakeholders power to look into the company’s operation was limited
• the auditor company of Enron (or of any company) could provide significant financial consultant services for the same company, thus losing their independency (which is a basic for an auditor)
• regulation on financial statements was improper
• lack of proper control from owners in form

22
SD & HSE special issueMOL Scientific Magazine
1MOL GROUP
of delegating non-executive directors to Board of Directors
• there was less emphasis on financial frauds and sanctioning connected consequences
T H E A F T E R M A T H O F T H E E N R O N C A S E
Securities law historian Joel S. Seligman was quoted in The Washington Post saying, "[t]his was the most important corporate scandal of our lifetimes. It was one of the immediate causes of the Sarbanes-Oxley Act, the governance reforms of the New York Stock Exchange…, and the most consequential reorientation of corporate behavior in living memory." (www.money.cnn.com)
The Sarbanes-Oxley Act (SOX) and OECD steps to improve corporate governance principlesEnron's collapse contributed to the creation of the U.S “The Public Company Accounting Reform and Investor Protection Act of 2002” or better known as the Sarbanes-Oxley Act or SOX (named after sponsors Senator Paul Sarbanes and Representative Michael G. Oxley). signed into law on July 30, 2002 and was taken over partly by other OECD’s countries (Organisation for Economic Co-operation and Development) into the Principles of Corporate Governance in 2004.
It was named by President George W. Bush when he signed it into law, "the most far-reaching reforms of American business practices since the time of Franklin D. Roosevelt” (The New York Times, 2002).
SOX contains 11 titles, or sections, ranging from additional Corporate Board of Directors responsibilities to criminal penalties. The most important of these eleven titles are: Auditor in-dependence, Corporate responsibility, Enhanced Financial, Analyst Conflicts of Interest, Corporate and Criminal Fraud, White Collar Crime Penalty Enhancement
T H E M A I N A R E A S O F T H E R E V I S E D O E C D C O R P O R A T E G O V E R N A N C E P R I N C I P L E S ( W W W . O E C D . O R G ) :
„I. Ensuring the basis for an effective corporate governance framework
The corporate governance framework should promote transparent and efficient markets, be consistent with the rule of law and clearly articulate the division of responsibilities among different supervisory, regulatory and enforcement authorities.
II. The rights of shareholders and key ownership functions
The corporate governance framework should protect and facilitate the exercise of shareholders’ rights.
III. The equitable treatment of shareholders
The corporate governance framework should ensure the equitable treatment of all share-holders, including minority and foreign shareholders. All shareholders should have the opportunity to obtain effective redress for violation of their rights.
Iv. The role of stakeholders in corporate gov ernance
The corporate governance framework should recognize the rights of stakeholders established by law or through mutual agreements and encourage active co-operation between corporations and stakeholders in creating wealth, jobs, and the sustainability of financially sound enterprises.
v. Disclosure and transparency
The corporate governance framework should ensure that timely and accurate disclosure is made on all material matters regarding the corporation, including the financial situation, performance, ownership, and governance of the company.
vI. The responsibilities of the board
The corporate governance framework should ensure the strategic guidance of the company, the effective monitoring of management by the board, and the board’s accountability to the company and the shareholders.”
23
MOL Scientific MagazineSD & HSE special issue
1MOL GROUP
Corporate governance in MOL GroupMOL Plc. (together with all MOL Group member companies) as an international operating company was and is committed and strive for being amongst the best achievers also regarding corporate governance practices. Without a well designed corporate governance system MOL could not have reached its current performance level.
MOL’s corporate governance system is continuously being developed to respond to the challenges resulted from becoming a more and more complex and international operating company; as well as to respond to the demands coming from stakeholders. MOL as a listed company on Budapest and Warsaw Stock Exchanges (BSE and WSE), regularly reports about its compliance with corporate governance Recommendations, which is regularly updated based on international expectations. The BSE report is published after its approval by the Annual General Meeting.
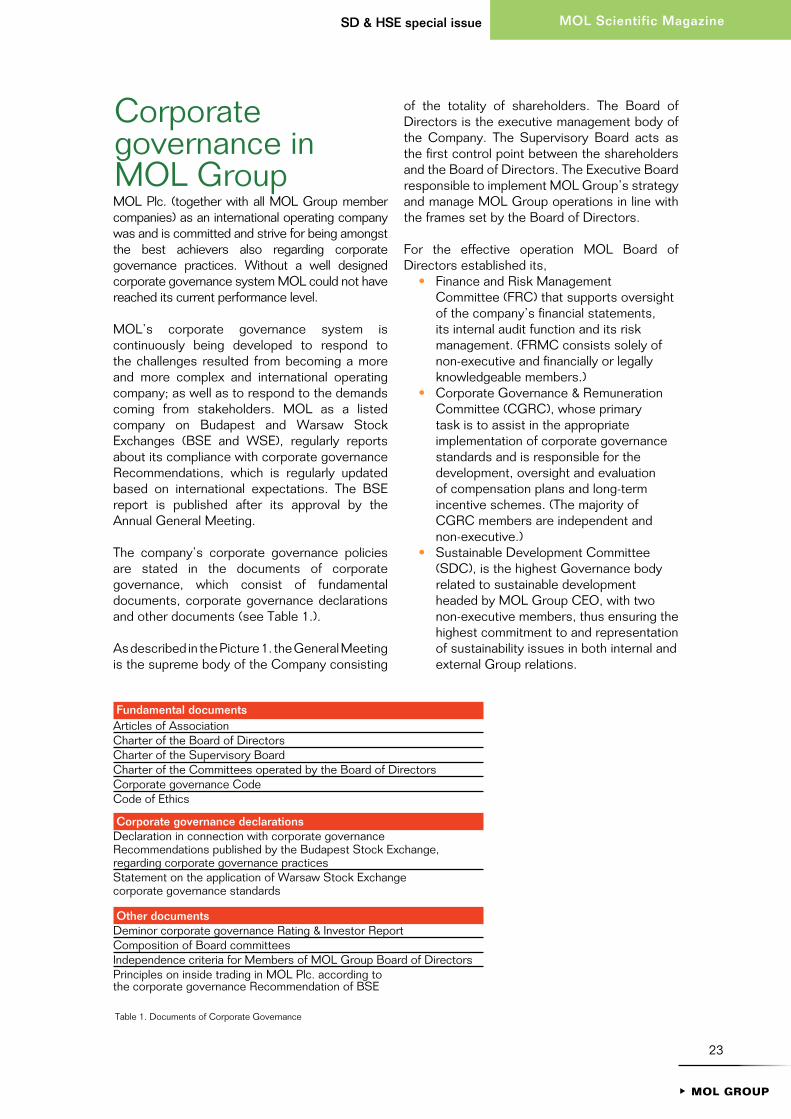
The company’s corporate governance policies are stated in the documents of corporate governance, which consist of fundamental documents, corporate governance declarations and other documents (see Table 1.).
As described in the Picture 1. the General Meeting is the supreme body of the Company consisting
of the totality of shareholders. The Board of Directors is the executive management body of the Company. The Supervisory Board acts as the first control point between the shareholders and the Board of Directors. The Executive Board responsible to implement MOL Group’s strategy and manage MOL Group operations in line with the frames set by the Board of Directors.
For the effective operation MOL Board of Directors established its,
• Finance and Risk Management Committee (FRC) that supports oversight of the company’s financial statements, its internal audit function and its risk management. (FRMC consists solely of non-executive and financially or legally knowledgeable members.)
• Corporate Governance & Remuneration Committee (CGRC), whose primary task is to assist in the appropriate implementation of corporate governance standards and is responsible for the development, oversight and evaluation of compensation plans and long-term incentive schemes. (The majority of CGRC members are independent and non-executive.)
• Sustainable Development Committee (SDC), is the highest Governance body related to sustainable development headed by MOL Group CEO, with two non-executive members, thus ensuring the highest commitment to and representation of sustainability issues in both internal and external Group relations.
Fundamental documentsArticles of Association Charter of the Board of Directors Charter of the Supervisory Board Charter of the Committees operated by the Board of Directors Corporate governance Code Code of Ethics
Corporate governance declarationsDeclaration in connection with corporate governance Recommendations published by the Budapest Stock Exchange, regarding corporate governance practices Statement on the application of Warsaw Stock Exchangecorporate governance standards
Other documentsDeminor corporate governance Rating & Investor Report Composition of Board committees Independence criteria for Members of MOL Group Board of Directors Principles on inside trading in MOL Plc. according to the corporate governance Recommendation of BSE
Table 1. Documents of Corporate Governance

24
SD & HSE special issueMOL Scientific Magazine
1MOL GROUP
The Supervisory Board (SB) monitors the Board of Directors’ activities on behalf of the shareholders and ensures that it carries out its duties with the outmost loyalty and due care. The majority of members are independent and not employed by MOL with the exception of employee representatives.
The Audit Committee (AC) complying of independent members of the Supervisory Board is mainly responsible for overseeing financial statements and selection of external auditor. It has to be noted that although the Audit committee complies of the independent members of the SB it is not subordinated to that.
MOL’s (MOL Group’s) corporate governance system is continuously being shaped to combine the requests of being transparent with the need of accountability on all levels and to serve the customers as well as with following a strong
financial and value oriented approach thus generating profit to the shareholders as well as to the Group to finance its strategic goals.
MOL Plc. Corporate governance performance is assessed yearly within the framework of the SAM sustainable development assessment. This assessment grades MOL since it is taking part in it with good rating compared to other oil industry participants who were assessed within the same framework.
The Board of Directors performance evaluation is also carried out regularly, as it can be seen in the Documents of corporate governance.
Revised by Tamás Csanálosi, Head of Support to the Board of Directors and Supervisory Board ([email protected])
General MeetingShareholders
Supervisory Board (9)
Chairman
Non-independentmembers
EmployeeRepresentatives
Independentmembers
Board of Directors (11)
Chairman
Non-executivedirectors
Executivedirectors
Committees
ChairmanFinance and Risk
Management Committee
SustainableDevelopmentCommittee
Corporate Governanceand Remuneration
Committee
Audit Committee
3 independent SupervisoryBoard members
Picture 1. MOL Plc. corporate governance system, based on Lukács, 2007
25
SD & HSE special issue
1MOL GROUP
MOL Scientific Magazine
AbstractIn 2008 MOL Group has introduced a product stewardship guidance formally requesting affiliates to apply the inter-nationally accepted requirements.The article focuses on the background of product stewardship, its birth and development. Lists the most im por tant governmental and chemical industry’s commitments in this field. Recalls the professional international associations’ related guiding principles. Underlines that introduction of product stewardship is a result of the change to life-cycle thinking, of the change in the management system and of the suppliers’ attitude shift.
ÖsszefoglalásA termékgondozás születése és fejlôdése
A MOL-csoportban 2008-ban beve ze tésre került útmutató formálisan is azt igényli a tagvállalatoktól, hogy alkal mazzák a nem-zetközileg elfogadott termék gon do zási köve telményeket. A közlemény a termékgondozás hátte-ré re, születésére és fejlôdésére össz-pon tosít. Felsorolja a témában lé te zô legfon tosabb kormány- és vegy ipari szintû elkö telezettségeket. Felidézi a nemzetközi rokon szakmai szer-ve zetek vonatkozó útmutató elveit. Kihangsúlyozza, hogy a termékgondozás bevezetése az élet cik lus-gondolkodásra
való átál lás nak, a menedzsment rend-szerek és a száll ítók magatartás-vál to-zásának a következménye.
IntroductionFollowing a series of environmental disasters, product stewardship is an initiative of the North-American chemical industry born in the middle of the ’80s; it is regarded as Responsible Care® applied to products. Its synonym, the Extended Product Responsibility (EPR) emerged in the Scandinavian countries in the late ’80s as they were facing severe landfill shortage. Their appearance is aimed at addressing public concerns about the manufacture, distribution, use and waste handling of chemicals and at achieving improvements in environmental, health and safety performance of products beyond levels required by legislation. Their introduction is a result of the change to the life-cycle thinking, furthermore, of the management systems’ and suppliers’ attitude’s change.
The 2002 Johannesburg World Summit on sustainable development gave a new impetus to the process through adopting a goal that by 2020 chemicals should be used and produced in a way that leads to minimize their effects on health and the environment. This led to a number of governmental initiatives (Marrakech Programme, Strategic Approach to International Chemicals Management) and industry commitments. Originally, most of the actions were voluntary initiatives of the industry later manifested in sectorial or regional standards and/or in governmental legislation. Thus, the European Union’s ‘command and control’ approach has resulted in strict regulations like REACH covering a large number of elements of product stewardship.
László Rácz Ret. Advisor MOL Group SD&HSEE-mail: [email protected]
productdevelopmentBirth and
of
stewardship

26
SD & HSE special issueMOL Scientific Magazine
1MOL GROUP

27
MOL Scientific MagazineSD & HSE special issue
1MOL GROUP
The article provides an insight into these developments with special regard to the product stewardship issue.
Chemical industry’s environmental disasters – Responsible Care®
By the mid-1980s, a series of environmental disasters around the world had increased public fears about chemicals and their by-products. Disasters like Bhopal became synonymous with the chemical industry that appeared careless and arrogant. As an aggressive and politically effective activist movement has stated the chemical industry seemed more concerned about profit and secrecy than about its employees, neighbours and customers.
The initiative of the responsible care (’go beyond what is required’) has been developed in North-America’s chemical industry. The initial response in Canada was to direct its immediate attention to the technical aspects (of the Bhopal incident), while the Chemical Manufacturers Association of the USA (its new name from 2000 is American Chemical Council, ACC) focused more on public concerns.
Responsible care as an expression seems to be appeared first in July 1981 in a report of B. Boldt, Dow Canada vice-president and chair of the Canadian Chemical Producers’ Association (CCPA) Technical Management Committee (TMC) („Responsible care in the Canadian Chemical Industry”). That time the paper concentrated on the Dow Chemical’s principle of ’operating discipline’, i.e. ’discipline yourself to operate the plants the way that they were designed to be operated’. It wasn’t until 1983 that the responsible care guiding principles surfaced in any formal sense when at the request of the Canadian federal government a special petrochemical industry task force of CCPA has included the guiding principles of responsible care in the report to the government (sawing the industry as responsible in the way it manages its HSE obligations, in addition to its economic role). This policy statement has been signed by all CCPA members by April 1984.
In December 1984 ’the unthinkable has happened’ in Bhopal Union Carbide plant. In
December, CCPA TMC has set up a special task force under DuPont leadership to develop a safety audit system both for the plant and for its interface with the community. The task force has produced a document titled ’Safety assessment process’ (note, it is an assessment and not an audit, due to industrial confidentiality issues). Mr Jean Bélanger, the CCPA president urged to emphasize proactivity behind each of the ’guiding principle’ elements, with particular emphasis on ‘product stewardship’. They developed a community awareness and emergency response code similar to that implemented in the USA in 1985.
Thus, the chemical industry’s voluntary initiative Responsible Care® was first conceived in Canada in 1985. Under Responsible Care® the chemical industry is committed to continuous improvement in all aspects of health, safety and environmental performance and to open communication on its activities and achievements. It achieves this objective by meeting and going beyond legislative and regulatory compliance, and by adopting cooperative and voluntary initiatives with government and other stakeholders.
Presently, the CCPA’s member companies have to accept the Responsible care ’Ethic and six guiding principles’ as well as ’the six codes of practice’ (commitments). The Ethic is a moral code of conduct, it means doing the right thing, confirming to accepted standards of professional conduct, stating the following guiding principles:
„We are committed to do the right thing and be seen to do the right thing. We are guided towards environmental, societal, and economic sustainability by the following principles:
• We are stewards of our products and services during their life-cycles in order to protect people and the environment.
• We are accountable to the public, who have the right to understand the risks and benefits of what we do and to have their input heard.
• We respect all people. • We work together to improve
continuously. • We work for effective laws and standards,
and will meet or exceed them in letter and spirit.
• We inspire others to commit themselves to the principles of Responsible Care.”
The CCPA’s codes govern the way a member company operates within its community, and
28
SD & HSE special issueMOL Scientific Magazine
1MOL GROUP
contain over 150 requirements that control each step in a chemical’s life-cycle. Compliance is independently monitored and verified. The six codes of practice are the following:
• Community awareness and emergency response (CAER) code
• Research and development code • Manufacturing code• Transportation code • Distribution code • Hazardous waste management code [1].
Additionally, in 2001 the ACC adopted the responsible care security code, an aggressive plan to further enhance security of facilities, communities and products. The code addresses facility, cyber and transportation security and requires companies to conduct comprehensive security vulnerability assessments (SVAs) of their facilities, implement security enhancements, and obtain independent verification that those enhancements have been made. The code also requires companies to create security management systems, which are documented to provide quality control and assurances. Participation in responsible care (thus measuring and publicly reporting performance, implementing the security code under a strict timeline, applying the modern responsible care management system and obtaining independent certification that a management system is in place and functions according to professional standards) is mandatory for ACC members, all of which made CEO-level commitments [2].
In 2002, the ACC adopted a new management system approach for the implementing responsible care in the USA, incl. mandatory independent third-party verification [2].
Even now, the failure to follow procedures, a moment of distraction would lead to tragic consequences. In April 2004, US Public Interest Research Group (PIRG) issued a report that documented through statistics the failure of ACC’s responsible care voluntary initiative („Irresponsible care: the failure of the chemical industry to protect the public from chemical incidents”). They underlined that big companies (BP, Dow and DuPont) had the most accidents at their facilities in 1990 and they were responsible for nearly one third (32.7%) of all the accidents at ACC member facilities in the period of 1990 to 2003. As they stated the voluntary precautions of ’Responsible Care’ are not enough to protect Americans from accidental chemical releases or the possibility of terrorist attacks. Instead, all chemical facilities should be required to meet
mandatory federal standards for security. Most importantly, new federal standards must focus on reducing or eliminating the possibility of accidents and attacks through the use of safer chemicals and processes [3].
Now, the International Council of Chemical Association (ICCA) (with the membership of HU and SK) acts as the guardian of responsible care and manages it at the global level.
Since 1988, USA and other chemical companies and associations joined the initiative and it become a unique ’ethic’ and commitment for the safe and environmentally sound management of chemicals in more than 50 countries (incl. HU and SK) around the world. Each national association is responsible for developing and running its own national programme with its member companies, and for overseeing implementation of responsible care by those companies. Some associations require all member companies to sign on to responsible care, others do not. There are further variations between the national responsible care programmes in order to suit national legislation, work practices and cultural situations, for example.
Johannesburg World Summit on Sustainable Development, 2002 – minimize HSE-effects of chemicals by 2020An Intergovernmental Forum on Chemicals Safety (IFCS) has been set up after the 1992 Earth Summit (Rio de Janeiro) to take forward recommendations in Chapter 19 of Agenda 21 on sound chemical management. One of its recommendations was to relaunch a strategic approach with a goal of governments and others to achieve the safe use of chemicals. The September 2002 World Summit on Sustainable Development called for the development of „a 10-year framework of programmes in support of regional and national initiatives to accelerate the shift towards sustainable consumption and production”. Thus, countries adopted a goal that by 2020 chemicals will be used and produced in a

29
MOL Scientific MagazineSD & HSE special issue
1MOL GROUP
way that lead to minimization of significant effects of human health and the environment based on sound risk assessment and risk management, following the precautionary approach.
As a consequence, two governmental initiatives were developed in parallel by UNEP (United Nations Environmental Programme): the Marrakech Process and the Strategic Approach to International Chemical Management (SAICM). In addition to that, the chemical industry made public commitments and introduced programmes to enhance chemical safety throughout the value chain: these are the responsible care global charter, the global product strategy, the long-range research initiative, the high production volume chemicals programme and the SusChem.
G O V E R N M E N T A L I N I T I A T I V E S : T H E M A R R A K E C H P R O C E S S
The Marrakech Process was launched in Marrakech (Marocco), in June 2003, with a global aim at supporting regional and national initiatives to promote the shift towards Sustainable Consumption and Production (SCP) patterns. The Marrakech process calls for a plan of developing the 10-Year Framework of programmes on sustainable Consumption and Production (10YFCP).
In the EU the Marrakech process led to a renewed European Sustainable Development Strategy and to the development of an EU Sustainable Consumption and Production (SCP) action plan.
The aims of the EU Sustainable Consumption and Production (SCP) action plan are:
• Improving the way we produce• Improving the design of products available
on the market• Improving the way we consume.
SCP aims to „promote sustainable consumption and production by addressing social and economic development within the carrying capacity of ecosystems and decoupling economic growth from environmental degradation”. The two building blocks of the SCP action plan are the Integrated Product Policy (IPP) and Green Public Procurement (GPP).
Integrated product policy (IPP) might be better termed 'environmental product policy'. It is an attempt by the European Commission to create conditions in which environment-friendly
products, or those with a reduced impact on the environment, will gain widespread acceptance among the European Union's member states and consumers.
The IPP, when it emerges, will have a dual role. On the one hand it will provide a framework in which member states, local authorities, businesses and non-governmental organizations can adopt green product policies. On the other, it will lead to specific EU-wide policy initiatives designed to foster green consumerism. The Commission’s IPP Communication has been adopted in June 2003 [4].
GPP means that ’public purchasers take account of environmental factors when buying products and services’. In July 2008 the Commission presented a proposal to set ambitious targets for green public procurement linked to common green procurement criteria. Main actions in the frame of GPP:
• Determination of the extent of greener public procurement in the EU (a report has been published in 2003)
• Encouragement of the Member States to develop by the end of 2006 publicly available action plans for greening their public procurement (national action plans)
• Elaboration of information measures for public authorities (practical handbook for public authorities, product group database, GPP website).
In the European Union, the Marrakech process initiated the following key programmes and initiatives: thematic strategy on sustainable use of natural resources, green public procurement, integrated product policy, environmental technology action plan, eco-management and audit scheme and eco-label scheme.
G O V E R N M E N T A L I N I T I A T I V E S : T H E S T R A T E G I C A P P R O A C H T O I N T E R N A T I O N A L C H E M I C A L M A N A G E M E N T ( S A I C M )
SAICM is a non-binding agreement launched in 2003 and adopted by more than 100 countries in the world. It is aimed to achieve the sound management of chemicals throughout their life-cycle so that, by 2020, chemicals are used and produced in ways that lead to the minimization of significant adverse effects on human health and the environment. The objective is to be achieved, among other ways, through the implementation of activities set out in the global plan of actions

30
SD & HSE special issueMOL Scientific Magazine
1MOL GROUP
with the following elements: risk reduction, knowledge and information, governance, capacity-building and technical cooperation, and elimination of illegal international traffic [5]. Today, IFCS contributes to the implementation of SAICM.
The European Union’s main historical con-tributions to SAICM, though not necessarily designed as such, are REACH, GHS and three conventions (Basel, Rotterdam and Stockholm). Additionally, it is worth mentioning that the OECD guidance on safety performance indicators (SPI), issued in 2003 for industry, public au-thorities and communities for developing SPI programmes related to chemical accident pre-vention, preparedness and response contains product stewardship indicators (a checklist) to help ensure the safe management of hazardous substances throughout their life-cycle [6].
C H E M I C A L I N D U S T R Y C O M M I T M E N T S – T H E R E S P O N S I B L E C A R E ® G L O B A L C H A R T E R A N D T H E G L O B A L P R O D U C T S T R A T E G Y
After the 2002 World Summit on Sustainable Development following an update and revitalizing, in February 2006, the ICCA launched the Responsible Care® Global Charter and additionally, the Global Product Strategy.
The Responsible Care® Global Charter creates a common global vision for Responsible Care and offers the opportunity to achieve greater harmonization and consistency among the national programmes currently implemented. The Responsible Care® Global Charter goes beyond the original elements of the 1985 responsible care guidance, extends the process of continuous improvement beyond chemicals manufacturing to other activities, especially those associated with the safe use and handling of products along the value chain. It contains the following nine key elements:1. Adopt global responsible care core
principles (continuously improve; use resources efficiently; report openly; listen, engage and work with people; cooperate with governments and organizations; provide help and advice).
2. Implement fundamental features of national responsible care programmes (establish and implement guiding principles; adopt a title and logo; implement management practices, develop a set of performance indicators;
communicate with interested parties; share best practices; encourage others to commit to responsible care; introduce and apply systematic approach to verify).
3. Commit to advancing sustainable development.
4. Continuously improve and report performance (periodically assess; commit to providing technical help; adopt a management systems approach to implement responsible care commitments; utilize clean and safe technologies; go beyond self-assessment of the implementation of responsible care).
5. Enhance the management of chemical products worldwide – product stewardship (re-commit to full implementation of responsible care product stewardship commitments; improve product stewardship performance and increase public awareness; encourage and sustain support for education, research and testing approaches; implement enhanced product stewardship commitments and periodically assess practices).
6. Champion and facilitate the extension of responsible care along the chemical industry’s value chain.
7. Actively support national and global responsible care governance processes.
8. Address stakeholder expectations about chemical industry activities and products.
9. Provide appropriate resources to effectively implement responsible care [7].
The ICCA Global Product Strategy (GPS) incorporates two key elements of the Responsible Care® Global Charter. It is designed to improve the global chemical industry’s product stewardship performance by recommending measures to be taken by the companies, working together with their chemical associations, and in cooperation with activities of other companies and associations along the chemical value chain.
Its key components are:1. Develop global guidelines for product
stewardship.2. Develop a product stewardship
management system approach.3. Define a tiered process for completing risk
characterizations and risk management recommendations for chemicals in commerce.
4. Improve product stewardship cooperation with industry groups and companies and address product challenges throughout the chemicals value chain.

31
MOL Scientific MagazineSD & HSE special issue
1MOL GROUP
5. Develop partnerships with inter-governmental organizations and other interested stakeholders.
6. Make risk characterization and relevant product stewardship information available to the public.
7. Participate in scientific inquiry to address new and emerging health and environmental concerns.
8. Develop a process to communicate internally and externally.
9. Develop global advocacy principles to promote consistency of chemical regulatory systems across geographies [7].
ICCA developed comprehensive product steward-ship guidelines for the industry and downstream users [8].
C H E M I C A L I N D U S T R Y C O M M I T M E N T S – L O N G -R A N G E R E S E A R C H I N I T I A T I V E ( L R I )
LRI has been launched in 1999 by ACC with the goals:1. Increase the knowledge of the potential
impacts that chemicals may have on the health of humans, wild-life and the environment;
2. Ensure informed decision-making; and3. Improve public confidence with decisions
based on a scientific understanding of risk.
This is done through the sponsoring of inde-pendent, high-quality research on the interaction between chemicals, health and the environment. Results are published and shared freely with the public, regulators, industry, and academic and government community. The renewed research programme focuses on high priority topics such as human bio-monitoring, endocrine disruption, persistent, bio-accumulative and toxic substances (PBTs), the development of intelligent testing strategies as alternatives for animal testing, and the acceptance of new products and technologies.
The conduct of the LRI is governed by the following principles: scientific excellence, open process, results and action, fair and unbiased conduct and chemical industry relevance.
LRI has been also adopted by CEFIC and JCIA (Japan Chemical Industry Association). ACC, CEFIC and JCIA with independent scientists undertook a State of the Science (STOTS) study related to the potential impact of chemicals on
health and the environment. The first STOTSs were published in 1998 and some were reviewed later (in 2001).
C H E M I C A L I N D U S T R Y C O M M I T M E N T S – H I G H P R O D U C T I O N V O L U M E ( H P V ) C H E M I C A L S P R O G R A M M E
In 1998, the ICCA established a goal to deliver to the OECD initially by 2005 completed information data sets (named Screening Information Data Sets, SIDSs) for 1 000 global High Production Volume (HPV) chemicals, representing more than 90% of global chemicals production. Under the US extended HPV programme companies will provide by 2010 use and exposure information on all US HPV chemicals, as well as screening-level hazard information. Under the Japanese Challenge Programme, in a partnership between industry and government, companies will provide hazard data and available exposure information on HPV chemicals which are not addressed by other international or regional programmes. Under the European Union’s REACH regulation, companies are required to provide hazard data, use and exposure information, conduct risk assessments and take risk mitigation measures for chemicals in commerce or imported into the European Union by deadlines depending on their hazard and volumes [7]. Now, the demands placed on company resources by REACH in the European Union have limited industry’s ability to move more rapidly on its HPV commitments.
As of 30 June 2008 1,201 (43%) of the 2,782 HPV challenge core list chemicals has final data sets, incl. Screening Information data sheet Initial Assessment Report (SIAR): 760 chems in final US submissions plus 9 US chems and 273 ICCA chems and 159 OECD chems. Another 522 (19%) have test plan or posted SIARs only, 429 (15%) are exempted or removed, 356 (13%) have no test plan or SIAR and 274 (10%) are unsponsored orphans [9]. In December 2008 the head of the US Environmental Protection Agency (EPA) and Canadian and Mexican Environment Ministers signed a 'statement of intent' on North American chemicals cooperation, affirming the commitment made by the countries' heads earlier. The statement includes approval of a Framework for Regulatory Cooperation in the Area of Chemicals which says all three countries will strive to establish and update chemical inventories by 2020. Despite a decade of effort under the HPV Challenge, final data sets have yet to be submitted for nearly half of the chemicals sponsored, and remaining gaps have

32
SD & HSE special issueMOL Scientific Magazine
1MOL GROUP
been identified in at least a third of those data sets that have been submitted.
C H E M I C A L I N D U S T R Y C O M M I T M E N T S – S U S C H E M
The European Technology Platform for Sustain-able Chemistry (ETP SusChem) initiated in 2004 brings together a wide spectrum of organizations and individuals looking to boost sustainable chemistry, research, development and innovation in Europe. Three technology sections coordinate activities in the defined key technology areas: industrial biotechnology, materials technology and reaction and process design.
The SusChem’s Strategic Research Action Plan (SRA) focuses on three projects. The Smart Energy House, SHE project wants to demonstrate the individual achievements in energy conservation in a real house with intelligent energy supply. The Integrated Biorefinery project aims at producing chemicals and energy from biofeedstock through biological processes. The F3 Factory (Faster and more Flexible Future production) project intends to produce chemicals and intermediates in processes with minimal environmental impact and applicable to fast changes in the production slate.
General waste handling shortages – Extended Product Responsibility The major impetus for Extended Product Responsibility (EPR) came from northern European countries in the late 1980s and early 1990s, as they were facing severe landfill shortage. As a result, EPR is generally applied to post-consumer wastes which place increasing physical and financial demands on municipal waste management.
According to an OECD 2001 definition, EPR is an environmental policy approach in which a producer’s responsibility, physical and/or financial, for a product is extended to the post-consumer stage of a product life-cycle. Thus, EPR is generally described as a pollution prevention policy that focuses on product systems rather than product facilities. Its goals
are cleaner production and waste prevention. The most efficient and effective point at which to reduce waste and encourage reuse, reduction and recycling, is at the product development stage. It is at that point in the product’s life-cycle that decisions can be made to minimize the environmental impact of the product. This would be one reason why EPR is used as a synonym of product stewardship by the US Environmental Protection Agency (the other one is the EPA’s product stewardship programme has primarily focuses on end-of-life considerations as a means of driving environmentally conscious design and resource conservation) [10]. Notwithstanding ICCA’s global product stewardship guideline, EPR covers not only chemicals, but full range of products.
The first EPR programme, the German Packaging Ordinance in 1991 shifted responsibility for packaging waste to industry. Later, progressive expansion of EPR took place from packaging to other products (batteries, electronics, refrigerants, tires, appliances, end of life vehicles, paint). OECD has started work on EPR in 1995 and its guidance manual has been published in 2001. The EU electronics directive (WEEE, RoHS) issued in January 2003 mandates EPR, and sets toxic substance limits (its implementation started in 2006). EPR is spreading through Canada, Europe, Asia, the USA and Americas.
EPR is based on ’the polluter pays’ principle. EPR internalizes the external (pollution, disposal etc.) costs by shifting responsibility for product and packaging waste from government and taxpayers to producers and consumers. Some EPR instruments are in use today, e.g. deposit refund systems (return the product or package), targeted product taxes (for influencing the choice of materials used), advanced disposal fees (also for influencing the choice of materials used and for fund-generation) [11].
Extended producer responsibility is listed among the general requirements of directive 2008/98/EC of the European Parliament and of the Council of 19 November 2008 on waste. According to the directive, in order to strengthen the re-use and the prevention, recycling and other recovery of waste, member states may take legislative or non-legislative measures to ensure that any person who professionally develops, manufactures, processes, treats, sells or imports products has extended producer responsibility. Such measures may include an acceptance of returned products and of the waste that remains after those products have been used, as well as

33
MOL Scientific MagazineSD & HSE special issue
1MOL GROUP
subsequent management of the waste and financial responsibility for such activity. The measures may include the obligation to provide publicly available information as to the extent to which the product is re-usable and recyclable. Member states may take appropriate measures to encourage the design of products in order to reduce their environmental impacts and the generation of waste in the course of the production and subsequent use of products and in order to ensure the recovery and disposal of products [12].
Responsible care and product stewardship in selected associations The European Chemical Industry Council (CEFIC) has set up fundamental features and Core guiding principles of responsible care. Each national chemical association establishes and manages its own national responsible care programme based on a set of eight common fundamental features, one of which requires the association to establish and implement a set of guiding principles for member companies to sign. CEFIC ’vision’ for responsible care performance contains the following:
• No harm to employees, contractors and the general public from the operators.
• No adverse environmental or public impact resulting from the operation of the plants or in the distribution of the products.
• Continuous improvement in the efficient use of the planet’s resources.
• Provision of products meeting customer requirements that can be manufactured, transported, used and disposed safely.
• The chemical industry is accepted as an open, honest and credible industry by all its stakeholders and the general public.
• General and public recognition that the chemical industry is a responsible industry playing an important role in bringing a wide range of benefits to society.
Accurate reporting of performance is at the heart of responsible care. Each chemical company that implements responsible care is expected to collect and report data for a core set of environmental, health and safety performance
measures. Each national association is expected to collect, collate and report these data from its members in each country. The data are collated and reported publicly on behalf of Europe’s chemical industry at CEFIC level, and at international level by the ICCA.
CEFIC updated its Responsible Care HSE Reporting Guidelines in 2006 to ensure that the pan-European indicators of performance continue to be relevant to issues perceived as important by governmental bodies, legislators, pressure groups and other external stakeholders.
The American Petroleum Institute (API) (USA) supports the oil and gas industry in its commitment to a shared responsibility for the industry’s HSE performance. An integral part of API’s product stewardship programme is API sponsored research with elements of children’s health initiative (establishment of databases relevant to children), HPV chemical challenge programme (see above) and strategic health research (of hydrogen sulphide and benzene) [13].
The worldwide Oil and Gas Producers Association’s (OGP) and the European Petroleum Industry Association’s (EUROPIA) ordinary members (and among them MOL) shall sign the following environmental guiding principles [14-15]. This text below recalls the main elements of the responsible care guiding principles.
" E N V I R O N M E N T A L G U I D I N G P R I N C I P L E S
Preamble… EUROPIA, and … OGP, with interests in Europe, fully recognise the need to respond to the concerns of the community as a whole about living and working in a safe and healthy environment. They have dedicated continuous efforts to minimize risks to the environment and to supply high quality products and services safely, economically and efficiently. … They consider therefore that they must define and carry out voluntary measures, precautions, responsible care programmes or whatever actions they may deem necessary to protect the environment insofar as these are reasonably practicable. Within this framework, they pledge themselves to manage their businesses according to the following Guiding Principles:1. Make the principles set forth herein a high
priority in the definition and implementation of corporate strategies.
2. Adapt where necessary internal procedures, industry practices and other operating

34
SD & HSE special issueMOL Scientific Magazine
1MOL GROUP
guidelines towards the goal of protecting the environment and the health and safety of individuals.
3. Conduct operations and handle raw materials and products in a manner that protects the environment and the health and safety of employees and the public, while conserving natural resources and using energy efficiently.
4. Develop and maintain procedures to reduce the risk of spills or accidental emissions, maintain appropriate emergency response procedures in case of accidents.
5. Develop programmes to reduce overall emissions and waste generation.
6. Ensure that adequate waste management programmes are developed and carried out, which will allow the disposal of wastes as safely as is reasonably practicable.
7. Work with others to resolve problems arising out of the handling and disposal of hazardous substances from members' operations.
8. Provide advice to customers, contractors or others on the safe use, handling, transportation and disposal of raw materials, products and wastes from members' operations.
9. Inform appropriate officials, employees, customers, and the public in a timely manner on significant industry-related safety, health and environmental hazards, and recommend protective measures.
10. Support research and development programmes to study the effects of the industry's activities on the environment, the health and safety of individuals and the prevention of the risks connected hereto.
11. Promote among employees an individual and collective sense of responsibility for the preservation of the environment and protection of health and safety of individuals.
12. Work and consult with authorities drafting laws, regulations or procedures to safeguard the community, workplace and environment.
13. Promote these principles and practices by sharing experiences and offering technical assistance to others who deal with similar raw materials, petroleum products and wastes.”
The International Petroleum Industry Environmental Conservation Association (IPIECA) established in 1974 (following the establishment of the United Nations Environment Programme (UNEP)) is the single global association representing both the upstream and downstream oil and gas industry on key global environmental and social issues. Its vision and membership commitment contain elements of responsible care, like
• Developing, sharing and promoting sound practices and solutions
• Enhancing and communicating knowledge and understanding
• Engaging members and others in the industry
• Working in partnership with key stakeholders [16].
The European Lubricating Grease Institute (ELGI) (Amsterdam) established in 1989 in its Constitution has set up objectives
• to promote the understanding and to facilitate the exchange of information concerning manufacture and use, handling and selling lubricating grease between organizations and individuals;
• the promotion of research and development; and
• to co-operate with other organizations [17].
Old ethic new ethicDo the minimum the law requires Do the right thingLow profile Be seen as doing the right thing Limit production obligations Life-cycle stewardshipDownplay public concerns Seek and address public concernsRisk information only if necessary Public and employees’ right to know all risksEvery company for itself Mutual aid
Table 1. Ethic shift connected to the introduction of product stewardship [18]
35
MOL Scientific MagazineSD & HSE special issue
1MOL GROUP
EpiloqueProduct stewardship is responsible care applied to products. Its introduction is a result of the change to life-cycle thinking, of the change in the management system and of the suppliers’ attitude changing. The first two elements were already touched upon, the last element may need further clarification.
Attitude change can be described as an ethic shift with the following content [18] (see Table 1).
This new attitude is based on the two thousand years old golden rule: ’Do unto others as you would have them do unto you’ [19]; and your care results in growth.
References [1] http://www.ccpa.ca/ResponsibleCare/ [2] http://www.americanchemistry.com/ [3] http://uspirg.org/uspirg.
asp?id2=12860&id3=USPIRG& [4] http://www.bsdglobal.com/issues/ipp.
asp
[5] http://www.chem.unep.ch/saicm/ [6] http://www2.oecd.org/safetyindicators/ [7] http://www.icca-chem.org/ [8] http://www.icca-chem.org/pdf/
guidelines.pdf [9] http://www.edf.org/documents/2734_
WelcomeTracker.htm [10] http://www.epa.gov/ [11] http://www.grrn.org/resources/ [12] Directive 2008/98/EC of the European
Parliament and of the Council of 19 November 2008 on waste and repealing certain directives. OJ L 312, 22.11.2008, p. 3.
[13] http://www.api.org/ehs/health/prodstewardship/index.cfm
[14] http://www.ogp.org.uk; [15] http://europia.be [16] http://www.ipieca.org/ [17] http://www.elgi.org [18] Jacques Busson: Product Stewardship.
TAIEX presentation. Tatranska Lomnica 17 June 2003
[19] Matthew 7:12
Revised by Dr Gyula Kortvelyessy

36
1MOL GROUP
AbstractThe goal of this article is to introduce the MOL Group business optimization process and its supporter tool PIMS (Process Industry Modeling System) modeling and optimizing program package. PIMS is an efficient aid in the group level planning and business optimization of the supply chain for MOL Group Downstream. This software is the most widely used one in the oil industry. We have presented how the supplies to the markets can be optimized, how PIMS can be of assistance to us in project economics studies, how production plan, inter-refinery transfer plan and inventory plan can be prepared, and how we can used it for price sensitivity studies and in many other applications.It is essential that Downstream has been integrated into one single model, and now we are able to define the complete business optimum for Downstream. This means that the optimum feedstock purchases, the transfers between production units, details of the processing, production, blending structures and various materials, the stockpiling or distribution quantities, the marketing quantities, and the associated variable costs and prices can all be obtained from one single PIMS result. All this information is available by refineries.We are convinced that optimization is
an efficient tool to support in achieving our strategic and business targets. We improve our optimization and planning methods continuously to exploit better and better our opportunities in the future.
ÖsszefoglalásA cikk célja megismertetni az olvasót a MOL Csoport üzleti optimalizálásának folyamatával és az azt támogató szoftver eszközzel, a PIMS (Process Industry Modeling System) modellezô és optimalizáló programcsomaggal. A PIMS hatékony segédeszköze a MOL Csoport Downstream ellátási lánc csoportszintû tervezésének és üzleti optimalizálásának. Ez a szoftver a legelterjedtebb az olajiparban. Bemutattuk, hogyan optimalizálható a piacok ellátása, hogy lehet a PIMS beruházás gazdaságossági vizsgálatokban a segítségünkre, miként készíthetô termelési terv, finomítók közötti transzfer terv és készletterv, végezhetünk vele árérzékenység vizsgálatokat és még számos más területen alkalmazható. Lényeges, hogy a Downstream-et egyetlen modellbe integráltuk és így képesek vagyunk a tejes Downstream üzleti optimumát meghatározni. Ez azt jelenti, hogy egyetlen PIMS eredménybôl kinyerhetôk az optimális alapanyag beszerzések, a termelô egységek közötti transzferek, a feldolgozási, termelési, keverési struktúrák és a különféle anyagok minôségi adatai, a készletezési, szállítási mennyiségek, az értékesítési mennyiségek és ezekhez kapcsolódó változó költségek és árak. Ezek
Mészöly Csaba (44)Long Term Planning SCM DSokl. szervezô vegyészmérnök, mérnök-közgazdászMOL Csop./Termékelôállítás és Kereskedelem Divízió/SCM/Hosszú távú Tervezés
SD & HSE special issueSzakmai Tudományos Közlemények
REQUIREDBeyond what is

37
SD & HSE special issue
1MOL GROUP
MOL Scientific Magazine
AbstractThe article wants to envisage the im-portance of renewables starting from the climate change issue through the supply security, to the depleting of fossils. The respond of the EU committee and the USA is also highlighted focusing on the renewable policies including both “heat and power” and fuel segments. In the second part, there is an overview of the different renewable technologies and the renewable businesses of some pacesetter companies, including oil supermajors. At the end we tried to project a future technological break-through that will be necessary for a sustainable life.
ÖsszefoglalásOtt a helyünk az elsôk között – kihívások a megújuló energiák terén
A cikk célja a megújuló energiág fon-tosságának bemutatása a klíma vál to-zás kérdésétôl az energia biz ton ságon keresztül és a fosszilis energiatartalékok kimerülése által. Bemutatásra kerülnek az USA és az Európai Unió válaszlépései is, mind a hô és áramtermelés, mind pedig az üzemanyagokkal kapcsolatos
irányelvek és szabályozások terén. A cikk második felében áttekintjük a különbözô energiagfajtákat, azok technológiai hát-terét, megvalósíthatóságát, valamint a néhány nagyobb energiavállalat ezi-rá nyú tevékenységét. Végül egy jövô-beli technológiai áttörést helyezünk kilátásba, ami a bolygónk hosszú távú fenntarthatóságának elengedhetetlen felté tele lesz.
Introductionmonth of the year abundant inventories in One of the hottest issue of the 21st century is the world energy supply. The global energy demand has a significant growth even in the OECD countries, while in the emerging countries the demand growth is proposed to be much bigger. According to the latest International Energy Agency (IEA) outlook, if there will be no new government policies beyond those already adopted by mid-2008, world primary energy demand expands by 45% between 2006 and 2030 – an average rate of growth of 1.6% per year. China and India will account for over half of incremental energy demand to 2030.[1] These countries use coal as a main energy source. The Middle East emerges as a major new demand centre, contributing a further 11% to incremental world demand.
Meanwhile lots of countries have high de-pen dence on foreign energy sources that makes them politically and economically highly exposured. During the recent gas crisis, some countries had serious daily problems after just a couple of days of gas shortage.
In the nowadays structure most of the energy demand is fulfilled by fossil sources, mainly coal and hydrocarbons for energy supply.
István PócsBusiness Development expertMOL Group Supply and Trading DivisionE-mail: [email protected]
Iván KatonaUpstream HSE advisorMOL Group Strategy DevelopmentE-mail: [email protected]
Be among theFirstsor Dropped behind
– The Renewable Challenge

38
SD & HSE special issueMOL Scientific Magazine
1MOL GROUP
The known fossil energy sources are limited. There are year by year new theories about the total amounts to be discovered. For oil there are estimations for resources for 40, 60 or 80 years. Regarding natural gas it can be more then 100 years, or in case of coal even several hundreds. But continuing our existing energy usage all sources will be over in a certain period. We burn all resources in 300 years that accumulated in the past several millions.
Climate changeBurning fossil energy sources produces CO2 as a by-product. The atmosphere CO2 content has a significant growth in the last period started at the industrial revolution..
The world energy related CO2 emission (roughly 2/3 of the total emission) is now slightly below 30 billions of ton per year, projected to increase to 40 billion till 2030. 97% of the projected increase in emissions between now and 2030 comes from non-OECD countries – three-quarters from China, India & the Middle East alone.
Abundant scientific studies and reports disclose sufficient information that rising concentrations of greenhouse gases, especially CO2, in the atmosphere have direct relation with climate change that we have witnessed in the previous decades. Average temperatures rise, storms
are more intense, drought periods longer, glaciers retreat much faster and floods are more commonplace. It is without doubt, that anthropogenic CO2 is a significant contributor to the increased concentrations of GHGs in the atmosphere.
In January 1998, the collaborative ice-drilling project of Russia, the United States, and France at the Russian Vostok station in East Antarctic territory yielded the deepest ice core ever recovered, reaching a depth of 3,623m (see figure 1). Ice cores are unique with their entrapped air inclusions enabling direct records of past changes in atmospheric trace-gas composition.
The Vostok project [2] demonstrated that there is a close correlation between Antarctic temperature and atmospheric concentrations of CO2. The extension of the Vostok CO2 record shows that the main trends of CO2 are similar for each glacial cycle.
During glacial-interglacial transitions, the atmospheric concentrations of CO2 rise from 180 to 280-300 ppm.
The extension of the Vostok CO2 record shows the present-day levels of CO2 (375 ppm) are unprecedented during the past 420 000 years. The change is drastic and shocking, anthropo-Figure 1. The „VOSTOK” drilling
Figure 2. The trends of CO2 content

39
MOL Scientific MagazineSD & HSE special issue
1MOL GROUP
genic emissions of CO2 increased from 315 to 375 ppm in the period of 1970 to 2000. (see Figure 2)
Taking into consideration all the facts of depletion of resources, supply security (both of them increase price growth) and climate change, we can say that we need a switch to locally available energy resources.
Climate change issues have to be treated in global but at least at government level. It seems to be too optimistic to believe that profit-oriented companies will choose the more environmental friendly but more expensive solutions. That’s why a number of regulations and financial initiatives are produced to push the move towards renewables. The European Union has a pacemaker role in this area.
Renewable policies in USAAs a pacesetter in the world, on June 1, 2005, California Governor Arnold Schwarzenegger issued Executive Order S-3-05, which established state-wide GHG emission reduction targets of 2000 levels by 2010, 1990 levels by 2020, and 80 percent below 1990 levels by 2050. On September 27, 2006, Governor Schwarzenegger signed the Global Warming Solutions Act, AB 32, which capped the state’s GHG emissions at 1990 levels by 2020. This is the first state-wide program in the USA to mandate an economy-wide emissions cap that includes enforceable penalties. [3]
Currently 20 states of the USA have individual GHG emission reduction targets (Figure 3).
California also proposed the enforcement of Renewable Portfolio Standard in the power sector
ensuring that at least 33% of electricity would be produced in the states from renewables.
Since Barack Obama won the election the USA energy politics started a total change. The “Obama-Biden New Energy for America” plans to have 10% renewables share in power generation in 2012, and 25% in 2050. A challenging “cap and trade” (similar to the European ETS) program planned to be launched with an expected 80% GHG emission decrease by 2050 compared to the 1990 figures. All companies in all industries would have to pay for all of their emissions.
Roughly USD 15 bn/y would be spent on the development of clean energy solutions like utilization of renewables, energy efficiency, low emission coal plants, plug-in hybrid cars, biofuels and a new digital electricity grid. They expect from these investments 5 millions of new “green jobs” in mostly the high skilled manufacturing areas. As a leadership program half of the federal government cars purchase will be plug-in hybrids or all electric ones by 2012. [4]
Setting European paceSince the Maastricht Treaty one of the main objectives of the European Union is to promote growth while protecting the environment. Sustainable development as another key principle was added by the Amsterdam Treaty. Despite implicit failure of Johannesburg Summit – no specific goals were set to energy sector in contribution for environmental protection – the European Union with more than 80 other pioneer countries set challenging targets and formed the Johannesburg Renewable Energy Coalition (JREC) [5]. Playing key role in assignment of Kyoto Protocol was another clear prove how seriously the EU thinks about this topic. At 2004 the European Conference for Renewable Energy in Berlin defined EU targets for renewable up to 2020 [6]. At the end of 2008, in the middle of the economic crisis, very different movements (from trade unions to some industry represents) formed a last minute coalition, trying to soften these targets without success.
The RES-E Directive provides for a broad definition of renewable energy. It includes hydro power (large and small), biomass (solids, biofuels, landfill gas, sewage treatment plant gas and biogas) wind, solar (PV, heat, thermal electric), geothermal, wave and, tidal energy.
Figure 3. Renewable policies in the USA
40
SD & HSE special issueMOL Scientific Magazine
1MOL GROUP
General waste incineration has been excluded but the biodegradable fraction of waste can be considered as renewable. The contentious category biodegradable part of waste incineration ‘as long as the waste hierarchy is respected’ has been retained. Furthermore, large hydropower (more than10 MW) is also included. It has been tacitly agreed that large hydro will count for meeting the targets but will not be eligible for support measures.
The new Renewable Energy Sources Directive (“Promotion of the use of energy from renewable sources”) approved with amendments by the European Parliament in the first reading in December 2008 sets clear target of 20% renewable share in gross final consumption by 2020 in the European Union. Different targets may be assigned to different countries (e.g. Hungary: 13%, Slovakia: 14%) according to their 2005 renewable share and local opportunities. To have a clear view, in the power generation sector the cheapest and most matured technology – relatively easy to realize in larger scales - is the hydro-power, but not all countries has suitable geographic conditions. The transportation sector’s accepted 10% renewable share shall be equally shared by all member states. Member states should present their national action plans by June 2010.
There are also strict sustainability criteria for biofuels and bioliquids (for heat and electricity production) GHG emissions saving from their use compared to fossil fuels shall be 35% as the directive enters into force, 50% from 2017, and 60% for new installations from the same time.
Key questions: Future demand and security of supplySecurity of energy supply and meeting future demand are the other key drivers for the EU to increase renewable share in the total energy mix. The Second Strategic Energy [7] indicates clear figures for the next decade: “…Under the new energy policy scenario, the capacity expansion necessary to meet the future power demand and to replace ageing facilities amounts to circa 360 - 390 GW over the period 2005-2020 depending on oil prices…According to the New Energy Policy case, power generation based on gas and renewables would account for about 300 - 315 GW of the required capacity expansion…”
Translation objectives to practiceThe EU promotes cross-border cooperation between states to exchange experience regarding both technological issues as well as successful incentive schemes. Leading countries in the renewable energy sector (Germany, Spain, Denmark) have established the IFIC (International Feed-In Cooperation, 2004) and IRENA (International Renewable Energy Agency, 2007[8]).
Germany at the moment is the worldwide pioneer in expanding its renewables capacities and hence reducing GHG. The strong development has been possible by introducing attractive public support, mainly in the form of feed-in tariffs, starting in 2000. The German Model has been copied by about 50 countries. The German Renewable Energy Law (EEG) defines an annual compensation scheme for newly installed RE capacities. The recent amendment in 2008 (i.e. EEG 2009) was based on targeting 25-30% share of RE in 2020. The compensation is fixed and held constant for 15 years (hydro power < 5 MW), 20 years (wind, biomass, geothermal energy, photovoltaic power) and 30 years (hydro power >5 MW). The base year for calculating the respective compensation is 2004.
Serious commitment is visible in funding renewable research and development. In asset financing for new capacity, Europe leads with investments of USD 38.8bn in 2007[9] of the total finance of USD 84.5 bn of the world. (Figure 4) Among the achievements could be mentioned that PV (photovoltaic) systems efficiency was doubled. On-shore wind farms negative effects raised due to their high impact to landscape and biodiversity [1 ] were reduced. There is a much clearer picture on the corrosion lifetime of off-shore wind farms and how we could protect these equipments against the corrosion[11]. Expertise exists how the quality of supply affects production of biogas plants and how we can handle these quality issues.

41
MOL Scientific MagazineSD & HSE special issue
1MOL GROUP
Renewable portfolio in the EU in 2020Renewable technologies are competing with each other. However the last decades developments turned some of them to mature phase and reasonable investments targets for the energy industry (like biomass and wind-technologies), some of them are close to breakthrough, but their industrial applicability is still a question (PV systems, tide). Due to their 8-15 years payback period time public-private-partnerships could make them more attractive.
The Renewable Energy Roadmap indicates clearly, how the Commission thinks about future renewable portfolio trends [12] (see figure 5).
It is clear from the projections, how the industry should think about its potential investments. There is a room for the Venture Capital to invest in PV development, but it is better for conservative energy industry players to focus on wind and bio-technologies. Despite big share of hydro energy in the energy mix, its growth potential is limited.
Fast integration of Iceland to EU, as a positive side effect of the financial crisis, could strengthen geothermal industry via EU supported technology transfer programs. At February 2009 the European Commission decided to invest €3.5bn of unspent EU funds in a series of "strategic energy projects" as part of Europe's economic recovery plan. The package includes a proposal for a Regulation to grant European Community support to strategic energy projects. A total of Euro 3.5 billion is proposed for 2009-2010 investment in carbon capture and storage (financial envelope: Euro 1,250 million), offshore
wind projects (€500m), and gas and electricity interconnection projects (€1,750m). However, it fails to address energy efficiency.
According to EWEA (European Wind Energy Association), the wind industry alone is expected to contribute towards delivering 12-14% of EU electrical demand within 12 years, with more than one-quarter of that coming from offshore wind. By 2030, the contribution of offshore wind alone is expected to reach close to 15% of total EU electrical production.
Standpoint of the member states could be different, how to meet individual commitments and build up internal energy policies.
Competing renewable sources and technologiesRenewable technologies are different, regarding to supply security, applicability, CAPEX need and operation etc. Some of them are mature, some of them before breakthrough. Their synergies with other industries could be different too. Figure 6 shows the the low share of renewables in EU energy consumption.
HydropowerHydropower generation is a well-known, widely used, mature technology. Hydroelectric power plants can be divided into run-of-river plants usually having no (or only a small) reservoir (and therefore operating for base load generation) and storage power plants, which are (with their reservoir capacities) predestined for the generation of peak load. Storage power plants might also have
Figure 5. Renewable portfolio trends

42
SD & HSE special issueMOL Scientific Magazine
1MOL GROUP
pumping facilities producing electricity to supply peak demand by moving water between different reservoir altitudes, i.e. pumping water during day periods when base load prices are rather cheap to higher reservoir levels. However, electricity produced in pumped storage units from water that has previously been pumped uphill should not be considered to be electricity produced from renewable energy sources.Investments cost are high, however the maintenance cost are the most favourable compared to any other technologies. Hydropower could be a peer-technology of wind power using pumping storage technologies, mentioned above. The technology is CO2 clean, however its impact to biodiversity is high. Big hydropower plants generate countable risk to human living if geological structure is not stable enough. In the EU there is low potential for hydropower investments.
Wind powerWind power industry is the most growing industry compared to other ones. Onshore and offshore platforms generates growing percentage of total EU electricity consumption. From growth point of view, these technologies would generate around one third of EU renewable electricity at 2020. Wind power technology is a mature technology.
Most of the technological problems have been solved in the past decade. CO2-clean operation is another positive advantage of this technology. From investments point of view, the costs are low-moderate, due to the different geographical locations, development stages of the local wind energy market and the accessibility of the turbines, there is a wide spread between the O&M costs in different areas. For example:
one of the world’s biggest operators, Iberdrola Renewables(?), estimates that the costs are EUR 25,000/MW in Spain, while in the “young” wind market in the UK, up to 87,000EUR/MW have to be expected. Payback period is about 12 years. The wind farms installed currently have a capacity of 50-200 MW. At this size, operators can benefit from economies of scale in civil engineering and electric connection costs. However, the wind farms require a large area, as turbines typically need 3-5 rotor diameters between them. Disadvantage could be its impact to biodiversity (birds), their impact to the landscape. Noise of equipments is high. Careful setup could handle these issues. The biggest disadvantage comes from supply security side. The electricity market needs continuous supply, however wind-source is not a continuous one. Combining wind power with hydropower (pumping storages) could resolve these problems. Due to geographical limitations of hydropower, wind power limitations also exist.
Geothermal powerGeothermal power is another mature technology. Typically, the use of geothermal potential is divided into two categories: electricity production and direct use. The second category includes all applications other than electricity production, such as heating, supplying baths with thermal water, snow melting, agriculture applications, etc. The main measurement factors for a geothermal well are the temperature of the fluid and the water yield. These factors largely determine the carried energy and the availability of the well for usage. Due to this facts industrial applicability is limited
Figure 6. Renewable sources in the EU
Figure 7. Hydropower potential
Figure 8. Wind power capacities

43
MOL Scientific MagazineSD & HSE special issue
1MOL GROUP
by geological structures. CAPEX needs are high (mainly drilling costs), however maintenance costs are low. CO2 emission is low. Impact to biodiversity is low, too.
The European Geothermal Energy Council (EGEC) has worked out a strategic research plan for the period 2008-30 [13]. Their targets for geothermal energy production are:
• For heating & cooling in the EU-27, from the 15 GWt in 2007, capacity should increase to 20 GWt by 2010, 40 GWt by 2020 and 80 GWt by 2030.
• In the EU-27, the present geothermal electricity capacity is 1 GWe, around 10% of world geothermal installation. Other European countries have around 0.5 GWe capacity. For the EU-27, the plan is to reach 1.4 GWe by 2010, 6-10 GWe to be installed by 2020 and 15-30 GWe should be installed by 2030.
BiomassUntil the industrial revolution biomass (for sailing the wind) was the only energy source. Because of high CO2 emission of coal-plants, nowadays the EU actively supports CO2-friendly solutions. The main biomass source is wood. Due to its high impact to biodiversity this source is openly criticized by civil movements. However energy forest or grass plantation is less harmful, their negative impact to biodiversity is on the screen.
Grain and other food sources are efficient in firing but their impact on the food prices is remarkable. Agricultural and animal waste would be one of the biomass sources which doesn’t affect negatively the food supply or biodiversity. Maintenance costs are moderate. From supply security point of view these investments have moderate risks. On the other hand, synergies could improve this technology. Biogas plants may emit CH4 into the air, which has more than 20 times higher global warming potential than CO2. If the farmers could fire/gasify their agricultural waste, then they do not need to pay waste-related fees. Biomass plants create jobs, and revive rural areas.
Methane from waste Using dump gases, are not renewable sources by definition, however the technology is the same as the biomass-technology. If the hazardous waste could be removed from process, then we could efficiently use this technology to supply small towns, or districts.
Solar powerSolar cells are the technology of the close future. However their efficiency doubled in the past decade (see figure 10) is still not enough to realize positive NPV for solar projects without subsidizing them. CAPEX costs are extremely
high. Their energy production highly depends on the geographical lo cation. Industry produces ha-zar dous wastes during PV cells production.
Renewables at some major oil and energy companies
The major oil companies declared full commitment on importance and utilization of renewable energy.
ShellShell has a business strategy updated in March 2008 [14]: “More Upstream, Profitable Downstream”. In their strategy they also states “to create a world-leading biofuels business and aim to build a material capability in the capture and storage of CO2”. Figure 9. Biomass production areas
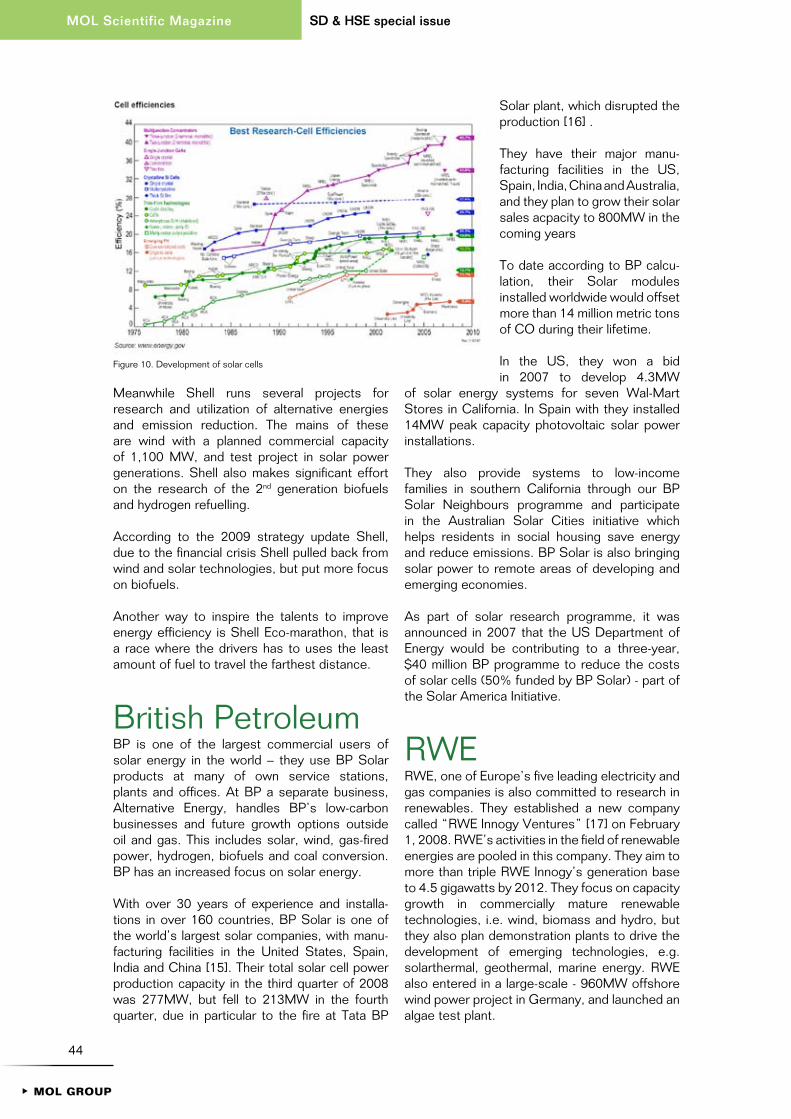
44
SD & HSE special issueMOL Scientific Magazine
1MOL GROUP
Meanwhile Shell runs several projects for research and utilization of alternative energies and emission reduction. The mains of these are wind with a planned commercial capacity of 1,100 MW, and test project in solar power generations. Shell also makes significant effort on the research of the 2nd generation biofuels and hydrogen refuelling.
According to the 2009 strategy update Shell, due to the financial crisis Shell pulled back from wind and solar technologies, but put more focus on biofuels.
Another way to inspire the talents to improve energy efficiency is Shell Eco-marathon, that is a race where the drivers has to uses the least amount of fuel to travel the farthest distance.
British PetroleumBP is one of the largest commercial users of solar energy in the world – they use BP Solar products at many of own service stations, plants and offices. At BP a separate business, Alternative Energy, handles BP’s low-carbon businesses and future growth options outside oil and gas. This includes solar, wind, gas-fired power, hydrogen, biofuels and coal conversion. BP has an increased focus on solar energy.
With over 30 years of experience and installa-tions in over 160 countries, BP Solar is one of the world’s largest solar companies, with manu-facturing facilities in the United States, Spain, India and China [15]. Their total solar cell power production capacity in the third quarter of 2008 was 277MW, but fell to 213MW in the fourth quarter, due in particular to the fire at Tata BP
Solar plant, which disrupted the production [16] .
They have their major manu-facturing facilities in the US, Spain, India, China and Australia, and they plan to grow their solar sales acpacity to 800MW in the coming years
To date according to BP calcu-lation, their Solar modules installed world wide would offset more than 14 million metric tons of CO during their lifetime.
In the US, they won a bid in 2007 to develop 4.3MW
of solar energy systems for seven Wal-Mart Stores in California. In Spain with they installed 14MW peak capacity photovoltaic solar power installations.
They also provide systems to low-income families in southern California through our BP Solar Neighbours programme and participate in the Australian Solar Cities initiative which helps residents in social housing save energy and reduce emissions. BP Solar is also bringing solar power to remote areas of developing and emerging economies.
As part of solar research programme, it was announced in 2007 that the US Department of Energy would be contributing to a three-year, $40 million BP programme to reduce the costs of solar cells (50% funded by BP Solar) - part of the Solar America Initiative.
RWERWE, one of Europe’s five leading electricity and gas companies is also committed to research in renewables. They established a new company called “RWE Innogy Ventures” [17] on February 1, 2008. RWE’s activities in the field of renewable energies are pooled in this company. They aim to more than triple RWE Innogy’s generation base to 4.5 gigawatts by 2012. They focus on capacity growth in commercially mature renewable technologies, i.e. wind, biomass and hydro, but they also plan demonstration plants to drive the development of emerging technologies, e.g. solarthermal, geothermal, marine energy. RWE also entered in a large-scale - 960MW offshore wind power project in Germany, and launched an algae test plant.
Figure 10. Development of solar cells

45
MOL Scientific MagazineSD & HSE special issue
1MOL GROUP
OMV OMV has a subsidiary called „OMV future energy fund”, with 4 FTE involving several other international scientists specialized in energy and climate change [18]. Its task is identifying renewable energy and emissions reduction projects within the OMV group, supports their implementation and provides funding for them. Actual investments by OMV are expected to significantly exceed the Fund’s initial budget of EUR 100 million, as in some cases projects will receive support without regard to their profitability.
They run a number of “renewable” projects mainly focusing on Geothermal Energy, 2nd generation biofuels, hydrogen fuel station, refinery development (nanotechnology in effective heat exchangers) CO2 sequestration (EOR, EGR, not (?) only clear CCS). Interesting try to build a new headquarter with a planned 90% energy saving and 80% less GHG emission.
Future visionRenewables compared to fossil energy resources are not competitive today, however the drivers mentioned in the first part of the article, force breakthrough in energy production. In the past few years the photo-market completely restructured due to digital processing. Several market leading companies did not recognized potential of digital imaging on time. Polaroid company disappeared, Minolta, with nearly 100 years tradition in photography had to sell its photo-division, while electric companies, like Sony or HP became significant market players. This example clearly shows that the follow-up approach could seriously threaten future of the energy companies, focusing only on fossil resources. The developed countries show increased commitment on the environment protection, so climate change issues. They adjust their regulatory, taxation and subvention system to promote renewables that will accelerate oncoming technological breakthrough. The present economic turmoil offers a good chance to make a green “New deal”.The future is clear, we have to decide to be among the firsts, or to be dropped behind.
References[1] IEA World Energy Outlook 2008[2] NOAA's National Climatic Data Center[3] www.pewclimate.org [4] Barack Obama and Joe Biden: New
Energy for America[5] http://ec.europa.eu/environment/jrec/
index_en.htm [6] Based on EU directives 2001/77/EC
and 2003/30/EC: 7 http://europa.eu/scadplus/glossary/
lisbon_strategy_en.htm [7] Second Strategic Energy Review
an EU Energy and Solidarity Action Plan: http://ec.europa.eu/energy/strategies/2008/doc/2008_11_ser2/strategic_energy_review_wd_future_position2.pdf
[8] Erste Group sector Report: „Renewable energy. Close to the tipping point - February 4, 2009”
[9] SEFI, New Energy Finance[10] For examle: „Impact of wind turbines on
birds in Zeebrugge (Belgium)” http://www.wind-watch.org/documents/impact-of-wind-turbines-on-birds-in-zeebrugge-belgium/
[11] Middelgrunden Offshore Wind Farm, Denmark: http://www.power-technology.com/projects/middelgrunden/
[12] Renewable Energy Road Map: Renewable energies in the 21st century: building a more sustainable future, Brussel, 2007
[13] Erste Group: Renewable energy - Close to the tipping point - February 4, 2009
[14] www.shell.com [15] www.bp.com [16] www.pv-tech.org [17] h t tp ://www.rwe.com/web/cms/
en/97798/rwe-npower/ [18] www.omv.com
Revised by Laszlo Racz

46
1MOL GROUP
SD & HSE special issueMOL Scientific Magazine
AbstractThe Climate and Renewable Energy Package is intended to meet the EU's 2020 climate goals to reduce green-house-gas emissions by 20% below 1990 levels and boost the share of renewables in the total energy mix to 20% by the same date.The 'package' is composed of six mea-sures. The revision of the EU's flagship emissions trading scheme will enter into force in 2013, obliging power instal lations to buy all their emissions allowances at auction to correct the deficiencies of the previous scheme, in which free allocations resulted in mas-sive windfall profits. For other ETS sec-tors, auctioning will be gradually phased in, with 20% of emissions permits bought at auction by 2013 and 70% by 2020. Full auctioning will not kick in before 2027. Moreover, member states with significant coal-based production negotiated substantial derogations to their industries that are deemed to be at risk of 'carbon leakage', that is, re al-location to third countries where environ-mental protection laws are less strict.The package sets binding renewable tar-gets for Member States including 10 e% general target for renewable en ergy in transport sector. Biofuels shall be used towards the target only if they fulfil sustainability criteria. The fuel quality directive provides another incentive for low-carbon biofuels by setting an obligation of fuel suppliers to reduce greenhouse gas intensity of the fuel pool.
The package also establishes a regula-tory framework for the capture and underground storage of CO2 to help support this new technology before it becomes commercially viable.
ÖsszefoglalásA Klíma és Megújuló Energia Csomag azért készült, hogy teljesüljenek az EU 2020-as klímaváltozással kapcsolatos céljai, az üvegház hatású gázok kibo-csátása az 1990-es szinthez képest 20 %-kal csökkenjen, valamint a megújuló energia aránya 20%-ra nôjön a teljes energia mixben.A „csomag” hat jogszabályból áll. Az EU zászlóshajójának számító kibocsá tás kereskedelmi rendszer (ETS) átalakí tott változata 2013-ban lép életbe, kötelez-ve a villamos energia elôállítóit, hogy teljes kvóta igényüket aukción vá-sárolják meg, megszüntetve ezzel a ko-ráb bi rend szer hiányosságait, amelyben a sza bad allokáció extraprofitot ered-mé nyezett. Más ETS szektorokban az aukciós kvóta beszerzést fokozatosan vezetik be, 2013-ig kvótaigényük 20%, 2020-tól pedig 70%-át aukción kell vásárolniuk. 2027 elôtt nem vezetik be a teljes aukciót. Továbbá a túlnyomóan szenet használó tagországok elérték, hogy olyan mentességet vezessenek be, mely csökkenti a carbon leakage kockázatát, vagyis olyan harmadik országokba történô áttelepítését, ahol a környezetvédelmi elôírások kevésbé szigorúak.A csomag kötelezô megújuló célokat fogalmaz meg a tagállamok számára, ezen belül 10 e% általános célszá-mot a közlekedési szektorban használt ener gia esetében. A bioüzemanyagok csak akkor használhatóak a cél telje-
Ilona váriAdvisorMOL Group Enterprise Relations DepartmentE-mail: [email protected]
and Renewable The Climate Energy (CARE) Package of the EU, 20:20:20 by 2020

47
1MOL GROUP
MOL Scientific MagazineSD & HSE special issue
sí té se érdekében, ha megfelelnek a fenntarthatósági kritériumoknak. Az üzemanyag minôség irányelv to váb bi ösztönzôt biztosít az alacsony carbon intenzitású bioüzemanyagok fel hasz-nálásának elôsegítésére, köte lezve az üzemanyag forgalmazókat az általuk forgalmazott üzemanyagok üvegházi gázintenzitásának csökkentésére. A csomag ezenfelül meghatározza a CO2 geológiai tárolásának szabályozási kereteit, hogy ezzel segítse ezen új technológia mielôbbi elterjedését.
In December 2008 the European Parliament and Council reached an agreement on the Climate and Renewable Energy Package (CARE). It includes the following 6 legislations: directive modifying the EU Emission Trading Scheme (ETS), the Renewable Energy Sources Directive (RES-D), decision on Effort Sharing in non-ETS sectors, directive on Carbon Capture and Storage (CCS) and directives regulating fuel quality and CO2 emission of cars. These directives will drive to 20% energy efficiency improvement, an increase of the share of renewables in energy use in the European Union to 20%, a reduction of carbon intensity of transport fuels by 6%, will enforce car technology developments and support development of new technology aimed at safe carbon capture and storage. By these measures the EU is committed to reducing its overall greenhouse gas emissions to at least 20% below 1990 levels by 2020, which contributes to the levels of reductions that are considered scientifically necessary to avoid dangerous climate change.
Historical Context From the late 1970s onwards climate scientists have raised concerns that burning oil, gas and coal is largely responsible for rising global temperatures.[1] By the 1990s the political climate had shifted towards action, with the publication of the first report by the UN’s Intergovernmental Panel on Climate Change (IPCC) and the UN Earth Summit in Rio de Janeiro.
• International climate talks, hosted by the UN, led to the Kyoto Protocol in 1997, a global agreement to reduce greenhouse gas emissions to five percent below 1990 levels by 2012. The agreement was ratified in 2004 [2]. The principle of emissions trading was enshrined in
the Kyoto Protocol, based on the idea that governments would set limits on greenhouse gas emissions, but the market would then find the cheapest ways to make those cuts [3].
• In 1997 the Commission published its White Paper 'Energy for the future: renewable sources of energy - White Paper for a Community Strategy and Action Plan'. Renewables are favoured because of their role in tackling the twin challenge of energy security and global warming.
I N S T R U M E N T S T O R E G U L A T E G R E E N H O U S E G A S E M I S S I O N O F T H E I N D U S T R Y
Carbon Taxes Gain Support
Following Kyoto, the EU was legally bound to reduce emissions and needed “to establish instruments which ensure that the overall reduction is effectively achieved”. Several member states had enacted a carbon tax in 1990, the first country to have done so was Finland, and the Netherlands followed shortly after. Sweden, Norway and then Denmark later took similar steps [4]. Despite the enthusiasm for carbon taxes among so many member states, the proposal for an EU wide carbon tax in 1991 was dropped. Policy momentum seemed to be gathering instead behind the idea of an emissions trading scheme. A national emissions trading scheme was launched by the UK Department for the Environment (Defra) in early 2002 [5] and Britain actively pushed for a similar scheme to be adopted by the EU [6].
Genesis of the EU ETS Scheme
The European Parliament first adopted a Green Paper on emissions trading within the EU in March 2000 [7] and the Commission’s proposal for an EU wide scheme was presented to the Parliament in October 2001. By this time groundwork for the UK scheme was almost complete. The Commission received significant input from the US non-governmental organisation (NGO) Environmental Defense which emerged as a prominent supporter and self-appointed expert on carbon trading during the UN’s Kyoto negotiations. The organisation had also been involved in the design of the US sulphur emissions trading scheme, the only large-scale emissions trading scheme to have operated prior to the EU ETS.
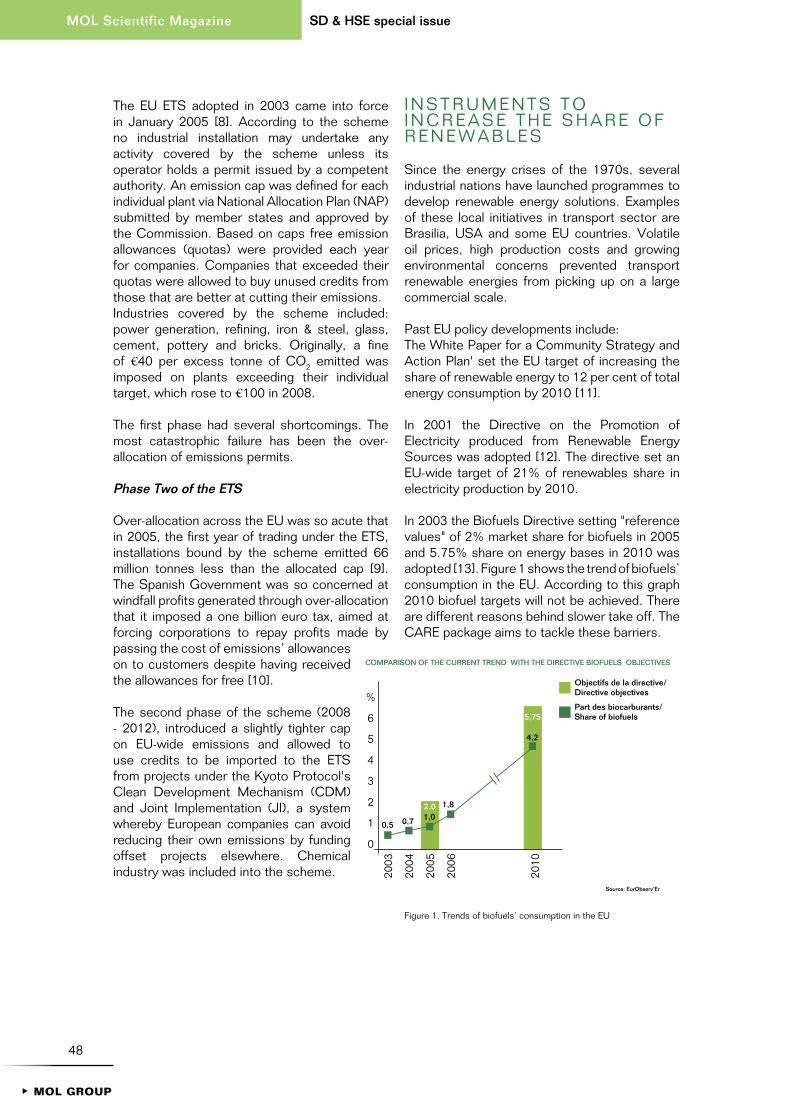
48
SD & HSE special issueMOL Scientific Magazine
1MOL GROUP
The EU ETS adopted in 2003 came into force in January 2005 [8]. According to the scheme no industrial installation may undertake any activity covered by the scheme unless its operator holds a permit issued by a competent authority. An emission cap was defined for each individual plant via National Allocation Plan (NAP) submitted by member states and approved by the Commission. Based on caps free emission allowances (quotas) were provided each year for companies. Companies that exceeded their quotas were allowed to buy unused credits from those that are better at cutting their emissions.Industries covered by the scheme included: power generation, refining, iron & steel, glass, cement, pottery and bricks. Originally, a fine of €40 per excess tonne of CO2 emitted was imposed on plants exceeding their individual target, which rose to €100 in 2008.
The first phase had several shortcomings. The most catastrophic failure has been the over-allocation of emissions permits.
Phase Two of the ETS
Over-allocation across the EU was so acute that in 2005, the first year of trading under the ETS, installations bound by the scheme emitted 66 million tonnes less than the allocated cap [9]. The Spanish Government was so concerned at windfall profits generated through over-allocation that it imposed a one billion euro tax, aimed at forcing corporations to repay profits made by passing the cost of emissions’ allowances on to customers despite having received the allowances for free [10].
The second phase of the scheme (2008 - 2012), introduced a slightly tighter cap on EU-wide emissions and allowed to use credits to be imported to the ETS from projects under the Kyoto Protocol's Clean Development Mechanism (CDM) and Joint Implementation (JI), a system whereby European companies can avoid reducing their own emissions by funding offset projects elsewhere. Chemical industry was included into the scheme.
I N S T R U M E N T S T O I N C R E A S E T H E S H A R E O F R E N E W A B L E S
Since the energy crises of the 1970s, several industrial nations have launched programmes to develop renewable energy solutions. Examples of these local initiatives in transport sector are Brasilia, USA and some EU countries. Volatile oil prices, high production costs and growing environmental concerns prevented transport renewable energies from picking up on a large commercial scale.
Past EU policy developments include:The White Paper for a Community Strategy and Action Plan' set the EU target of increasing the share of renewable energy to 12 per cent of total energy consumption by 2010 [11].
In 2001 the Directive on the Promotion of Electricity produced from Renewable Energy Sources was adopted [12]. The directive set an EU-wide target of 21% of renewables share in electricity production by 2010.
In 2003 the Biofuels Directive setting "reference values" of 2% market share for biofuels in 2005 and 5.75% share on energy bases in 2010 was adopted [13]. Figure 1 shows the trend of biofuels’ consumption in the EU. According to this graph 2010 biofuel targets will not be achieved. There are different reasons behind slower take off. The CARE package aims to tackle these barriers.
Figure 1. Trends of biofuels’ consumption in the EU
%
6
5
4
3
2
1
0
2003
2004
2005
2006
2010
0,5 0,7 1,02,0 1,8
4,2
Source: EurObserv’Er
5,75
Objectifs de la directive/Directive objectives
Part des biocarburants/Share of biofuels
COMPARISON OF THE CURRENT TREND WITH THE DIRECTIVE BIOFUELS OBJECTIVES

49
MOL Scientific MagazineSD & HSE special issue
1MOL GROUP
50
SD & HSE special issueMOL Scientific Magazine
1MOL GROUP
Content of the Climate and Renewable Energy PackageThe CARE package often mentioned as “20:20:20 by 2020” roadmap was approved at first reading in under a year with a very active diplomatic work of the French Presidency. It integrates all activities emitting greenhouse gases and makes an attempt to show the right direction how to reduce emissions. The new policy framework sets market-based instruments which enable some projects – e. g. renewable energy, energy efficiency, carbon sequestration – to become viable that otherwise may not be, plus they may bring extra investments to EU member states. The main elements of legislations included in the CARE package:
1. Central to the policy framework is the revision of the EU ETS and establishing requirements for the third phase of the system. In this third phase beginning in 2013 emissions from the sectors covered by the system will be cut by 21% by 2020 compared with levels in 2005. A single EU-wide cap on emissions in the ETS sector will be set, and free allocation of emission allowances will be progressively replaced by auctioning of allowances by 2027 [14]. Free quotas will be distributed in line with sector specific benchmarks considering top performers within the sector.
2. Emissions from sectors not included in the EU ETS – such as transport, housing, agriculture and waste – will be cut by 10% from 2005 levels by 2020. Each Member State will contribute to this effort according to its relative wealth, with national emission targets ranging from -20% for richer Member States to +20% for poorer ones.
3. National renewable energy targets were set for each Member State and a minimum 10% share for renewable energy in transport by 2020. The package also sets out sustainability criteria that biofuels will have to meet to ensure they deliver real environmental benefits [15].
4. The package also seeks to promote the development and safe use of CCS, a suite of technologies that allows the
carbon dioxide emitted by industrial processes to be captured and stored underground where it cannot contribute to global warming. Revised guidelines on state aid for environmental protection will enable governments to support CCS demonstration plants.
5. The revised directive on fuel quality has two elements linking with climate policy. It will introduce new fuel specifications allowing higher biofuel content in gasoline and diesel fuel. The other element is the decarbonisation provision obliging fuel suppliers to reduce life-cycle greenhouse-gas-emission of fuels they sell by 6% between 2010 and 2020. 4% more reduction is subject to revision in 2014.
6. Regulation sets emission performance standards for new passenger cars in order to reach an average level of emissions of 120g CO2/km for the entire car industry by 2012. Average CO2 emissions for new passenger cars shall be 130 g CO2/km. It will be complemented by additional measures corresponding to 10 g CO2 /km as part of the Community's integrated approach. The average emissions for new cars shall be 95 gCO2/km from 2020.
I will present the main elements of the revised ETS directive, the Renewable Directive and the climate related part of the Fuel quality Directive.
D IRECTIVE REVIS ING THE EU’S EMISSION TRADING SYSTEM - THE THIRD PHASE
The Directive provides for the reductions of greenhouse gas emissions to be increased so as to contribute to the levels of reductions that are considered scientifically necessary to avoid dangerous climate change. It also lays down provisions for assessing and implementing a stricter EU reduction commitment exceeding 20%, to be applied upon the approval by the Community of an international agreement leading to emissions reductions exceeding those required by the Directive (as reflected in the 30% commitment endorsed by the Spring 2007 European Council).
The Community-wide quantity of allowances issued each year starting in 2013 shall decrease in a linear manner beginning from the mid-point of the period 2008 to 2012. The Commission shall, by 30 June 2010, publish the absolute Community-wide quantity of allowances for 2013.

51
MOL Scientific MagazineSD & HSE special issue
1MOL GROUP
Number of quotas in 2020 will represent 21% emission reduction in ETS sectors compared with levels in 2005.
Part of allowances will be distributed free of charge to companies, the other part will be sold by EU member states in auctions. The system for setting the number of free company allowances – rules for allocation – will be modified and community-wide ex ante benchmarks will be used instead of national allocation. No free allocation will be provided to the power sector and the number of free allowances will be gradually decreased in manufacturing sectors. No free allocation will be provided in these sectors in 2027. Sectors imposed to international competition will be exempt from this rule until 2020 – this special derogation is called derogation for sectors at significant risk of “carbon leakage”.
auctioning of allowances
By 31 December 2010, the Commission shall determine an estimated amount of allowances to be auctioned by Member States and shall adopt a Regulation on timing, administration and other aspects of auctioning to ensure that it is conducted in an open, transparent, harmonised and non-discriminatory manner. The total quantity of allowances to be auctioned by each Member State shall be composed as follows:
• 88% of the total quantity of allowances to be auctioned being distributed amongst Member States in shares that are identical to the share of verified emissions under the Community scheme for 2005 or the average of the period 2005-2007, whichever one is the highest, of the Member State concerned;
• 10% of the total quantity of allowances to be auctioned being distributed amongst certain Member States for the purpose of solidarity and growth within the Community;
• 2% of the total quantity of allowances to be auctioned being distributed amongst Member States whose greenhouse gas emissions in 2005 were at least 20% below their emissions in their levels in the base year applicable to them under the Kyoto Protocol.
Usage of revenues from auctioning of allowances
According to the plans of the Commission revenues from auctioning of allowances will serve as one of the sources of climate actions.
At least 50% of the revenues generated from the auctioning of allowances will be used for one or more of the followings:
• to reduce greenhouse gas emissions by contributing to different EU and international climate and renewable funds;
• to develop renewable energies to meet the commitment of the Community to use 20% renewable energies by 2020, as well as to develop other technologies contributing to the transition to a safe and sustainable low-carbon economy and to help meeting the commitment of the Community to increase energy efficiency by 20% by 2020;
• for measures to avoid deforestation and increase afforestation and reforestation in developing countries that have ratified the future international climate agreement, to transfer technologies and to facilitate adaptation to the adverse effects of climate change in these countries;
• for forestry sequestration in the EU; • for the environmentally safe capture and
geological storage of carbon dioxide, in particular from solid fossil fuel power stations and a range of industrial sectors and sub-sectors, including in third countries;
• to encourage a shift to low emission and public forms of transport;
• to finance research and development in energy efficiency and clean technologies in the sectors covered by the scope of the directive;
• for measures intended to increase energy efficiency and insulation or to provide financial support in order to address social aspects in lower and middle income households.
Decreasing free allocation in the manufacturing sector
As it was mentioned above companies producing electricity for their own use or for sale will need to buy allowances equal to their total greenhouse gas emissions. Full auctioning will be gradually introduced in the manufacturing sector. It will be granted 80% of its emission allowances for free in 2013, which will be reduced to 30% by 2020 in order to reach full auctioning in 2027 (and not in 2020 as proposed by the Commission and the European Parliament).
A large derogation has been introduced for sectors at significant risk of ‘carbon leakage’, in
52
SD & HSE special issueMOL Scientific Magazine
1MOL GROUP
other words the relocation of production to third countries with a less strict climate policy, leading to increased CO2 emissions by these countries. Until an international agreement is concluded, these sectors may receive up to 100% of free allowances until 2020, under certain conditions. European oil and gas production, refining and chemicals sectors might be amongst these sectors. The precise list of sectors imposed to carbon leakage will be identified on the bases of principles set by the directive. The Commission will determine the list of exposed sectors or sub-sectors by 31 December 2009. Sector or sub-sector is "deemed to be exposed to a significant risk of carbon leakage if:
• the extent to which the sum of direct and indirect additional costs induced by the implementation of this directive would lead to a substantial increase of production cost, calculated as a proportion of the Gross Value Added, of at least 5%; and
• the Non-EU Trade intensity defined as the ratio between total of value of exports to non EU + value of imports from non-EU and the total market size for the Community (annual turnover plus total imports) is above 10%."
A sector or sub-sector is also deemed to be exposed to a significant risk of carbon leakage:
• if the sum of direct and indirect additional costs induced by the implementation of this directive would lead to a particularly high increase of production cost, calculated as a proportion of the Gross Value Added, of at least 30%; or
• if the Non-EU Trade intensity defined as the ratio between total of value of exports to non EU + value of imports from non-EU and the total market size for the Community (annual turnover plus total imports) is above 30%.
For the sectors deemed to be exposed, the revised Directive provides for 100% of allowances allocated free of charge, at the level of the benchmark.
Community-wide rules for harmonised free allocation
The Commission shall, by 31 December 2010, adopt Community wide and fully-harmonised implementing measures for allocating the allowances. These measures shall determine Community-wide ex ante benchmarks on the bases of the performance of companies representing the best 10% of the sector. Take example of
plant A performing better than the benchmark and plant B emitting more greenhouse gases than the emission calculated on the bases of the benchmark. Plant A will have extra allowances while plant B will need to buy quotas.
Free allocation for modernisation of electricity generation
Member States may give a transitional free allocation to installations launched operation by 31 December 2008 or to installations for which the investment process was physically initiated by the same date for electricity production if they meet certain conditions listed in the Directive.
State aid to cope with indirect carbon leakage
Member States may adopt financial measures in favour of sectors or sub-sectors determined to be exposed to a significant risk of carbon leakage due to costs relating to greenhouse gas emissions passed on in electricity prices, in order to compensate for those costs and where this is in accordance with state aid rules applicable and to be adopted in this area.
Supporting CCS projects
Projects for the environmentally-safe capture and storage of carbon dioxide: up to 300 million allowances in the new entrants reserve shall be available until 31 December 2015 to help stimulate the construction and operation of up to 12 commercial demonstration projects that are aiming at the environmentally safe capture and geological storage of carbon dioxide as well as the demonstration projects of innovative renewable energy technologies, in the territory of the EU.
Exclusion of small installations
Member States may exclude, from the Community scheme, installations which have reported emissions to the competent authority of less than 25 000 tonnes of carbon dioxide equivalent and, where they carry out combustion activities, have a rated thermal input below 35 MW.
adjustments applicable upon the approval of a future international agreement on climate change
At the latest 3 months after the signature by the Community of an international agreement on climate change leading, by 2020, to mandatory
53
MOL Scientific MagazineSD & HSE special issue
1MOL GROUP
reductions of greenhouse gas emissions exceeding 20% compared to 1990 levels, the Commission shall submit a report. On the basis of this report, the Commission shall, as appropriate, submit a legislative proposal to the European Parliament and to the Council amending the ETS directive.
C A R B O N R E D U C T I O N T A R G E T B Y T H E F U E L q U A L I T Y D I R E C T I V E
The original Fuel quality Directive has been regulating only non-climate related environmental characteristics of fuels like sulphur content before. The idea of introducing a new feature demonstrating carbon footprint of transport fuels has been invented by the CARE package. The new requirement sets in respect of fuels for road vehicles, and non road mobile machinery a target for the reduction of life cycle greenhouse gas emissions. As one of the ways of reducing greenhouse gas emissions associated to fuels is replacement of a part of the fuel pool with low-carbon biofuels new fuel specifications have been introduced allowing higher biofuel blending than before – 10 v/v% ethanol in petrol and 7 v/v% FAME in diesel fuel.
Greenhouse gas emission reductions
Fuel suppliers will be obliged to reduce as gradually as possible life cycle greenhouse gas emissions per unit of energy from fuel and energy (greenhouse gas intensity of fuel) supplied by up to 10% by 31 December 2020, compared with the fuel baseline standard to be set later by the Commission and Member States. In life-cycle (LC) GHG emission of fuel or energy all net emissions of CO2, CH4 and N2O in all stages (extraction, cultivation, incl. land-use changes, transport, distribution, combustion) in CO2 equivalent are calculated.
The reduction target shall consist of:• 6% by 31 December 2020. Member
States may require suppliers, for this reduction, to comply with the following intermediate targets: 2% by 31 December 2014 and 4% by 31 December 2017;
• an indicative additional target of 2% by 31 December 2020, to be achieved through one or both of the following
methods: (i) the supply of energy for transport, supplied for use in any type of road vehicle, non-road mobile machinery (including inland waterway vessels), agricultural or forestry tractor or recreational craft; (ii) the use of any technology (including carbon capture and storage) capable of reducing greenhouse gas intensity from fuel or energy supplied;
• an indicative additional target of 2% by 31 December 2020, to be achieved through the use of credits purchased through the Clean Development Mechanism of the Kyoto Protocol, under the conditions set out in Directive 2003/87/EC.
With effect from 1 January 2011, suppliers shall report annually on the greenhouse gas intensity of fuels and energy supplied within each Member State to the authority designated by the Member State.
In formulation of the greenhouse gas reduction target there are some missing elements – the starting point for reduction, methods of calculating reductions from flaring at production sites, CCS and others. During the debate of the directive in the EU different solutions have been discussed for setting the baseline standard. What is similar in all solutions is that some kind of European benchmark – EU average, best 10 suppliers – should be taken as the bases. Two main scenarios are presented bellow. Pictures 2 and 3 help to understand different scenarios:
a) The Commission identifies fixed constants as 2010 baseline for diesel fuel and petrol with no biofuel content on the bases of scientific data provided by JRC (EU Joint Research Centre) – shown with green line. Fuel suppliers will use this data for calculation of their data in the annual report. As some biofuels have lower greenhouse gas intensity than fossil fuels they can be used for meeting the reduction obligation. As demonstrated on picture 3 blending 10 volume % of rape seed biodiesel and biodiesel from waste and 10 volume % corn ethanol 5% reduction might be reached in greenhouse gas intensity (the picture is only demonstration).
b) The other, more severe scenario – proposed by the European Parliament during the debate – would be to ask all European fuel suppliers to calculate the greenhouse gas intensity of their own
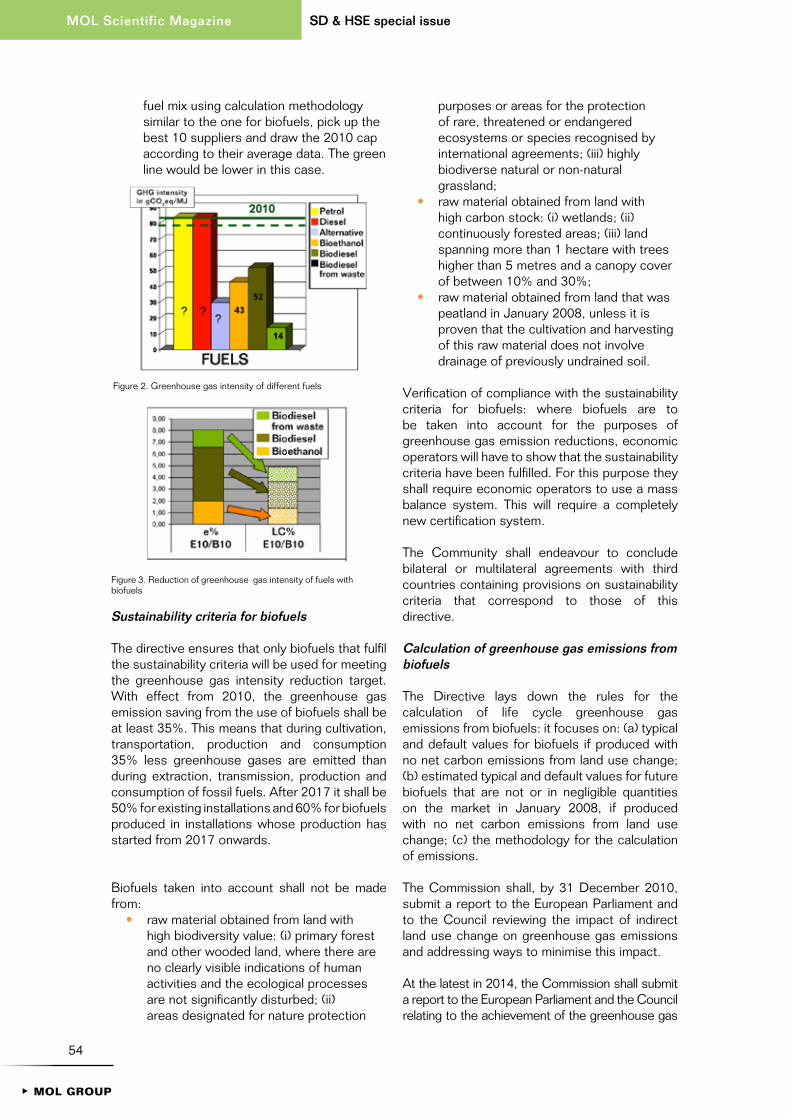
54
SD & HSE special issueMOL Scientific Magazine
1MOL GROUP
fuel mix using calculation methodology similar to the one for biofuels, pick up the best 10 suppliers and draw the 2010 cap according to their average data. The green line would be lower in this case.
Sustainability criteria for biofuels
The directive ensures that only biofuels that fulfil the sustainability criteria will be used for meeting the greenhouse gas intensity reduction target. With effect from 2010, the greenhouse gas emission saving from the use of biofuels shall be at least 35%. This means that during cultivation, transportation, production and consumption 35% less greenhouse gases are emitted than during extraction, transmission, production and consumption of fossil fuels. After 2017 it shall be 50% for existing installations and 60% for biofuels produced in installations whose production has started from 2017 onwards.
Biofuels taken into account shall not be made from:
• raw material obtained from land with high biodiversity value: (i) primary forest and other wooded land, where there are no clearly visible indications of human activities and the ecological processes are not significantly disturbed; (ii) areas designated for nature protection
purposes or areas for the protection of rare, threatened or endangered ecosystems or species recognised by international agreements; (iii) highly biodiverse natural or non-natural grassland;
• raw material obtained from land with high carbon stock: (i) wetlands; (ii) continuously forested areas; (iii) land spanning more than 1 hectare with trees higher than 5 metres and a canopy cover of between 10% and 30%;
• raw material obtained from land that was peatland in January 2008, unless it is proven that the cultivation and harvesting of this raw material does not involve drainage of previously undrained soil.
Verification of compliance with the sustainability criteria for biofuels: where biofuels are to be taken into account for the purposes of greenhouse gas emission reductions, economic operators will have to show that the sustainability criteria have been fulfilled. For this purpose they shall require economic operators to use a mass balance system. This will require a completely new certification system.
The Community shall endeavour to conclude bilateral or multilateral agreements with third countries containing provisions on sustainability criteria that correspond to those of this directive.
Calculation of greenhouse gas emissions from biofuels
The Directive lays down the rules for the calculation of life cycle greenhouse gas emissions from biofuels: it focuses on: (a) typical and default values for biofuels if produced with no net carbon emissions from land use change; (b) estimated typical and default values for future biofuels that are not or in negligible quantities on the market in January 2008, if produced with no net carbon emissions from land use change; (c) the methodology for the calculation of emissions.
The Commission shall, by 31 December 2010, submit a report to the European Parliament and to the Council reviewing the impact of indirect land use change on greenhouse gas emissions and addressing ways to minimise this impact.
At the latest in 2014, the Commission shall submit a report to the European Parliament and the Council relating to the achievement of the greenhouse gas
Figure 2. Greenhouse gas intensity of different fuels
Figure 3. Reduction of greenhouse gas intensity of fuels with biofuels
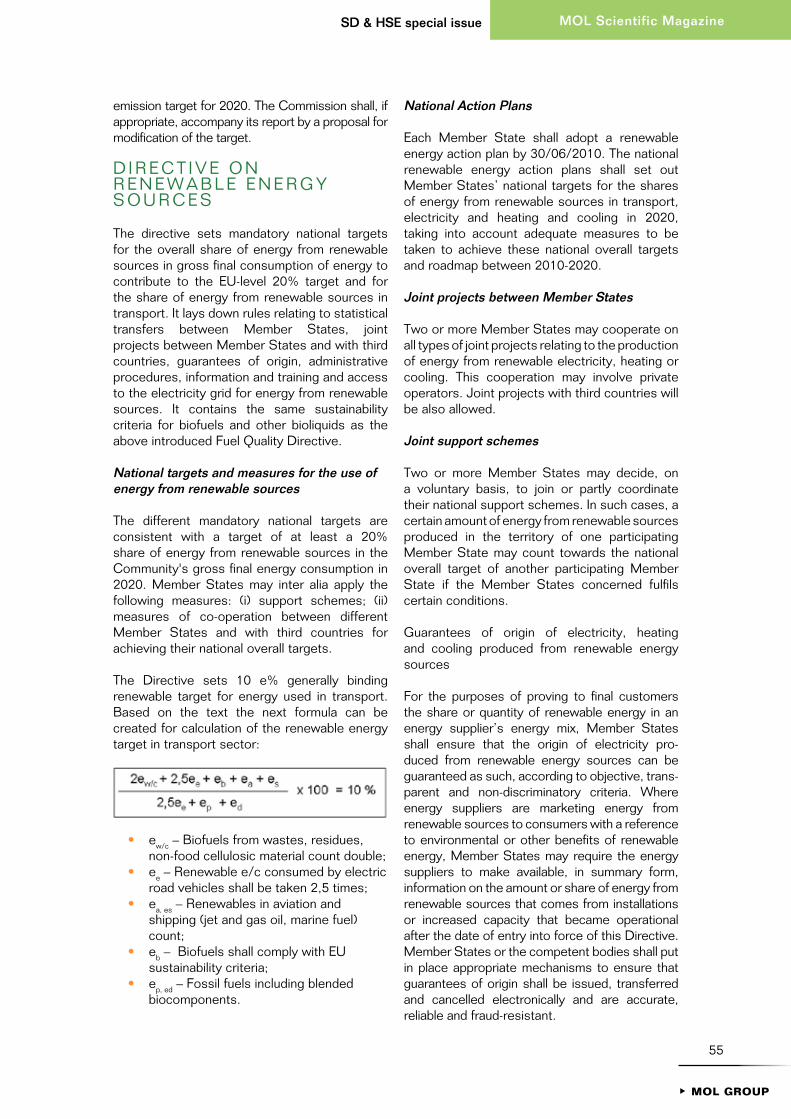
55
MOL Scientific MagazineSD & HSE special issue
1MOL GROUP
emission target for 2020. The Commission shall, if appropriate, accompany its report by a proposal for modification of the target.
D I R E C T I V E O N R E N E W A B L E E N E R G Y S O U R C E S
The directive sets mandatory national targets for the overall share of energy from renewable sources in gross final consumption of energy to contribute to the EU-level 20% target and for the share of energy from renewable sources in transport. It lays down rules relating to statistical transfers between Member States, joint projects between Member States and with third countries, guarantees of origin, administrative procedures, information and training and access to the electricity grid for energy from renewable sources. It contains the same sustainability criteria for biofuels and other bioliquids as the above introduced Fuel quality Directive.
national targets and measures for the use of energy from renewable sources
The different mandatory national targets are consistent with a target of at least a 20% share of energy from renewable sources in the Community's gross final energy consumption in 2020. Member States may inter alia apply the following measures: (i) support schemes; (ii) measures of co-operation between different Member States and with third countries for achieving their national overall targets.
The Directive sets 10 e% generally binding renewable target for energy used in transport. Based on the text the next formula can be created for calculation of the renewable energy target in transport sector:
• ew/c – Biofuels from wastes, residues, non-food cellulosic material count double;
• ee – Renewable e/c consumed by electric road vehicles shall be taken 2,5 times;
• ea, es – Renewables in aviation and shipping (jet and gas oil, marine fuel) count;
• eb – Biofuels shall comply with EU sustainability criteria;
• ep, ed – Fossil fuels including blended biocomponents.
national action Plans
Each Member State shall adopt a renewable energy action plan by 30/06/2010. The national renewable energy action plans shall set out Member States’ national targets for the shares of energy from renewable sources in transport, electricity and heating and cooling in 2020, taking into account adequate measures to be taken to achieve these national overall targets and roadmap between 2010-2020.
Joint projects between Member States
Two or more Member States may cooperate on all types of joint projects relating to the production of energy from renewable electricity, heating or cooling. This cooperation may involve private operators. Joint projects with third countries will be also allowed.
Joint support schemes
Two or more Member States may decide, on a voluntary basis, to join or partly coordinate their national support schemes. In such cases, a certain amount of energy from renewable sources produced in the territory of one participating Member State may count towards the national overall target of another participating Member State if the Member States concerned fulfils certain conditions.
Guarantees of origin of electricity, heating and cooling produced from renewable energy sources
For the purposes of proving to final customers the share or quantity of renewable energy in an energy supplier’s energy mix, Member Sta tes shall ensure that the origin of electricity pro-duced from renewable energy sources can be guaranteed as such, according to objective, trans-parent and non-discriminatory criteria. Where energy suppliers are marketing energy from renewable sources to consumers with a reference to environmental or other benefits of renewable energy, Member States may re quire the energy suppliers to make available, in summary form, information on the amount or share of energy from renewable sources that comes from installations or increased capacity that became operational after the date of entry into force of this Directive. Member States or the competent bodies shall put in place appropriate mechanisms to ensure that guarantees of origin shall be issued, transferred and cancelled electronically and are accurate, reliable and fraud-resistant.
56
1MOL GROUP
SD & HSE special issueMOL Scientific Magazine
access to and operation of the grids
Member States shall take the appropriate steps: (a) to develop transmission and distribution grid infrastructure, intelligent networks, storage facilities and the electricity system, in order to allow the secure operation of the electricity system as it accommodates the further development of electricity production from renewable energy sources, including interconnection between Member States, as well as third countries; (b) accelerate authorisation procedures for grid infrastructure and to coordinate approval of grid infrastructure with administrative and planning procedures.
Sustainability criteria for biofuels and other bioliquids
Energy from biofuels and other bioliquids shall be taken into account only if they fulfil criteria on sustainability.
Green shiftAnalysing corporate responses to climate change one can see a green revolution, a new approach, which is based on marrying the needs of business and the environment. Corporate leaders’ recognition of the dangers climate change pose to profitability and humanity is one reason behind the green shift. Another is alertness to the opportunities associated with it. These openings are divided into two categories. First, there are business opportunities associated with climate chaos and its mitigation. Secondly, as concern over climate change advances, opportunities associated with green branding swell. The EU Climate and Renewable Energy package is a step forward forcing EU industry to get “greener” as the present solutions based on the classical market philosophy are not capable confronting the scale of the problem of climate change.
References[1] The Times (1976) World's Temperature
Likely to Rise, 22 June 1976, p9 [2] UNEP and GRID-Arendal (2005)
Kyoto Protocol Timeline and History, Maps and Graphics Library, http://maps.grida.no/go/graphic/kyoto-protocol-timeline-and-history
[3] DG Environment (1998) Climate Change – Towards an EU Post-Kyoto Strategy, European Commission, COM-98-353 http://ec.europa.eu/environment/docum/pdf/98353_en.pdf
[4] Carbon Tax Centre (2008) Where Carbon is Taxed http://www.carbontax.org/progress/where-carbon-istaxed; National Centre for Environmental Economics (2008) Energy and Carbon Taxes, US Environmental Protection Agency – Economic Incentives for Pollution Control, 11-1-5-2 http://yosemite.epa.gov/EE/Epalib/incent.nsf/c484aff385a753cd85256c2c0057ce35/0483a144da8fa434852564f7004f3e68; Morris, D. (1994) Green Taxes Report, Institute for Local Self-Reliance, Washington DC, 'In 1992 Denmark introduced a carbon dioxide tax' http://www.ilsr.org/ecotax/greentax.html; Bruvoll, A. and Merethe-Larsen, B. (2002) Greenhouse Gas Emissions in Norway - Do Carbon Taxes Work, Discussion Paper 337, Research Department of Statistics Norway – http://ideas.repec.org/p/ssb/dispap/337.html.
[5] Department for Environment Food and Rural Affairs (2008) Emissions Trading Schemes, Climate Change and Energy, UK Government, 28 July 2008, http://www.defra.gov.uk/Environment/climatechange/trading
[6] Leigh, E. in (2004) The UK Emissions Trading Scheme – A New Way to Combat Climate Change, Fortysixth Report Session 2003-2004, House of Commons Committee of Public Accounts, Evidence q12, http://www.publications.parliament.uk/pa/cm200304/cmselect/cmpubacc/604/604.pdf
[7] European Parliament (2000) Green Paper on greenhouse gas emissions trading within the European Union, EP Publications Office, COM-2000-0087 final, 8 March 2000, http://eurlex.europa.eu/LexUriServ/LexUriServ.do?uri=CELEX:52000DC0087:EN:HTML
[8] Directive 2003/87/EC of the European Parliament and of the Council of 13 October 2003 establishing a scheme for greenhouse gas emission allowance trading within the Community and amending Council Directive 96/61/EC http://eur-lex.europa.eu/LexUriServ/LexUriServ.do?uri=CONSLEG:2003L0087:20041113:EN:PDF
[9] Smith, K. (2007) Pollute and Profit,

57
1MOL GROUP
MOL Scientific MagazineSD & HSE special issue
Parliamentary Brief, May 2007, p30 http://www.thecornerhouse.org.uk/pdf/document/ParlBrief.pdf
[10] IPoint Carbon (2007) Generators Lobby Against Spanish Windfall Profit Legislation, 17 December 2007, http://int.pointcarbon.com/Home/News/All%20news/article25979-703.html
[11] White Paper for a Community Strategy and Action Plan COM(97)599 final http://ec.europa.eu/energy/library/599fi_en.pdf
[12] Directive 2001/77/EC of the European Parliament and of the Council of 27 September 2001 on the promotion of electricity produced from renewable energy sources in the internal electricity market http://eurlex.europa.eu/smartapi/cgi/sga_doc?smartapi!celexplus!prod!DocNumber&lg=en&type_doc=Directive&an_doc=2001&nu_doc=77
[13] Directive 2003/30/EC of the European Parliament and of the Council of 8 May 2003 on the promotion of the use of
biofuels or other renewable fuels for transport
Ihttp://eur-lex.europa.eu/LexUriServ/LexUriServ.do?uri=OJ:L:2003:123:0042:0046:EN:PDF
[14] European Parliament legislative resolution of 17 December 2008 on the proposal for a directive of the European Parliament and of the Council amending Directive 2003/87/EC so as to improve and extend the greenhouse gas emission allowance trading system of the Community http://www.europarl.europa.eu/sides/getDoc.do?type=TA&language=EN&reference=P6-TA-2008-0610
[15] European Parliament legislative resolution of 17 December 2008 on the proposal for a directive of the European Parliament and of the Council on the promotion of the use of energy from renewable sources http://www.europarl.europa.eu/sides/getDoc.do?type=TA&language=EN&reference=P6-TA-2008-0609
58
1MOL GROUP
SD & HSE special issueMOL Scientific Magazine
AbstractIn year 2004 MOL has launched the “Safe Workplaces” project to improve the safety culture and to implement Group level comprehensive Process Safety Management (PSM) system.Basic mission of the new PSM system is adaptation and implementation of a control system for all our hazardous processes, which is based on inter-national experience and is suitable for managing all key factors, including human factor, which plays a significant role in unexpected HSE events. This is a clear operative commitment to MOL´s HSE Policy: “to reduce risk arising from our technologies, operations end products to a reasonably acceptable level”.The aim of this article is to briefly present the PSM – a worldwide recog-nized safety management system for hazardous processes, the method of its implementation and functioning within the MOL Group, and also the first results and future direction of its development.
ÖsszefoglalásFolyamat biztonsági irányítási rendszer a MOL Csoportnál
A MOL 2004-ben indította a “Biztonsá-gos munkahelyek” címû projektet a biz-tonsági kultúra javítására és egy csoport szintû átfogó folyamat biztonsági irányí-tási rendszer (PSM) bevezetésésre. Az új PSM rendszer fô célja egy olyan nem-zetközi gyakorlatnak megfelelô kontroll rendszer alkalmazása az összes veszé-lyes folyamatunkra mely minden kulcs tényezô kezelésére alkalmas, beleértve az emberi tényezôt is, melynek kiemelt szerepe van a rendkívüli EBK esemé-nyek elôfordulásában. Ez egyben a MOL EBK politika iránti elkötelezettség op-eratív teljesítése: „technológiáinkból, ezek üzemeltetésésbôl és a termékeink felhasználásából eredô EBK kockázatok csökkentése egy egyszerûen elfogad-ható szintre”.Ennek a cikknek a célja a PSM rendszer rövid bemutatása, a Csoport szintû bev-ezetés és alkalmazási mód ismertetése és az eddig elért eredmények és a lehet-séges további fejlôdés felvázolása.
IntroductionIn 2004, MOL has decided to improve its safety performance in order to be in line with the top quarter of leading oil companies, and thereby demonstrate the operating excellence of the company. This goal has been also expressed in exact numbers in a form of the decrease in the LTIF (an indicator measuring the number of lost time injuries against one million hours worked) from 2.6 in 2003 to the value lower than 1.0 in 2008, while the existing significant performance differences in the safety performance between individual divisions were to be removed. In order to achieve this daring goal, the Safe Workplaces
Process SafetyManagement
in the MOL Group
Vojtech HarčaAdvisorMOL Group SD&HSE, Slovnaft. a.s.E-mail: [email protected]
Boris CavrakHSE Advisor RefiningMOL Group SD&HSE, MOL PLc.E-mail: [email protected]

59
MOL Scientific MagazineSD & HSE special issue
1MOL GROUP
in the MOL Group
project has been launched under the leadership of the HSE Unit with effective assistance provided by experts from DuPont.
Prior to the launch of the works, DuPont has carried out an introductory audit first in MOL Plc, and later in Slovnaft a.s. and TVK Plc, in order to identify weaknesses and to design appropriate recommendations for improvement. This information has been very important for the detailed project planning for the upcoming years.
The Safe Workplaces project has been divided into two main parts. The first part has been focused on the overall increase in the safety culture (cultural attitude to safety) on all levels, i.e. from the top management up to the employees who carry out hazardous activities on a day-to-day basis. Upon the completion of an extensive training programme, a system of regular behaviour audits has been put in place. These audits are carried out by line managers in order to identify hazardous acts prior to their escalation into extraordinary events.
After achieving sufficient awareness with regard to the importance of safety and operational discipline, it has been possible to proceed to the second – technically very demanding – part of the project, i.e. the development of the Process Safety Management system – PSM. MOL is well
aware of the fact that the achievement of very favourable statistical indicators in the area of the traditional work safety often leads to wrong spreading of the feeling of safety also within very hazardous processes, where extraordinary events occur very rarely, however, with all the more significant consequences. The following table shows that it is clear why separate assessment and systematic improvement in the Hazardous Process Management are so important.
The history of PSMUnexpected releases of toxic, reactive, or flammable liquids and gases in processes involving highly hazardous chemicals have been reported for many years in various industries that use chemicals with such properties. Regardless
Major incidents OH&S incidentsUnexpected KnownInfrequent Very oftenSystematic BehaviouralDifficult to measure MeasurableRemote PersonalDifficult to forecast Predictable from lagging KPIsLong feedback loop quick feedback
Table 1. Comparison of traditional and major incidents
MOL Scientific MagazineSD & HSE special issue

60
SD & HSE special issueMOL Scientific Magazine
1MOL GROUP
of the industry that uses these highly hazardous chemicals, there is a potential for an accidental release any time if they are not properly controlled, creating the possibility of disaster.
To help ensure safe and healthful workplaces, US Occupational Safety and Health Administration (OSHA) has issued in 1992 the Process Safety Management (PSM) of Highly Hazardous Chemicals rule, 29 CFR 1910.119. OSHA's standard emphasizes the management of hazards associated with highly hazardous chemicals and establishes a comprehensive management program that integrates technologies, procedures, and management practices.
The roots of today's rules extend back more than 30 years. Process safety management was an industry response to a series of industrial accidents such as the 1974 Flixborough explosion, the 1976 Seveso dioxin release and the 1984 methyl isocynate release in Bhopal.
In response to Bhopal, US Environmental Protection Agency (EPA) initiated a voluntary Chemical Emergency Preparedness Program (CEPP) in 1985. In 1986 US Congress passed the Superfund Amendments and Reauthorization Act (SARA), which included requirements under Title III, known as the Emergency Planning and Community Right-to-Know Act. EPA's approach was that the key to accident prevention is management commitment and support to safety.
The Philips polyethylene explosion in Pasadena in 1989 fueled concerns that industry was not moving quickly enough to institute effective process safety management and helped to convince legislators to add accidental release provisions in the 1990 CAAA (Clear Air Act Amendments). These provisions resulted in 1992 in US OSHA PSM rule, 29 CFR 1910.119, and in 1996 in the US EPA Risk Management Program (RMP) rule, 40 CFR 68.
In 1982 the European Community adopted the Seveso Directive (82/501/EEC) which requires facilities handling certain hazardous chemicals to develop a safety policy and a safety report. In 1996 the Council of the European Union adopted Seveso II Directive on the control of major-accident hazards involving dangerous substances (96/82/EC) with focus on establishments instead on the individual installations.
Similarly to Seveso II Directive, the PSM and RMP rules adds requirements to conduct a
hazard assessment that evaluate potential effects of an accidental release of any regulated substances and expands on the requirements for the emergency response program.
Facilities that are setting up an integrated PSM programs have quickly recognized that the effort is resource intensive, but benefits the organization in many ways, like:
• Increased plant efficiency,• Improved communication (internally,
externally),• Reduced rework and downtime,• Streamlined business processes,• Improved safety culture,• Improved business performance.
The requirements in the OSHA PSM and EPA RMP rules were based on good industry practices and were influenced largely by an active industry role, like:
• DuPont Process Hazards Management (PHM) Guideline, issued in 1979, now generally referred to as Process Safety Management (PSM),
• Chemical Manufacturers’ Association (CMA) Process Safety Management Code,
• AIChE’s Center for Chemical Process Safety’s Guidelines for Technical Management of Chemical Process Safety,
• American Petroleum Institute’s (API) Recommended Practice 750, Management of Process Hazards.
The presumption of EPA RMP is to protect public health and environment, of OSHA PSM to protect workers and process technology and of Seveso II Directive to prevent major accidents which involve dangerous substances and the limitation of their consequences for man and the environment. The approach is similar – operator is obliged to implement proper safety management system if hazard substances are present inside establishment in quantities above defined threshold level.
The PSM system implemented within the MOL GroupPSM system established at MOL is a mana-ge ment system addressing all elements of the process safety to methodologically identify,
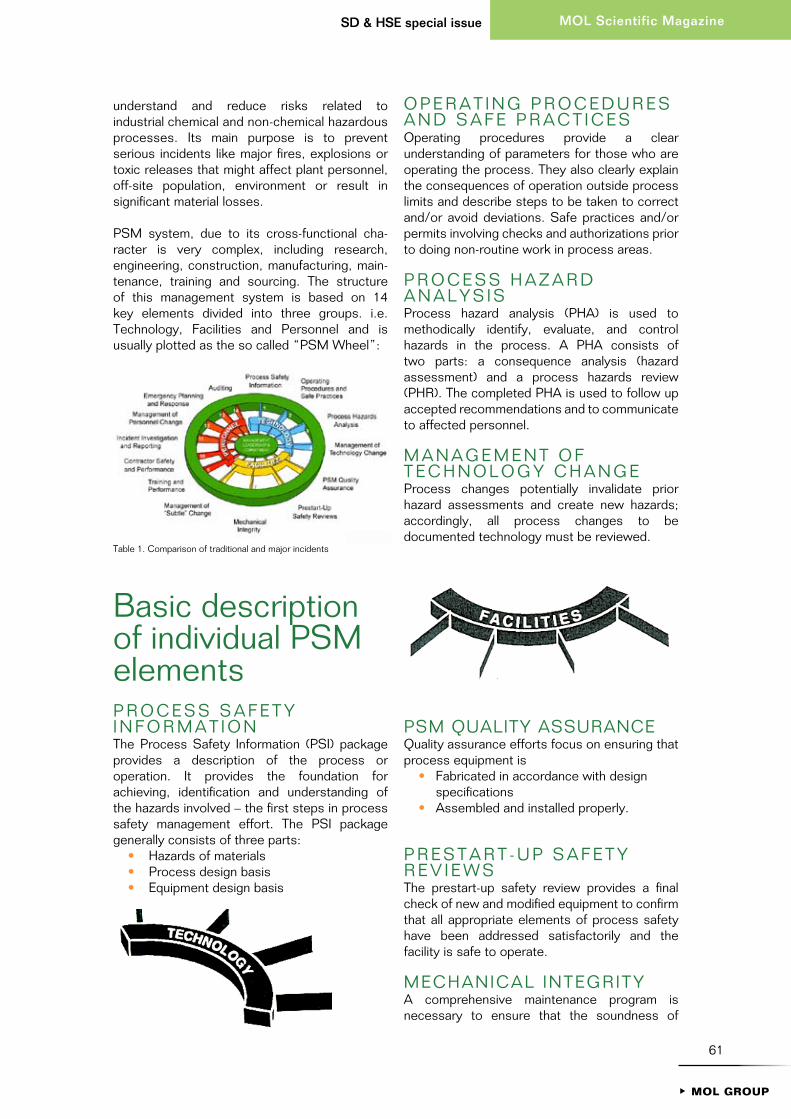
61
MOL Scientific MagazineSD & HSE special issue
1MOL GROUP
understand and reduce risks related to industrial chemical and non-chemical hazardous processes. Its main purpose is to prevent serious incidents like major fires, explosions or toxic releases that might affect plant personnel, off-site population, environment or result in significant material losses.
PSM system, due to its cross-functional cha-racter is very complex, including research, engineering, construction, manufacturing, main-tenance, training and sourcing. The structure of this management system is based on 14 key elements divided into three groups. i.e. Technology, Facilities and Personnel and is usually plotted as the so called “PSM Wheel”:
Basic description of individual PSM elementsP R O C E S S S A F E T Y I N F O R M A T I O NThe Process Safety Information (PSI) package provides a description of the process or operation. It provides the foundation for achieving, identification and understanding of the hazards involved – the first steps in process safety management effort. The PSI package generally consists of three parts:
• Hazards of materials• Process design basis• Equipment design basis
O P E R A T I N G P R O C E D U R E S A N D S A F E P R A C T I C E SOperating procedures provide a clear understanding of parameters for those who are operating the process. They also clearly explain the consequences of operation outside process limits and describe steps to be taken to correct and/or avoid deviations. Safe practices and/or permits involving checks and authorizations prior to doing non-routine work in process areas.
P R O C E S S H A Z A R D A N A L Y S I SProcess hazard analysis (PHA) is used to methodically identify, evaluate, and control hazards in the process. A PHA consists of two parts: a consequence analysis (hazard assessment) and a process hazards review (PHR). The completed PHA is used to follow up accepted recommendations and to communicate to affected personnel.
M A N A G E M E N T O F T E C H N O L O G Y C H A N G EProcess changes potentially invalidate prior hazard assessments and create new hazards; accordingly, all process changes to be documented technology must be reviewed.
PSM qUALITY ASSURANCEquality assurance efforts focus on ensuring that process equipment is
• Fabricated in accordance with design specifications
• Assembled and installed properly.
P R E S T A R T - U P S A F E T Y R E V I E W SThe prestart-up safety review provides a final check of new and modified equipment to confirm that all appropriate elements of process safety have been addressed satisfactorily and the facility is safe to operate.
MECHANICAL INTEGRITYA comprehensive maintenance program is necessary to ensure that the soundness of
Table 1. Comparison of traditional and major incidents

62
SD & HSE special issueMOL Scientific Magazine
1MOL GROUP
process equipment is maintained from the time of initial installation throughout the life of the facility.
8 . M A N A G E M E N T O F “ S U B T L E ” C H A N G EChanges to facilities within the documented technology (i.e., process safety information) that are not replacement in kind, must receive appropriate review and authorization prior to implementation.
9 . T R A I N I N G A N D P E R F O R M A N C EProperly trained and performing personnel are a requirement for keeping process equipment and machinery operating safely. Employees must also be physically able, mentally alert, and capable of using good judgement to properly follow prescribed practices. All other elements of PSRM can be in place, but without properly trained and performing personnel, the chances of safe process operation are greatly diminished.
1 0 . C O N T R A C T O R S A F E T Y A N D P E R F O R M A N C EAll tasks must be completed safely and performed in accordance with established procedures and/or safe work practices, consistent with the principles of good PSRM, whether the tasks are completed by site personnel or by contract personnel.
1 1 . I N C I D E N T I N V E S T I G A T I O N A N D R E P O R T I N GSerious and serious potential incidents are likely to recur unless positive steps are taken. Aggressive and persistent investigation of all serious and serious potential incidents is necessary to continuously improve safety performance.
1 2 . M A N A G E M E N T O F P E R S O N N E L C H A N G EA minimum level of collective experience and knowledge is required of the operating, maintenance, and technical group assigned to a process area in order to provide a solid base for decisions that can affect process safety.
1 3 . E M E R G E N C Y P L A N N I N G A N D R E S P O N S EIn-depth planning for potential emergencies is required so that effective response by the site with the community can mitigate the impact on people and the environment.
1 4 . A U D I T I N GAuditing provides a measurement of compliance with the established PSM program. Field observations yield data for determining performance against established standards.
The implementation processThe first series of trainings has included the basic PSM Training for line managers on various levels and subsequent transfer of the specific know-how to selected experts of the MOL Group within 14 one-day trainings focused on 14 PSM elements. As found out later, this theoretic knowledge has not been sufficient for the practical implementation of the PSM within respective hazardous operations. We realized we need a dedicated DuPont consultant on site with practical experience in PSM system implementation, who can provide practical support and is able to propose MOL specific solutions.
After becoming familiar with the specifics of the work within MOL, this expert has helped us to organize and carry out in the period of 2007-8 the second series of workshops for 120 experts from Hungary, Slovakia, and Romania. At these custom-designed workshops our specialists have learnt with the use of a selected MOL facility as an example, how and what to do in their own operations in order to implement the PSM system requirements in the best and most effective possible manner. One of the basic PSM workshops organized for the PS engineers has also included the TtT module (Train the Trainer) intended to provide the MOL employees with the skills required for the dissemination of the PSM programme at their own workplaces, and

63
MOL Scientific MagazineSD & HSE special issue
1MOL GROUP
thereby ensure the self-sufficiency of the MOL Group during the maintenance, dissemination and further development of the PSM system. After obtaining understanding of the scope and complexity of the PSM, suitable experts have been selected and appointed by the Heads of respective Divisions and Subsidiaries as the so-called PS Engineers who coordinate the PSM implementation on their sites. Their first task has been to perform a Gap Analysis, i.e. the identification of the differences between the implemented practice and recommendations of the PSM system. This work has been facilitated by drawing up the PSM Manual of the MOL Group in cooperation with an expert from the DuPont's consulting company, since this Manual has summarized all the requirements of the system in the form intelligible to MOL employees. Later, this Manual has been re-transformed into the PSM Global Operative Regulation which has become part of the regulatory system of the MOL Group.
Moreover so-called Task Forces have been formed in order to provide technical assistance during the implementation and development of the PSM, bringing together the best experts for the given element of the system from the whole Group.
The next step on the bumpy road of imple-mentation has been the planning of activities necessary for successful assurance of the compliance with the PSM requirements. First, a three-year top-down implementation plan has been prepared, approved by Group level HSE Commission within the meaning of which the PSM will be implemented during the period 2007-09 in the companies involved in the Safe Workplaces project.
The PSM Manual of the Divisions and Subsidiaries has become the basic PSM document at operations. It consists of two parts: the system part specifying the divisional PSM organization structure and work team (network), responsibilities, list of hazardous processes, so-called PSM critical, etc., and the second part is the planning part stating the specific tasks with deadlines for the implementation of each PSM element. In doing so we have taken account of the fact that many PSM elements have already been more or less implemented in the respective MOL organisational units. Thus, it has sufficed just to adapt the existing "PSM similar" processes and include them in the new system being built. Thus, the PSM – safety system used for processes worldwide has become for many a
“ruler” used to measure whether they fall short or are ahead of the world leaders.
After developing an effective and efficient PSM system, the focus of the work has been shifted to respective technologies, logistic terminals, workshops, extractive equipment, etc. where the obtained knowledge and capabilities in combination with hard every-day work will contribute to an increase in the safety of hazardous processes.
The PSM in practiceT H E S C O P E
According to HSE Management System defined in the new Group guideline PSM must be applied to all hazardous processes operated by MOL Group member company majority owned or operationally controlled by MOL. This includes integrated business divisions and organizational units, legal entities, sites or activities provided on MOL Group sites.
PSM is applied to all PSM critical operations, i.e. to high hazard processes usually including high volume of hazardous materials (e.g. all “SEVESO type” sites, pipe lines, transportation activities), but also to low hazard, very often non-chemical operations (rotating equipments, drilling, packing) although in this case not all PSM elements must be applied. Requirement for PSM implementation must be based on detailed risk analysis.
T H E S T R U C T U R A L E L E M E N T S O F O U R S Y S T E M
Successful implementation of the PSM in practice is based on the following four pillars:
1. Know-how
The necessary knowledge has been taken from DuPont during numerous workshops and trainings: basic PSM trainings for line managers and PS engineers concerning the whole system, theoretical one-day workshops for experts concerning the 14 elements of the system, practical implementation workshops, the Train the Trainer course, etc. Training materials (modules) available on MOL's intranet have been created
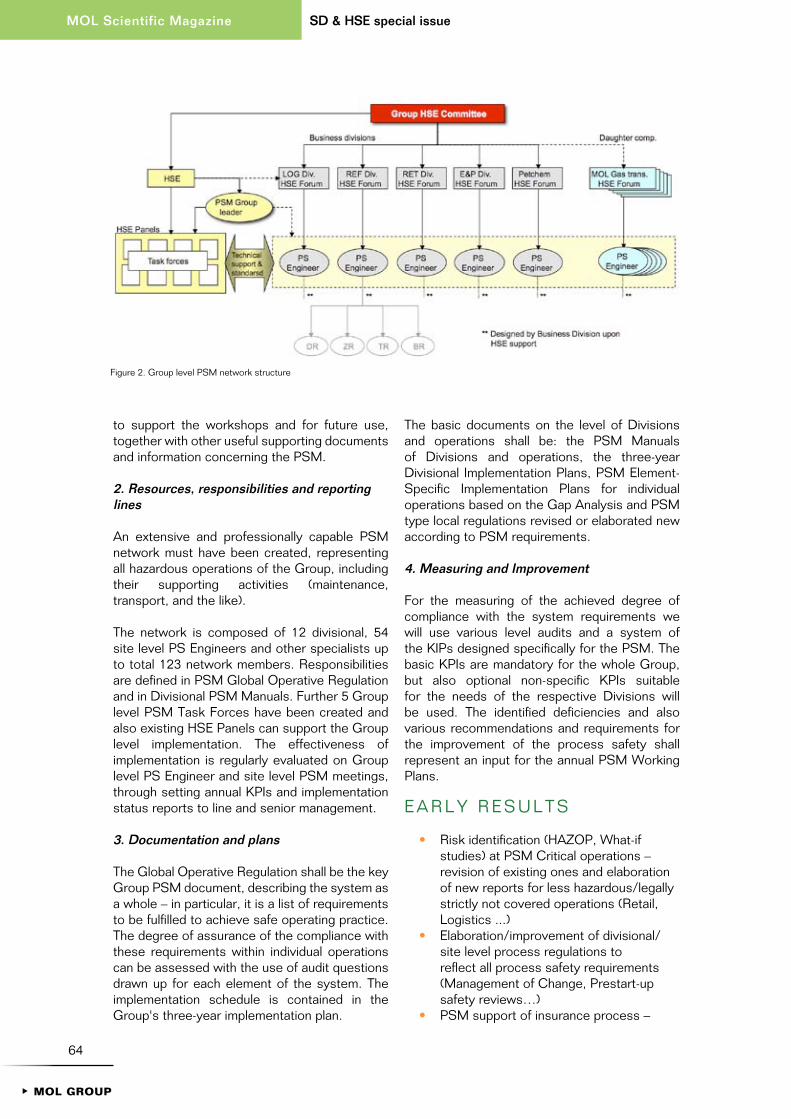
64
SD & HSE special issueMOL Scientific Magazine
1MOL GROUP
to support the workshops and for future use, together with other useful supporting documents and information concerning the PSM.
2. Resources, responsibilities and reporting lines
An extensive and professionally capable PSM network must have been created, representing all hazardous operations of the Group, including their supporting activities (maintenance, transport, and the like).
The network is composed of 12 divisional, 54 site level PS Engineers and other specialists up to total 123 network members. Responsibilities are defined in PSM Global Operative Regulation and in Divisional PSM Manuals. Further 5 Group level PSM Task Forces have been created and also existing HSE Panels can support the Group level implementation. The effectiveness of implementation is regularly evaluated on Group level PS Engineer and site level PSM meetings, through setting annual KPIs and implementation status reports to line and senior management.
3. Documentation and plans
The Global Operative Regulation shall be the key Group PSM document, describing the system as a whole – in particular, it is a list of requirements to be fulfilled to achieve safe operating practice. The degree of assurance of the compliance with these requirements within individual operations can be assessed with the use of audit questions drawn up for each element of the system. The implementation schedule is contained in the Group's three-year implementation plan.
The basic documents on the level of Divisions and operations shall be: the PSM Manuals of Divisions and operations, the three-year Divisional Implementation Plans, PSM Element-Specific Implementation Plans for individual operations based on the Gap Analysis and PSM type local regulations revised or elaborated new according to PSM requirements.
4. Measuring and Improvement
For the measuring of the achieved degree of compliance with the system requirements we will use various level audits and a system of the KIPs designed specifically for the PSM. The basic KPIs are mandatory for the whole Group, but also optional non-specific KPIs suitable for the needs of the respective Divisions will be used. The identified deficiencies and also various recommendations and requirements for the improvement of the process safety shall represent an input for the annual PSM Working Plans.
E A R L Y R E S U L T S
• Risk identification (HAZOP, What-if studies) at PSM Critical operations – revision of existing ones and elaboration of new reports for less hazardous/legally strictly not covered operations (Retail, Logistics ...)
• Elaboration/improvement of divisional/site level process regulations to reflect all process safety requirements (Management of Change, Prestart-up safety reviews…)
• PSM support of insurance process –
Figure 2. Group level PSM network structure
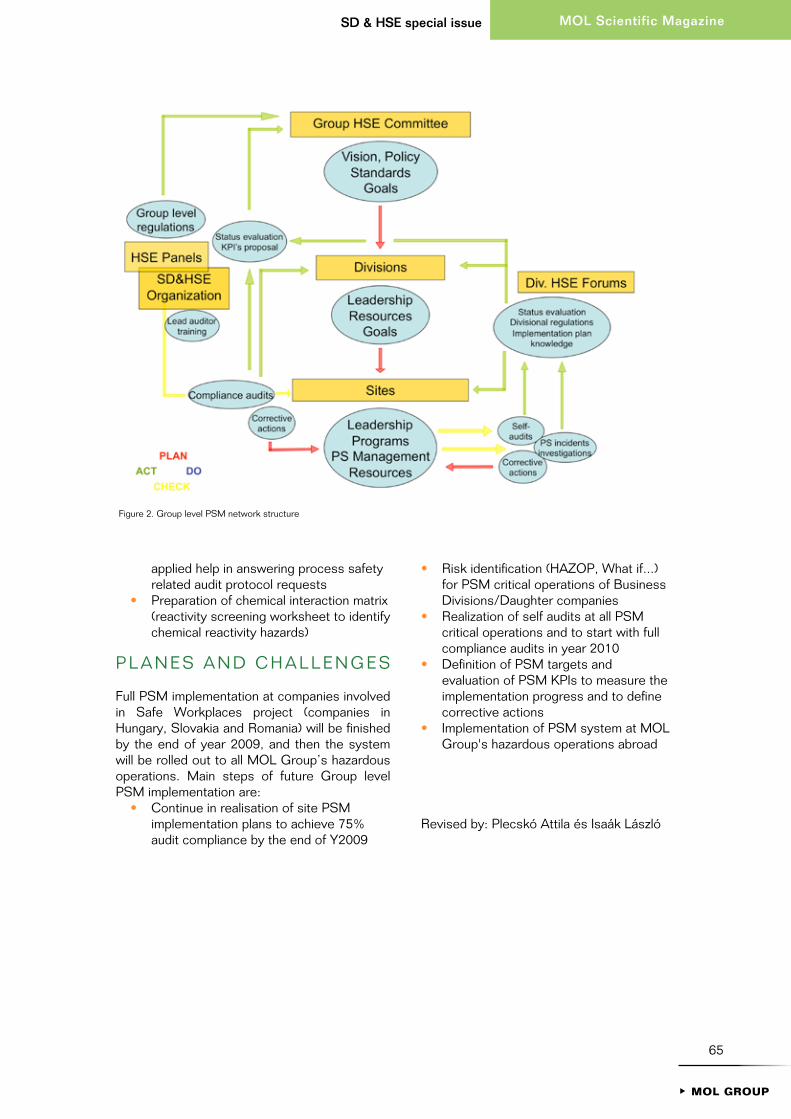
65
MOL Scientific MagazineSD & HSE special issue
1MOL GROUP
applied help in answering process safety related audit protocol requests
• Preparation of chemical interaction matrix (reactivity screening worksheet to identify chemical reactivity hazards)
P L A N E S A N D C H A L L E N G E S
Full PSM implementation at companies involved in Safe Workplaces project (companies in Hungary, Slovakia and Romania) will be finished by the end of year 2009, and then the system will be rolled out to all MOL Group’s hazardous operations. Main steps of future Group level PSM implementation are:
• Continue in realisation of site PSM implementation plans to achieve 75% audit compliance by the end of Y2009
• Risk identification (HAZOP, What if...) for PSM critical operations of Business Divisions/Daughter companies
• Realization of self audits at all PSM critical operations and to start with full compliance audits in year 2010
• Definition of PSM targets and evaluation of PSM KPIs to measure the implementation progress and to define corrective actions
• Implementation of PSM system at MOL Group's hazardous operations abroad
Revised by: Plecskó Attila és Isaák László
Figure 2. Group level PSM network structure

66
SD & HSE special issueMOL Scientific Magazine
1MOL GROUP

67
SD & HSE special issue
1MOL GROUP
MOL Scientific Magazine
AbstractThe global market for biofuels is expected to grow significantly in the coming decades. Most analysts are predicting particularly strong growth fostered by second generation biofuels. In February 2007, EU energy ministers agreed to increase the share of biofuels used in road transport to 10% by 2020. The strongest players at the fuel market are focused on crucial emerging second generation biofuels – those produced from non-food feedstocks such as residues from agriculture, from forestry or from waste. By using non-food feedstocks, such as woodchips and straw, second generation biofuels do not compete with food crops and they offer an efficient way to manage agricultural waste. They also offer greater CO2 reduction benefits. It is expected that WTW CO2 reduction can be reduced by 90 % when using biofuels at 100 % concentration. And – if produced on a commercial scale, biofuels have the potential to reach price parity with conventional gasoline and diesel. Significant commercial quantities of competitive biofuels are, however, still not expected to become available for the next 5 to 10 years.
Part IBiofuels for Otto enginesC E L L U L O S I C E T H A N O L
Ethanol, today, is produced mostly from sugars or starches, obtained from fruits and grains. In contrast, cellulosic ethanol (also called lignocellulosic ethanol, or CeEtOH) is a type of biofuel produced from lignocellulose, a structural material that comprises much of the mass of plants, the main component of wood and straw. Since cellulose cannot be digested by humans, the production of cellulose does not compete with the production of food. The price per ton of the raw material is thus much cheaper than grains or fruits. Moreover, since cellulose is the main components of plants, the whole plant can be harvested. This results in much better yields per acre – up to 10 tons, instead of 4 or 5 tons for the best crops of grain.
Lignocellulose is composed mainly of cellulose, hemicellulose and lignin. Corn stover, switch grass, miscanthus and woodchip are some of the more popular cellulosic materials for ethanol production. Cellulosic ethanol is chemically identical to ethanol from other sources, such as corn starch or sugar, but has the advantage that the lignocellulose raw material is highly abundant and diverse. However, it differs in that it requires a greater amount of processing to make the sugar monomers available to the microorganisms that are typically used to produce ethanol by fermentation [1].
Switchgrass is the major biomass material being studied today, due to its high levels of cellulose. Cellulose, however, is contained in nearly every natural, free-growing plant, tree,
Michal ŠingliarRenewables SN DS Development, Slovnaft, a.s. E-mail: [email protected]
Miroslav DolnákRenewables SN DS Development, Slovnaft, a.s.E-mail: [email protected]
BIOFUELSfor Second Generation of
Emerging Technologies

68
SD & HSE special issueMOL Scientific Magazine
1MOL GROUP
and bush, in meadows, forests, and fields all over the world without agricultural effort or cost needed to make it grow. Whether distilled from agricultural crops such as corn, wheat, barley or created from cellulose, ethanol is ethyl alcohol. It is identical in chemical composition regardless of the source thus calling it cellulosic ethanol is initially misleading because it (cellulosic ethanol) is no different physically from corn ethanol or wheat ethanol. In essence, the term is used to describe the process for producing the alcohol rather than specifying a type of ethanol.
P R O D U C T I O N M E T H O D S
There are two broad ways of producing alcohol from cellulose:
• Hydrolysis breaks down the cellulose chains into sugar molecules that are then fermented and distilled
• Gasification transforms the lignocellulosic raw material into gaseous carbon monoxide and hydrogen that is then fed to a special kind of fermenter or to a catalyst bed (e.g. the Fischer-Tropsch process)
Hydrolysis processes
There are four or five stages in this process:• A "pre-treatment" phase, to make the raw
material such as wood or straw amenable to hydrolysis;
• Hydrolysis, to break down the molecules
of cellulose into sugars; • Separation of the sugar solution from the
residual materials, notably lignin; • Yeast fermentation of the sugar solution; • Distillation to produce 99.5% pure
alcohol.
Alternatively, instead of producing and recovering the enzymes to do the hydrolysis and fermentation separately, it is possible to use bacteria that does both. The cellulose molecules are composed of long chains of glucose molecules. In the hydrolysis process, these chains are broken down to "free" the sugar, before it is fermented for alcohol production. There are two major hydrolysis processes: a chemical reaction using acids, or an enzymatic reaction.
Chemical hydrolysisIn the traditional methods developed in the 19th century and at the beginning of the 20th century, hydrolysis is performed by attacking the cellulose with an acid. Diluted acid may be used under high heat and high pressure, or more concentrated acid can be used at lower temperatures and atmospheric pressure. A decrystalized cellulosic mixture of acid and sugars reacts in the presence of water to complete individual sugar molecules (hydrolysis). The product from this hydrolysis is then neutralized and yeast fermentation is used to produce ethanol. A significant obstacle to the diluted acid process is that the hydrolysis is so harsh that toxic degradation products are produced which is a hurdle for fermentation.
Figure 1. Cellulosic ethanol production via chemical (acid) hydrolysis

69
MOL Scientific MagazineSD & HSE special issue
1MOL GROUP
Concentrated acid must be separated from the sugar stream for recycle (simulated moving bed (SMB) chromatographic separation for example) to be commercially attractive.
Enzymatic HydrolysisCellulose chains can be broken into glucose molecules by cellulase enzymes. This reaction occurs at body temperature in the stomach of ruminants such as cows and sheep, where the enzymes are produced by bacteria—there are actually at least three enzymes, used at various stages of this conversion. If the enzymatic hydrolysis process takes place with previously isolated enzymes, a steady supply of the cellulase enzymes is needed.
Neither process generates toxic emissions when it produces ethanol. According to US Department of Energy studies conducted by the Argonne Laboratories of the University of Chicago, one of the benefits of cellulosic ethanol is that it reduces greenhouse gas emissions
(GHG) by 85% over reformulated gasoline. By contrast, starch ethanol (e.g., from corn), which uses most of the time natural gas to provide energy for the process, reduces GHG emissions by 18% to 29% over gasoline. Sugar ethanol, on the other hand, from sugarcane, reduces greenhouse gas emissions by as much
as cellulosic ethanol because it uses sugarcane bagasse to provide the energy for the process and the excess to make electricity for the grid. Cellulosic ethanol production currently exists at "pilot" and "commercial demonstration" scale.
I O G E N P R O C E S S
In April 2004, Iogen Corporation, a Canadian biotechnology firm, became the first business to commercially sell cellulosic ethanol, though in very small quantities. The primary consumer thus far has been the Canadian government, which, along with the United States government (particularly the Department of Energy's National Renewable Energy Laboratory), has invested millions of dollars into assisting the commercialization of cellulosic ethanol. Iogen Corporation is promoting an enzymatic hydrolysis process that uses "specially engineered enzymes". The raw material (wood or straw) has to be pre-treated to make it amenable to hydrolysis [2].
Process Overview
Iogen technology makes it economically feasible to convert biomass into cellulose ethanol using a combination of thermal, chemical and biochemical techniques. The yield of cellulose ethanol is more than 340 litres per tonne of
Figure 2. Second generation of biofuels production via enzymatic hydrolysis
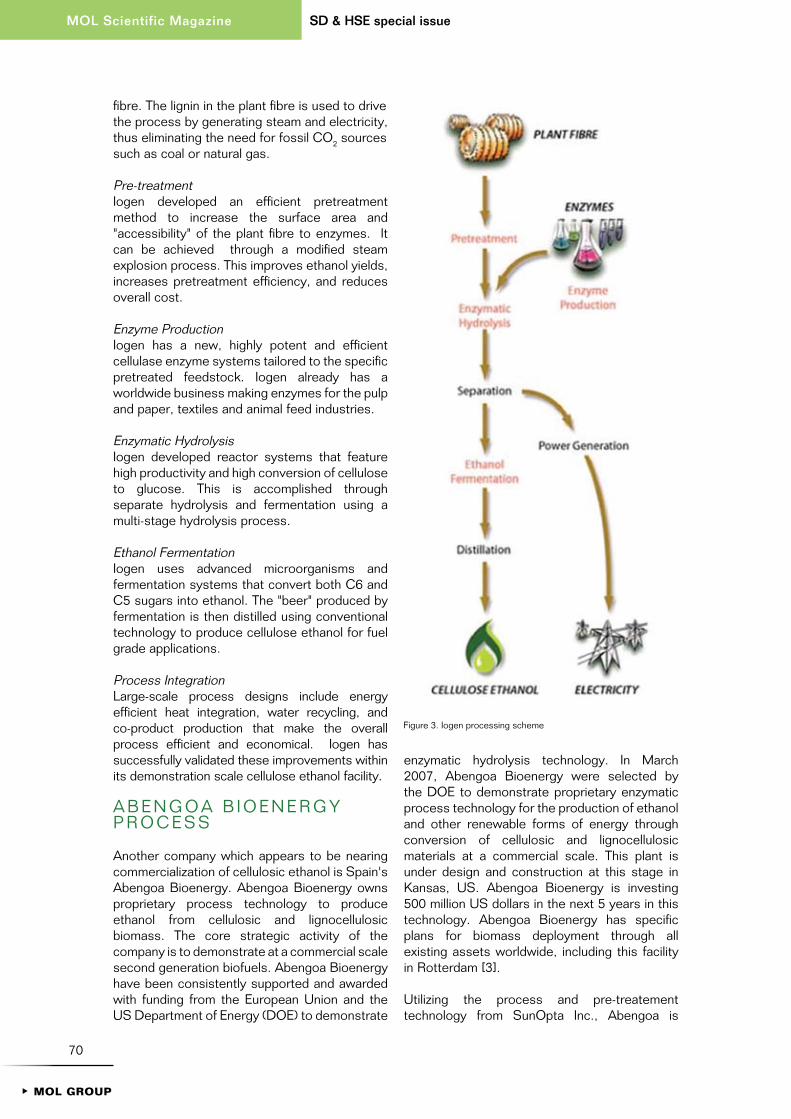
70
SD & HSE special issueMOL Scientific Magazine
1MOL GROUP
fibre. The lignin in the plant fibre is used to drive the process by generating steam and electricity, thus eliminating the need for fossil CO2 sources such as coal or natural gas.
Pre-treatmentIogen developed an efficient pretreatment method to increase the surface area and "accessibility" of the plant fibre to enzymes. It can be achieved through a modified steam explosion process. This improves ethanol yields, increases pretreatment efficiency, and reduces overall cost.
Enzyme ProductionIogen has a new, highly potent and efficient cellulase enzyme systems tailored to the specific pretreated feedstock. Iogen already has a worldwide business making enzymes for the pulp and paper, textiles and animal feed industries.
Enzymatic HydrolysisIogen developed reactor systems that feature high productivity and high conversion of cellulose to glucose. This is accomplished through separate hydrolysis and fermentation using a multi-stage hydrolysis process.
Ethanol FermentationIogen uses advanced microorganisms and fermentation systems that convert both C6 and C5 sugars into ethanol. The "beer" produced by fermentation is then distilled using conventional technology to produce cellulose ethanol for fuel grade applications.
Process IntegrationLarge-scale process designs include energy efficient heat integration, water recycling, and co-product production that make the overall process efficient and economical. Iogen has successfully validated these improvements within its demonstration scale cellulose ethanol facility.
A B E N G O A B I O E N E R G Y P R O C E S S
Another company which appears to be nearing commercialization of cellulosic ethanol is Spain's Abengoa Bioenergy. Abengoa Bioenergy owns proprietary process technology to produce ethanol from cellulosic and lignocellulosic biomass. The core strategic activity of the company is to demonstrate at a commercial scale second generation biofuels. Abengoa Bioenergy have been consistently supported and awarded with funding from the European Union and the US Department of Energy (DOE) to demonstrate
enzymatic hydrolysis technology. In March 2007, Abengoa Bioenergy were selected by the DOE to demonstrate proprietary enzymatic process technology for the production of ethanol and other renewable forms of energy through conversion of cellulosic and lignocellulosic materials at a commercial scale. This plant is under design and construction at this stage in Kansas, US. Abengoa Bioenergy is investing 500 million US dollars in the next 5 years in this technology. Abengoa Bioenergy has specific plans for biomass deployment through all existing assets worldwide, including this facility in Rotterdam [3].
Utilizing the process and pre-treatement technology from SunOpta Inc., Abengoa is
Figure 3. Iogen processing scheme

71
MOL Scientific MagazineSD & HSE special issue
1MOL GROUP
building a 5 million gallon cellulosic ethanol facility in Spain and have recently entered into a strategic research and development agreement with Dyadic International, Inc. to create new and better enzyme mixtures which may be used to improve both the efficiencies and cost structure of producing cellulosic ethanol [4].
J O I N T V E N T U R E C O M P A N Y O F S U N O P T A I N C . W I T H G R E E N F I E L D E T H A N O L
In 2006, SunOpta Inc. announced a Joint Venture with GreenField Ethanol, Canada's largest ethanol producer. The joint venture will build a series of large-scale plants that will make ethanol from wood chips, with SunOpta and GreenField each taking 50% ownership. The first of these plants will be 10 million gallons per year, which appears to be the first true "commercial scale" cellulosic ethanol plant in the world. The SunOpta/GreenField cellulosic ethanol plant is intended to demonstrate that large-scale cellulosic ethanol is commercially viable immediately. SunOpta Inc. markets a patented technology known as “Steam Explosion” to pre-treat cellulosic biomass, overcoming its "recalcitance" to make cellulose and hemicellulose accessible to enzymes for conversion into fermenatable sugars. SunOpta designs and engineers cellulosic ethanol biorefineries and its process technologies and equipment are in use in the first 3 commercial demonstration scale plants in the world [5].
O T H E R C O M P A N I E S ’ A C T I V I T I E S
A bio-plant in China engineered by SunOpta Inc. and owned and operated by China Resources Alcohol Corporation is currently producing cellulosic ethanol from corn stover (stalks and leaves) on a continuous, 24-hour per day basis [6].
Genencor and Novozymes are two other companies that have received United States government Department of Energy funding for research into reducing the cost of cellulase, a key enzyme in the production of cellulosic ethanol by enzymatic hydrolysis [7]. Other enzyme companies, such as Dyadic International, Inc. are developing genetically engineered fungi which would produce large volumes of cellulase, xylanase and hemicellulase enzymes which can be utilized to convert agricultural residues such as corn stover, distiller grains, wheat straw and sugar cane bagasse and energy crops such as switch grass
into fermentable sugars which may be used to produce cellulosic ethanol. Gasification process Gasification process does not rely on chemical decomposition of the cellulose chain. Instead of breaking the cellulose into sugar molecules, the carbon in the raw material is converted into synthesis gas, using what amounts to partial combustion. The carbon monoxide, carbon dioxide and hydrogen may then be fed into a special kind of fermenter. Instead of yeast, which operates on sugar, this process uses a microorganism named “Clostridium ljungdahlii” [8]. This microorganism will ingest (eat) carbon monoxide, carbon dioxide and hydrogen and produce ethanol and water.
The process can thus be broken into three steps: [9]. Gasification – Complex carbon based molecules
are broken apart to access the carbon as carbon monoxide, carbon dioxide and hydrogen are produced
Fermentation – Convert the carbon monoxide, carbon dioxide and hydrogen into ethanol using the Clostridium ljungdahlii organism
Distillation – Ethanol is separated from water
A recent study has found another Clostridium bacterium that seems to be twice as efficient in making ethanol from carbon monoxide as the one mentioned above [10].
The raw material is plentiful. Cellulose is present in every plant: straw, grass, wood. Most of these “bio-mass” products are currently discarded.
Figure 4. Fluidized Bed Gasifier in Güssing (Burgenland, Austria)
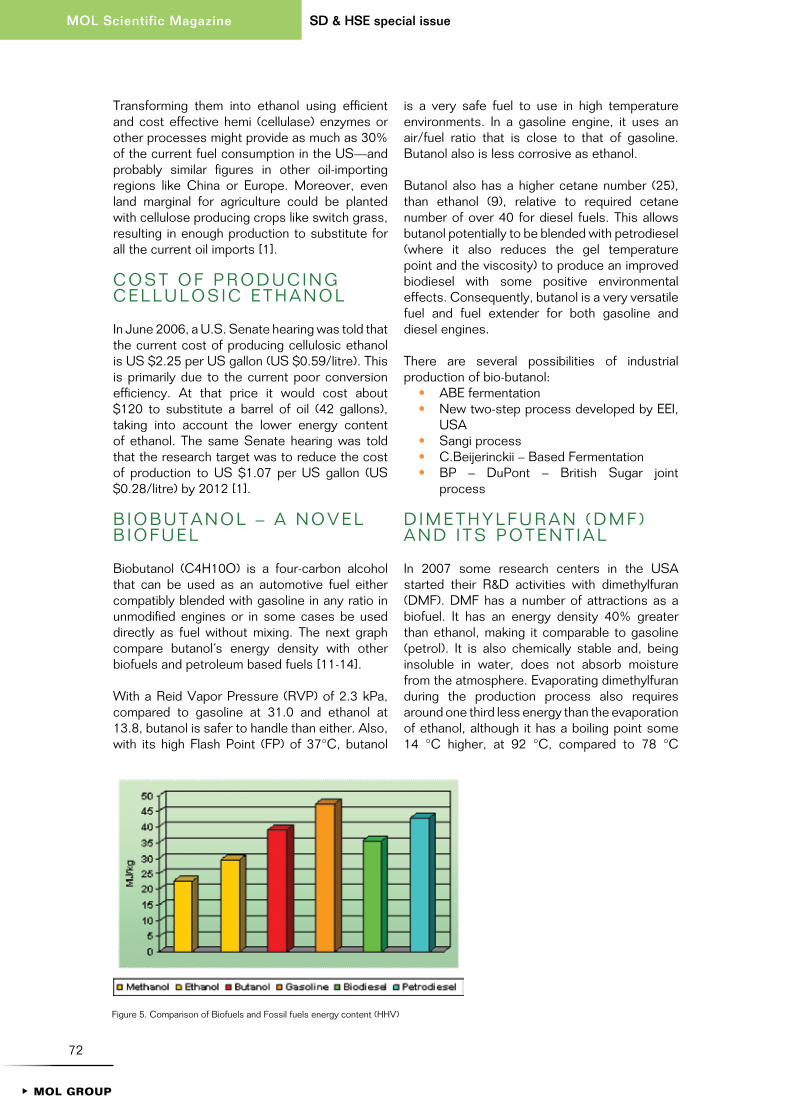
72
SD & HSE special issueMOL Scientific Magazine
1MOL GROUP
Transforming them into ethanol using efficient and cost effective hemi (cellulase) enzymes or other processes might provide as much as 30% of the current fuel consumption in the US—and probably similar figures in other oil-importing regions like China or Europe. Moreover, even land marginal for agriculture could be planted with cellulose producing crops like switch grass, resulting in enough production to substitute for all the current oil imports [1].
C O S T O F P R O D U C I N G C E L L U L O S I C E T H A N O L
In June 2006, a U.S. Senate hearing was told that the current cost of producing cellulosic ethanol is US $2.25 per US gallon (US $0.59/litre). This is primarily due to the current poor conversion efficiency. At that price it would cost about $120 to substitute a barrel of oil (42 gallons), taking into account the lower energy content of ethanol. The same Senate hearing was told that the research target was to reduce the cost of production to US $1.07 per US gallon (US $0.28/litre) by 2012 [1].
B I O B U T A N O L – A N O V E L B I O F U E L
Biobutanol (C4H10O) is a four-carbon alcohol that can be used as an automotive fuel either compatibly blended with gasoline in any ratio in unmodified engines or in some cases be used directly as fuel without mixing. The next graph compare butanol´s energy density with other biofuels and petroleum based fuels [11-14].
With a Reid Vapor Pressure (RVP) of 2.3 kPa, compared to gasoline at 31.0 and ethanol at 13.8, butanol is safer to handle than either. Also, with its high Flash Point (FP) of 37°C, butanol
is a very safe fuel to use in high temperature environments. In a gasoline engine, it uses an air/fuel ratio that is close to that of gasoline. Butanol also is less corrosive as ethanol. Butanol also has a higher cetane number (25), than ethanol (9), relative to required cetane number of over 40 for diesel fuels. This allows butanol potentially to be blended with petrodiesel (where it also reduces the gel temperature point and the viscosity) to produce an improved biodiesel with some positive environmental effects. Consequently, butanol is a very versatile fuel and fuel extender for both gasoline and diesel engines.
There are several possibilities of industrial production of bio-butanol:
• ABE fermentation• New two-step process developed by EEI,
USA• Sangi process• C.Beijerinckii – Based Fermentation• BP – DuPont – British Sugar joint
process
D I M E T H Y L F U R A N ( D M F ) A N D I T S P O T E N T I A L
In 2007 some research centers in the USA started their R&D activities with dimethylfuran (DMF). DMF has a number of attractions as a biofuel. It has an energy density 40% greater than ethanol, making it comparable to gasoline (petrol). It is also chemically stable and, being insoluble in water, does not absorb moisture from the atmosphere. Evaporating dimethylfuran during the production process also requires around one third less energy than the evaporation of ethanol, although it has a boiling point some 14 °C higher, at 92 °C, compared to 78 °C
Figure 5. Comparison of Biofuels and Fossil fuels energy content (HHV)

73
MOL Scientific MagazineSD & HSE special issue
1MOL GROUP
for ethanol. The ability to efficiently and rapidly produce dimethylfuran from fructose, found in fruit and some root vegetables, or from glucose, which can be derived from starch and cellulose – all widely available in nature – is likely to add to the attraction of dimethylfuran once safety issues have been examined [15].
Part IIBiofuels for diesel engine
N E X B T L T E C H N O L O G Y B Y N E S T E O I L
NExBTL diesel is produced in a patented vegetable oil refining process. Chemically, it entails direct catalytic hydrogenation of plant oil, which is triglyceride, into the corresponding alkane. The glycerol chain of the triglyceride is hydrogenated to the corresponding C3 alkane, propane – there is no glycerol sidestream. This process removes oxygen from the oil; the diesel is not an oxygenate like traditional transesteried biodiesel. Unlike the yellow transesterified biodiesel, the product is a clear and colorless paraffin, with a good cetane number (85 to 99) and better properties than even petrodiesel. As it is chemically identical to ideal conventional diesel, it requires no modification or special precautions for the engine [16-17].
As NExBTL is a hydrocarbon, traditional biodiesel esters components may be added to blends
containing NExBTL to increase the overall renewability of diesel fuel.
When compared with emissions from the “clean” European sulphur-free EN-590 diesel, NExBTL Renewable Synthetic Diesel shows:
• Life cycle greenhouse gas emissions are reduced by over 60%
• NOx emissions are reduced by over 15% • Particulate matter emissions are reduced
by over 25%• Hydrocarbon emissions are reduced by
over 20%• Carbon monoxide emissions are reduced
by over 5%
Neste Oil’s NExBTL product is referred to as a “Renewable Synthetic Diesel” to distinguish it from the traditional “biodiesel esters”, which are commercially available today. In fact, the feedstock for both fossil-diesel substitutes is the same – natural organic acids contained in animal fat and vegetable oil. The difference is in the processing and chemical nature of the end products. In the NExBTL Renewable Syntehtic Diesel process technology, they fatty acid feedstock is “hydrotreated”; that is, it is reacted with hydrogen. The product is a hydrocarbon product, free of oxygen and aromatic compounds. This “hand-crafted” product is what gives NExBTL its superior fuel and emission properties. Side products include propane and gasoline – premium fuels which have also been produced from the renewable, biological feedstock. [18].
Simplified nExBTL Process Chemistry
In 2005, Neste Oil started to build a NExBTL Renewable Synthetic Diesel production plant at its (200,000 bbl/day) Porvoo oil refinery. Costing some €100 million, the plant is capable of producing 170,000 metric tonnes per year (60 million USG/year). Enough to fuel 100,000 vehicles for a year. NExBTL is made from renewable biomass sources – namely fatty acids from vegetable oils and animal fats. With only 2-3% (by mass) addition of hydrogen, NExBTL is 97-98% renewable. Neste Oil also plans to invest approximately €550 million in building a plant in Singapore to produce NExBTL Renewable Diesel. NExBTL technology is the first commercial new-generation renewable diesel production process, and can use any vegetable oil or animal fat as its input. [19].
Pretreatment(optional)
NExBTL-Unit
WaterBio fuel gas
Biogasoline
Vegetable oilsanimal fats
Hydrogen
NExBTL Diesel
Simpilfied NExBTL Process Flow Scheme
Figure 6. NExBTL process

74
SD & HSE special issueMOL Scientific Magazine
1MOL GROUP
C H O R E N I N D U S T R I E S
The Key Element in the Technology: the Carbo-v® Process
The Carbo-V® Process is a three-stage gasifi-cation process involving the following sub-processes [20]:
• low temperature gasification • high temperature gasification • endothermic entrained bed gasification
During the first stage of the process, the biomass (with a water content of 15 – 20 %) is continually carbonized through partial oxidation (low temperature pyrolysis) with air or oxygen at temperatures between 400 and 500 °C, i.e. it is broken down into a gas containing tar (volatile parts) and solid carbon (char).
During the second stage of the process, the gas containing tar is post-oxidized hypo-stoichiometrically using air and/or oxygen in a combustion chamber operating above the melting point of the fuel’s ash to turn it into a hot gasification medium.
During the third stage of the process, the char is ground down into pulverized fuel and is blown into the hot gasification medium. The pulverized fuel and the gasification medium react endothermically in the gasification reactor and are converted into a raw synthesis gas. Once this has been treated in the appropriate manner, it can be used as a combustible gas for generating electricity, steam and heat or as a synthesis gas for producing SunDiesel [21].
Figure 7. The Neste Oil’s NExBTL Renewable Synthetic Diesel Technology to produce a second generation renewable diesel.
Figure 8.
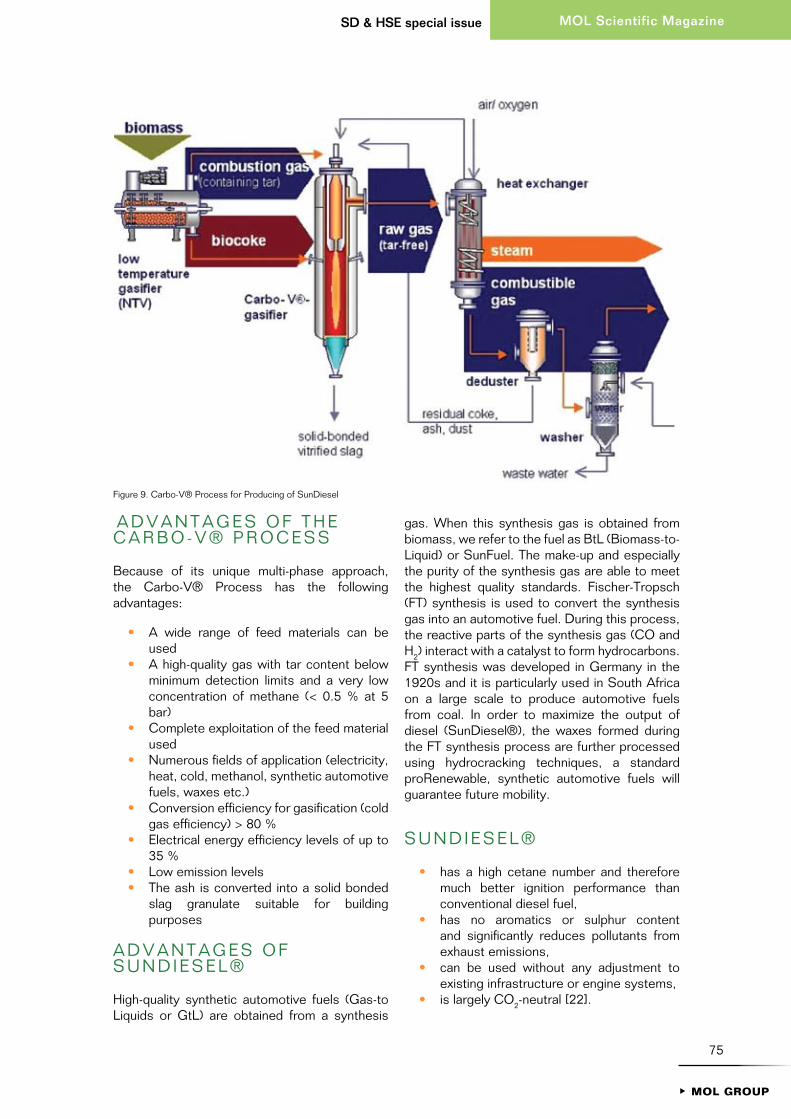
75
MOL Scientific MagazineSD & HSE special issue
1MOL GROUP
A D V A N T A G E S O F T H E C A R B O - V ® P R O C E S S
Because of its unique multi-phase approach, the Carbo-V® Process has the following advantages:
• A wide range of feed materials can be used
• A high-quality gas with tar content below minimum detection limits and a very low concentration of methane (< 0.5 % at 5 bar)
• Complete exploitation of the feed material used
• Numerous fields of application (electricity, heat, cold, methanol, synthetic automotive fuels, waxes etc.)
• Conversion efficiency for gasification (cold gas efficiency) > 80 %
• Electrical energy efficiency levels of up to 35 %
• Low emission levels • The ash is converted into a solid bonded
slag granulate suitable for building purposes
A D V A N T A G E S O F S U N D I E S E L ®
High-quality synthetic automotive fuels (Gas-to Liquids or GtL) are obtained from a synthesis
gas. When this synthesis gas is obtained from biomass, we refer to the fuel as BtL (Biomass-to-Liquid) or SunFuel. The make-up and especially the purity of the synthesis gas are able to meet the highest quality standards. Fischer-Tropsch (FT) synthesis is used to convert the synthesis gas into an automotive fuel. During this process, the reactive parts of the synthesis gas (CO and H2) interact with a catalyst to form hydrocarbons. FT synthesis was developed in Germany in the 1920s and it is particularly used in South Africa on a large scale to produce automotive fuels from coal. In order to maximize the output of diesel (SunDiesel®), the waxes formed during the FT synthesis process are further processed using hydrocracking techniques, a standard proRenewable, synthetic automotive fuels will guarantee future mobility.
S U N D I E S E L ®
• has a high cetane number and therefore much better ignition performance than conventional diesel fuel,
• has no aromatics or sulphur content and significantly reduces pollutants from exhaust emissions,
• can be used without any adjustment to existing infrastructure or engine systems,
• is largely CO2-neutral [22].
Figure 9. Carbo-V® Process for Producing of SunDiesel
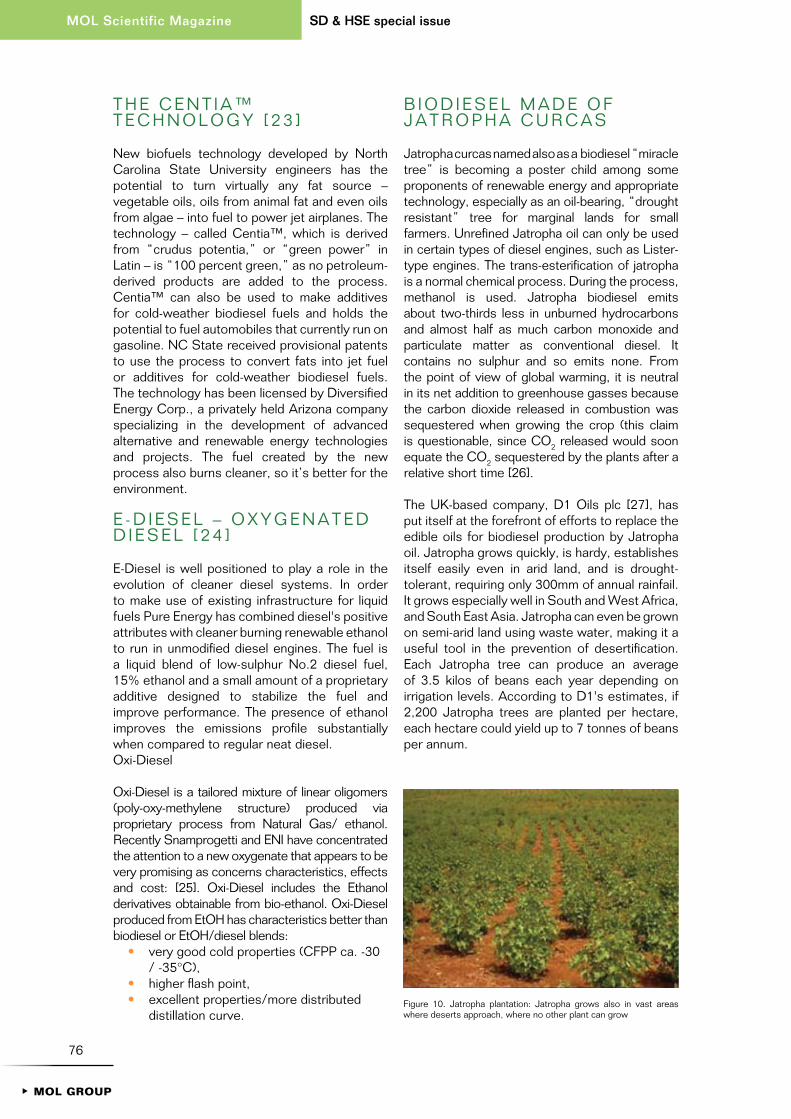
76
SD & HSE special issueMOL Scientific Magazine
1MOL GROUP
T H E C E N T I A ™ T E C H N O L O G Y [ 2 3 ]
New biofuels technology developed by North Carolina State University engineers has the potential to turn virtually any fat source – vegetable oils, oils from animal fat and even oils from algae – into fuel to power jet airplanes. The technology – called Centia™, which is derived from “crudus potentia,” or “green power” in Latin – is “100 percent green,” as no petroleum-derived products are added to the process. Centia™ can also be used to make additives for cold-weather biodiesel fuels and holds the potential to fuel automobiles that currently run on gasoline. NC State received provisional patents to use the process to convert fats into jet fuel or additives for cold-weather biodiesel fuels. The technology has been licensed by Diversified Energy Corp., a privately held Arizona company specializing in the development of advanced alternative and renewable energy technologies and projects. The fuel created by the new process also burns cleaner, so it’s better for the environment.
E - D I E S E L – O X Y G E N A T E D D I E S E L [ 2 4 ]
E-Diesel is well positioned to play a role in the evolution of cleaner diesel systems. In order to make use of existing infrastructure for liquid fuels Pure Energy has combined diesel's positive attributes with cleaner burning renewable ethanol to run in unmodified diesel engines. The fuel is a liquid blend of low-sulphur No.2 diesel fuel, 15% ethanol and a small amount of a proprietary additive designed to stabilize the fuel and improve performance. The presence of ethanol improves the emissions profile substantially when compared to regular neat diesel. Oxi-Diesel
Oxi-Diesel is a tailored mixture of linear oligomers (poly-oxy-methylene structure) produced via proprietary process from Natural Gas/ ethanol. Recently Snamprogetti and ENI have concentrated the attention to a new oxygenate that appears to be very promising as concerns characteristics, effects and cost: [25]. Oxi-Diesel includes the Ethanol derivatives obtainable from bio-ethanol. Oxi-Diesel produced from EtOH has characteristics better than biodiesel or EtOH/diesel blends:
• very good cold properties (CFPP ca. -30 / -35°C),
• higher flash point,• excellent properties/more distributed
distillation curve.
B I O D I E S E L M A D E O F J A T R O P H A C U R C A S
Jatropha curcas named also as a biodiesel “miracle tree” is becoming a poster child among some proponents of renewable energy and appropriate technology, especially as an oil-bearing, “drought resistant” tree for marginal lands for small farmers. Unrefined Jatropha oil can only be used in certain types of diesel engines, such as Lister-type engines. The trans-esterification of jatropha is a normal chemical process. During the process, methanol is used. Jatropha biodiesel emits about two-thirds less in unburned hydrocarbons and almost half as much carbon monoxide and particulate matter as conventional diesel. It contains no sulphur and so emits none. From the point of view of global warming, it is neutral in its net addition to greenhouse gasses because the carbon dioxide released in combustion was sequestered when growing the crop (this claim is questionable, since CO2 released would soon equate the CO2 sequestered by the plants after a relative short time [26].
The UK-based company, D1 Oils plc [27], has put itself at the forefront of efforts to replace the edible oils for biodiesel production by Jatropha oil. Jatropha grows quickly, is hardy, establishes itself easily even in arid land, and is drought-tolerant, requiring only 300mm of annual rainfail. It grows especially well in South and West Africa, and South East Asia. Jatropha can even be grown on semi-arid land using waste water, making it a useful tool in the prevention of desertification. Each Jatropha tree can produce an average of 3.5 kilos of beans each year depending on irrigation levels. According to D1's estimates, if 2,200 Jatropha trees are planted per hectare, each hectare could yield up to 7 tonnes of beans per annum.
Figure 10. Jatropha plantation: Jatropha grows also in vast areas where deserts approach, where no other plant can grow

77
MOL Scientific MagazineSD & HSE special issue
1MOL GROUP
Jatropha beans can produce oil yields of up to 40% and D1 expects each hectare to deliver about 3,000 litres of biodiesel. In the established process for refining biodiesel, the vegetable oil is esterified, reacted with methanol and sodium hydroxide, to produce diesel and glycerine. D1 has adapted this method to create its own proprietary process producing biodiesel from Jatropha and various other feedstocks. The Jatropha biodiesel meets the European EN14214 standard for use as a pure or blended automotive fuel for diesel engines. D1 has already secured plantation agreements in Burkina.
Faso, Ghana and the Philippines totalling 37,000 hectares, and has the option to extend planting to approximately 990,000 further hectares of land in Burkina Faso and 5 million hectares of land in India. The company recently raised L13 million in a London Stock Exchange flotation to fund these initiatives.
B I O D I E S E L F R O M A L G A E – A L G A C U L T U R E
From 1978 to 1996, the U.S. National Renewable Energy Laboratory experimented with using algae as a biodiesel source in the "Aquatic Species Program". Michael Briggs, at the UNH Biodiesel Group, offers in his article estimates for the realistic replacement of all vehicular fuel with biodiesel by utilizing algae that have a natural oil content greater than 50%, which Briggs suggests can be grown on algae ponds at wastewater treatment plants. This oil – rich algae can then be extracted from the system and processed into biodiesel, with the dried remainder further reprocessed to create ethanol. The production of algae to harvest oil for biodiesel has not yet been undertaken on a commercial scale, but feasibility studies have been conducted to arrive at the above yield estimate. In addition to its projected high yield, alga culture – unlike crop-based biofuels - does not entail a decrease in food production, since it requires neither farmland nor fresh water. Some companies are pursuing algae bio-reactors for various purposes, including biodiesel production. In 2006 the Aquaflow Bionomic Corporation in Marlborough, New Zealand announced that it had produced its first sample of bio-diesel fuel made from algae found in sewage ponds. Unlike previous attempts, the algae were naturally grown in pond discharge from the Marlborough District Council's sewage treatment works. The Department of Environmental Science at Ateneo de Manila University in the Philippines, is working on producing biofuel from algae, using a local species of algae.
Figure 11. Jatropha seeds
Figure 12. Schematic utilization of Algae for biodiesel production

78
SD & HSE special issueMOL Scientific Magazine
1MOL GROUP
Currently most research into efficient algal-oil production is being done in the private sector, but if predictions from small scale production experiments bear out then using algae to produce biodiesel, bioethanol and biobutanol may be the only viable method by which to produce enough automotive fuel to displace current world gasoline usage.
Microalgae have much faster growth-rates than terrestrial crops. The oil yield per unit area of algae is estimated to be 5,000 to 20,000 gallons per acre, per year (4.6 to 18.4 l/m2 per year); this is 7 to 30 times greater than the next best crop, Chinese tallow (699 gallons). The difficulties in efficient biodiesel production from algae lie in finding an algal strain with a high lipid content and fast growth rate that isn't too difficult to harvest, and a cost-effective cultivation system (ie., type of photobioreactor) that is best suited to that strain. Additionally, a cost-effective way to extract the oil must be found.
Research into algae for the mass-production of oil is mainly focused on microalgae; organisms capable of photosynthesis that are less than 2 mm in diameter, including the diatoms and cyanobacteria; as opposed to macroalgae, e.g.
seaweed. This preference towards microalgae is due largely to its less complex structure, fast growth rate, and high oil content (for some species). Some commercial interests into large scale algal-cultivation systems are looking to tie in to existing infrastructures, such as coal power plants or sewage treatment facilities. This approach not only provides the raw materials for the system, such as CO2 and nutrients; but it changes those wastes into resources [28].
Royal Dutch Shell Plc. and HR Biopetroleum formed a joint venture company, called Cellana and announced the construction of a pilot facility (Hawaii) to grow marine algae and produce vegetable oil for conversion into biofuel. Algae hold great promise because they grow very rapidly, are rich in vegetable oil and can be cultivated in ponds of seawater, minimising the use of fertile land and fresh water. The site is near existing commercial algae enterprises, primarily serving the pharmaceutical and nutrition industries. The facility will grow only non-modified, marine microalgae species in open-air ponds using proprietary technology. Algae strains used will be indigenous to Hawaii or approved by the Hawaii Department of Agriculture. Once the algae are harvested, the vegetable oil will be extracted. An
Figure 13. Vision of a biorefinery with algae cultivation for biodiesel production

79
MOL Scientific MagazineSD & HSE special issue
1MOL GROUP
academic research programme will support the project, screening natural microalgae species to determine which ones produce the highest yields and the most vegetable oil. The programme will include scientists from the Universities of Hawaii, Southern Mississippi and Dalhousie, in Nova Scotia, Canada. An advantage of algae is their rapid growth. They can double their mass several times a day and produce at least 15 times more oil per hectare than alternatives such as rape, palm soya or jatropha. Moreover, facilities can be built on coastal land unsuitable for conventional agriculture. Over the long term, algae cultivation facilities also have the potential to absorb or 'capture' waste CO2 directly from industrial facilities such as power plants. The Cellana demonstration will use bottled CO2 to explore this potential. [29].
SummaryThe utilization of biomass as well as algae for production of second generation of biofuels will need direct commitments between agriculture as the producer and industry as the processer of renewable feedstock. This practise will ensure the conditions of sustainable development while the processing of the domestic renewable sources and will provide self-sufficiency in feedstock supply, more effectively utilization of land reserves with lower land valuation. Algae itself offer a much higher productivity potential than crop-based biofuels.
The research of the second generation of biofuels also permits an application of the results of biological sciences at work – which is named as biologicalization of national economy. It will be supported the development of biotechnology and will boost the creation of bioeconomics. And the last but not least it will help to integrate scientific, research, technological, educational, economical, social and environment aspects of countries development. It would be ideal if the producers of motor fuels as well as automobile manufacturers were integrated into the process.
References
[1] http://en.wikipedia.org/wiki/Cellulosic_ethanol
[2] www.iogen.ca/cellulose_ethanol/what_is_ethanol/process.html
[3] www.nfia.nl/item.php?newsid=118[4] http://technology4life.wordpress.
com/2007/03/07/more-about-abengoa-bioenergy/
[5] www.ethanolmarket.com/PressReleaseGreenfieldEthanol012207
[6] http://en.wikipedia.org/wiki/Cellulosic_ethanol_commercialization
[7] www.greenvehiclenews.com/index.php?option=com_content&task=view&id
293&Itemid=27
Figure 14. Vision of industrial cultivation and processing of algae for biodiesel

80
SD & HSE special issueMOL Scientific Magazine
1MOL GROUP
[8] www.patentstorm.us/patents/6136577.html
[9] http://en.wikipedia.org/wiki/Cellulosic_ethanol#cite_note-27
[10] Srini Rajagopalan, Rohit P. Datar and Randy S. Lewis, Formation of ethanol from carbon monoxide via a new microbial catalyst, Biomass and Bioenergy, Volume 23, Issue 6, December 2002, Pages 487-493
[11] Nexant, Liquid Biofuels : Substituting for Petroleum, December 2006
[12] http://bioenergy.ornl.gov/papers/misc/energy_conv.html
[13] www.princeton.edu/~cmi/research/Capture/Papers/comparison.pdf
[14] http://en.wikipedia.org/wiki/Biobutanol[15] http://en.wikipedia.org/wiki/2,5-
Dimethylfuran[16] http://en.wikipedia.org/wiki/NExBTL[17] www.nesteoil.com/default.
asp?path=1,41,539,7516,7522[18] NExBTL - Renewable Synthetic Diesel,
Brochure by NESTE OIL, available also on web site : http://www.climatechange.ca.gov/events/2006-06-27+28_symposium/presentations/CalHodge_handout_NESTE_OIL.PDF
[19] www.biofuels-news.com/news/neste_finland.html
[20] www.choren.com/en/biomass_to_energy/carbo-v_technology/
[21] Matthias Rudloff, Biomass-to-Liquid Fuels (BtL) - Made by CHOREN,
Process, Environmental Impact and Latest Developments, Automobile & Environment at Belgrade EAEC Congress, May 2005
[22] Matthias Rudloff, Operation Experiences of Carbo-V process fro FTD Production, SYNBIOS – Second Generation Automotiev Biofuels, Conference , 18.-.20.5.2005, Stockholm
[23] http://news.ncsu.edu/releases/2007/feb/031.html
[24] www.oxydiesel.com/oxyindex.html[25] Domenico Sanfilippo and col., A New
Oxygenate For Cleaner Diesel Fuels, 4th European Fuels Conference, The Future of the European Refining Industry, March 2003, Rome, Italy
[26] Mike Benge, Assessment of the potential of Jatropha curcas, (biodiesel tree,) for energy production and other uses in developing countries, USAID, August 2006, www.echotech.org/mambo/index.php?option=com_docman&task=doc_view&gid=179
[27] www.d1plc.com[28] http://en.wikipedia.org/wiki/Algaculture[29] www.shell.com/home/content/media/
news and library/press releases/2007/biofuels cellana 11122007.html
Revised by: András Holló PhD

81
SD & HSE special issue
1MOL GROUP
MOL Scientific Magazine
corporate givingdevelopment inSustainable
AbstractMOL Group’s commitment to contribute to sustainable development requires the integration of its principles into all of its activities to support long-term business success. Therefore, corporate giving ac tivities should also be gradually transformed, go through different stages of development – laying the foundation, partial integration – to finally achieve full integration, that is, sustainable cor-porate giving. To illustrate in practice the different aspects of this process, MOL Group environmental donation programme, the Green Belt Programme was selected not only because it is a successful, long-term programme sup-porting local environmental initia tives, but also because it was developed as a pilot programme fully integrating sus-tainability principles „cradle-to-grave” in 2005 already, one year before the initiation of the Group-level sustainable development strategy. Our four-year ex perience demonstrated that integ-ration can contribute to a great extent to the increase of efficiency and bring about significant synergies to the com pany thanks to the appropriate professional planning and work based on cooperation.
ÖsszefoglalásA MOL-csoport elkötelezett a fenntart-ható fejlôdés iránt, ezért a hosszú távú üzleti siker érdekében törekszik arra, hogy a fenntarthatóság elveit minden tevékenységébe integrálja. A vállalat támogatási tevékenysége is fokozatos fejlôdésen megy keresztül – alapok le-fektetése, részleges integráció –, hogy végül elérje a teljes integráció szintjét, ami nem más, mint a fenntartható vállalati támogatás megvalósulása. A folyamat bemutatására a MOL regi-o nális környezetvédelmi támogatási prog ramjára, a Zöldövezet Programra esett a választás. Nem pusztán azért, mert ez egy sikeres, hosszú távú, helyi környezetvédelmi kezdeményezéseket támogató program, hanem elsôsorban azért, mert mintaprogramként úgy került kialakításra már 2005-ben, – egy évvel a csoportszintû fenn tart-hatósági stratégia bevezetése elôtt - hogy teljes mértékben integrálja a fenntarthatóság elveit „a bölcsôtôl a sírig”. Az elmúlt négy év tapasztalata megmutatta szá munkra, hogy az integ-ráció nagy mér tékben hozzájárulhat a ha té kony ság növeléséhez, valamint je-len tôs szinergiákat teremthet az együtt-mûködésen alapuló szak mai tervezésnek és munkának köszönhetôen.
IntroductionMOL Group is committed to integrate the principles of sustainable development into its everyday business operations. This commitment requires the implementation of its principles at all levels irrespectively of the nature and type of the activity in question. Therefore, corporate giving activity at Corporate Communications, being one of the most important areas of the social pillar related to external stakeholders
Dóra SomlyaiHead of Corporate Communications HUMOL Group Corporate CommunicationsE-mail: [email protected]
Ágnes KelenvölgyiHead of Communications SupportMOL Group Corporate CommunicationsE-mail: [email protected]
andrea HaázNew Europe FoundationMOL Group Corporate CommunicationsE-mail: [email protected]

82
SD & HSE special issueMOL Scientific Magazine
1MOL GROUP
should also be adapted to new tendencies, and reconsidered and restructured following the company’s commitment to support long-term business success.
Different levels of integrationGradual and continuous improvement is a common characteristic of development processes at any organisations. The step-by-step implementation of new systems is a crucial element to achieve long-term success. The organisation defines its objectives, then the processes related to them, the necessary actions, and at the end of each turning point of a period, it evaluates the results, includes the lessons learned to the following tasks or if necessary, changes the processes based on experiences. Sustainable development is not an exception. Moreover, as this concept requires a completely new approach from companies compared to traditional thinking, the development process and the implementation phase require even more attention and careful consideration.
Integration, therefore, is a step-by-step process, which can be divided into three main stages:
• the foundation, including the preconditions of real actions and change like commitment, learning and the appearance of behavioural change;
• partial integration, denoting the integration of the principles either to the organisation’s own processes or to the conditions of cooperation with other organisations
• full integration, including the foundation, the company’s own processes and its expectations from external stakeholders (other organisations)
Laying the foundation – change in traditional thinkingThe commitment of the company and its management is the first step in the integration process. Programmes and processes are not changed, but objectives are already defined and more attention is paid to those activities that support outstanding social or environmental
issues. After a short period of time, more and more activities are initiated supporting environmental and social issues which are of outstanding importance for the company. Therefore, a company may focus on climate change, ethical issues, working conditions or on corporate giving. Although it can be considered already a major change, it is still part of the first steps on the way towards integration. Objectives are defined separately, and programmes generally outline only one pillar without taking into account the other two. In corporate giving for example, the company is mainly involved in sponsoring events or activities that are closely related to its activity (prevailing factor is economy) without taking into account the real need of the society or focuses only on charitable donations (prevailing factor is society) forgetting about its own concerns.
This phenomenon is mainly due to the way of thinking still attached to “old traditions” considering only one objective – economic, financial, environmental or social – at a time. Moreover, it is strongly related to the fact that traditional thinking regards environmental and social issues as interfering factors with the profit-oriented character of a company. Consequently, the initiation of organisational learning, knowledge building and behavioural change as they relate to sustainability are fundamental elements in bringing considerable change.
Partial integration – internal or external processesPartial integration can only be achieved, if the company really believes that the quality of the natural environment and the living conditions in society deeply impact its long-term business success. In addition, decision-making should be already based on diverse objectives, taking into account different (economic, environmental and social) factors at an appropriate level.
Partial integration denotes the implementation of one of the following two processes. Sustainability is applied to the activity of the company itself, meaning that corporate giving processes, the related strategy and targets are based on its principles. As an example, the decision of „who to support” is based on social, environmental and economic considerations including the needs of the most important stakeholders. As a result, the categories may include children’s health, young
83
MOL Scientific MagazineSD & HSE special issue
1MOL GROUP
talents, local cultural initiatives, the safeguarding of national values and so on, depending on the company’s operations, the local economic and social situation, or hot-topics among others. Of course it is not enough. The other issue is “how to support”, covering the company’s own processes in giving from planning to evaluation. To achieve success, the usage of “normal” way of project management is a precondition, which is often a missing factor in corporate giving activities, as they are not regarded strategically and as a business activity. Planning, implementation, monitoring and evaluation: the missing of any of the items of this cycle may hinder successful integration.
The other process of partial integration is the application of sustainability principles into partnerships, meaning that the company expects the consideration of the three pillars from other organisations connected to the company (receiving support, common programme etc.) in corporate giving. This may include the compliance with the company’s Code of Ethics, the improvement of the organisation’s prog-ramme and also other conditions related to the operations of the partner depending on the nature of the organisation and its programme. In this case, the company has to, of course, closely follow (monitoring) the activity of its partner and require regular reporting on results.
Full integration – sustainable corporate givingFull integration is the result of a long-term development process. It includes the pre con-ditions of commitment, the change of behaviour and thinking, the sufficient knowledge of sus-tainability of all employees but also requires an important change in the external environment of the company (regulations, the behaviour of the society and their expectations, general business thinking etc.).
Examples to the principles guiding sustainable corporate giving within the company:
• Sufficient knowledge and new behaviour of employees and the management
• Objective to contributing mainly to the solution and not to the discussion when providing support to external organisations
• Application of the project management process cycle
• Change in decision -making processes including different factors taken into account
• Inclusion of economic, environmental and social considerations to the whole activity at the maximum possible level
• Development or support of programmes creating value for the company and for other stakeholders at the same time. (stakeholder perspective)
• Respecting rules and standards by the company and its partners
Full integration covers therefore the fulfilment of basic preconditions and also the application of both processes described in the partial integration paragraph supported by the change at other organisations and in the society as a whole (mutual understanding and action).
MOL Group Green Belt ProgrammeThe Green Belt Programme is of outstanding importance not only because it is a long-term and carefully planned programme supporting local environmental initiatives, but also because it was developed as a pilot programme fully integrating sustainability principles „cradle-to-grave” in 2005, already one year before the initiation of the Group-level sustainable development strategy.
The purpose of the environmental programme is to increase the size of green areas (minimum 1500 m2 is required for each application) as a result of local community action applying environmentally friendly solutions and to strengthen public environmental awareness.
Under the umbrella of this programme, 233 successful applicants could already develop green areas with the participation of thousands of volunteers in Hungary, Slovakia and Romania between 2006 and 2008. MOL contributed to these initiatives with almost HUF 100 million regionally as a direct financial support but the social value generated by the programme exceeded HUF 300 million in total.
Beside financial support, MOL has also launched the MOL Green Belt Award in 2007. The prize was designed by a student of Moholy-Nagy Art University and is given each year to that community
84
SD & HSE special issueMOL Scientific Magazine
1MOL GROUP
which creates the nicest green area in the most efficient and environmentally friendly way.
Although, this initiative is undoubtedly excep-tional, the purpose of protecting the environment alone does not mean automatically that a programme fulfils the requirements related to sustainability. Therefore, at the planning of Green Belt, Corporate Communications decided to integrate the principles into its own processes as well as to the content and to the expectations of the programme defined for applicants.
Integrating the social pillarThe social pillar covers basically stakeholder involvement, the inclusion of stakeholder needs and ethical issues. To satisfy these expectations, Corporate Communications decided first to involve an experienced non-profit organisation to the planning, developing and implementation phase to establish an unparalleled co-operation between an NGO and a profit-oriented organi-sation. Environmental Partnership Foun dation was selected as a partner, because of their experience in environmental issues, ten dering, working with local communities and also because they have a similar regional operation as MOL Group. A separate, independent Committee was set up, including independent experts to select the best applications each year. Secondly, local communities were defined as target groups to be supported, being one of the most important stakeholders for the company (MOL is connected to hundreds of communities through its fuel stations, facilities etc. – mostly to small ones), meaning that they are significantly affected by the operations of the company.
Thirdly, the revival or development of green areas is an important issue for small communities; they need professional help and financial support. In addition, the quality of their everyday life significantly depends on the quality of their surroundings. The Green Belt Programme con tributes as well to knowledge-building, awareness-raising and to the strengthening of community cohesion. Applicants are also asked to involve the highest number of community members (schools, inhabitants, the municipality, non-profit organisations, etc.), to participate as volunteers in the actual work. Selected green areas should function as public places which any community member can have access to.
Finally, the Foundation is expected to comply with the rules related to ethical behaviour (human rights, equal opportunity, transparency, corruption, environment, etc.) defined in MOL Group Code of Ethics.
Economic and financial issuesCorporate giving is a special activity area in business, as the company provides financial support to carry out an activity or implement a programme which is not related to its core business (cultural events, health, sport etc). Therefore, it is different from „normal” investments and cannot be compared either to procurement activities. On the other hand, the company should pay attention to the efficient use of its financial resources, just as in investment or procurement.
Although this programme is a donation, a charitable contribution to communities, meaning that MOL Group cannot prescribe to applicants (it is not a contractual cooperation) how they should spend the money they receive, financial efficiency remains a priority for the company. MOL has objectives to achieve by this programme; its donation activity is not simply financial support.
The company expects its partner, the Foundation, to use MOL resources in an efficient way: minimize the administrative and operational costs related to the organisation of the programme and also closely follow the activity of communities from a financial point of view. Therefore, applicants are asked to present a detailed plan before starting implementation and also report on their expenses at the end of the programme. The Foundation in turn has to report to MOL about its annual activity and operational costs as well.
Beside the participants, Corporate Commu-ni cations pays attention to the efficiency of its own processes as well. On one hand, the annual budget of the programme should be appropriate and sufficient for the achievement of its objectives, but not more than that. The programme should support outstanding initiatives to be carried out, but only those. On the other hand, each year, the programme is evaluated from a financial point of view: comparing objectives and the quality of results to the quantity of investments the company has made.
85
MOL Scientific MagazineSD & HSE special issue
1MOL GROUP
Finally, MOL, as a corporate citizen, is influenced by its surroundings, the quality of life of the local community, the local economic situation. Companies do not function in isolation from the society surrounding them. In fact, their ability to compete depends heavily on the circumstances of the locations where they operate. Increasing awareness or improving education, for example, is generally seen as a social issue, but the knowledge or educational level of the local inhabitants substantially affects a company’s potential competitiveness. The more a social or environmental improvement relates to a company’s business, the more it leads to economic benefits as well.
Environmental protectionThe third pillar of sustainable development is of outstanding importance and a priority for MOL Group, as the company has a significant impact on the environment resulting from its core business operations. Therefore, MOL’s Green Belt Programme focuses primarily on the development of green areas. In addition, participants should use environmentally friendly products and processes in their activities, plant native trees or plants, and can install, for example, selective waste collection bins.
The participation of local people as volunteers contributes also to the increase of environmental awareness in the community, as well as to the increase of their knowledge of local flora and fauna.
Although the scope of the programme is quite small, the expansion in size of green areas contributes to the fight against climate change – a strategic issue for MOL Group – especially through awareness-raising.
Improvement opportunities and future plansEach year, Corporate Communications evaluates the results of Green Belt Programme and includes all the lessons learned to the plans of the following year. Evaluation includes financial efficiency, the review of the usefulness and applicability of processes, the achievement of the company’s and the programme’s objectives and the feedback of stakeholders.
The evaluation of the last-year programme has revealed that on one hand, Green Belt has become a well-known initiative among small communities, it had unexpected success and results but on the other hand it still needs some “refreshment”. Its content and related expectations necessitate revision, completion as well as broadening and ethical requirements should be even outlined further and strengthened for all affected parties. In addition, as an interesting point of experience, all outstanding applications could be supported at the adequate level in the past years, so no change is necessary in financing.
The planning phase for the 2009 programme arrives to its final stage. Lessons learned made us possible to integrate sustainability principles even better to the programme. As an example, MOL employees will be involved as volunteers and work together with local communities to help them create an improved green area, to share experiences and to establish better relationship with them.
Our objective now is to take advantage of the experience with Green Belt, realise further synergies and greater efficiency by continuing the integration process related to other corporate giving programmes of MOL Group.
Revised by: I. Szabolcs Ferencz

86
SD & HSE special issueMOL Scientific Magazine
1MOL GROUP

87
MOL Scientific MagazineSD & HSE special issue
1MOL GROUP
AbstractRecently elaboration of Environment Impact Assessment (EIA) is a common task during MOL’s project implementation activity with day-to-day experience. In ter na tional experience shows that different projects may have substantial impact not only to the environment but sometime effects are even more adverse to communities, groups of people. Social Impact Assessment (SIA) as a new chal-lenge is under introduction into MOL’s activity. The article provides a rough overview on this new tool, another proof of MOL’s commitment towards sustainable development.
ÖsszefoglalásA társadalmi hatástanulmány (THT) – egy új kihívás a beruházások megvalósítása során
Jelenleg a környezetvédelmi hatás ta nul-mány (KHT) készítése napi gyakorlat a MOL beruházási folyamatában. A nem -zetközi gyakorlat azt mutatja, hogy bi-zo nyos projektek nemcsak a természeti kör nyezetre gyakorolhatnak jelentôs hatást, hanem néha a hatások a helyi közösségekre, embercsoportokra még ezeknél is erôteljesebbek. A társadalmi hatástanulmányt (THT), amely egy új ki hívás, a MOL jelenleg kezdi alkal-mazni. A cikk rövid áttekintést ad errôl
az új eszközrôl, ami a MOL a elkö te le-zettségének újabb bizonyítéka a fenn-tartható fejlôdés ügye iránt.
BackgroundDuring the past years Environmental Impact Assessment (EIA) constitutes part of our everyday activity within MOL at project implementation of such developments as construction of trunk lines, upstream oil extraction facilities, introduction of new processes at existing refineries. Legislation provides sufficient guidance for its elaboration; engineering institutions acquired sufficient experience and relevant administration gained rich experience how to conduct such complex authorization procedures.
The EIAs cover partly social and economic dimensions apart possible affects on develop-ments’ environment. However its extent is quite limited and some decades ago international experiences showed the need of elaboration of separate Social Impact Assessment studies in the case of some major projects. For certain projects, impacts on people can be by far the most important consideration. Adverse social impacts can reduce the intended benefits of a proposal, and even can threaten its viability if they are severe enough. In such cases, a social impact assessment (SIA) shall be carried out either as an extended part of the EIA process, or sometimes as a parallel or a separate review. This approach is used to analyze the impacts of a proposal on individuals and communities, and to mitigate the adverse effects and enhance the positive effects.
Social ImpactAssessment (SIA)
Upcoming Challenge during Project Implementation
Ivan Bakos Head of Petrochemical Project ImplementationTVK Plc. Corporate Services, Project ImplementationE-mail [email protected]

88
SD & HSE special issueMOL Scientific Magazine
1MOL GROUP
Why have Social Impact Assessment?The legal aspects of SIAs are traditionally derived from environmental regulation. SIAs first emerged in the 1970s in the U.S. as a method to assess the impacts on society of certain development schemes and projects before they go ahead – for example, new roads, industrial facilities, mines, dams, ports, airports, and other infrastructure projects. It has since been incorporated into the formal planning and approval processes of several countries in order to categorise and assess how major developments may affect populations, groups, and settlements. SIA is often carried out as part of, or in addition to, Environmental Impact Assessment, but it has not yet been as widely adopted as EIA in formal planning systems, often playing a minor role in combined environmental and social assessments. [1]
The consideration of social impacts is triggered by and, in some cases limited to, environmentally related changes. These can be particularly important in developing countries where large numbers of people are dependent on the resource base for their subsistence and livelihood. In other cases, once an EIA is required for a proposal, major effects on human environment can be considered in their own right. These can include potential changes to population, lifestyle, cultural traditions, community dynamics, and quality of life and well being. A more comprehensive SIA may be carried out separately from the EIA process. Such scheme is requested by World Bank in support of sustainable development (SD) philosophy. [2]
Strong focus is given to application of SIA among many other aspects during Dow Jones Sustainability Index (DJSI) determination. Nowadays elaboration of SIA for all major projects is considered as one feature of the best SD techniques. Actual international practice shows that some companies are complying with such strict suggestion voluntarily.
Defining and describing Social Impact AssessmentA standard definition of SIA is "Social impact assessment includes the processes of analysing, monitoring and managing the intended and unintended social consequences, both positive and negative, of planned interventions (policies, programs, plans, projects) and any social change processes invoked by those interventions. Its primary purpose is to bring about a more sustainable and equitable biophysical and human environment". [3]
The best practice definition of Social Impact Assessment goes beyond identifying and miti-gating adverse impacts. It additionally em-phasises benefit sharing with local communities and considers positive reimbursements from the project.
SIAs are appraisals of the likely impact that oil and gas operations might have on the societies of the host countries, regions and communities. These impacts can be direct and indirect, intended or unintended, positive and negative. Ideally SIA is a participative study with local, national and international stakeholders, as appropriate. A SIA identifies ways to mitigate any adverse social impacts and enhance positive ones. An effective SIA optimises the design of oil and gas operations to account for social impacts. A SIA also ensures that stakeholder views are incorporated and addressed throughout the project lifecycle [4]
When to carry out an SIA?Ideally the decision to do an SIA should be taken at a project’s conception. Existing operation that did not involve SIA at the project stage can be screened at any stage. Such screening should identify any legal or contractual requirements to carry out an SIA and the scope and complexity of potential social issues that need to be considered by more detailed study. Some form of SIA should be carried out on all major projects whether legislated or not. [4]
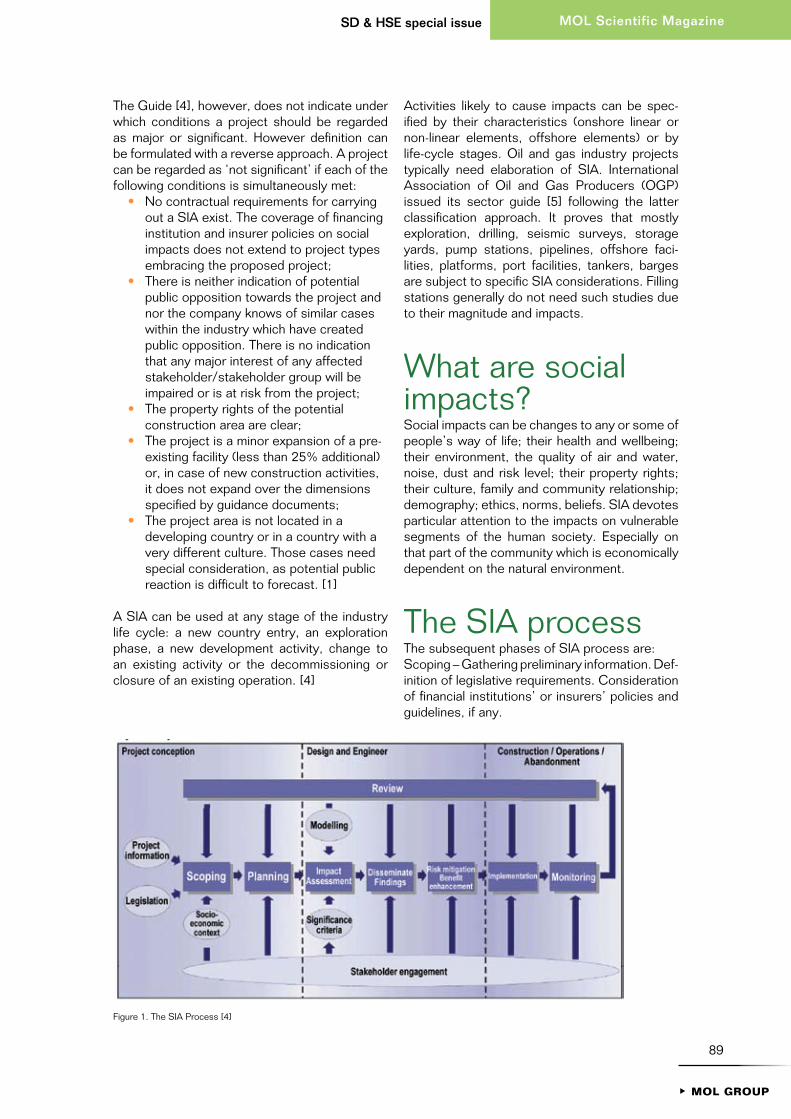
89
MOL Scientific MagazineSD & HSE special issue
1MOL GROUP
The Guide [4], however, does not indicate under which conditions a project should be regarded as major or significant. However definition can be formulated with a reverse approach. A project can be regarded as ‘not significant’ if each of the following conditions is simultaneously met:
• No contractual requirements for carrying out a SIA exist. The coverage of financing institution and insurer policies on social impacts does not extend to project types embracing the proposed project;
• There is neither indication of potential public opposition towards the project and nor the company knows of similar cases within the industry which have created public opposition. There is no indication that any major interest of any affected stakeholder/stakeholder group will be impaired or is at risk from the project;
• The property rights of the potential construction area are clear;
• The project is a minor expansion of a pre-existing facility (less than 25% additional) or, in case of new construction activities, it does not expand over the dimensions specified by guidance documents;
• The project area is not located in a developing country or in a country with a very different culture. Those cases need special consideration, as potential public reaction is difficult to forecast. [1]
A SIA can be used at any stage of the industry life cycle: a new country entry, an exploration phase, a new development activity, change to an existing activity or the decommissioning or closure of an existing operation. [4]
Activities likely to cause impacts can be spec-ified by their characteristics (onshore linear or non-linear elements, offshore elements) or by life-cycle stages. Oil and gas industry projects typically need elaboration of SIA. International Association of Oil and Gas Producers (OGP) issued its sector guide [5] following the latter classification approach. It proves that mostly ex plo ration, drilling, seismic surveys, storage yards, pump stations, pipelines, offshore faci-lities, platforms, port facilities, tankers, barges are subject to specific SIA considerations. Filling stations generally do not need such studies due to their magnitude and impacts.
What are social impacts?Social impacts can be changes to any or some of people’s way of life; their health and wellbeing; their environment, the quality of air and water, noise, dust and risk level; their property rights; their culture, family and community relationship; demography; ethics, norms, beliefs. SIA devotes particular attention to the impacts on vulnerable segments of the human society. Especially on that part of the community which is economically dependent on the natural environment.
The SIA processThe subsequent phases of SIA process are:Scoping – Gathering preliminary information. Def-i nition of legislative requirements. Consid eration of financial institutions’ or insurers’ policies and guidelines, if any.
Figure 1. The SIA Process [4]
90
SD & HSE special issueMOL Scientific Magazine
1MOL GROUP
Planning – Baseline data collection. Over viewing studies focusing on assessing the potential socio-cultural impacts of projects on indigenous peoples and local communities. Investigating the current demographical and social-economical and cultural situation among the group of people with purpose to understand the possible future with or without report. Identifying and prioritizing the activities that are likely to cause impacts; potentially affected population, vulnerable groups (e.g. minorities, low income) that might be affected and the spectrum of possible social impacts. The main sources for the assessment are interviews, questionnaires, statistical data, mass-media data, supply-chain analysis, regional and federal legislation and scientific research work.
Impact assessment – identifying direct, indirect and cumulative effects of the project, including secondary and consequential impacts of the proposed activity on the basis of comparative study. Effects must be evaluated based on their significance criteria as consequences, likelihood, duration, spatial scale, mitigatory potential and stakeholder acceptance.
Dissemination of findings – Public Consultation and Disclosure Plan is a typical tool preferred by lending institutions and company guidelines as well. Stakeholders concerns, responses to those concerns and actions to address the concerns must be recorded and documented. Consultation and disclosure shall be defined in a culturally-appropriate way with adequate and timely information plus sufficient opportunity for expressing stakeholders’ opinion. These concerns shall be properly taken into account during the project decisions.
Risk mitigation – Prevention or minimizing the possible negative influences. Impact prevention, mitigation and compensation shall be the order of precedence among measures to be taken within impact management. Revealing the needs and priorities of local peoples that should be considered before and during industrial implementation and defining possible mitigation measures.
Benefit enhancement – Increasing the positive effects. Overall net benefit should be dem-on strated to the community. A Social Impact Advisory Committee (Board) can be set up to assure that stakeholders concerns are properly handled throughout the SIA process.
Implementation – Social Impact Management Plan is a comprehensive high level plan based on
the outcomes of the social impact assessment. Management support of the measures developed by the SIA process through the management (action) plan is essential.
Monitoring – Monitoring the ongoing changes with the participation of the representatives of interested parties and the public organization representing interests of indigenous peoples and other local stakeholders for the effectiveness of mitigation programs. Both internal and external monitoring shall prove the effectiveness the management plan and must be reported to the Advisory Committee.
Stakeholder engagement process is vital during the whole project duration. Stakeholders’ involvement may vary from one-way information flow through information exchange and consultation up to their shared decision-making and taking participation. Consultation is the minimum recommended level however the higher level of engagement requires more time and resources. Typical stakeholders are local government, municipalities, public authorities, NGOs, local groups, individuals, future clients, media and industry groups. The last two are usually the key stakeholders.
Continual consultation with local stakeholders is a corner stone of the SIA. Dispute prevention and resolution can be achieved by special procedures for sensitive projects and via consensus building and conflict resolution.
GuidelinesGuidelines can be described as statements which provide advice or direction by which to plan specific course of action. They are written as specific statements of instruction about what to do and / or how to do it. Typically they are ‘action-statements’. Because guidelines are specific recommendations for action, they need to be developed in the context in which they are to be applied and they need to be addressed to a specific audience. Therefore, they need to be developed in conjunction with the relevant parties, stakeholders. They need to be accepted as the guidelines of that group rather than being imposed. There are many different groups who are potentially interested in guidelines for SIA. They include among others SIA practitioners, developers and financiers, development agencies (aid organizations), regulatory agencies, affected peoples and NGO’s. Financiers maintain guidelines to be committed to good practice in
environmental and social impact assessment, to adequately resource such practice, to liaise effectively with practitioners and interested and affected parties and with regulatory agencies. Practitioners require guidelines to improve their practice.
Company guidelines cover company-specific issues in a more detailed way. These are usually internal documents, not available to the public. Impact assessment studies based on these guidelines may be made public.
ConclusionThe introduction of leading international ap-proaches as Social Impact Assessment is a proof of MOL’s firm commitment towards its sustainable development philosophy.
References[1] Maria Csutora; Gabor Harangozo; Simon
Milton: Best Techniques for Carrying out a Social Impact Assessment in the Oil Industry, February 2009
[2] EIA Training Resource Manual, 2002[3] International Association for Impact
Assessment: Special Publication Series No. 2, May 2003
[4] IPIECA: A Guide to Social Impact Assessment in the Oil and Gas Industry; November 2004
[5] International Association of Oil & Gas Producers: OGP Sector Guide, Report No. 2.85/332, October 2002
Revised by: Iren Marta
91
MOL Scientific MagazineSD & HSE special issue
1MOL GROUP
Planning – Baseline data collection. Over viewing studies focusing on assessing the potential socio-cultural impacts of projects on indigenous peoples and local communities. Investigating the current demographical and social-economical and cultural situation among the group of people with purpose to understand the possible future with or without report. Identifying and prioritizing the activities that are likely to cause impacts; potentially affected population, vulnerable groups (e.g. minorities, low income) that might be affected and the spectrum of possible social impacts. The main sources for the assessment are interviews, questionnaires, statistical data, mass-media data, supply-chain analysis, regional and federal legislation and scientific research work.
Impact assessment – identifying direct, indirect and cumulative effects of the project, including secondary and consequential impacts of the proposed activity on the basis of comparative study. Effects must be evaluated based on their significance criteria as consequences, likelihood, duration, spatial scale, mitigatory potential and stakeholder acceptance.
Dissemination of findings – Public Consultation and Disclosure Plan is a typical tool preferred by lending institutions and company guidelines as well. Stakeholders concerns, responses to those concerns and actions to address the concerns must be recorded and documented. Consultation and disclosure shall be defined in a culturally-appropriate way with adequate and timely information plus sufficient opportunity for expressing stakeholders’ opinion. These concerns shall be properly taken into account during the project decisions.
Risk mitigation – Prevention or minimizing the possible negative influences. Impact prevention, mitigation and compensation shall be the order of precedence among measures to be taken within impact management. Revealing the needs and priorities of local peoples that should be considered before and during industrial implementation and defining possible mitigation measures.
Benefit enhancement – Increasing the positive effects. Overall net benefit should be dem-on strated to the community. A Social Impact Advisory Committee (Board) can be set up to assure that stakeholders concerns are properly handled throughout the SIA process.
Implementation – Social Impact Management Plan is a comprehensive high level plan based on
the outcomes of the social impact assessment. Management support of the measures developed by the SIA process through the management (action) plan is essential.
Monitoring – Monitoring the ongoing changes with the participation of the representatives of interested parties and the public organization representing interests of indigenous peoples and other local stakeholders for the effectiveness of mitigation programs. Both internal and external monitoring shall prove the effectiveness the management plan and must be reported to the Advisory Committee.
Stakeholder engagement process is vital during the whole project duration. Stakeholders’ involvement may vary from one-way information flow through information exchange and consultation up to their shared decision-making and taking participation. Consultation is the minimum recommended level however the higher level of engagement requires more time and resources. Typical stakeholders are local government, municipalities, public authorities, NGOs, local groups, individuals, future clients, media and industry groups. The last two are usually the key stakeholders.
Continual consultation with local stakeholders is a corner stone of the SIA. Dispute prevention and resolution can be achieved by special procedures for sensitive projects and via consensus building and conflict resolution.
GuidelinesGuidelines can be described as statements which provide advice or direction by which to plan specific course of action. They are written as specific statements of instruction about what to do and / or how to do it. Typically they are ‘action-statements’. Because guidelines are specific recommendations for action, they need to be developed in the context in which they are to be applied and they need to be addressed to a specific audience. Therefore, they need to be developed in conjunction with the relevant parties, stakeholders. They need to be accepted as the guidelines of that group rather than being imposed. There are many different groups who are potentially interested in guidelines for SIA. They include among others SIA practitioners, developers and financiers, development agencies (aid organizations), regulatory agencies, affected peoples and NGO’s. Financiers maintain guidelines to be committed to good practice in
environmental and social impact assessment, to adequately resource such practice, to liaise effectively with practitioners and interested and affected parties and with regulatory agencies. Practitioners require guidelines to improve their practice.
Company guidelines cover company-specific issues in a more detailed way. These are usually internal documents, not available to the public. Impact assessment studies based on these guidelines may be made public.
ConclusionThe introduction of leading international ap-proaches as Social Impact Assessment is a proof of MOL’s firm commitment towards its sustainable development philosophy.
References[1] Maria Csutora; Gabor Harangozo; Simon
Milton: Best Techniques for Carrying out a Social Impact Assessment in the Oil Industry, February 2009
[2] EIA Training Resource Manual, 2002[3] International Association for Impact
Assessment: Special Publication Series No. 2, May 2003
[4] IPIECA: A Guide to Social Impact Assessment in the Oil and Gas Industry; November 2004
[5] International Association of Oil & Gas Producers: OGP Sector Guide, Report No. 2.85/332, October 2002
Revised by: Iren Marta

92
1MOL GROUP
AbstractThe goal of this article is to introduce the MOL Group business optimization process and its supporter tool PIMS (Process Industry Modeling System) modeling and optimizing program package. PIMS is an efficient aid in the group level planning and business optimization of the supply chain for MOL Group Downstream. This software is the most widely used one in the oil industry. We have presented how the supplies to the markets can be optimized, how PIMS can be of assistance to us in project economics studies, how production plan, inter-refinery transfer plan and inventory plan can be prepared, and how we can used it for price sensitivity studies and in many other applications.It is essential that Downstream has been integrated into one single model, and now we are able to define the complete business optimum for Downstream. This means that the optimum feedstock purchases, the transfers between production units, details of the processing, production, blending structures and various materials, the stockpiling or distribution quantities, the marketing quantities, and the associated variable costs and prices can all be obtained from one single PIMS result. All this information is available by refineries.We are convinced that optimization is
an efficient tool to support in achieving our strategic and business targets. We improve our optimization and planning methods continuously to exploit better and better our opportunities in the future.
ÖsszefoglalásA cikk célja megismertetni az olvasót a MOL Csoport üzleti optimalizálásának folyamatával és az azt támogató szoftver eszközzel, a PIMS (Process Industry Modeling System) modellezô és optimalizáló programcsomaggal. A PIMS hatékony segédeszköze a MOL Csoport Downstream ellátási lánc csoportszintû tervezésének és üzleti optimalizálásának. Ez a szoftver a legelterjedtebb az olajiparban. Bemutattuk, hogyan optimalizálható a piacok ellátása, hogy lehet a PIMS beruházás gazdaságossági vizsgálatokban a segítségünkre, miként készíthetô termelési terv, finomítók közötti transzfer terv és készletterv, végezhetünk vele árérzékenység vizsgálatokat és még számos más területen alkalmazható. Lényeges, hogy a Downstream-et egyetlen modellbe integráltuk és így képesek vagyunk a tejes Downstream üzleti optimumát meghatározni. Ez azt jelenti, hogy egyetlen PIMS eredménybôl kinyerhetôk az optimális alapanyag beszerzések, a termelô egységek közötti transzferek, a feldolgozási, termelési, keverési struktúrák és a különféle anyagok minôségi adatai, a készletezési, szállítási mennyiségek, az értékesítési mennyiségek és ezekhez kapcsolódó változó költségek és árak. Ezek
Mészöly Csaba (44)Long Term Planning SCM DSokl. szervezô vegyészmérnök, mérnök-közgazdászMOL Csop./Termékelôállítás és Kereskedelem Divízió/SCM/Hosszú távú Tervezés
SD & HSE special issueSzakmai Tudományos Közlemények
REQUIREDBeyond what is
93
Szakmai Tudományos KözleményekSD & HSE special issue
1MOL GROUP
AbstractThroughout the globe, biodiversity has become depleted thereby threatening entire species, populations, habitats and ecosystems with extinction. The impending consequences have caught the attention of the world to the need for a sustainable solution to halt the irreversible outcomes of extinction. The adverse environmental and so cial consequences of excavating and consuming oil have been well documented by the media, pressure groups and communities. In an economy that exploits the environment for profits, maintaining biodiversity and ensuring business viability might seem as conflicting interests but more and more research1 shows that the two seemingly antagonistic concepts are in fact reconcilable.This article focuses on biodiversity as a resource that is under threat of being depleted. The article looks to raise awareness to the fact that status quo is far from ideal and if left unattended, disasters of catastrophic levels may result. Millennium Ecosystem Assessment stu-
dies have revealed shocking statistics of the rate of biodiversity depletion in Europe. Lobbyists and conservation organizations have come to realize how the presence of energy companies can provide influence, awareness, expertise and management capability, and revenues to support conservation activities. And have therefore chosen to approach energy companies and work together to conserve biodiversity and integrate biodiversity issues into oil and gas development.This article looks at biodiversity in the oil and gas industry outlining the current trends, definition and international action. It then identifies key challenges of the oil and gas industry and finally looks at what other companies including MOL are doing to contribute to the conservation of biodiversity.
BackgroundBiodiversity is all around us, in the cities, our farmlands, the countryside; it is simply the variety of life on earth. It includes the species of plants and animals, including any genetic variations, and the complex ecosystems of which they are part. Humans are an integral part of biodiversity and have major influence over it because they have the ability to manipulate any ecosystem.
The Convention on Biological Diversity (CBD)2 define biodiversity as: ‘The variability among living organisms from all sources including, inter alia, terrestrial, marine and other aquatic ecosystems and the ecological complexes of which they are part; this includes diversity within
Biodiversity
viktória Márton Head of SD&HSE AssuranceMOL Group SD&HSEE-mail: [email protected]
Deborah M. namugere HSE traineeMOL Group SD&HSEE-mail: [email protected]
and the
oil and gasindustry
1 EBI – Energy and Biodiversity Initiative, Integrating Biodiversity into Environmental and Social Impact Assessments2 CBD - The Convention on Biological Diversity – Implementation in the European Union 2008
94
SD & HSE special issueMOL Scientific Magazine
1MOL GROUP
species, between species and of ecosystems (Article 2).’
Biodiversity matters for a variety of reasons: • aesthetically – because it enhances
beauty on the face of the planet thereby providing an emotional value;
• economically – because individuals, entire communities and nations depend on it for subsistence and trade;
• environmentally – humans have an ethical obligation to conserve biodiversity because failure to do so has major impacts on the environment as pointed out later in this report.
As such, protecting biodiversity becomes central to the health of our planet and our own wellbeing as a people.
Unfortunately due to factors that include ignorance, greed and mismanagement humanity has affected the current biodiversity with many species due extinction. The Millennium Ecosystem Assessment3 shows that Europe’s ecosystems have suffered more human induced fragmentation than any other continent. Built up areas have increased by 20% in the last 20 years as a result almost all of our wildlife is in serious decline and valuable ecosystems have become degraded undermining their capacity to deliver valuable eco-systemic services.
Hungary for instance has very little untouched habitat left because cultivation and forest management has produced secondary habitats like the hay meadows and alkaline grasslands. The rise in agriculture and the industrial development has caused a threat to the biota (including genetic, population, habitat and landscape)4.
Why is biodiversity important?Biodiversity provides the basis for ecosystems and the services they provide, upon which all people fundamentally depend. From an economic and environmental perspective, biodiversity actually boosts ecosystem productivity. The ecosystem provide us with services such as production of food, fuel, fiber and medicines, regulation of water, air and climate, maintenance of soil
fertility, cycling of nutrients. These services have a big economical value and underpin not only the growth, jobs and wellbeing in EU, but also to meet the needs of the poor in developing countries.
Pressures and drivers causing biodiversity lossMost of the current biodiversity loss can be attributed to the irresponsible actions of men stemming from the desire to satisfy secondary human needs. Factors such as habitat degra-dation, land use change, globalization, including Euro pean trade increases pressures on bio-diversity and ecosystem services, increasing demands on natural resources, contributing to greenhouse gas emissions.
Climate change has become the biggest driver of biodiversity loss and is expected to exacerbate the current extinction rate. Species’ distribution and relative abundances shift as their preferred climate move towards the poles and higher altitudes, leaving those endemic to polar and high regions most at risk5. Due to climate change the Earth now faces factors such as floods, droughts, and disease outbreaks that have our natural resources.
Studies such as the UK Climate Impacts Program (UKCIP02 climate change scenarios)6 predicted that temperature and sea levels will continue to increase as well as an increase in the frequency of extreme weather events all these conditions will have an impact on biodiversity.
Biodiversity targets and trendsCurrently, there is a sharp rise in the awareness of the world to the fact that natural resources are being depleted at an exponential extinction-threatening rate. Fortunately, more and more organizations and countries are committed to combat the problem. For example, the Convention on Biological Diversity (CBD), launched at the United Nations Conference on Environment and Development (the Rio Summit) in 1992. It consists
3 Ecosystems and Human Well-Being: Current State and Trends, Millennium Ecosystem Assessment 4 State of Environment and Biodiversity in Hungary, http://enrin.grida.no/biodiv/biodiv/national/hungary/index.htm 5 UNEP GEO-4 Report, fourth Global Environment Outlook: environment for development assessment6 www.ukcip.co.uk

95
MOL Scientific MagazineSD & HSE special issue
1MOL GROUP
of 42 articles that state different objectives to preserve our biological diversity.
The CBD is an international environmental agree-ment principle targeted toward the conser vation
of biodiversity. More than 145 countries have either completed or drafted their National Biodiversity Strategies and Action Plans (NBSAPs), as detailed in the CBD7.
The European community became a party to the Convention on Biological Diversity in 1993. In 2001 the EU set itself the target of halting the loss of biodiversity by 20108. Determining the impact of the action plan on Biodiversity is complex. In order to clarify this area a set of 26 European 2010 biodiversity indicators are being developed. In addition to the monitoring indicators a traffic light system is also being developed. The system will assess whether or not the 1,000 species and the 220 habitats protected under the Habitats and Birds Directives are well protected.
The CBD biodiversity indicators include (see Figure 1):• The Living Planet Index, measuring
the trends in abundance of species, showing that freshwater species population declines the fastest.
• The Protected areas Coverage indicator demonstrates a promising trend in the form of a steady increase in the area under protection. However this can be misleading, as their establishment is not necessarily followed by effective management and enforcement of regulations.
• The Ecological Footprint9 indicates that consumption is rapidly and unsustainably increasing
• The IUCn Red List10 indicates trends in extinction risk, the conservation status of an entire species group assessed at regular intervals.
Results from one of the most comprehensive studies done on biodiversity shows over a million species will be lost in the coming 50 years. According to the Millennium Ecosystem
Assessment released in 2005, the current pace of species loss is up to 1,000 times higher than the background rates typical over the earth’s history (Figure 2).
These trends do not bode well for meeting the 2010 biodiversity target at a global scale. The target has seen some progress as the current rate of loss has slightly reduced but the overall
7 EBI, Integrating Biodiversity Conservation into Oil and Gas Development 8 The European Union’s action on biodiversity action plan, 2008 (author: European Union) 9 Global Footprint Network, http://www.footprintnetwork.org/en/index.php/GFN/page/world_footprint 10 www.iucnredlist.org
Figure 1. Examples of state, pressure and reponse indicators that have beeen adopted by the Convention on Biological Diversity measure progress towards the 2010 target
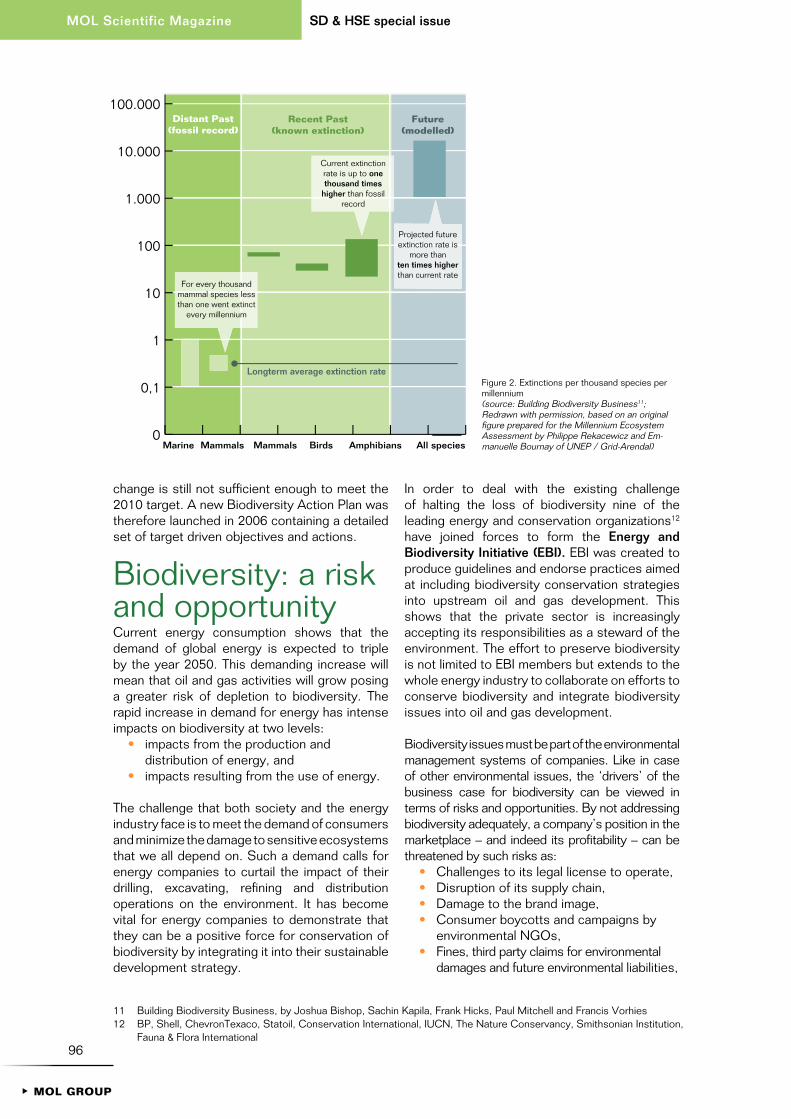
96
SD & HSE special issueMOL Scientific Magazine
1MOL GROUP
change is still not sufficient enough to meet the 2010 target. A new Biodiversity Action Plan was therefore launched in 2006 containing a detailed set of target driven objectives and actions.
Biodiversity: a risk and opportunityCurrent energy consumption shows that the demand of global energy is expected to triple by the year 2050. This demanding increase will mean that oil and gas activities will grow posing a greater risk of depletion to biodiversity. The rapid increase in demand for energy has intense impacts on biodiversity at two levels:
• impacts from the production and distribution of energy, and
• impacts resulting from the use of energy.
The challenge that both society and the energy industry face is to meet the demand of consumers and minimize the damage to sensitive ecosystems that we all depend on. Such a demand calls for energy companies to curtail the impact of their drilling, excavating, refining and distribution operations on the environment. It has become vital for energy companies to demonstrate that they can be a positive force for conservation of biodiversity by integrating it into their sustainable development strategy.
In order to deal with the existing challenge of halting the loss of biodiversity nine of the leading energy and conservation organizations12 have joined forces to form the Energy and Biodiversity Initiative (EBI). EBI was created to produce guidelines and endorse practices aimed at including biodiversity conservation strategies into upstream oil and gas development. This shows that the private sector is increasingly accepting its responsibilities as a steward of the environment. The effort to preserve biodiversity is not limited to EBI members but extends to the whole energy industry to collaborate on efforts to conserve biodiversity and integrate biodiversity issues into oil and gas development.
Biodiversity issues must be part of the environmental management systems of companies. Like in case of other environmental issues, the ‘drivers’ of the business case for biodiversity can be viewed in terms of risks and opportunities. By not addressing biodiversity adequately, a company’s position in the market place – and indeed its profitability – can be threatened by such risks as:
• Challenges to its legal license to operate,• Disruption of its supply chain,• Damage to the brand image,• Consumer boycotts and campaigns by
environmental NGOs,• Fines, third party claims for environmental
damages and future environmental liabilities,
0
0,1
1
10
100
1.000
10.000
100.000
8
Distant Past(fossil record)
Recent Past(known extinction)
Future(modelled)
For every thousand mammal species less than one went extinct
every millennium
Current extinction rate is up to one thousand times
higher than fossil record
Longterm average extinction rate
Projected future extinction rate is
more thanten times higher than current rate
Marine Mammals Mammals Birds Amphibians All species
11 Building Biodiversity Business, by Joshua Bishop, Sachin Kapila, Frank Hicks, Paul Mitchell and Francis Vorhies12 BP, Shell, ChevronTexaco, Statoil, Conservation International, IUCN, The Nature Conservancy, Smithsonian Institution,
Fauna & Flora International
Figure 2. Extinctions per thousand species per millennium (source: Building Biodiversity Business11; Redrawn with permission, based on an original figure prepared for the Millennium Ecosystem Assessment by Philippe Rekacewicz and Em-manuelle Bournay of UNEP / Grid-Arendal)

97
MOL Scientific MagazineSD & HSE special issue
1MOL GROUP
• Lower ratings in the financial markets, and• Poor staff morale and reduced
productivity.Natural resource companies must demonstrate in most cases that they know how to extract the resource with the smallest possible footprint or impact on biodiversity. For their projects government permission have to be obtained (the ‘license to operate’), and also an informal license needs to be obtained from stakeholders as well.
Energy companies have now realized that social issues have as much potential to harm their bottom line as financial issues. The competition between oil companies has increased so customers/clients have a choice of which company to use. This choice means that the power to determine how a business operates has been shifted towards the customers. Failing to address the impacts of biodiversity can have risks for a company’s reputation and may cause constraints on future business opportunities such as land, oil and gas resources, capital, employees and damage public goodwill. Thus a poor reputation from just one project can threaten access to resources and markets around the world. Mismanagement of biodiversity issues may result in losing reputation and fighting to survive in competitive markets.
A failure to pay attention to biodiversity issues by energy companies can cause project delays and further problems. If these issues are addressed prior to operation, complications such as management costs, conflicts with local communities or government confrontation may be avoided. Other potential risks that a company may encounter include delays and disruptions at project sites, loss of a societal license to operate, and loss of access to business resources such as oil and gas resources, land, capital and employees.
Furthermore, the increasing government and public pressure has led multilateral financial institutions, international commercial and invest-ment banks and export credit agencies to create standards and conditions for lending to large infrastructure developments, such as oil and gas projects. An example is the World Bank Group that has developed an independent review, the Extractive Industries Review (EIR)13, to talk about its future role in the oil, gas and mining sectors with their stakeholders. This will let them determine whether or not they will collaborate with the energy sectors.
There are numerous examples of biodiversity risk, ranging from Shell’s highly publicized row
98
SD & HSE special issueMOL Scientific Magazine
1MOL GROUP
with Greenpeace over the sinking of Brent Spar, an abandoned oil-rig, to the investment of the International Finance Corporation, the private arm of the World Bank Group, in a controversial mining project in Chile.
On the other hand, addressing biodiversity issues properly offers the companies opportunities to improve their financial performance and promote sustainability. When including biodiversity objectives early in the planning phase of new projects, this contributes to maintain the license to operate, and furthermore by monitoring change company can identify performance deterioration and address it in time. The general public responds more readily to evident biodiversity issues like wildlife conservations rather than to carbon dioxide emissions and ozone depletion with less tangible environmental impact. And a growing number of individual and institutional investors prefer to invest in socially responsible business, measured by several indexes, such as the Dow Jones Sustainability Index.
What are the impacts?The presence of an oil and gas operation in an area has differing impacts to ecosystems and biodiversity; the magnitude and scale of the impacts will often vary and can be indirect or direct. Some of the impacts include “soil, air and water contamination, habitat fragmentation and conversion, deforestation, erosion and sedimentation of waterways.”14 Furthermore, since oil and gas exploration and production often operate in undeveloped areas, successful exploration expeditions can have negative eco-nomic and social impacts, including “migration, spontaneous settlement, agricultural conversion and infrastructure development” that can cause even more harm to biodiversity through secondary impacts.
Primary impacts are direct impacts that result from a project’s presence in an area and should be considered as part of the project management during implementation and when implementing a standard environmental and social impact assess-ment. Primary impacts can be avoided or reduced if thorough operational management, impact mitigation and biodiversity conservation practices are implemented at the birth of a project.
Secondary impacts unlike primary ones are more difficult to control as they go beyond the scope of the project’s presence. The main factors driving secondary impacts are government decisions, human population changes, new economical activities such as infrastructure e.g. roads, ports and towns but in most cases the responsible party is usually difficult to determine.
Talking about the energy sector, it is relatively easier to integrate biodiversity issues into new projects or operations than into existing ones. The business case for integrating biodiversity shall be less obvious for existing facilities.
Some companies are addressing aspects of biodiversity to maximize opportunities. Shell for example operates in Gabon where most of the population is employed directly or indirectly for Shell. Shell has no direct control over Gambia, but where Shell has control like the Gambia terminal; it has put strict control such as controlling development, stopping hunting, reducing driving speed and times and managing emissions. However the presence of the Shell workers has impacted the community’s biodiversity through restricted agricultural activities and as the population will grow the demand for housing, food and other necessities will grow which will in turn increase the pressure on natural resource.
How can companies go beyond minimizing impacts?Accepting social responsibility means that a company has to work with others in seeking to minimize negative impacts which in turn contribute to positive sustainable development. Incorporating biodiversity issues means implementing them as well, once a company decides to operate in an area that has a high risk, it ought to do more than just adhering to the legal requirements. To integrate biodiversity into a business case a company has to look at its own values and principles. It is also extremely important for a company to educate its employees and shareholders about the value of adding biodiversity as a factor in business decisions.
13 www.web.worldbank.org / Extractive Industries Review Reports 14 EBI, Integrating Biodiversity Conservation into Oil & Gas Development

MOL Scientific MagazineSD & HSE special issue
1MOL GROUP
99
MOL Scientific Magazine
There are a set of standards that a company can use once it chooses to integrate biodiversity into its environmental management system. The ISO standards are the most popular templates used to integrate biodiversity into an environmental and management system.
When operating in a sensitive ecosystem it is advisable to apply a set of management actions that may include mitigation, compensation and investments in opportunities to benefit biodiversity conservation. In order for an orga-nization to understand the best way to preserve the biodiversity in the area where it will operate it ought to understand the laws and policies and also calculate the scale of impacts and act on any pressures imposed. Managing biodiversity entails working closely with stakeholders to assess the local economic, environmental and social situation in a project area.
What are other companies doing?In 2001, Shell was the first company to implement a biodiversity standard; the company also published a report, with the International Union for Conservation of Nature (IUCN), which describes the benefits for business to include biodiversity conservation into their strategies15.
Shell has a number of biodiversity projects that it has been working; in the Netherlands Shell has recently focused on protecting the bird migration route16. Using its innovative techniques Shell has tried to minimize the impact of its operations on the millions of migratory birds that cross the North Sea twice each year. The Nederlandse Aardolie Maatschappij BV (NAM) has recently implemented measures such as dimmed lighting and reduced flaring to protect the birds. The North Sea is a migration route for over 50 million birds that include songbirds, waders, birds of prey and other bird species. These birds have in the past been drawn in the NAM flares during well testing and have been killed. When NAM learned of this occurrence it stopped constant flares and started testing during daylight hours instead. When testing at night NAM now uses a professional bird watcher and will even stop testing if necessary in order to prevent the attraction of birds.
Exxon Mobil in PeruIn 1996 Mobil operated in Tambopata Candamao Reserve Zone (TCRZ) in Peru, the 1.5 million hectare rain forest system is home to some of the most rare and pristine biodiversity of Amazonia. When Mobil decided to end their exploration activities in 1998 they collaborated with the Peruvian Government and Conservation International to add TCRZ the Bahuaja-Sonene National Park which is now the 1.1 million hectare Tambopata National Reserve.
BP’s Deep-Sea Biodiversity ProgramBP has also been active in implementing positive impacts on biodiversity; its latest project is the Deep-Sea Biodiversity Program17. This program is a collaboration between a number of international marine science centers and BP.
The marine covers more than two thirds of the total surface area of the earth. The average depth of the oceans is almost 4 kilometer and is occupied by living organisms with more than half of them new to science. According to recent research the oceans may be more diverse than other environments accounting for about 10 million species or more. As very little is known about biodiversity in these deep water environments this project seeks to increase the knowledge of deep-sea science.
In order to show its commitment to improving knowledge of marine biodiversity BP is sponsoring two deep-sea biodiversity research fellowships, one at the Southampton Oceanography Centre, UK and the other at Texas A&M University, USA. The research fellows will collaborate for three years to research the seabed fauna in the deep Atlantic Ocean and the Gulf of Mexico.
15 Building Biodiversity Business, by Joshua Bishop, Sachin Kapila, Frank Hicks, Paul Mitchell and Francis Vorhies 16 http://www.shell.com/home/content/responsible_energy/environment/biodiversity/bio_case_studies/netherlands/
netherlands.html 17 http://www.ipieca.org/activities/biodiversity/downloads/case_studies/BP_DeepSea.pdf
100
SD & HSE special issueMOL Scientific Magazine
1MOL GROUP
The ENI and Shell Italia Agro biodiversityIn 2003 Eni and Shell Italia started the agriBioDiversity project18 in the ecologically sensitive area of Val d’Agri, southern Italy. Val d’Agri has extensive biodiversity, the area consist of a national park with protected flora and fauna and important community EU sites. The project has two other partners that include the The Fauna and Flora International (FFI) and the University of Basilicata.
The project was launched with two objectives to fulfill:
• to develop a biodiversity monitoring program as a tool to assess and reduce or mitigate the impacts of E&P activities.
• to define best practices for integrating biodiversity conservation into environmental management systems and operations.
The multi-partner collaboration entails a share of responsibilities based on each of the company’s strengths. Eni’s has overall managerial responsibility for the project providing logistical support in the field and is also responsible for the integration of project partners. Shell is responsible for implementing the end results of the monitoring program into operations. The FFI is mainly involved in the stakeholder engagement process and the local scientific community where it provides strategic advice. The University of Basilicata oversees the fieldwork activities, being also responsible for the increasing the stakeholder engagement and examining the social context of the Basilicata region.
Chevron in San Joaquin Valley19, CaliforniaChevron has in the past been a representative for Western States Petroleum Association on the Steering Committee for the conservation plan for the protected habitat in the valley floor of Kern County. Chevron is now also developing and permitting its own conservation plan to
protect approximately 13,500 acres of company land in the Lokern area of Kern County. The conservation plan will consists of a system of ‘land permits’ and ‘habitat credits’ that will only permit 10 percent use of the land whilst ensuring that the remaining area is offset for the resident listed species.
ConclusionEnsuring access to energy while maintaining biodiversity and vital ecosystem services will require an integrated multi-sector approach that includes:
• an ecosystem approach to management of biodiversity and natural resources that ensures inclusion of lessons learned in ongoing management of natural resources affected by energy production and use;
• a major shift in environmental governance to incorporate policies and incentives promoting energy production and use that mainstreams action to address biodiversity concerns, especially with respect to climate change; and
• increasing partnership with the private sector, including extractive industries and the financial sector, to promote energy programs that internalize the full costs on biodiversity and livelihoods.
MOL Group needs to increase its involvement in biodiversity related issues, such as developing a biodiversity management framework with guidelines for operations and new projects. The work has already started with gathering the existing biodiversity case studies, that will be posted on MOL’s website soon.
18 http://www.ipieca.org/activities/biodiversity/downloads/case_studies/agribiodiv.pdf 19 http://www.ipieca.org/activities/biodiversity/downloads/case_studies/Chevron_SanJoaquin.pdf
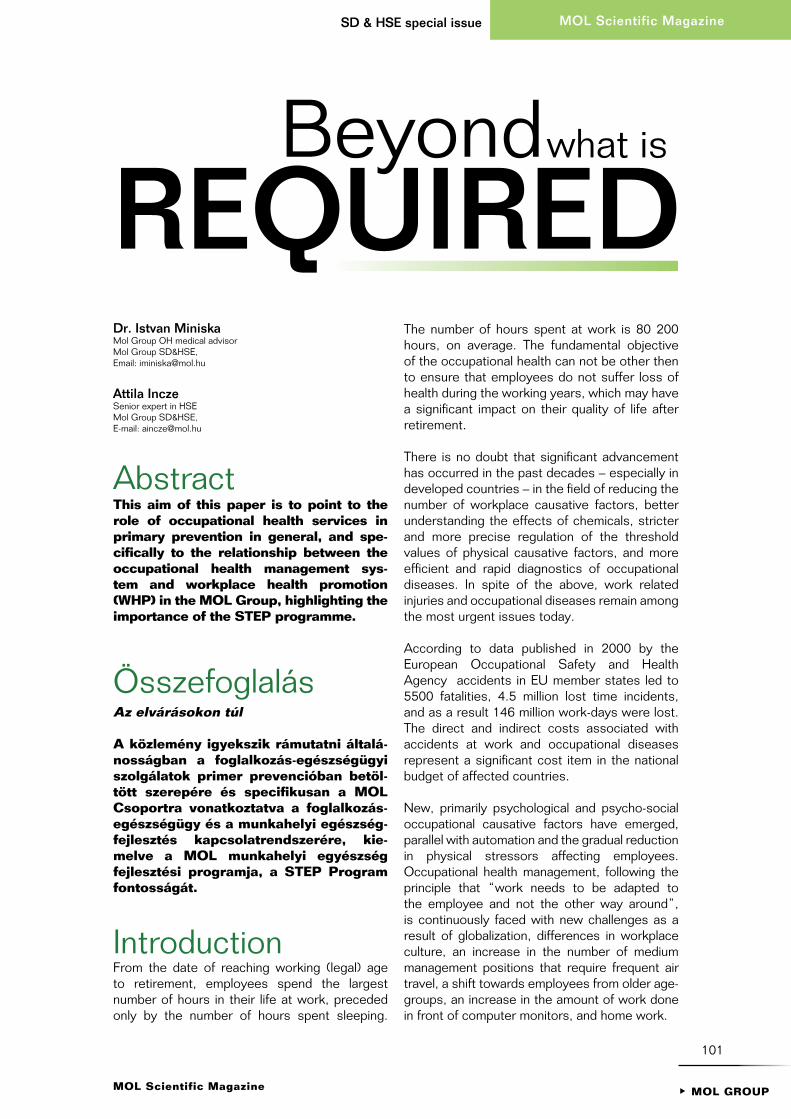
1MOL GROUP
101
MOL Scientific MagazineSD & HSE special issue
MOL Scientific Magazine
REQUIRED
Abstract This aim of this paper is to point to the role of occupational health services in primary prevention in general, and spe-cifically to the relationship between the occupational health management sys -tem and workplace health promotion (WHP) in the MOL Group, highlighting the importance of the STEP programme.
ÖsszefoglalásAz elvárásokon túl
A közlemény igyekszik rámutatni általá-nosságban a foglalkozás-egész ségügyi szol gálatok primer prevencióban betöl-tött szerepére és specifikusan a MOL Cso portra vonatkoztatva a foglalkozás-egészségügy és a munkahelyi egészség-fejlesztés kapcsolatrendszerére, kie-mel ve a MOL munkahelyi egyészség fej lesztési programja, a STEP Program fontosságát.
IntroductionFrom the date of reaching working (legal) age to retirement, employees spend the largest number of hours in their life at work, preceded only by the number of hours spent sleeping.
The number of hours spent at work is 80 200 hours, on average. The fundamental objective of the occupational health can not be other then to ensure that employees do not suffer loss of health during the working years, which may have a significant impact on their quality of life after retirement.
There is no doubt that significant advancement has occurred in the past decades – especially in developed countries – in the field of reducing the number of workplace causative factors, better understanding the effects of chemicals, stricter and more precise regulation of the threshold values of physical causative factors, and more efficient and rapid diagnostics of occupational diseases. In spite of the above, work related injuries and occupational diseases remain among the most urgent issues today.
According to data published in 2000 by the European Occupational Safety and Health Agency accidents in EU member states led to 5500 fatalities, 4.5 million lost time incidents, and as a result 146 million work-days were lost. The direct and indirect costs associated with accidents at work and occupational diseases represent a significant cost item in the national budget of affected countries.
New, primarily psychological and psycho-social occupational causative factors have emerged, parallel with automation and the gradual reduction in physical stressors affecting employees. Occupational health management, following the principle that “work needs to be adapted to the employee and not the other way around”, is continuously faced with new challenges as a result of globalization, differences in workplace culture, an increase in the number of medium management positions that require frequent air travel, a shift towards employees from older age-groups, an increase in the amount of work done in front of computer monitors, and home work.
Dr. Istvan Miniska Mol Group OH medical advisorMol Group SD&HSE,Email: [email protected]
attila InczeSenior expert in HSEMol Group SD&HSE,E-mail: [email protected]
Beyond what is


103
1MOL GROUP
MOL Scientific MagazineSD & HSE special issue
Occupational health management needs to be a truly multi-disciplinary science, since fitness for duty medical examinations constitute only a part of the occupational health management core services, and the doctor performing the assessment needs additional information, without which the diagnosis about fitness for placement cannot be credible. The doctor needs data from qualitative risk assessment, which if possible needs to be followed up by quantitative definitions and risk evaluation by an accredited laboratory. There is a need for information on work-load, ergonomic risks, the effect of chemicals used, in order to give a substantiated, professional opinion about the fitness of an employee to carry out certain tasks on a given job.
The role of occupational health services in primary prevention Irrespective of the fact whether the occupational health core services are provided by a company employee or a contOccupational health management needs to be a truly multi-disciplinary science, since fitness for duty medical examinations constitute only a part of the occupational health management core services, and the doctor performing the assessment needs additional information, without which the diagnosis about fitness for placement cannot be credible. The doctor needs data from qualitative risk assessment, which if possible needs to be followed up by quantitative definitions and risk evaluation by an accredited laboratory. There is a need for information on work-load, ergonomic risks, the effect of chemicals used, in order to give a substantiated, professional opinion about the fitness of an employee to carry out certain tasks on a given job.
The role of occupational health services in primary prevention Irrespective of the fact whether the occupational health core services are provided by a company employee or a contracted service provider, the medical officer will encounter regularly and in time that population of the employee stratum, which in the absence of symptoms, generally do not consult a general practitioner or specialist, or do so very rarely. In the latter case, in most instances this is considered secondary prevention at best.
The occupational health medical officer (service) has an undeniably important role in primary prevention and this activity does not require financing through the National Health Fund.
Knowing the operational difficulties that the domestic general practitioners and walk-in patient (emergency) clinical services face in terms of number of visits, their overload and the financing problems of the National Health Fund, and if these are compared with the cost efficiency associated with primary prevention, then the answer to the question is unambiguously clear: occupational health core services are important for employers because at present there is no one else that is able to provide these services and the employee produces better with a lawer investment.
It is evident that reducing the roles and res-ponsibilities of Occupational Health services would affect adversely all players however this would require amendments to the national regulations and none of the players would win. This solution would not result in extra revenues for the national budget, and the possibility for prevention provided by these services would be lost. These services would need to be purchased from the market, because this is partly a requirement/expectation under EU law. Such a change would also result in an economic loss for the employers, as an increasing number of businesses that calculate the return on investment realise the directly quantifiable material benefits of prevention.

104
SD & HSE special issueMOL Scientific Magazine
1MOL GROUP
The role of occupational health services in workplace health promotionAmong those listed above, we would like to highlight health promotion and within that workplace health promotion as the task-package that offers the largest potential for prevention, and the biggest social benefit. It could indeed be stated that there is not a single professional department within the health profession other than occupational health services that can or is able to carry out the responsibilities of workplace health promotion. Naturally, the initiatives of NGOs and associations in the field of workplace health promotion are very useful, but the effective coordination of such programs requires the involvement of in-house services. Some examples of programmes that require in-house (employer) coordination, without the need for completeness: “give up smoking” programme, weight-loss programme and diet consulting, workplace gym and aerobics, lifestyle change advice, etc., not to mention certain health screening programmes.
Again it is important to underscore the economic benefits arising from National Health Fund cost savings, since the material aspects of such programmes may be significant.
Workplace health promotion as a productivity enhancing tool for companiesThe key objective is to create an adequate company health culture, which encompasses the company’s health promotion traditions, defines what is considered important and appropriate, and this is expressed in the company health policy, its values and day-to-day practice.
This is the only path to invoke the personal responsibility and commitment of the employees in connection with their living- and working conditions and personal health improvement. Various studies conducted by European companies show that there is a quantifiable association between the company’s health culture, employee motivation, customer satis-faction, economic success, productivity and profitability. Factors that disrupt internal communications or erode credibility immediately show in the economic success of the company.
Loss or lack of health as a cost Since the amount of company funds available for improving and promoting health conditions is limited, it is necessary to assess the utilisation of resources available for implementing a programme, because the funds used for a particular programme results in pulling funds from another prog ramme (opportunity costs). Con-sequently a cost-benefit ana lysis of programmes planned for implementation needs to be carried out. The results of cost-benefit analyses of implemented company workplace health promotion prog rammes generally indicate sig-nificant returns. The returns from an investment of 1 Euro into workplace health promotion yields returns between 1.5 – 6 Euros.
In a study involving 946 000 employees, a com-parison was made between costs of workplace
Integration of the Occupational Healthin the MOL Corporate Health Culture
Company Health Culture
Occupational Health Management System
Occupational
Medical
Examinations
and Programs
Emergency
Medical
Response
and First Aid
at Workplaces
Health
Promotion
Chemical Management, Health Hazard Control Procedures, Ergonomic
Industrial Hygiene Qualitative and Quantitative Assesment
Organization Education and Skills Commitment
Figure 1. The relationship between occupational health and workplace health promotion

105
MOL Scientific MagazineSD & HSE special issue
1MOL GROUP
health promotion and productivity. The results of the study indicated cost savings of up to 26% (Medstat, USA)
A study conducted by Citibank to assess cost savings from health promotion targeted at the employee group with highest risk factor indicated $4.7 savings for every dollar spent.
This indicates that customised and coordi nated health promotion programmes can be considered a long-term investment for companies. Accor ding to EU studies, savings of 400-500 Bn HUF could be realised through minimising loss of health associated with work in Hungary.
The following indicators are used for measuring the economic and health utility of workplace health promotion programmes:
• absence rate• migration• morbidity indexes• number of work accidents• productivity• product quality, number of claims • company image• extent of identification with the company• proposals for improvement• better workplace atmosphere and
improved interpersonal relations• number of jobs with improved ergonomic
indicators• number of jobs where harmful
environmental impacts are minimised • number of employees participating in
health-related training and other vocational training/courses
• change in attitude towards health and healthy lifestyle
• reduction of risk factors
Nonetheless it is clear that prevention requires immediate and considerable investment on behalf of the company, the implementation of these programmes incurs costs on the short term, while benefits are realised only on the long term. It is also a fact that, contrary to healing activities, there is considerably less scientific evidence about health promotion and prevention programmes (including workplace health promotion programmes). This means that our decisions are not based on hard evidence as is the case for classical healing, but on less substantiated arguments, mostly model-based calculations.
It is thus obvious that the aim of workplace health promotion programmes cannot be limited to cost savings alone. The objective of these programmes is to increase the number of quality years in employees’ lives with cost-efficient, preventive and healing activities, which require significant investment and with the workplace playing an important role in prevention.
Workplace health promotion International examplesU S A
Wellness and fitness programmes became extremely popular in the USA two-three decades ago. These played an important role in the increase in the number of various health promotion clubs. Millions of Americans spend several hours a week or day running, power walking, biking and with other forms of exercise. It is estimated that most Americans are involved in aerobics, with the number growing from 37 to 60 million. This form of exercise is the most popular for members of the middle class and in the 20-50 year old age group.
There was also a similar boom in the area of workplace health promotion in the US in the 70-ies. This is when the first workplace health promotion programmes appeared. The key objective of these programmes was to cut the costs associated with loss of health, since 30 percent of these expenditures were covered by US companies at that time. Health-related expenditures of companies increased from 20 to 30 percent within one year in the 70-ies, and American companies paid $90 Bn in 1984 in the form of employee insurance. The first programmes that successfully decreased these types of expenses and reduced the rate of loss of health were targeted at existing problems and diseases, and prevention was not a key area of focus at the time.
W O R K P L A C E H E A L T H P R O M O T I O N I N E U M E M B E R S T A T E SWorkplace health promotion is an important issue in European Union member states, therefore a
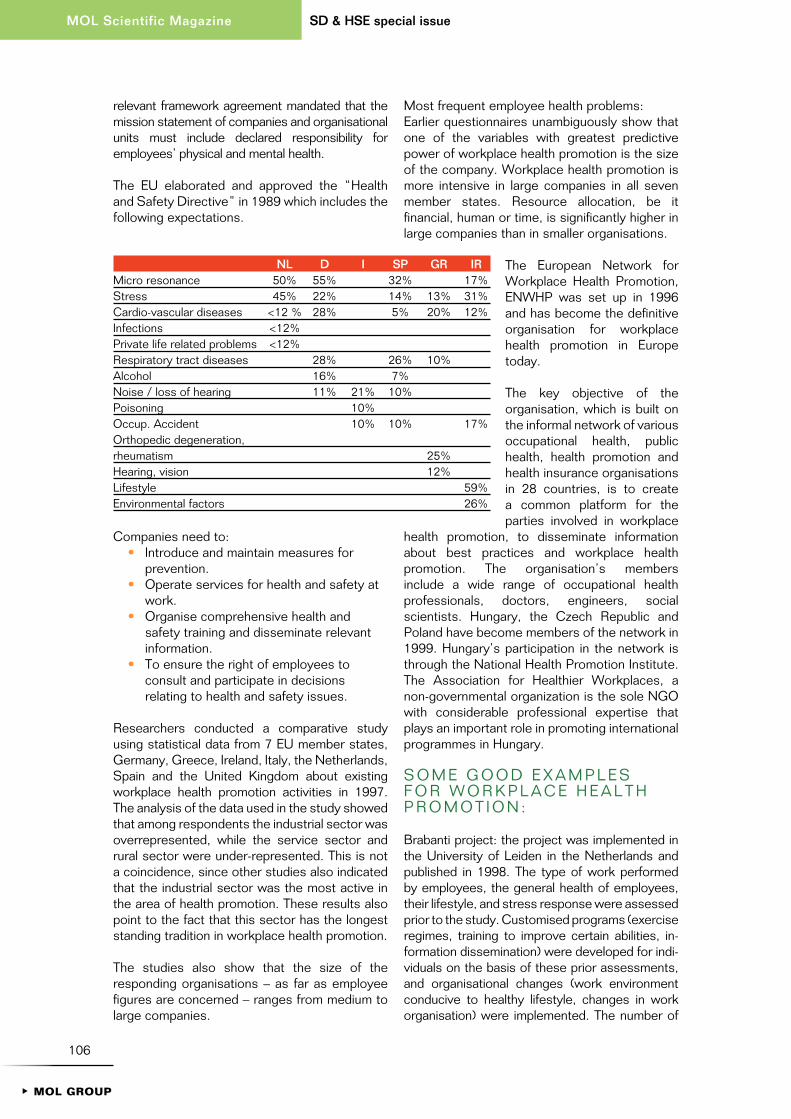
106
SD & HSE special issueMOL Scientific Magazine
1MOL GROUP
relevant framework agreement mandated that the mission statement of companies and organisational units must include declared responsibility for employees’ physical and mental health.
The EU elaborated and approved the “Health and Safety Directive” in 1989 which includes the following expectations.
Companies need to:• Introduce and maintain measures for
prevention.• Operate services for health and safety at
work. • Organise comprehensive health and
safety training and disseminate relevant information.
• To ensure the right of employees to consult and participate in decisions relating to health and safety issues.
Researchers conducted a comparative study using statistical data from 7 EU member states, Germany, Greece, Ireland, Italy, the Netherlands, Spain and the United Kingdom about existing workplace health promotion activities in 1997. The analysis of the data used in the study showed that among respondents the industrial sector was overrepresented, while the service sector and rural sector were under-represented. This is not a coincidence, since other studies also indicated that the industrial sector was the most active in the area of health promotion. These results also point to the fact that this sector has the longest standing tradition in workplace health promotion.
The studies also show that the size of the responding organisations – as far as employee figures are concerned – ranges from medium to large companies.
Most frequent employee health problems:Earlier questionnaires unambiguously show that one of the variables with greatest predictive power of workplace health promotion is the size of the company. Workplace health promotion is more intensive in large companies in all seven member states. Resource allocation, be it financial, human or time, is significantly higher in large companies than in smaller organisations.
The European Network for Workplace Health Promotion, ENWHP was set up in 1996 and has become the definitive organisation for workplace health promotion in Europe today.
The key objective of the organisation, which is built on the informal network of various occupational health, public health, health promotion and health insurance organisations in 28 countries, is to create a common platform for the parties involved in workplace
health promotion, to disseminate information about best practices and workplace health promotion. The organisation’s members include a wide range of occupational health professionals, doctors, engineers, social scientists. Hungary, the Czech Republic and Poland have become members of the network in 1999. Hungary’s participation in the network is through the National Health Promotion Institute. The Association for Healthier Workplaces, a non-governmental organization is the sole NGO with considerable professional expertise that plays an important role in promoting international programmes in Hungary.
S O M E G O O D E X A M P L E S F O R W O R K P L A C E H E A L T H P R O M O T I O N :
Brabanti project: the project was im plemented in the University of Leiden in the Netherlands and published in 1998. The type of work performed by employees, the general health of employees, their life style, and stress response were assessed prior to the study. Custo mised programs (exercise regimes, training to improve certain abilities, in-formation dissemination) were developed for in di-vi duals on the basis of these prior assessments, and orga nisational changes (work en vironment conducive to healthy lifestyle, changes in work organisation) were im plemented. The num ber of
nL D I SP GR IRMicro resonance 50% 55% 32% 17%Stress 45% 22% 14% 13% 31%Cardio-vascular diseases <12 % 28% 5% 20% 12%Infections <12% Private life related problems <12% Respiratory tract diseases 28% 26% 10% Alcohol 16% 7% Noise / loss of hearing 11% 21% 10% Poisoning 10% Occup. Accident 10% 10% 17%Orthopedic degeneration, rheumatism 25% Hearing, vision 12% Lifestyle 59%Environmental factors 26%
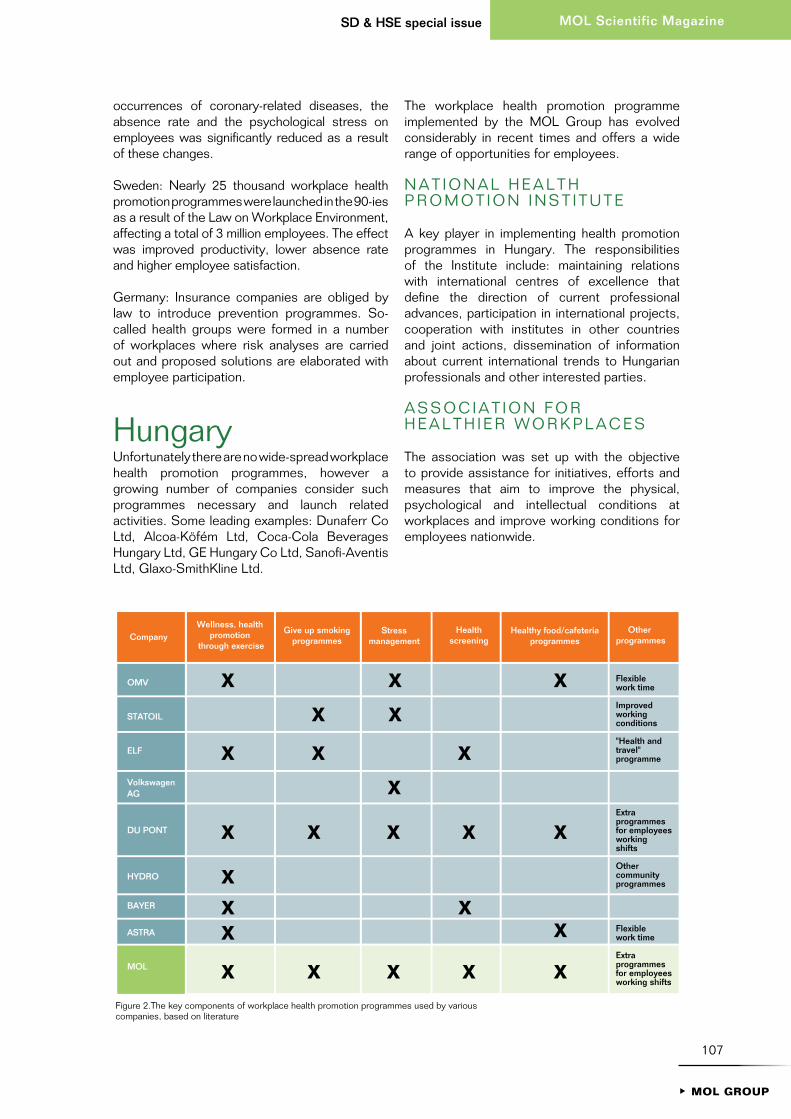
107
MOL Scientific MagazineSD & HSE special issue
1MOL GROUP
occurrences of coronary-related diseases, the absence rate and the psychological stress on employees was significantly reduced as a result of these changes.
Sweden: Nearly 25 thousand workplace health promotion programmes were launched in the 90-ies as a result of the Law on Workplace Environment, affecting a total of 3 million employees. The effect was improved productivity, lower absence rate and higher employee satisfaction.
Germany: Insurance companies are obliged by law to introduce prevention programmes. So-called health groups were formed in a number of workplaces where risk analyses are carried out and proposed solutions are elaborated with employee participation.
HungaryUnfortunately there are no wide-spread workplace health promotion programmes, however a growing number of companies consider such programmes necessary and launch related activities. Some leading examples: Dunaferr Co Ltd, Alcoa-Köfém Ltd, Coca-Cola Beverages Hungary Ltd, GE Hungary Co Ltd, Sanofi-Aventis Ltd, Glaxo-SmithKline Ltd.
The workplace health promotion programme implemented by the MOL Group has evolved considerably in recent times and offers a wide range of opportunities for employees.
N A T I O N A L H E A L T H P R O M O T I O N I N S T I T U T E
A key player in implementing health promotion programmes in Hungary. The responsibilities of the Institute include: maintaining relations with international centres of excellence that define the direction of current professional advances, participation in international projects, cooperation with institutes in other countries and joint actions, dissemination of information about current international trends to Hungarian professionals and other interested parties.
A S S O C I A T I O N F O R H E A L T H I E R W O R K P L A C E S
The association was set up with the objective to provide assistance for initiatives, efforts and measures that aim to improve the physical, psychological and intellectual conditions at workplaces and improve working conditions for employees nationwide.
Wellness, health promotion
through exerciseCompany
Other programmes
Give up smoking programmes
Stress management
Health screening
Healthy food/cafeteria programmes
OMV
STATOIL
ELF
Volkswagen AG
DU PONT
HYDRO
BAYER
ASTRA
MOL
Flexible work time
Improved working conditions
"Health and travel" programme
Extra programmes for employees working shifts
Other community programmes
Flexible work time
Extra programmes for employees working shifts
x x xx x
x x xx
xxxxx
xxxxxx
xxx
x
Figure 2.The key components of workplace health promotion programmes used by various companies, based on literature
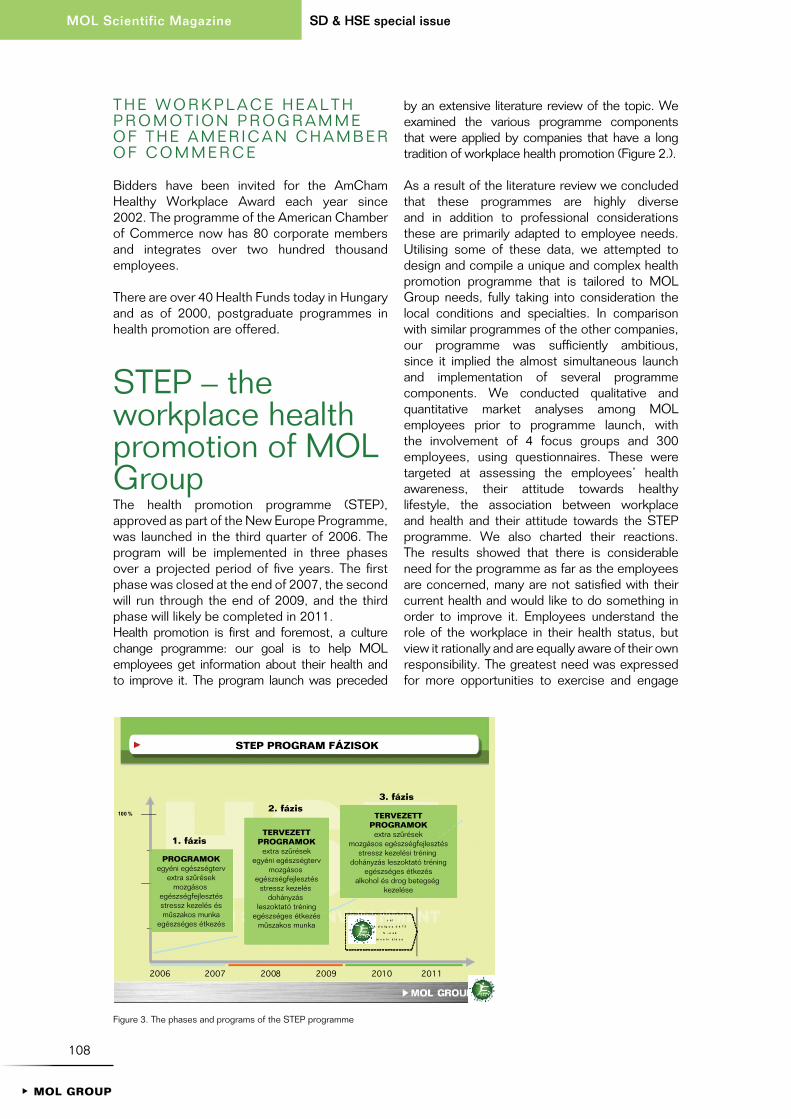
108
SD & HSE special issueMOL Scientific Magazine
1MOL GROUP
6 2007 2008 2009 2010 2011
00 %
c é l
A d o l g o z ó k 7 5
% - n a k
i n v o l v á l á s a
200
1
STEP PROGRAM FÁZISOK
PROGRAMOKegyéni egészségterv
extra szûrésekmozgásos
egészségfejlesztésstressz kezelés ésmûszakos munka
egészséges étkezés
TERVEZETTPROGRAMOK
extra szûrésekegyéni egészségterv
mozgásos egészségfejlesztés
stressz kezelés dohányzás
leszoktató tréningegészséges étkezés
mûszakos munka
TERVEZETTPROGRAMOK
extra szûrésekmozgásos egészségfejlesztés
stressz kezelési tréning dohányzás leszoktató tréning
egészséges étkezésalkohol és drog betegség
kezelése
1. fázis
2. fázis3. fázis
Figure 3. The phases and programs of the STEP programme
T H E W O R K P L A C E H E A L T H P R O M O T I O N P R O G R A M M E O F T H E A M E R I C A N C H A M B E R O F C O M M E R C E
Bidders have been invited for the AmCham Healthy Workplace Award each year since 2002. The programme of the American Chamber of Commerce now has 80 corporate members and integrates over two hundred thousand employees.
There are over 40 Health Funds today in Hungary and as of 2000, postgraduate programmes in health promotion are offered.
STEP – the workplace health promotion of MOL GroupThe health promotion programme (STEP), approved as part of the New Europe Programme, was launched in the third quarter of 2006. The program will be implemented in three phases over a projected period of five years. The first phase was closed at the end of 2007, the second will run through the end of 2009, and the third phase will likely be completed in 2011. Health promotion is first and foremost, a culture change programme: our goal is to help MOL employees get information about their health and to improve it. The program launch was preceded
by an extensive literature review of the topic. We examined the various programme components that were applied by companies that have a long tradition of workplace health promotion (Figure 2.).
As a result of the literature review we concluded that these programmes are highly diverse and in addition to professional considerations these are primarily adapted to employee needs. Utilising some of these data, we attempted to design and compile a unique and complex health promotion programme that is tailored to MOL Group needs, fully taking into consideration the local conditions and specialties. In comparison with similar programmes of the other companies, our programme was sufficiently ambitious, since it implied the almost simultaneous launch and implementation of several programme components. We conducted qualitative and quantitative market analyses among MOL employees prior to programme launch, with the involvement of 4 focus groups and 300 employees, using questionnaires. These were targeted at assessing the employees’ health awareness, their attitude towards healthy lifestyle, the association between workplace and health and their attitude towards the STEP programme. We also charted their reactions. The results showed that there is considerable need for the programme as far as the employees are concerned, many are not satisfied with their current health and would like to do something in order to improve it. Employees understand the role of the workplace in their health status, but view it rationally and are equally aware of their own responsibility. The greatest need was expressed for more opportunities to exercise and engage

109
MOL Scientific MagazineSD & HSE special issue
1MOL GROUP
in sports, followed by healthy food at work and stress management techniques. When asked, many responded that they feel it is important for the employer to support health screening.
A control and decision-making body was set up before the program was launched. The members of this body consisted of HSE experts, doctors, communications experts and employee representatives (workers council). A detailed schedule and budget was prepared in each phase, we assessed our resources and allocated the costs that arose in the course of programme implementation. We attributed great importance to communication of results. We anticipate by the end of the end of the 5th year, a 10% decrease in absence rate, a significant improvement in employee health, a decrease or no change in the number of chronic diseases, and improvement in health awareness. Our plans are to involve 75% of the employees in the programme by the end of the first five years. Programme participants are those that are registered into the programme and actively participated.
The following variables are measured to assess employee health:
• blood pressure• BMI (body mass index)
• waist circumference• total cholesterol• HDL, LDL• blood fat • other laboratory parameters• Long-term, statistical monitoring of all
registered chronic diseases according to IND codes and comparison with domestic/international data
• exercise• smoking• alcohol consumption• food consumption • drug abuse/consumption• number of emergency/hospitalisation
occurrences
The primary target group of the programme constitutes, next to the specific target groups, those employees who are open to a healthy lifestyle, but do nothing or very little to pursue one. Although the programme is focused directly at MOL employees and their family members, the broader advantageous effects of the programme are also important. We supported the implementation of the programme with a promotion campaign. The objective of the campaign was to involve this specific target group into the programme. We organised health
Indicator Chronic threshold Control group I. Control group II. Data collection
Blood pressure 135/85 Hgmm MOL employees Regional public Pre-placement
not participating health database assessment test, ANTSZ
in the programme
BMI >25 MOL employees
Regional public Pre-placement not participating
health database assessment test, ANTSZ in the programme
Cholesterol level >5.2 mmol/L MOL employees
Regional public Pre-placement not participating
health database assessment test, ANTSZ in the programme
Diabetes mellitus Specialist opinion MOL employees e Regional public Pre-placement
not participating health database assessment test, ANTSZ
in the programme
Exercise none of not regular MOL employees
Regional public
questionnaire, ANTSZ not participating health database
in the programme
Smoking smoker MOL employees
Regional public
Pre-placement not participating health database
in the programme
Food consumption
Complains with quantity MOL employees
Regional public questionnaire, ANTSZ
and quality not participating
health database assessment test, ANTSZ in the programme
Alcohol consumption
Regular consumption MOL employees
Regional public
Pre-placement not participating
health database
assessment test, ANTSZ in the programme
Drug consumption Regular consumption
MOL employees Regional public
questionnaire, ANTSZabuse not participating
health database in the programme
Emergency medical MOL employees
questionnaireservices, hospitalisation
not participating in the programme
Figure 4. Indicators used for monitoring employee health
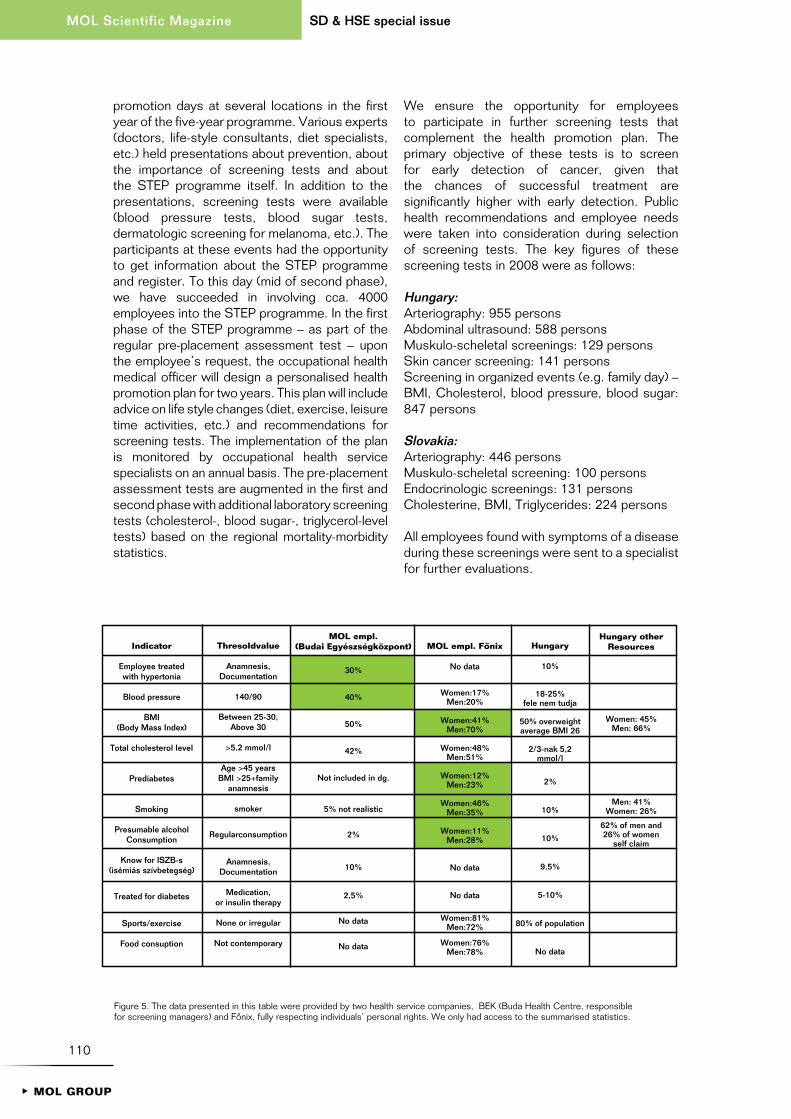
110
SD & HSE special issueMOL Scientific Magazine
1MOL GROUP
Indicator
Employee treatedwith hypertonia
Blood pressure
BMI (Body Mass Index)
Total cholesterol level
Prediabetes
Smoking
Presumable alcoholConsumption
Know for ISZB-s(isémiás szívbetegség)
Treated for diabetes
Sports/exercise
Food consuption
Thresoldvalue
Anamnesis,Documentation
140/90
Between 25-30, Above 30
>5.2 mmol/l
Age >45 years BMI >25+family
anamnesis
smoker
Regularconsumption
Anamnesis,Documentation
Medication, or insulin therapy
None or irregular
Not contemporary
MOL empl.(Budai Egyészségközpont)
30%
40%
50%
42%
Not included in dg.
5% not realistic
2%
10%
2,5%
No data
No data
MOL empl. Fônix
No data
Women:17%Men:20%
Women:41%Men:70%
Women:48%Men:51%
Women:12%Men:23%
Women:46%Men:35%
Women:11%Men:28%
No data
No data
Women:81%Men:72%
Women:76%Men:78%
Hungary
10%
18-25%fele nem tudja
50% overweightaverage BMI 26
2/3-nak 5,2mmol/l
2%
10%
10%
9,5%
5-10%
80% of population
No data
Hungary otherResources
Women: 45%Men: 66%
Men: 41%Women: 26%
62% of men and 26% of women
self claim
Figure 5. The data presented in this table were provided by two health service companies, BEK (Buda Health Centre, responsible for screening managers) and Fônix, fully respecting individuals’ personal rights. We only had access to the summarised statistics.
promotion days at several locations in the first year of the five-year programme. Various experts (doctors, life-style consultants, diet specialists, etc.) held presentations about prevention, about the importance of screening tests and about the STEP programme itself. In addition to the presentations, screening tests were available (blood pressure tests, blood sugar tests, dermatologic screening for melanoma, etc.). The participants at these events had the opportunity to get information about the STEP programme and register. To this day (mid of second phase), we have succeeded in involving cca. 4000 employees into the STEP programme. In the first phase of the STEP programme – as part of the regular pre-placement assessment test – upon the employee’s request, the occupational health medical officer will design a personalised health promotion plan for two years. This plan will include advice on life style changes (diet, exercise, leisure time activities, etc.) and recommendations for screening tests. The implementation of the plan is monitored by occupational health service specialists on an annual basis. The pre-placement assessment tests are augmented in the first and second phase with additional laboratory screening tests (cholesterol-, blood sugar-, triglycerol-level tests) based on the regional mortality-morbidity statistics.
We ensure the opportunity for employees to participate in further screening tests that complement the health promotion plan. The primary objective of these tests is to screen for early detection of cancer, given that the chances of successful treatment are significantly higher with early detection. Public health recommendations and employee needs were taken into consideration during selection of screening tests. The key figures of these screening tests in 2008 were as follows:
Hungary:Arteriography: 955 personsAbdominal ultrasound: 588 personsMuskulo-scheletal screenings: 129 personsSkin cancer screening: 141 personsScreening in organized events (e.g. family day) – BMI, Cholesterol, blood pressure, blood sugar: 847 persons
Slovakia:Arteriography: 446 personsMuskulo-scheletal screening: 100 personsEndocrinologic screenings: 131 personsCholesterine, BMI, Triglycerides: 224 persons
All employees found with symptoms of a disease during these screenings were sent to a specialist for further evaluations.

111
MOL Scientific MagazineSD & HSE special issue
1MOL GROUP
As the data in the table indicate, there is no significant difference (with a few exceptions) in comparison with national data. As a general summary it can be concluded that female employees (both in Hungary and Slovakia) lead a significantly more health-conscious life and have better health indicators than their male counterparts. The proportion of smokers is highest among male employees ranked in occupational health category “A” and “B”, therefore this is where “give-up smoking” programmes may have the greatest impact. There is a growing trend of high blood-pressure (hypertonia) and high cholesterol in elderly age groups (over 60% of the employees over age 50 have elevated blood cholesterol levels and over 50% suffer from hypertonia). Pre-diabetes is a condition that is a precursor to diabetes, people classified into this group are over age 45, overweight and a close family member (parents, grandparents, siblings) is/was suffering from diabetes. The frequency of elevated blood sugar values (on empty stomach) was high in test results of older age groups, especially those between age 50-59. The occurrence of high blood pressure is alarmingly high among Hungarian managers, this figure is worthy of consideration. When probed with questions about exercise and physical activity, the female respondents demonstrated a higher frequency of regular physical activity than males. Also, category “C” and “D” employees and members of younger age groups exercise more regularly. Data collected in Slovakia show that smoking and obesity is less of a problem, however lipid metabolism problems, pre-diabetes and high blood pressure occurred more frequently.
A “STEP corner”, a promotion stand was set up at health promotion events organised during the first and first half of second phase and at other national and company events. These stands offered simple screening tests (blood pressure, blood sugar, BMI, etc.)
The most popular voluntary screening test among MOL employees was the nevus (birth mark) screening test. The programme is flexible and screening tests are always and fully adapted to employee needs. To date the screening tests performed were mostly those that are not equipment intensive and these were always provided at the workplace.
The programme, being adapted to employee needs, focuses on health promotion through exercise, physical activity and improved quality of cafeteria meals. In addition to the above, since nearly 40% of MOL employees work shifts,
following a detailed preliminary assessment, we designed a separate programme for these employees.
Health promotion that is based on physical ac-tivity may increase employees’ health conscious-ness. Some employees were already actively engaged in group physical activities at the start-up of the STEP programme (soccer, other ball-games). We provided further incentives through a grant fund for these initiatives and for those who did not engage in regular activity, but were open to some form of sports.
A total of 2762 employees received grants from a total amount of HUF 6 million. An independent, 5-member board evaluated the bids/proposals with preference for those physical activity types, which involved the highest number of employees and resulted in long-term changes in life style. The winners received gym/fitness membership cards, swimming pool tickets, access to recreational facilities, sports equipment, and support to organise sporting events.
We provide detailed information to employees about a number of local and regional recreational programmes, where dedicated MOL stands/tents and animators help visitors with registration, provide information about events, assist preparation and actively support participation. We launched a complex STEP-fit programme for employees in Slovakia in the beginning of 2007. This programme includes sports and is combined with a sauna and massage season-ticket.
The STEP diet programme is designed to provide a STEP menu in the restaurants operating in corporate premises. The menu is compiled by experts and ingredients and the technique satisfy today’s requirements for healthy and safe food, including the caloric intake. Naturally we also ensure that our employees have access to healthy food in cafes and buffets, including vegetables, fruits at reasonable prices. We have diet experts at numerous MOL programmes and events who provide first-hand advice and answer questions about food and diet.
Many studies conclude that workers doing shifts suffer from various health and mental problems. We have introduced questionnaires and various tests to assess the complex health hazards caused by the 3 shift system and to obtain a detailed picture about the overall condition of the target group. A workshop was organised to assess the employees’ needs and the results
112
SD & HSE special issueMOL Scientific Magazine
1MOL GROUP
indicate that 24 hour access to warm food and various recreation opportunities were the most important for shift workers. It was also noted, that they would welcome other channels communication (newsletter, advertisements on the boards in control rooms, etc.) for obtaining information about current STEP activities because they have limited access to computers and email, which are the primary source of intra-company communications.
Representatives delegated from plants and unions provide important help in assessing the needs of those employees who work shifts, but we plan to further increase the extent of cooperation (because we experienced problems with information flow).
Today there is a possibility in all major operating units to keep food refrigerated and to warm it and we are working on securing 24 hour access to warm food.
Unfortunately, stress has become a part of day-to-day life and the frequency of occurrence of stress related mental and physical diseases in growing in the region. Among MOL employees, mostly white-collar workers complain about increasing mental load and there is an explicit need on their behalf for relevant health promotion programmes.
We plan to support programmes that are targeted at reducing workplace stress in order to manage stress related health-risks. These include programmes where employees learn relaxation techniques and methods to manage day-to-day workplace and other stress situations. Training dates have been set to flexibly adapt to employee needs. Stress management courses are offered on weekends as full-day training or after working hours during week-days with 1.5 – 2 hour sessions held once a week. Participants fill in a questionnaire before and after the training and these help to assess how they succeeded in implementing the learnt techniques in day-to-day life.
MOL management, understanding the im por-tance of workplace stress management and in order to comply with regulations, decided in June 2008 that the entire stress management topic will be removed from workplace health promotion programmes and integrated into the occupational health management system. At the same time stress management training, as regularly accessible training is planned to be open in the corporate education and training package as of 2009.
We have started organising the actions that target employees who plan to give up smoking. The assessment of employee needs indicated the least interest in this area. Also, in recent years several “give up smoking” training courses were organised at several operating units, therefore we will launch this programme component only in 2009.
One of the key objectives of the WHO programme European Alcohol Action is to reduce hazards caused by alcohol consumption, especially workplace accidents and violence. The programme recommends the development of a workplace policy, which is based on education, prevention and early treatment recommends, and integrated into the workplace health promotion. Our plans in connection with managing the problem are the following:
Since we have a number of employees who frequently travel abroad, often to far away places, we would like to provide help to these employees in the third phase with close cooperation of the Human Resources Organisation. This will involve providing detailed information that helps employees to land on their feet fast in a new environment.
We regularly inform our employees about the STEP programme and other achievements at MOL events and programmes, and in the company newsletter. This way we also reach out to the employees’ family members and we hope that we can contribute to their lifestyle change as well. In addition we strive to present and publish our results at every possible national and international forum. In 2007 we presented the programme at the Safety Section of the annual meeting of the Hungarian Chemical Society, the „Marketing and Communication in Health” congress and we participated at the Move Europe conference organised in June 2007 by the National Health Promotion Institute. In 2008 we presented our programs at the DoPont safety conference, where we won a special aword for the best presentation.The STEP program also was presented at the management conference of Enterprise for Health in London.
A wide-ranging commitment on behalf of both, the employees and the employer, support for health as a priority in the workplace strategy, the involvement of experts as a technical source and as facilitators, the use of qualitative and quantitative research methods, continuous monitoring and assessment of results for programme refinement are needed for the successful implementation of the programme. We design specific questionnaires
113
MOL Scientific MagazineSD & HSE special issue
1MOL GROUP
to probe satisfaction and measure the success rate of individual programmes. The question naturally is: how can we measure the success of the STEP programme? We hope that the absence rate, health risk factors, the risk of chronic diseases can be reduced significantly, and the employees’ attitude towards health will change on the long-term.
References[1] Enterprise for Health European
Network (EfH):Successful, Healthy Enterprises in Europe
Bertelsmann Stiftung, BKK Bundesverband, Berlin, 2005, pp.9 - pp.56.[2] Medstat. cit. Ulich E., EfH, 2002[3] Citibank felmérés cit. Ulich E., EfH, 2002[4] Dr. Wynne, Richard – Dr. Anderson,
Robert: Development of workplace health promotion in Europe – International Conference. Budapest, 20-21 March 1998.
[5] Dr. Kuhn, Karl: Methodology of workplace health promotion – International Conference. Budapest, 20-21 March 1998
[6] Griffith, John: Workplace health promotion in Wales with „partner relationship” – International Conference. Budapest, 20-21 March 1998
[7] Walsh DC, et al.: Health promotion versus health protection? Employees’ perceptions and concerns – J. Public Health Policy. 1991 Summer, 12(2): 148-64
[8] Conrad P., et al.: The new corporate health ethic: lifestyle and the social control of work. – Int. J Health Serv. 2002, 22(1): 89-111. Review.
[9] Dr. Wynne, Richard – Clarkin, Nadia: Under Construction – Building for Health in the EC Workplace, European Foundation for the Improvement of Living and Working Conditions, 1992 p.83-99
[10] Ua.: p. 153-154[11] Eakin JM.: Leaving it up to the workers:
sociological perspective on the management of health and safety in small workplaces. – Int. J. Health Serv. 1992, 22(4): 689-704.
[12] Fielding JE: Occupational health physicans and prevention – J. Occup. Med. 1991 Mar.,33(3): 314-326
[13] Stokols D, et al.: Integration of medical care and worksite health promotion. JAMA. 1995 Apr., 12, 273(14): 1136-42.
[14] Crump CE, et al.: Effect of organisation – level variables on differential employee participation in 10 federal worksite health promotion programs. – Health Educ q. 2000 May., 23(2): 204-23.
[15] Sorensen G, et al.: Worker participation in an integrated health promotion/health protection program. – Health Educ q. 1996 May., 23(2): 191-203.
[16] Stonecipher LJ, et al.: Health practices before and after a work-site health screening. Differences among subpopulations of employees. – J. Occup. Med. 1993 Mar., 35(3): 297-306.
[17] Selleck CS, et al.: Health promotion at the workplace. – AAOHN J. 1989 Oct., 37(10): 412-22.
[18] Risner PB, et al.: Health promotion services and evaluation in the workplace: pragmatic issues. – AAOHN J. 1995 Jan., 43(1): 12-6.
[19] Pencak M.: Workplace health promotion programs. An overview. – Nurs. Clin. North Am. 1999 Mar.,26(1): 233-40. Review
[20] Maes S, et al.: Effects of a Dutch work-site wellness-health program: the Brabantia Project. – Am. J. Public Health. 1998 Jul., 88(7) : 1037-41.
[21] Marwick, Charles: Healthy Workplace: Employers, Employees Benefit – JAMA, Dec.2, 1992-Vol 268, No.21 p.: 3041-42.
[22] Dr. Miniska István: Occupational health services in multinational companies – professional and economic sucess, Csa ládorvosi Fórum, 2007/ 8, p.:30-36.
Revised by: Sára Felszeghy MD, PHD, country level OH supervisor, professor of the Berzsenyi Dániel College and University of Miskolc

1MOL GROUP
AbstractIn the last few decades plastic production increased rapidly all over the word, and because of this also the plastic waste in the environment is getting higher and higher, resulting more environmental load. The case is especially serious in the field of packaging materials. If we would be able to develop modified base materials in these areas, which are biologically degradable, we could decrease the negative effect to the environment significantly. We can get such materials in two ways: on the one hand we can produce 100% degradable plastics; on the other hand we can modify traditional polymers with special additives to become degradable.In our article we overview a survey of the effects of synthetic plastics’ on the environment, and on their recycling possibilities. We describe the bases of the biological degradation and the main types of degradable polymers.
Additionally we emphasize the biological degradability of polyolefins, produced by TVK PLC.In the experimental part we describe a method in case of a chosen polypropylene type, whereby the initialization of the polyolefin’s degradation process is ob-tainable and methods to control, mo-nitor the process. The examinations partly were made by Nor-X Industry AS Norway Company who contributed to the execution of the experiments by their products and equipments.
ÖsszefoglalásA jövô mûanyaga a környezetért – bio lógiailag lebomló mûanyagok elôál lí-tásának lehetôségei
A világon a mûanyagtermelés az utóbbi évtizedekben óriási szintre nôtt, ezért egyre nagyobb mennyiségben kerülnek ki a környezetbe mûanyag hulladékok, amelyek jelentôs mértékben növelik an nak szennyezettségét. Ez leginkább a csomagolóanyagok területére igaz. Amen nyiben ezen a területen képesek lennénk olyan módosított alapanya go-kat kifejleszteni, melyek biológiai úton le bomlóak lennének, azzal jelentôs mér tékben hozzá tudnánk járulni a kör-nyezeti terhelés csökkentéséhez. Ilyen alapanyagokat két úton kaphatunk: egy részt eleve 100 %-ban lebomló mû-a nya gokat gyártunk, másrészt a ha gyo-mányos po li mereket bizonyos ada lék-anyagokkal lebomlóvá tesszük.Cikkünkben elméleti áttekintést adunk a szintetikus polimerek környezetre
Péter SubaProduct and Application Development managerTVK Plc. Product and Application Development DepartmentE-mail: [email protected]
Kinga Lovas KissDevelopment engineerTVK Plc. Product and Application Development DepartmentE-mail: [email protected]
Dr. Gábor nagyTechnology Development managerTVK Plc. Technology Development DepartmentE-mail: [email protected]
Biodegradable polymers
Development of
115
MOL Scientific Magazine2009/2
MOL Scientific Magazine

116
SD & HSE special issueMOL Scientific Magazine
1MOL GROUP 1MOL GROUP
ve tített hatásairól, újrahasznosítási le-he tô ségeirôl. Bemutatjuk a biológiai deg radáció alapjait és a lebomló poli-merek fôbb típusait. Külön kitérünk az általunk is gyártott poliolefinek biológiai lebonthatóságára.A kísérleti részben egy kiválasztott po -li propilén típuson keresztül bemutat-juk azt a módszert, amivel elér he tô a poli o lefin hulladékok degradá ciós fo-lya ma tának inicializálása és azt a vizs-gálati módszert, amivel ezt nyo mon kö vethetjük. Vizsgálatainkat a Nor-X Industry AS norvég céggel kö zösen végeztük, akik termékeikkel és ké szü-lékeikkel hozzájárultak a kísérletek kivi-telezéséhez.
IntroductionMan has known and used various natural polymers (e.g. resins, caoutchouc) since ancient times. The modification of these natural polymers started up the mass production of the first plastics as early as in the 19th century (rubber, nitrocellulose); however it was not earlier than the beginning of the last century when the nature of macromolecules became known. This triggered a rapid development in the world’s plastic industries where new plastic types are invented and put into mass production every day, beginning with the production of phenol resins and synthetic caouchouc through today’s commodity plastics (low and high density polyethylene, polypropylene, PVC, etc.). Plastics production has reached huge quantities in recent decades worldwide. Between 2002 and 2006, plastics production increased by 45 million tons (to 245 million tons from 200 million tons). This quantity includes the yearly consumption of thermoplastics of which increased to 197 million tons in 2006 from 152 million tons consumed in 2000, and according to latest forecasts, this
consumption quantity will certainly reach 250 million tons by 2010 [1, 2].
It is more than obvious that neither the manu-facturing, nor processing or consumption of plastics can be addressed without their environ-mental implications. It is easy to under stand that the huge production and consumption capacities mentioned earlier cause an ever increasing environmental load when plastic products land in the environment as wastes at the end of their life cycles. This is especially true in the case of plastic packaging materials (for polyolefins in particular), since in Europe alone 35-40% of plastic products are used in this field of application [3].In recent years, more and more research focuses on biodegradable polymers or on the modification of traditional, normally not biodegradable plastics in order to make them biodegradable. This article briefly discusses this field of chemical research.
Theoretical overviewT H E I M P A C T S O F S Y N T H E T I C P O L Y M E R S O N T H E E N V I R O N M E N T
Relatively few polymers end their life paths as unrecoverable wastes. In most developed countries, household garbage including plastic wastes will be deposited in dumpsites or burned in incinerators. Burying the wastes in the soil is becoming a less accepted practice of waste treatment, because in anaerobic circumstances wastes tend to generate methane, a gas, which has a much higher greenhouse effect than carbon dioxide does. In some cases, methane released during the decomposition of plastic wastes has caused explosions. Figure 1 outlines some preferred ways of waste recovery [4].
Waste
Mechanical reclaim
Sorted plastic
Primaryproducts
Secondaryproducts
Heat recovery
Wate deposit(inorganic residues)
FuelsCO2
Biogas(CO4)
Biomass+CO2
Anaerobic Anaerobic
Mixed plastic Waste incineration
Pyrolysis Waste water Compost Soil
Energy recovery Biological recycling
Figure 1. Recycling options for polymer wastes [4]
117
MOL Scientific MagazineSD & HSE special issue
1MOL GROUP
At the first glance, the incineration of wastes looks a favourable option to recover the high heating value of carbon based polymers. However, there is a wide public distrust of incinerators primarily because of their possible toxic emissions. PVC is considered number one of the potential hazard sources, because it may release dioxin while burned. Notwithstanding these concerns, the recovery of the energy trapped in plastic wastes will be a more and more required option of waste treatment in the future. Generally speaking, by reclaiming plastic wastes mechanically we can produce simple products. This process is less feasible for the recycling of mixed plastic wastes, whose pyrolysation will still remain an option to produce fuels, petrochemical products, or monomers in some cases. We know that biodegradation channels natural wastes back to carbon circulation, a process, which produces biomass as a primary product, which allows the new generations of vegetation to germinate in. It is also known that the formation of biomass binds carbons contained in the waste for much longer than the burning of the same waste normally does, and therefore, biomass generation poses less burden to the atmosphere. There are two categories of biodegradable polymers. One is where biodegradability is an inherent property of the products. One example of inherently biodegradable plastics is medicine capsules where a precisely controlled degradation has a decisive role to release the effective component at a specific point of the alimentary canal. Other inherently biodegradable plastics are the polyethylene films used in horticulture, which allow earlier sowing and prevent fewer weeds from emerging. The second category comprises most environment-friendly packaging materials, primarily, including the convenient polyolefins, which can be turned into compost by aerobic oxidative biodegradation.
T H E B A S I C S O F B I O D E G R A D A T I O N A N D T H E M A I N T Y P E S O F B I O D E G R A D A B L E P L A S T I C S
Biodegradation is the capacity of micro organisms to influence abiotic degradation through a series of physical, chemical and enzyme effects. The interactions taking place between biological degradation and various environmental effects act as very important factors in this process. Heat, mechanical stresses, oxygen, contaminants and water are the most important players in the process. The presence of water is indispensable for the micro organisms to play their roles. Particle size and surface area, too, have to be
mentioned as further important ingredients, because biodegradation takes place on the surfaces of the polymers to the most part.In certain applications, including especially packaging and farming, the products have limited service lives, often not longer than only a few weeks or months. In these applications it would be most favourable if natural external effects could cause the products no longer needed to decompose either on the site of their use, or on waste deposits, or on other designated areas. Among the products with limited or controlled life cycles the soil cover films, garbage bags, certain bottles and drums, disposable fast food items (cups, trays and cutlery), and containers are the most important.
Looking at today’s research, we can identify two well differentiated areas. One focuses on specialty polyesters which are genuinely, or 100% degradable, and the second one addresses more traditional types of plastics which contain additives, including starch or organic metal compounds as modifiers intended to make these products degradable. The first path of research starts from the fact that the product is inherently degradable and studies the areas where these plastics can be reused. The other one goes in the opposite direction and seeks to find ways to modify the basic materials of plastic products used in specific applications in order to make them biodegradable.
P O L Y E S T E R T Y P E B I O P O L Y M E R S
The fully degradable polymers like these specialty polyesters have now been in the centre of research for about 15 years, however only a modest commercial success has been produced, so far. At present, the only high capacity commercial unit being in service in the world (Cargill and Dow) produces 140 Kt PLA in a year, and there are a number of lower capacity plants in various countries, e.g. in Belgium, too (Total Petrochemicals and Galactic Escanaffles) where the production goes up to 1.5 Kt per year [5].
This type obviously comprises a number of subtypes (depending upon the nature of the product: natural, partly synthetic, or fully synthetic), which are indicated in the following table, giving their acronyms, as well.
We can state that aliphatic polyesters, whose yearly production quantities remain below those of polyolefins, are expensive, sensitive to hydrolysis, their production is problematic, and
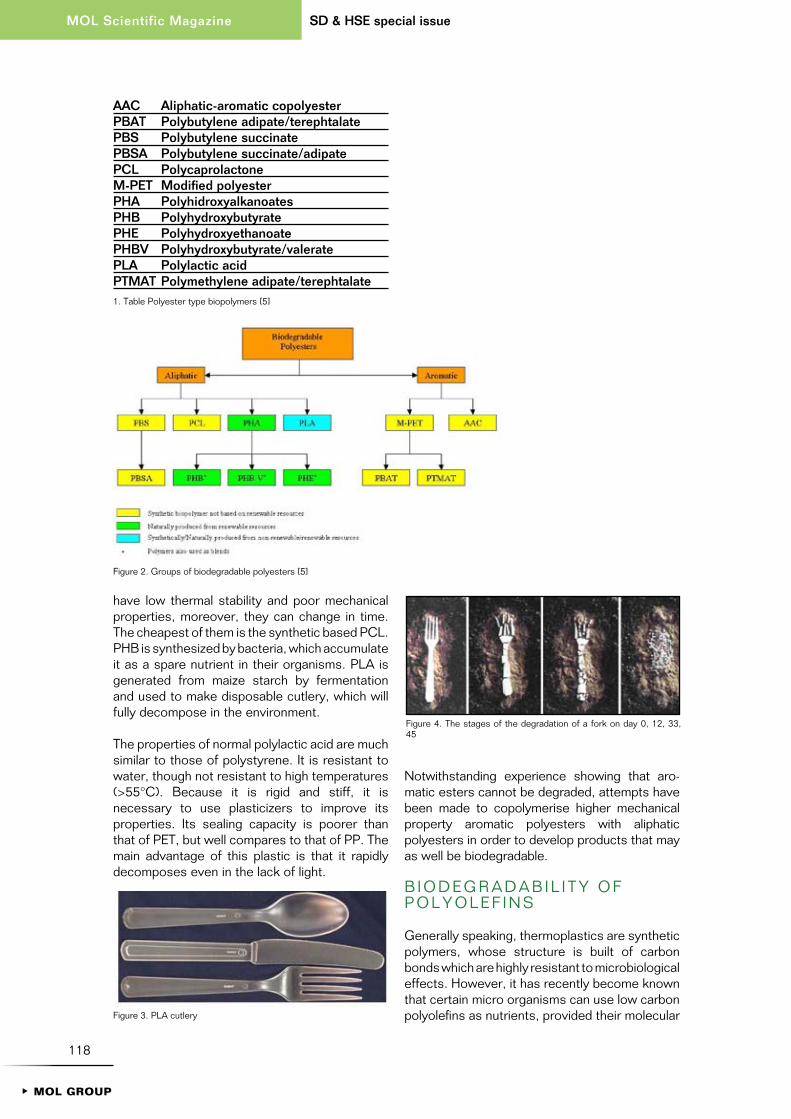
118
SD & HSE special issueMOL Scientific Magazine
1MOL GROUP
have low thermal stability and poor mechanical properties, moreover, they can change in time. The cheapest of them is the synthetic based PCL. PHB is synthesized by bacteria, which accumulate it as a spare nutrient in their organisms. PLA is generated from maize starch by fermentation and used to make disposable cutlery, which will fully decompose in the environment.
The properties of normal polylactic acid are much similar to those of polystyrene. It is resistant to water, though not resistant to high temperatures (>55°C). Because it is rigid and stiff, it is necessary to use plasticizers to improve its properties. Its sealing capacity is poorer than that of PET, but well compares to that of PP. The main advantage of this plastic is that it rapidly decomposes even in the lack of light.
Notwithstanding experience show ing that aro-matic esters can not be degraded, attempts have been made to copolymerise higher mechanical property aro matic polyesters with aliphatic polyesters in order to develop products that may as well be biodegradable.
B I O D E G R A D A B I L I T Y O F P O L Y O L E F I N S
Generally speaking, thermo plastics are synthetic polymers, whose structure is built of carbon bonds which are highly resistant to microbiological effects. However, it has recently become known that certain micro organisms can use low carbon polyolefins as nutrients, provided their molecular
aaC aliphatic-aromatic copolyester PBaT Polybutylene adipate/terephtalate PBS Polybutylene succinate PBSa Polybutylene succinate/adipate PCL Polycaprolactone M-PET Modified polyester PHa Polyhidroxyalkanoates PHB Polyhydroxybutyrate PHE Polyhydroxyethanoate PHBv Polyhydroxybutyrate/valerate PLa Polylactic acid PTMaT Polymethylene adipate/terephtalate1. Table Polyester type biopolymers [5]
Figure 2. Groups of biodegradable polyesters [5]
Figure 3. PLA cutlery
Figure 4. The stages of the degradation of a fork on day 0, 12, 33, 45

119
MOL Scientific MagazineSD & HSE special issue
1MOL GROUP
mass is not higher than 500 g/mol [6]. Even so, the biodegradation of polyethylene still remains a slow process. Corbin and Henman studied the degradation of 14C-marked polyethylene and found its yearly conversion rate not higher than 2% [7]. The reason for this may be that the terminal methyl groups in the polyethylene can oxidize to carboxylic acids primarily, while β-oxidation goes on by stages.
One precondition of biodegradation is photo degradation and/or chemical degradation. In general, polyolefins are known to be highly resistant to degradation, partly because of their hydrophobic nature, which prevents hydrolysis, and partly because of the commonly applied antioxidant additives in them, and also because of their very high molecular masses [8]. In order to make polyolefins degradable, additives are needed to allow photo degradation and chemical degradation to take place and produce segments in the plastic whose molecular masses are lower than 500g/mol, which can be then degraded by micro organisms. Of these additives (aro-matic ketons, aromatic amines, and organic compounds of transient metals) the metal salts or metal complexes where the metals can change their oxidation stages are found to give the best systems [9]. The most commonly used additives are cobalt, cerium and iron or their fat soluble compounds. Iron stearate is preferred to other members of this additive family, because plastics containing this additive are harmless to the environment and more compliant with food standards than plastics with other transient metal additives are. The main point of the process is that the iron ions contained in the additive make a catalytic effect on the oxidative degradation of polyolefins, a process, which is initiated by light and/or heat. The following most important reactions take place:
ROOH + Fe2+ → RO· + OH- + Fe3+
ROOH + Fe3+ → ROO· + H+ + Fe2+
The hydroperoxides in the above reactions are generated during the oxidative degradation of polyolefins, and by accelerating their de-composition we can speed up the rate of degradation, as well. The disadvantage is that in ambient conditions iron(II) and iron(III) ions are tend to be precipitated in the forms of insoluble iron-oxide or iron-sulphate, which slows down the process of degradation. A further disadvantage is that the rate of degradation may slow down also when these plastics get into the soil or compost.
Starch is commonly added to polyolefins to help their degradation. In natural conditions however
and when no prooxidants are present, starch will be used up and simply run out before the actual degradation of polyolefins commences. Blends containing starch have a continuous starch phase, which can be easily digested by the α and β amylase enzymes of micro organisms. After the continuous phase disappears a porous polyolefin and starch blend is left behind. In case also prooxidants are present, the degradation of the polyolefin matrix will take place at a faster pace [10-11].
It is a natural expectation that the macromolecules of biodegradable plastics should get fragmented quickly in order to cause a full biodegradation of these plastics when they get to the end of their life cycles [12]. Above to reach full degradation however, it is also important that the mechanical properties of these plastics do not change significantly during the application of the products, that is, they should have a controlled service life, so that these plastics can meet the requirements of both degradability and application.
Experimental partThe plants in Tiszaújváros and in Bratislava of the Petchem Division produced more than 1.2 million tons of polymer products in 2007, most part of which was used in the packaging industry according to world trends. A great many of these packaging materials (bags and packaging films) have short useful lives and turn into wastes as soon as the products (e.g. food) they wrap are used up. In order to reduce the environmental impacts of our products, we find that the second path of research, focusing on making traditional polyolefin products biodegradable by modifying them is the most feasible option for us.
TVK PLC first decided to study this field on the initiative of a Norwegian company, Nor-X Industry AS. This company prepares specialty masterbatches (pellets containing higher quantities of some additives for the purpose of making the processing simpler) intended to help the degradation of polyolefins. TVK and Nor-X Industry set up a joint objective in 2007 to develop a masterbatch with an optimal composition for the BOPP (biaxially oriented polypropylene) grade (H649FH) of TVK PLC. The main active component of this masterbatch (NOR-Xtm) was iron stearate, which was added to various polymer matrixes (e.g. polypropylene, (PP), or linear low density polyethylene (LLDPE)) to produce masterbatches. These additive masterbatches were then added to the BOPP grade in various

120
SD & HSE special issueMOL Scientific Magazine
1MOL GROUP
concentrations, and then the films manufactured from the feedstock containing the additives were tested for properties and weather resistance.
Nor-X Industry AS recommended two different masterbatches with PP and LLDPE matrixes for the purposes of the experiments to be performed in 2007. The masterbatches or their 50% mixes were added to the BOPP grade in 1% and 2% concentrations. Then, we checked the colours and qualities primarily of the films extruded from these samples (the error spots (or gels) of cast films are counted by a camera attached to a computer). These two film characteristics are the most critical indicators to decide if the product can meet the property requirements of both processing and application. The following photo shows the films products containing the specific masterbatches. It is conspicuous in the photo that the colour of the masterbatch greatly influences the colour of the finished product. Besides, the number of error spots in each case was higher than specified (Table 2), the elimination of which is a primary objective in our future cooperation.
Samples of cast films were shipped to Nor-X Industry AS where accelerated weather resis-tance tests were performed on them according to ISO 4892-3. The samples were tested for 1, 3 and 5 days, and others were also aged in a drying oven for 12, 24 and 36 days when their degradation was checked by mechanical tests (the elongation at break and tensile strength of the samples were measured). Figure 6-9. show the results of these measurements. On the one hand, the samples with 2% masterbatch content
were found to give the best results (containing 2% of either masterbatch, or 2% of the masterbatch mixes). On the other hand, the samples containing the masterbatch had good thermal stability and would not degrade in the oven at a higher rate than the samples containing no masterbatch did. The elongation at break measured in the sample containing 2% of LLDPE base masterbatch would go below 1% in one day, though the same process in the feedstock with PP base masterbatch would not take longer than 3 days, either. Considering these results, we can assume that the samples containing 2% degradation facilitating additive would decompose in 2 or 3 months in the environment.
We can state that UV radiation initiated an ex pec-ted rate of the degradation process in the samples, which contained the studied ad ditives. However, in the lack of UV radiation (when samples were aged in the oven) the rate of degradation was not found higher than in the reference samples. This means that the degradation process is expected to commence only when the product (packaging material) has been deposited in the environment as a waste and when it is exposed to sunshine. This time, we did not study the cases when the waste is no longer exposed to sunshine after its degradation begins (to see whether the degradation continues or stops).
We are planning to perform a series of tests in the near future where the composition of the masterbatches are further optimised, and intend to involve a wider range of masterbatch concentrations (shifting towards lower con-centrations). We believe that these tests can help to prevent the important quality parameters from impairing.
In order to get a more accurate picture of the functions and compositions of these additives, our Company will commence a development project in 2008 with the involvement of the Faculty Figure 5. LLDPE based film rolls: 1% and 2%; PP based film rolls:
1 and 2%; mixed based film rolls: 1 and 2%
Base nor-X nor-X average average average average YI polymer type content (%) number number number number (Yellow- of gels of gels of gels of gels ness index) (<200μ) (200-500μ) (500-700μ) (700-1500μ)
H649FH - - 82 0 0 0 -4,08H649FH LLDPE base 1 190 3 0 0 0,36H649FH LLDPE base 2 211 4 0 0 6,49H649FH PP base 1 111 5 0 0 0,15H649FH PP base 2 154 3 0 0 3,24H649FH mix 1 121 4 0 0 -1,48H649FH mix 2 124 5 0 0 0,85Limit - - 100 5 0 0 Table 2. The results of film qualification (number of error spots of various sizes)
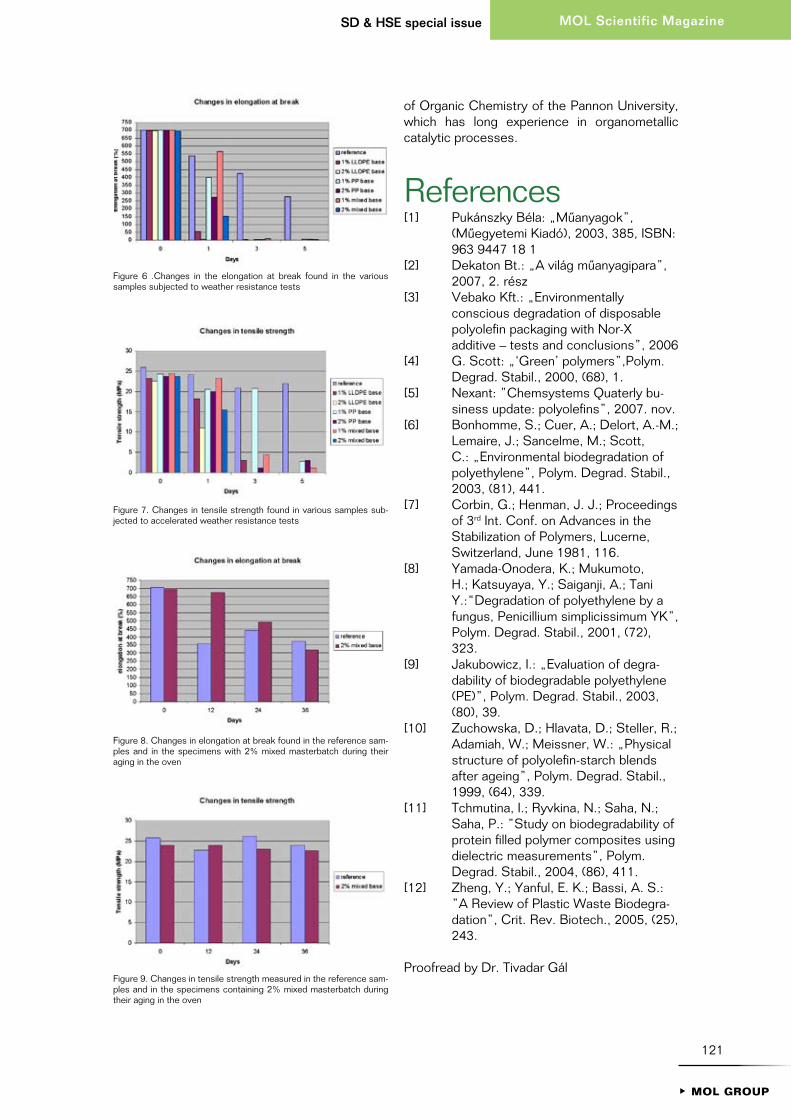
121
MOL Scientific MagazineSD & HSE special issue
1MOL GROUP
of Organic Chemistry of the Pannon University, which has long experience in organometallic catalytic processes.
References[1] Pukánszky Béla: „Mûanyagok”,
(Mûegyetemi Kiadó), 2003, 385, ISBN: 963 9447 18 1
[2] Dekaton Bt.: „A világ mûanyagipara”, 2007, 2. rész
[3] Vebako Kft.: „Environmentally conscious degradation of disposable polyolefin packaging with Nor-X additive – tests and conclusions”, 2006
[4] G. Scott: „‘Green’ polymers”,Polym. Degrad. Stabil., 2000, (68), 1.
[5] Nexant: ”Chemsystems quaterly bu-siness update: polyolefins”, 2007. nov.
[6] Bonhomme, S.; Cuer, A.; Delort, A.-M.; Lemaire, J.; Sancelme, M.; Scott, C.: „Environmental biodegradation of polyethylene”, Polym. Degrad. Stabil., 2003, (81), 441.
[7] Corbin, G.; Henman, J. J.; Proceedings of 3rd Int. Conf. on Advances in the Stabilization of Polymers, Lucerne, Switzerland, June 1981, 116.
[8] Yamada-Onodera, K.; Mukumoto, H.; Katsuyaya, Y.; Saiganji, A.; Tani Y.:“Degradation of polyethylene by a fungus, Penicillium simplicissimum YK”, Polym. Degrad. Stabil., 2001, (72), 323.
[9] Jakubowicz, I.: „Evaluation of degra-dability of biodegradable poly ethylene (PE)”, Polym. Degrad. Stabil., 2003, (80), 39.
[10] Zuchowska, D.; Hlavata, D.; Steller, R.; Adamiah, W.; Meissner, W.: „Physical structure of polyolefin-starch blends after ageing”, Polym. Degrad. Stabil., 1999, (64), 339.
[11] Tchmutina, I.; Ryvkina, N.; Saha, N.; Saha, P.: ”Study on biodegradability of protein filled polymer composites using dielectric measurements”, Polym. Degrad. Stabil., 2004, (86), 411.
[12] Zheng, Y.; Yanful, E. K.; Bassi, A. S.: ”A Review of Plastic Waste Bio deg ra-dation”, Crit. Rev. Biotech., 2005, (25), 243.
Proofread by Dr. Tivadar Gál
Figure 6 .Changes in the elongation at break found in the various samples subjected to weather resistance tests
Figure 7. Changes in tensile strength found in various samples sub-jected to accelerated weather resistance tests
Figure 8. Changes in elongation at break found in the reference sam-ples and in the specimens with 2% mixed masterbatch during their aging in the oven
Figure 9. Changes in tensile strength measured in the reference sam-ples and in the specimens containing 2% mixed masterbatch during their aging in the oven

1MOL GROUP

123
MOL Scientific MagazineSD & HSE special issue
1MOL GROUP
Abstract Due to the CO2 emissions that have been released into the atmosphere over the last 100 years, the concentration of one of the greenhouse gases – CO2 – has significantly increased. In 1960 the CO2 content in the atmosphere was 315 ppm; nowadays it is more than 375 ppm, and it is constantly increasing. This article tries to present one of the possible ways of how we can cut down the CO2 emission by implementing a new technology: Carbon Capture and Storage.Suitable aquifers for storage are typically located at least 800 meters underground and contain non potable water. The carbon dioxide partially dissolves in the formation water, gets permanently trapped in micro pores.Existing and depleted oil and gas fields have proven their capability to hold oil and gas over millions of years and therefore have great potential to serve as long-term storage sites for carbon dioxide. Leakage is the most significant risk of CO2 storage, while CO2 gas can accumulate on the surface in deep isolated areas such as walleys. Good reservoir parameters go half the way towards mitigating risks. The most important thing is that the reservoir has appropriate cap rock with very good sealing conditions and geologic and hydrodynamic stability.
CO2 tárolási lehetôségek MagyarországonA Földön – az elmúlt 100 évében történt CO2 kibocsátás hatására – jelentôsen nôtt az atmoszférában az üvegházhatást kiváltó CO2 gáz koncentrációja, 1960-ban 315 ppm volt, s ez manapság több mint 375 ppm, és folyamatosan növekszik. Ez a cikk megpróbálja bemutatni egy lehetséges módját annak, hogy miképp lehet a széndioxid kibocsátást csökkenteni egy forradalmian új technológia be vezetésével: a CCS-el azaz a CO2 leválasztás és tárolás alkalmazásával.A fogyasztásra alkalmatlan sós vizek, aquiferek melyek tárolásra alkalmasak lehetnek tipikusan 800 m-nél mélyebben helyezkednek el. A besajtolt CO2 rész-ben beoldódik a formáció vizébe, és a mikro pórusokban csapdázódik. Meg-lévô és lemûvelt olaj és gázmezôk már bizonyították, hogy képesek évmil li-ókon keresztül tárolni az ott csap dá-zó dott földgázt, vagy kôolajat, ami jó lehetôséget jelenthet a széndioxid tárolás szempontjából is. A CO2 felszínre jutása a legkomolyabb kockázati tényezô, mely következtében a felszíni mélyedésekben, pl. völgyekben megülhet a kiszivárgó széndioxid. Jó re-zervoár paraméterek önmagukban már fél sikert jelentenek ezen kockázat eny-hítésében. A legfontosabb az, hogy a tároló megfelelô fedôkôzettel ren del kezzen, melynek nagyon jó záró tu lajdonságai vannak és geológiai és hidrodinamikai szempontból stabil.
Péter KubusAdvisorMOL KTD, IFAE-mail: [email protected]
CO2storage
possibilities in Hungary

124
SD & HSE special issueMOL Scientific Magazine
1MOL GROUP
Carbon Capture and Storage (CCS)Long term forecasts clearly indicate that it is crucial to decrease our CO2 output or at least stop the growing tendency of it if we want to mitigate the effect of climate change.
There are six different methods which only together are able to create sufficient solution:
• Natural sinks• CCS• Fuel switch• Solar, wind and nuclear power• Biofuel• Energy efficiency
These methods are not competitors but supplements of each other, as it can be seen at the following diagram.
CCS technology brieflyThree different projects connected to each other create the CCS technology:
• Carbon Capture: In a chemical process the CO2 content is captured, separated from the flue gas as a byproduct of a power plant. The captured CO2 is dehydrated and compressed according to the needs of transport. Depending on whether CO2 capturing is before or after the combustion of the fuel we can determine pre-combustion and post-
combustion methods, and there is an interesting an novel technology, oxy-fuel, where combustion takes place in pure oxygen in the power plant
• Transportation: The compressed CO2 is transferred to the storage point. It can be carried out either by truck, by ship and via pipeline, or with the combination of these. For the transportation the CO2 should be dry (dehydrated) avoiding the corrosion. For that reason in the capture technology the CO2 flow should be treated in a glycol dehydration unit. The transportation via pipeline requires the lowest specific volume of the CO2 stream, that can take place if it is liquefied, this condition is valid if the pressure higher then 80 bar, and for arriving at the storage site, the starting pressure at the compression technology should be around 100 bar.
• CO2 Storage: In a similar way to the Underground (Natural) Gas Storage, the CO2 is injected into a proper underground geological reservoir and stored for a long time safely.
Geological storage of CO2In many parts of the world carbon dioxide can be found in geological formations in natural reserves, where it is often trapped between the pore spaces of sedimentary rock mostly in the same way as oil and natural gas. The available alternatives for storing carbon dioxide in geological formations are:
• deep saline aquifers, • unmineable coal beds• depleted oil and gas fields
MOL launched an R&D project with involvement of ELGI (Magyar Állami Eötvös Loránd Geofizikai Intézet) and University of Miskolc (Miskolci Egyetem Alkalmazott Földtudományi Kutatóintézetnek (ME AFKI)), which has been running for three years now where the target was to review all feasible CO2 storage opportunities in Hungary
In 2009 our R&D study presented answers in the following issues:
• Adaptability of research techniques to the Pannonian Basin based on practices abroad.
• Geological and technical risks and risk assessment
• Determining the suitable geological for-mations and storage capacities of them

125
MOL Scientific MagazineSD & HSE special issue
1MOL GROUP
• Availability of enhanced oil and gas recovery techniques (EOR, EGR)
• CO2 storage potential of the depleted hydrocarbon reservoirs of MOL
• CO2 storage possibilities and potential in deep saline aquifers in Hungary
Storing in deep saline aquifersSuitable aquifers for storage are typically located at least 800 meters depth and contain non potable water. The carbon dioxide partially dissolves in the formation water, gets permanently trapped in micro pores.
Deep saline aquifers, potential storage formations are much more widespread than depleted hydrocarbon reservoirs. These objects can be defined as porous and permeable reservoir rocks that contain saline water. The exact situation and the real volume of the saline reservoirs are partly known and therefore only rough estimation can be made for determining the storing capacity of Hungary.
Regarding to the total storage capacity in Hungary the saline aquifers could be bigger with an order of magnitude than the oil and gas reservoirs.
Deep saline aquifers in HungaryTo estimate the storage potential according to the ELGI-MOL R&D study we have used the method developed from the experience of underground natural gas storage based on the theory of equations worked out by professor dr. József Pápay, and is based on the compressibility of the formation and the highest applicable overpressure. This approach is the most conservative among the available estimation methods.
In this study the Pannonian and Middle Miocene formations as potential storage objects have been carefully studied. Among the thick Pannonian facies units Szolnoki Formation and Újfalu Formation, dominantly built up by sandstone, are found to be highly potential for CO2 storage, whereas Békés Formation, representing far lower rock volume is also believed to have considerable storage potential. Among the Middle Miocene formations the base conglomerates and breccias as well as the biogene and bioclastic limestones may form adequate storage levels. The main storage units are generally covered by sealing formations that could give appropriate hydrodynamic closure for the system even regionally.
The values show a theoretical maximum amount of 2510 Million t CO2 that could be stored in the following formations.
The real storable value depends on the volume of closed structures and the size of the related hydrodynamic units. We recommend the detailed mapping of closed structures and related hydrodynamic units in the Pannonian siliciclastic formations (primarily the Szolnok and Újfalu Formations).
area Storage capacity (Million t) (compressibility &overpressure)Újfalu Formation 424Szolnok Formation:Jászság Basin 183Makó Trough 197Pusztaföldvár Horst 120Békés Basin 204Transdanubian part 1380 of Szolnok Form. (thickness 500m)Cumulative Szolnok Formation 2090Cumulative 2510
Picture: Thickness map of the Szolnok Formation. in Eastern Hungary. Only areas with proven regional seal and > 800 m depth are considered. Potential source (Mátra pp. - green concentric circles) is also shown.

126
SD & HSE special issueMOL Scientific Magazine
1MOL GROUP
For exact evaluation of the storage potential in an aquifer reservoir, a huge exploration cost would be needed for creating reservoir engineering study by carrying out seismic surveys and 3D modelling. The cost and the methodology is similar to that which is used in Hydrocarbon exploration.
Storing CO2 in aquifers can be a good opportunity for MOL in Hungary in the future if the market creates needs for storing CO2 with suitable economic and political background. Nowadays less risk can be found in storing CO2 in depleted HC fields as these fields have already proved their capability to store oil and gas over millions of years.
Storing in unmineable coal seamsIn nature, coal seams also contain gases such as methane. The gas is held in pores adsorbed on the surface of the coal and in fractures in the seams. If CO2 is injected into a coal seam it displaces the methane, which can then be recovered. The injected CO2 will remain stored within the coal seam, providing the coal is never disturbed. In addition, the sale of the methane produced from the coal seam could help to offset the costs of the CO2 injection.
In Hungary there are significant unmineable coal seams. The upper-miocene lignite formations in Hungary can be seen as potential CO2 storage spots because these have large size area and are tectonically calm, but the absorption quality is not very good, because the active storage-absorption can take place only in mezzo- and macro pores.
Estimation of the storage capacity of unmineable coal seams: 300 Million t CO2.We found coals seams not very realistic storage sites because these are not well studied and uncertain area for MOL having high risk elements.
Storing in depleted oil and gas fieldsExisting and depleted oil and gas fields have already proven their capability to hold oil and gas over millions of years and therefore have great potential to serve as long-term storage sites for carbon dioxide.
MOL-ELGI R&D study determined the domestic CO2 storing potential of MOL HC fields where180 oil or gas reservoirs were investigated for volumetric calculation.
Several fields had to be excluded from the potential storage sites due to geological, financial, safety, and technological reasons.
Reservoirs were excluded if the volumetric CO2 storing capacity of a reservoir was less than 1 million tonnes CO2.
Excluding these fields the maximum theoretical storage capacity of the Hungarian depleted hydrocarbon occurrences is 430 Mt of which 155 Mt storage capacity is available within the next 10 years and further 16 Mt in the next 25 years.
The estimated storage capacity is based on volumetric calculation. For exact storing ca-pacities every field should be investigated individually making adequate reservoir en-gineering simulation based on 3D surveys.
Possible Underground Gas StoragesThe planned and the existing underground gas storage sites can also be used for storing CO2, of course in the very far future.
Two gas reservoirs Pusztaföldvár and Üllés are under investigation for gas storage purpose. In the case of these gas fields being employed

127
MOL Scientific MagazineSD & HSE special issue
1MOL GROUP
for CO2 storage instead of utilizing them as Underground Gas Storages the estimated CO2 storage capacity is 47 million tones.
Pusztaföldvár field is a very good candidate for UGS implemented by an international cooperation.
Üllés has the biggest reservoir capacity with 25 Mt CO2 storage volume, but this reservoir is the best in Hungary from Underground Gas Storage point of view.
CO2 injection can cause an irreversible impurity in the reservoir forfeiting the ability of carrying out UGS in the future. Because of this these fields are not suggested for CCS projects in the near future.
Most prosperous reservoirs for CO2 storageAccording to the MOL-ELGI study only 23-26 reservoirs are technically and economically viable for storing CO2 in the next 10 years:
The evaluated storage sites were grouped into 3 blocks from the point of view of their position. Trans-Danubian area is excluded due to transmission difficulties.
Using a stricter screening the study determined 3 fields having good reservoir conditions and a suitable geopolitical position located in Block I.
These are: Kisújszállás ny Tatárülés-Kunmadaras Endrôd III
These fields are close enough to the biggest Hungarian CO2 emitters (power plants) having suitable transport opportunities for future pipeline connections. For better evaluation MOL KTD experts have nowadays been carrying out technical feasibility studies regarding to these CO2 storage candidates aiming a deadline by the end of 2009.
Technical feasibility of storing CO2 in depleted HC fieldsThe technical solution of CO2 storage is very similar to the method used in Underground Gas Storage. Partly it is simpler, because it does not need withdrawal-production technology on the surface, but it is riskier and needs a very long operated monitoring system.
The storage will have to be implemented in perfect technical conditions since it will have to exist for thousands of years.
R I S K S O F S T O R I N G C O 2
Risks associated with CO2 storage in geological reservoirs:
rendelkezésre tároló- állás kapacitás (Mt)Pusztaföldvár 2013 21,98Battonya 2017 7,63Battonya Kelet 2017 2,84Tôtkolós 2015 1,48Sarkadkeresztúr 2012 9,55Szeghalom 2012 20,65Biharkeresztes 2008 1,20Endrôd Észak 2012 2,50Endrôd III. 2009 9,38Szarvas 2010 3,90Tatárülés Kunmadaras 2008 8,70Kisújszállás Nyugat 2009 13,75Fegyvernek 2008 3,22Nagykörû 2018 5,29Tázlár 2013 5,86Kiskunhalas ÉK mezózóos
2014 2,08
Kiskunhalas ÉK metamorf
2014 1,66
Hosszúpályi Dél 2027 6,70Ortaháza 2016 2,10Mezôcsokonya 2015 1,60Görgeteg Babócsa 2018 3,39Budafamélyszint, Co2 telep- 7,3
összesen 151
Tíz
éven
bel
üli r
ende
lkez
ésre
álló
táro
lóka
paci
tás

128
SD & HSE special issueMOL Scientific Magazine
1MOL GROUP
• CO2 leakage from the reservoir to the upper layers and to atmosphere
• Micro-seismicity due to pressure and stress changes in the reservoir, causing small earth quakes and faults, reactivation of fractures
• Ground movement, subsidence or uplift due to pressure changes in the reservoir
• Displacement of brine from an open reservoir to other formations, possibly containing fresh water (contamination)
Leakage is the most significant risk of CO2 storage, while CO2 gas, leaking to the surface can accumulate in deep isolated areas such as walleyes causing death by lack of oxygen. In the reservoir CO2 together with the formation water causes pH decreasing and by this calcium dissolution, water hardness increase and release of trace metals.
Avoiding the leakage problems we have to abandon most of the existing wells, and new wells have to be drilled for injection and observation purpose. Furthermore a monitoring system has to be implemented and operated for the whole life of the storage.
A good trapping reservoir mechanism and thick overlying cap formation can ensure higher safety for CO2 storage. CO2 leakage can occur in case of the inability of the cap rock to prevent upward migration, additionally CO2 can escape through the old wells if they are not plugged in the proper way.
Risk management of CO2 storageS I T E S E L E C T I O N
Good reservoir parameters go half the way towards mitigating risks. The most important thing is that the reservoir has appropriate cap rock with very good sealing conditions and geologic and hydrodynamic stability. Of course for storing large volume CO2 in a reservoir it is important that it shows high porosity, big reservoir volume, high permeability, relatively low temperature and high pressure.
CO2 is cost-effectively stored if it fills the lowest specific volume. For that reason the pressure must be higher then 80 bar, and the temperature should be relatively low, because the fluid state can be kept only under 36 oC. Of course if the temperature is higher, in case of supercritical or dense gas condition the CO2 can be stored properly, it needs higher pressure, and the density of the supercritical CO2 fluid is decreased by cc. 30% with respect to liquid conditions, depending on the real in situ conditions, cc 500 kg/m3 in an average Hungarian field.
W E L L C O N D I T I O N S
We can mitigate the risks of the storage if we use perfect well applications. For injection of CO2 new wells have to be drilled with using of CO2 resistant cement, additionally the old wells must be abandoned at the beginning of the storage implementation.
As the part of the monitoring system we have to develope some observer wells, these wells might be existing wells drilled in the past but the well conditions have to be perfect. Due to the fact that most of the wells in the Hungarian existing reservoirs are old and only a very small part of them have CO2 resistant cement and none of the wells have CO2 resistant casing, it is a must to drill new wells for the purpose of injection and monitoring as well.
At the end of the operation phase when the storage is full, it is suggested that all the injection wells be abandoned also.

129
MOL Scientific MagazineSD & HSE special issue
1MOL GROUP
M O N I T O R I N G S Y S T E M O F T H E C O 2 S T O R I N G R E S E R V O I R
The operation of a monitoring system at the storage site is very important method of risk mitigation. The purpose of the monitoring is first of all to ensure public health. By operation of the monitoring system the stored CO2 quantity and the trapping mechanism can be verified, and this system can provide early warning of storage failure.
Theoretical case study of Üllés Enhanced Gas Recovery (EGR) – and CO2 StorageB A C K G R O U N D
CCS Task Force formed with experts from different organizations, divisions of MOL aiming to:
• assess mid and long term CCS business potential,
• develop business case for most attractive opportunities
• propose implementation plan and organizational fit
In order to get known the business potential this Task Force tried to create a case study of a theoretical CCS project.
For investigation of CCS feasibility and its rough costs MOL team made a desktop survey for a theoretical CCS value chain selecting optimal plants for both capturing and storage – also keeping an eye also on transport opportunities.
In this case study the Danube refinery was se-lec ted as capture site, where roughly 350 000 t/y could be captured from the 3 (2 existing, 1 under construction) Hydrogen plants, and 2 million tonnes from the planned MOL-CEZ CCGT power plant as an upside potential.
Üllés gas field seemed to be feasible for as a first step utilizing CO2 for EGR purposes and after reaching a “not economical” percentage
of CO2 in produced gas, carry on with CO2 storage in the same reservoir.
Capture
In the Danube Refinery there will be 350 000 t CO2 produced as a byproduct in the existing two and the one future Hydrogen Plants. In all the three technologies there will be possible way of capturing clear CO2 by using amine base absorption technology.
The gained CO2 will be in low pressure conditions at the end of the capturing process, so for transporting it via pipeline a green-field compression technology is needed.
Storage
In the EGR (Enhanced Gas Recovery) process gas replacement will take place by the injection of CO2 into the Üllés gas reservoir, and by this method extra gas production will be gained. The produced gas will be mixed with CO2 gas in the reservoir so that it will be transferred to Szank in order that the mixed gas can be separated from the CO2 content in Szank Sweetening Unit.
CO2 storage regarding to the CCS process can be started when the EGR is finished, from that time there will not be any gas production from Üllés, but it will be used only for storage.
For gaining CO2 quota by utilizing CCS and for ensuring the safety of the long term CO2 storage it is important to make high quality technology according to the CCS regulation, recently issued by EU. That’s why for sequestration of 350 th t CO2 yearly in Üllés it will be necessary to drill 3 new injection wells and another 4 existing wells are needed to be converted to observer wells. Because of the long injection period and the safe environment all the other existing unused 49 wells will have to be abandoned.
Capture technology, and additional capturing possibility In the upside alternative we think about capturing of CO2 from the Hydrogen Plants and the future CEZ Power-generation Plant as well.

130
SD & HSE special issueMOL Scientific Magazine
1MOL GROUP
In this option there will be 2 million tones of CO2 captured yearly and transported to Üllés and stored it in the underground gas reservoir.
This will result in a relatively fast reservoir fill up. After finishing EGR the reservoir will be filled up with its maximum storing capacity in another 10-12 years.
Separation of CO2 from flue gas of the power plant means a very challenging problem, because the CO2 content in the flue gas is only 8% and the flue gas has high temperature even if we reckon with a heat-utilizing unit.
We do not have any sophisticated knowledge in this capture topic, therefore we assumed that only 40 % of the total flue gas will be sucked, then it will be cooled in an air-cooler unit, then the atmospheric pressured flue gas will be pressurized by a blower upto the sucker pressure level of the compressors.
The output pressure level of the compressors is critical for the high energy demand of the total gas quantity with the ballast content of it as well and the quality of the CO2 separation in the amine based capture technology.
We have chosen amine based CO2 separation for the capture technology. This system can be operated in 10 bar pressure, reference technology is known at similar pressure level. We took the pressure level to 12 bar, and the pressure energy of the ballast phase (not CO2) will be utilized by turbo-expander. The energy content which can be gained (50 MW) influences the OPEX cost significantly in this alternative.
At the end of the amine based CO2 separation process there the CO2 gas occurs in almost atmospheric pressure condition, therefore the transportation needs a new pressurization.
In the compression process the dehydration is operated at 50 bar pressure level.
For the intensive CO2 injection in Üllés, 5 wells will be needed to be drilled. Of course the remained 49 unused wells have to be aban-doned.
T R A N S P O R T A T I O N
For transporting CO2 it should be changed into liquid phase, for that it must be compressed to 100 bar pressure. In the compression technology between the stages around 50 bar pressure level a dehydration needs to be implemented in order to make the CO2 gas absolutely waterless dry, to avoid corrosion problems through pipeline transportation. The drying unit will use TEG absorption.
Between the Refinery and Üllés for transportation of CO2 a 160 km long DN 400 PN100 size pipeline will be implemented. Sectionalizing stations will have to be built according to the regulations, a bigger one is needed at the Danube crossing.
The gas produced by the Üllés gas wells will be transported via pipeline to Szank Sweetening Unit, for that reason a new compressor plant needs to be implemented in Üllés. In Szank the expansion of the sweetening unit and the CO2 compressor plant is needed.
For transportation of the produced gas from Üllés and for output the sale gas and the separated CO2 gas in Szank the building of some new in-field pipelines and new trunk-lines will be necessary.
R E S U L T S O F O U R C A L C U L A T I O N S
versionsI. Capture CO2 in DUFI Hydrogen plant, trans-
port to Üllés, and use for EGR until economic
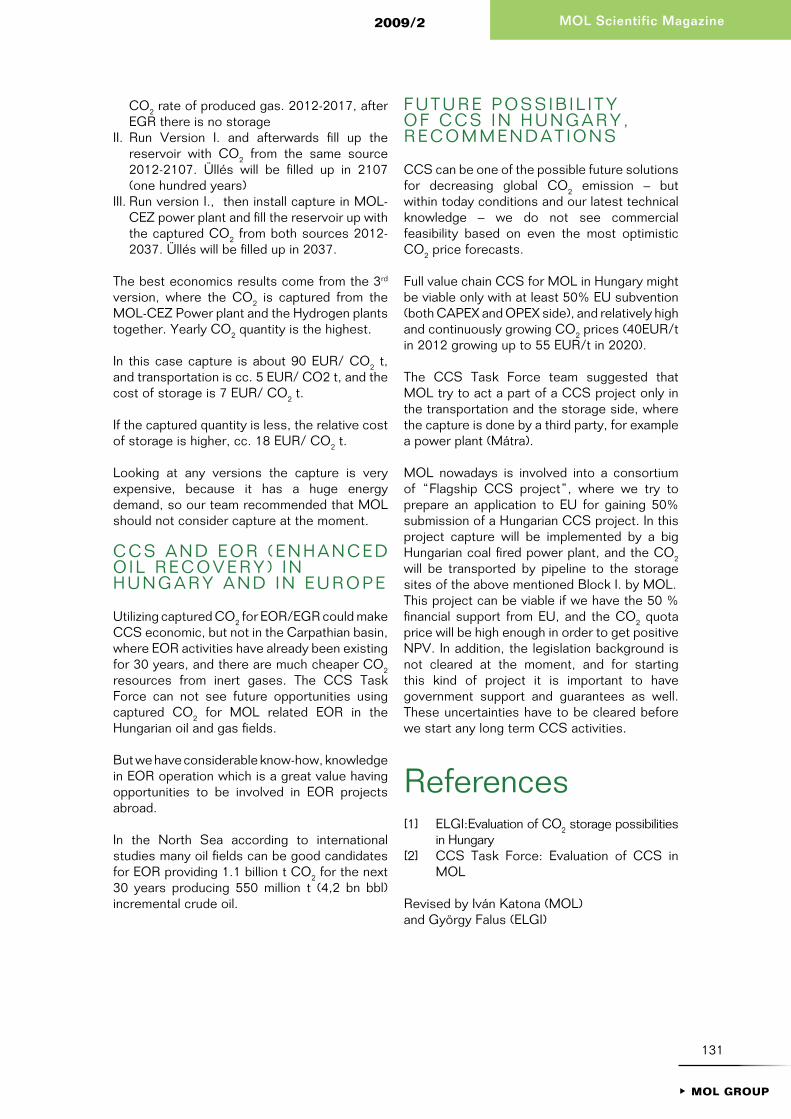
131
1MOL GROUP
MOL Scientific Magazine2009/2
CO2 rate of produced gas. 2012-2017, after EGR there is no storage
II. Run Version I. and afterwards fill up the reservoir with CO2 from the same source 2012-2107. Üllés will be filled up in 2107 (one hundred years)
III. Run version I., then install capture in MOL-CEZ power plant and fill the reservoir up with the captured CO2 from both sources 2012-2037. Üllés will be filled up in 2037.
The best economics results come from the 3rd version, where the CO2 is captured from the MOL-CEZ Power plant and the Hydrogen plants together. Yearly CO2 quantity is the highest.
In this case capture is about 90 EUR/ CO2 t, and transportation is cc. 5 EUR/ CO2 t, and the cost of storage is 7 EUR/ CO2 t.
If the captured quantity is less, the relative cost of storage is higher, cc. 18 EUR/ CO2 t.
Looking at any versions the capture is very expensive, because it has a huge energy demand, so our team recommended that MOL should not consider capture at the moment.
C C S A N D E O R ( E N H A N C E D O I L R E C O V E R Y ) I N H U N G A R Y A N D I N E U R O P E
Utilizing captured CO2 for EOR/EGR could make CCS economic, but not in the Carpathian basin, where EOR activities have already been existing for 30 years, and there are much cheaper CO2 resources from inert gases. The CCS Task Force can not see future opportunities using captured CO2 for MOL related EOR in the Hungarian oil and gas fields.
But we have considerable know-how, knowledge in EOR operation which is a great value having opportunities to be involved in EOR projects abroad.
In the North Sea according to international studies many oil fields can be good candidates for EOR providing 1.1 billion t CO2 for the next 30 years producing 550 million t (4,2 bn bbl) incremental crude oil.
F U T U R E P O S S I B I L I T Y O F C C S I N H U N G A R Y , R E C O M M E N D A T I O N S
CCS can be one of the possible future solutions for decreasing global CO2 emission – but within today conditions and our latest technical knowledge – we do not see commercial feasibility based on even the most optimistic CO2 price forecasts.
Full value chain CCS for MOL in Hungary might be viable only with at least 50% EU subvention (both CAPEX and OPEX side), and relatively high and continuously growing CO2 prices (40EUR/t in 2012 growing up to 55 EUR/t in 2020).
The CCS Task Force team suggested that MOL try to act a part of a CCS project only in the transportation and the storage side, where the capture is done by a third party, for example a power plant (Mátra).
MOL nowadays is involved into a consortium of “Flagship CCS project”, where we try to prepare an application to EU for gaining 50% submission of a Hungarian CCS project. In this project capture will be implemented by a big Hungarian coal fired power plant, and the CO2 will be transported by pipeline to the storage sites of the above mentioned Block I. by MOL.This project can be viable if we have the 50 % financial support from EU, and the CO2 quota price will be high enough in order to get positive NPV. In addition, the legislation background is not cleared at the moment, and for starting this kind of project it is important to have government support and guarantees as well. These uncertainties have to be cleared before we start any long term CCS activities.
References[1] ELGI:Evaluation of CO2 storage possibilities
in Hungary[2] CCS Task Force: Evaluation of CCS in
MOL
Revised by Iván Katona (MOL) and György Falus (ELGI)

132
1MOL GROUP
Mészöly Csaba (44)Long Term Planning SCM DSokl. szervezô vegyészmérnök, mérnök-közgazdászMOL Csop./Termékelôállítás és Kereskedelem Divízió/SCM/Hosszú távú Tervezés
SD & HSE special issueSzakmai Tudományos Közlemények
Beyond what is
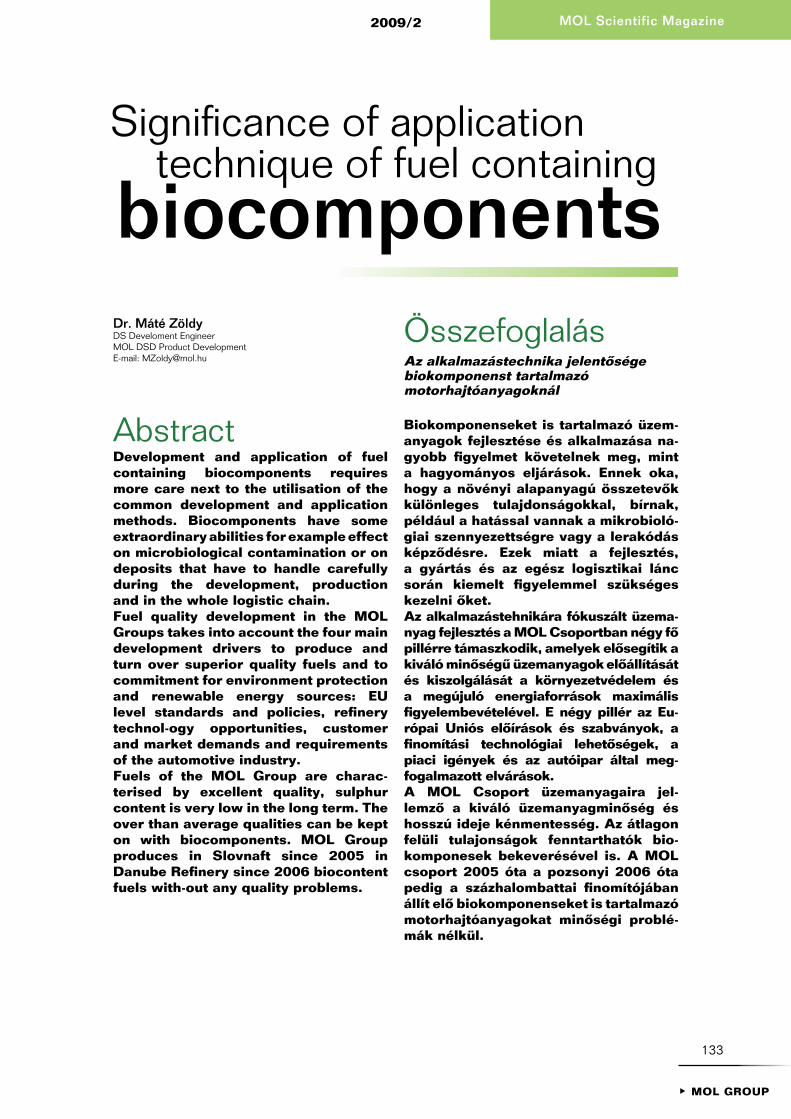
1MOL GROUP
2009/2 MOL Scientific Magazine
133
AbstractDevelopment and application of fuel containing biocomponents requires more care next to the utilisation of the common development and application methods. Biocomponents have some extraordinary abilities for example effect on microbiological contamination or on deposits that have to handle carefully during the development, production and in the whole logistic chain. Fuel quality development in the MOL Groups takes into account the four main development drivers to produce and turn over superior quality fuels and to commitment for environment protection and renewable energy sources: EU level standards and policies, refinery technol-ogy opportunities, customer and market demands and requirements of the automotive industry. Fuels of the MOL Group are charac-terised by excellent quality, sulphur content is very low in the long term. The over than average qualities can be kept on with biocomponents. MOL Group produces in Slovnaft since 2005 in Danube Refinery since 2006 biocontent fuels with-out any quality problems.
ÖsszefoglalásAz alkalmazástechnika jelentôsége biokomponenst tartalmazó motorhajtóanyagoknál
Biokomponenseket is tartalmazó üzem-a nyagok fejlesztése és alkalma zása na-gyobb figyelmet követelnek meg, mint a hagyományos eljárások. Ennek oka, hogy a növényi alapanyagú összetevôk különleges tulajdonságokkal, bírnak, például a hatással vannak a mikrobioló-giai szennyezettségre vagy a lerakódás kép zôdésre. Ezek miatt a fejlesztés, a gyártás és az egész logisztikai lánc so rán kiemelt figyelemmel szükséges kezelni ôket. Az alkalmazástehnikára fókuszált ü zem a-nyag fejlesztés a MOL Csoport ban négy fô pillérre támaszkodik, ame lyek elôsegítik a kiváló minôségû üzemanyagok elôállítását és kiszol gálását a környezetvédelem és a megújuló energiaforrások maximális figyelembevételével. E négy pillér az Eu-rópai Uniós elôírások és szabványok, a finomítási technológiai lehetôségek, a piaci igények és az autóipar által meg-fogalmazott elvárások. A MOL Csoport üzemanyagaira jel-lemzô a kiváló üzemanyagminôség és hosszú ideje kénmentesség. Az átlagon felüli tulajonságok fenntarthatók bio-komponesek bekeverésével is. A MOL csoport 2005 óta a pozsonyi 2006 óta pedig a százhalombattai finomítójában állít elô biokomponenseket is tartalmazó motorhajtóanyagokat minôségi prob lé-mák nélkül.
Dr. Máté Zöldy DS Develoment EngineerMOL DSD Product DevelopmentE-mail: [email protected]
technique of fuel containingSignificance of application
biocomponents
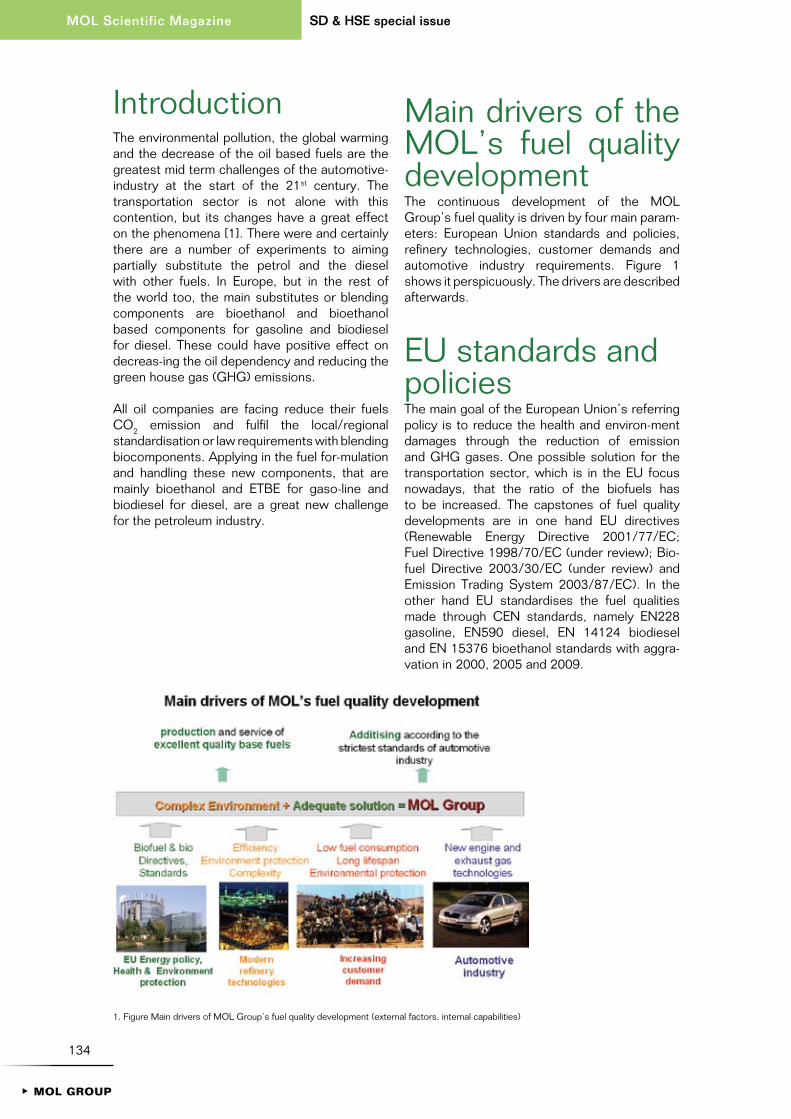
134
SD & HSE special issueMOL Scientific Magazine
1MOL GROUP
IntroductionThe environmental pollution, the global warming and the decrease of the oil based fuels are the greatest mid term challenges of the automotive-industry at the start of the 21st century. The transportation sector is not alone with this contention, but its changes have a great effect on the phenomena [1]. There were and certainly there are a number of experiments to aiming partially substitute the petrol and the diesel with other fuels. In Europe, but in the rest of the world too, the main substitutes or blending components are bioethanol and bioethanol based components for gasoline and biodiesel for diesel. These could have positive effect on decreas-ing the oil dependency and reducing the green house gas (GHG) emissions.
All oil companies are facing reduce their fuels CO2 emission and fulfil the local/regional standardisation or law requirements with blending biocomponents. Applying in the fuel for-mulation and handling these new components, that are mainly bioethanol and ETBE for gaso-line and biodiesel for diesel, are a great new challenge for the petroleum industry.
Main drivers of the MOL’s fuel quality developmentThe continuous development of the MOL Group’s fuel quality is driven by four main param-eters: European Union standards and policies, refinery technologies, customer demands and automotive industry requirements. Figure 1 shows it perspicuously. The drivers are described afterwards.
EU standards and policiesThe main goal of the European Union’s referring policy is to reduce the health and environ-ment damages through the reduction of emission and GHG gases. One possible solution for the transportation sector, which is in the EU focus nowadays, that the ratio of the biofuels has to be increased. The capstones of fuel quality developments are in one hand EU directives (Renewable Energy Directive 2001/77/EC; Fuel Directive 1998/70/EC (under review); Bio-fuel Directive 2003/30/EC (under review) and Emission Trading System 2003/87/EC). In the other hand EU standardises the fuel qualities made through CEN standards, namely EN228 gasoline, EN590 diesel, EN 14124 biodiesel and EN 15376 bioethanol standards with aggra-vation in 2000, 2005 and 2009.
1. Figure Main drivers of MOL Group’s fuel quality development (external factors, internal capabilities)
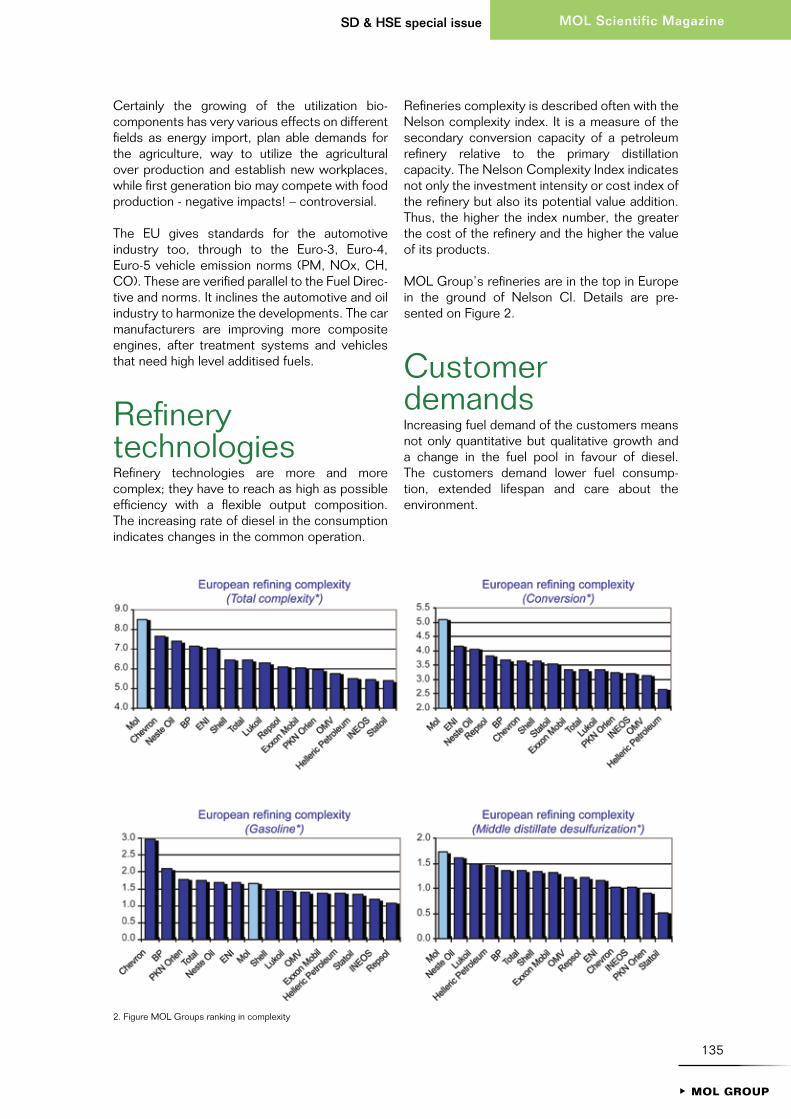
135
MOL Scientific MagazineSD & HSE special issue
1MOL GROUP
Certainly the growing of the utilization bio-components has very various effects on different fields as energy import, plan able demands for the agriculture, way to utilize the agricultural over production and establish new workplaces, while first generation bio may compete with food production - negative impacts! – controversial.
The EU gives standards for the automotive industry too, through to the Euro-3, Euro-4, Euro-5 vehicle emission norms (PM, NOx, CH, CO). These are verified parallel to the Fuel Direc-tive and norms. It inclines the automotive and oil industry to harmonize the developments. The car manufacturers are improving more composite engines, after treatment systems and vehicles that need high level additised fuels.
Refinery technologies Refinery technologies are more and more complex; they have to reach as high as possible efficiency with a flexible output composition. The increasing rate of diesel in the consumption indicates changes in the common operation.
Refineries complexity is described often with the Nelson complexity index. It is a measure of the secondary conversion capacity of a petroleum refinery relative to the primary distillation capacity. The Nelson Complexity Index indicates not only the investment intensity or cost index of the refinery but also its potential value addition. Thus, the higher the index number, the greater the cost of the refinery and the higher the value of its products.
MOL Group’s refineries are in the top in Europe in the ground of Nelson CI. Details are pre-sented on Figure 2.
Customer demandsIncreasing fuel demand of the customers means not only quantitative but qualitative growth and a change in the fuel pool in favour of diesel. The customers demand lower fuel consump-tion, extended lifespan and care about the environment.
2. Figure MOL Groups ranking in complexity

136
SD & HSE special issueMOL Scientific Magazine
1MOL GROUP
Automotive industry requirementsIt is essential not only follow the prescriptions of the European Union but take care about the ideas of the automotive industry. Car manufacturers fuel quality recommendations are sum-marized in the periodically reviewed Worldwide Fuel Charter (WWFC). MOL considers it as a reference to gain customer trust from an authentic source. It is a useful tool to develop fuels with biocontent, it deals with different biocomponents and bio blends as FAME, E-diesel or synthetic diesel fuels as well.
The WWFC gives four different fuel quality levels (see on Figure 3) for both diesel and gaso-line from basis fuels for markets without any regulations up to the fuel requirements for the near future based on the agreement of the main 60 car manufacturer.
WWFC fuel quality recommendation bases on the following:
• harmonized recommendations for gasoline and diesel fuel quality
• covers all markets• with the according of all important car
manufacturers
• main goals:• assure the customer satisfaction• decrease costs
A new aspect was introduced in the fuel development process with the utilisation of WWFC that increases the importance of application tests.
Fuel quality development in the MOL GroupMOL Groups fuel quality development takes into account the above mentioned four drivers to product and turn over superior quality fuels and to commitment for environment protection and renewable energy sources.
Theoretical simplified flow sheet of fuel development is seen on the figure 4. First stage is the determination of the main prerequisites of the new fuel or blend, based on the previous. Pro-duction/Blending – analytical testing – engine testing – and vehicle testing are the main steps of the application technique development.
Route of fuel in the vehicle can be described simplified as it is shown on Figure 5. Independ-ently of type of the fuel it is stored in a tank, through a filtration system it is pumped in a high pressure pump or a fuel distributor to the injector. Injected fuel mixed with air in the combus-tion chamber to combust and last but not least it goes though the catalyst. In the different de-vices the fuel have to meet very different and in some cases conflicting assumptions. Lot of measurement has to be done to control the fuels parameters to give the best performance in the whole vehicle fuel supply chain.
Fuels for markets further advancedrequirements for emissions control and toenable sophisticated NOx Technologies
Fuels for markets with advanced requirements for emissions control and other market demands
Fuels for markets with stringent requirements for emissions control and other market demands
Fuels for markets with minimal requirements for emissions control; based primarly on fundamental
vehicle/engine performance concerns
4
3
2
1
3. Figure WWFC fuel quality levels [2]
4. Figure Schematical way of fuel development

137
MOL Scientific MagazineSD & HSE special issue
1MOL GROUP
Critical appointments between fuel and engine components could be partially solved by en-gine side, for example fuel must take care on deposit control. The fuels effect on the system could be especially critical for biocomponents. Biodiesel has great influence on microbiologi-cal and mechanical contamination, long term stability, cold start and on no harm issues [6,8]. Bioethanol influences injector cleanness, fuel consumption and power output first of all [7].
In the last period the following steps were made in the field of biocomponents introduction by MOL (Figure 6.) Bio component introduction was started with the replacing of methanol in MTBE with etha-nol. It has been launched in the Danube Refinery to blend the bio ETBE in the gasoline at mid of 2005. Ethanol containing blends were formulated
and tested in 2006 and E5 was introduced in the Hungarian market at June of 2007.
Biodiesel investigation run based on the same regulation. Formulation and in-house testing period was from early 2006 to end of 2007. The market introduction in Hungary was at the beginning of 2008.
Development and introduction of E5 blend on the marketThe MSZ EN 228:2004 regulation enables ethanol blending in the gasoline up to 5vol% long ago thus the vehicles could be fuelled with low
5. Figure Connection map of fuel measured abilities and fuel chain assumptions
6. Figure Biofuels in MOL Group

138
1MOL GROUP
SD & HSE special issueMOL Scientific Magazine
ethanol content fuels. The new revenue tax law prescribed minimal 4,4vol% bio content in the sulphur free gasoline from 1st of June 2007. The switch has in the gasoline case been done in one step to bioethanol containing gasoline.
The product handling of E5 is mainly same as gasoline but in some cases the E5 properties are different from commercial gasoline. The product needs more care on the following:
• Higher corrosion activity can be preceded by stricter ethanol quality requirements in water-, acid-, and sulphur content
• Increased water absorbance, phase separation between water and alcohol and clean up effect (pipe/tank deposits, pick up of corrosion product) could be handled with „good housekeeping practice“.Good Housekeeping Practice means preserving the quality of fuels from the refinery throughout the whole logistic chain down to the filling stations, monitoring and handling of water, mechanical and microbial contamination. Visual check is first, if the sample is clear and bright, than it is free of water and mechanical contamination.
• Compability with elastomers could be difficult. Some elastomers are not able for use with any ethanol content.
Development and introduction of B5 fuel on the marketBiodiesel blending to diesel up to 5vol% is premised by the MSZ EN 590:2004 standard. Biodiesel content’s minimum prescription 4,4vol% in Hungary from 1st January 2008. qual-ity control is essential at the biodiesel component to not worsen the abilities of the base diesel. It bases on the production technology of biodiesel, thus quality of the final product depends on the raw material [5]. The most important differences and actions are summarised on the table 1.
quality ControlImplementation of biocomponents in the fuel pool results an update in Good Housekeeping Practice. It helps to preserve the quality of fuels from the refinery throughout the whole logis-tic chain involving refinery storage facilities, pipeline transport, rail carts, trucks, log termi-nals as well as partner’s transport- and storage facilities is a prerequisite for supplying quality products to the end users. It contains the monitoring and handling of water, mechanical & microbial contamination.
Effect What is to be doneIncrease the diesel lubricity BeneficialWorse storage stability than commercial Use only the biodiesel which fulfildiesel (bio source) the biodiesel standardIncreased water absorbance
Good Housekeeping Practice Clean up effect: pipe/tank deposits, implementationpick up of corrosion product
Increased risk of microbiological infection Continuous monitoring; GHP; no negative observationCompability with elastomers: some of them are unsuitable for biodiesel use
B5 concentration minimise the risk.
Table 1. Differences and actions with biodiesel blend
Figure 7. quality control sampling point in the logistic chain

139
MOL Scientific MagazineSD & HSE special issue
1MOL GROUP
OutlookA tendency in the European Union shows the following increase of biocomponents in the fuel pool. In Germany and France B7 is under introduction and it expected to be followed in the near future with B7+3% synthetic component. There are some signs that may be a fright fuel will be implemented with as high as 30% of biodiesel content. Ethanol content in the gasoline seems to be increased too. E10 blends could be the next step in the next few years, while higher bio rate is not proposed for the next time.
SummaryDevelopment and application of fuel containing biocomponents requires more care next to the utilisation of the common development and application methods. Biocomponents have some extraordinary abilities for example effect on microbiological contamination or on deposits that have to handle carefully during the development, production and in the whole logistic chain.
Motor fuels developed and distributed in MOL Group meet the technical requirements ac-cording to EN 228 (automotive gasolines) and EN 590 (diesel fuels) and the current and near future requirements on environmental protection. Requirements of the car manufacturers sum-marized in the WWFC handled as very important element during the development. It gives independent technical standard that is chosen as a reference to gain customer trust from an authentic source.
MOL Group fuels are characterised by excellent quality, sulphur content is very low in the long term. The over than average qualities can be kept on with biocomponents. MOL Group produces in Slovnaft since 2005 in Danube Refinery since 2006 biocontent fuels without any quality problems. Carefully prepared and bio component specified good housekeeping prac-tice helps to control the quality in the whole logistic chain.
References[1] Tánczos K., Török Á.: The linkage
of climate change and energy consumption of Hungary in the road transportation sector, Transport Journal (ISSN 1648-4142), XXII évfolyam, 2007/2, pp. 134–138
[2] Worldwide Fuel Charter, September 2006, ACEA,Alliance, EMA, JAMA
[3] PFC Energy 2007 yearly report[4] Csete, M.: Climate change and
sustainable settlements development. In: Európai kihívások III. Nemzetközi Tudományos Konferencia, Szegedi Tudományegyetem. Szeged, 2005., (p. 508-513) ISBN 963 482 757 8 Peidl
[5] Réczey, I., Réczey, G., A biomassza mint nyersanyag és energiaforrás, Bioenergia, I/2., 8-18, 2006
[6] Jánosi, L.; Hancsók, J.; Kovács F.: Állati zsiradékból és különféle növényi olajokból készült hajtóanyagok motorikus és környezeti hatásainak összehasonlító vizsgálata. MTA Agrár Mûszaki Bizottság, XXVII. Kutatási és Fejlesztési Tanácskozás. Gödöllô, 2003. I. 21-22. SZIE Gépészmérnöki Kar – Mezôgazdasági Gépesítési Intézet, 1. kötet 222-228. p
[7] Bereczky Á.; Meggyes, A.; Laza, T.; Kecskés, R.: Examination of burning prozess of regenerativ liqiud fuel and alcohol mixtures in diesel engine, Heat engines and environmental protection, May 23-25, 2005, Balatonfüred ISBN 963 420 840 1
[8] Emôd István: Repceolaj-metilészterrel üzemelô dízelmotorok teljesítménye, tüzelôanyagfogyasztása és környezeti hatásai, Jármûvek, építôipari és mezôgazdasági gépek, 1997. (44. évf.) 5. sz. 164-166. old.
Revised by: Dr. Szirmai László
140
1MOL GROUP
SD & HSE special issueMOL Scientific Magazine
AbstractThe development of the future of MOL's Retail Business is summarized in the Green Filling Station Concept. Our future studies followed the holistic approach with analyzing of multiple driving forces of fuel retailing and defining main development streams and goals with a 10-15 years outlook. The analysis of driving factors covers world-economy and oil industry trends, automotive technology trends, social and customer habit changes, new en-gineering solutions and last, but not least the trends of Sustainable Development. The Green filling station is the symbol of our future shaping developments and a way of application. Advanced techniques and solutions will be optimized to the environment and to the circumstances of the given filling station and we strive to create optimal solutions. This is what we call the “green” solution.One of the main directions of our green solution is targeting the improvement of energy household of the filling stations. It covers application of renewable energies, energy-saving solutions, improved waste management, and reaching optimal integration with the environment. MOL also has to prepare for the sales of alternative fuels. We strive to cope with the increasing, more and more particular customer
requirements. We will have to invest in advanced engagement techniques and multiply the space for interaction with our customers. This tailor-made approach, coupled with high-quality forecourt, shop and gastro services can ensure long term prosperity for MOL Retail.
ÖsszefoglalásA MOL Kiskereskedelem Üzletág jö-vôbeli fejlôdése a „Zöld Töltôállomás” koncepcióban foglalható össze. Jövô-kutató vizsgálatainkban teljes ségre tö rekvô megközelítéssel éltünk, az ü zem anyag kereskedelem összetett moz gató erôinek elemzésével, vala mint a fô fejlôdési irányok és célok meg-határozásával, 10-15 éves kitekintés-ben. A befolyásoló tényezôk analízise kiterjed a világgazdasági- és olajipari trendek alakulására, az autóipari tech-nológia trendjeire, társadalmi- és fo-gyasz tói szokások változásaira, új mér-nöki megoldásokra, és végül, de nem utolsósorban a Fenntartható Fejlôdés irányvonalaira.A Zöld Töltôállomás a jövôben alakot öltô fejlesztéseink és azok alkalmazásának szimbóluma. Fejlett technológiákat és megoldásokat optimalizálunk majd a környezethez, és az adott töltôállomás körülményeihez, amibôl igyekszünk ide-ális végeredményt formálni. Ez az, amit „zöld” megoldásnak nevezünk.A zöld megoldásunk egyik fô irány vo nala a töltôállomások energia ház tar tásának fejlesztését veszi célba. Ez magában fog lalja a megújuló ener giaforrások al-kalmazását, az energia takarékos üze-meltetést, a fejlett hulladék gaz dál ko-dást, és megfelelô integrációt ér el a
– Concept for the Future Filling Station –
Green Trends– Future Under MOL Canopy
Béla CsorbaNetwork Development and Asset Management directorMOL Group Retail DivisionE-mail: [email protected]
László Bartha Sales and Business Development directorMOL Group Retail DivisionE-mail: [email protected]
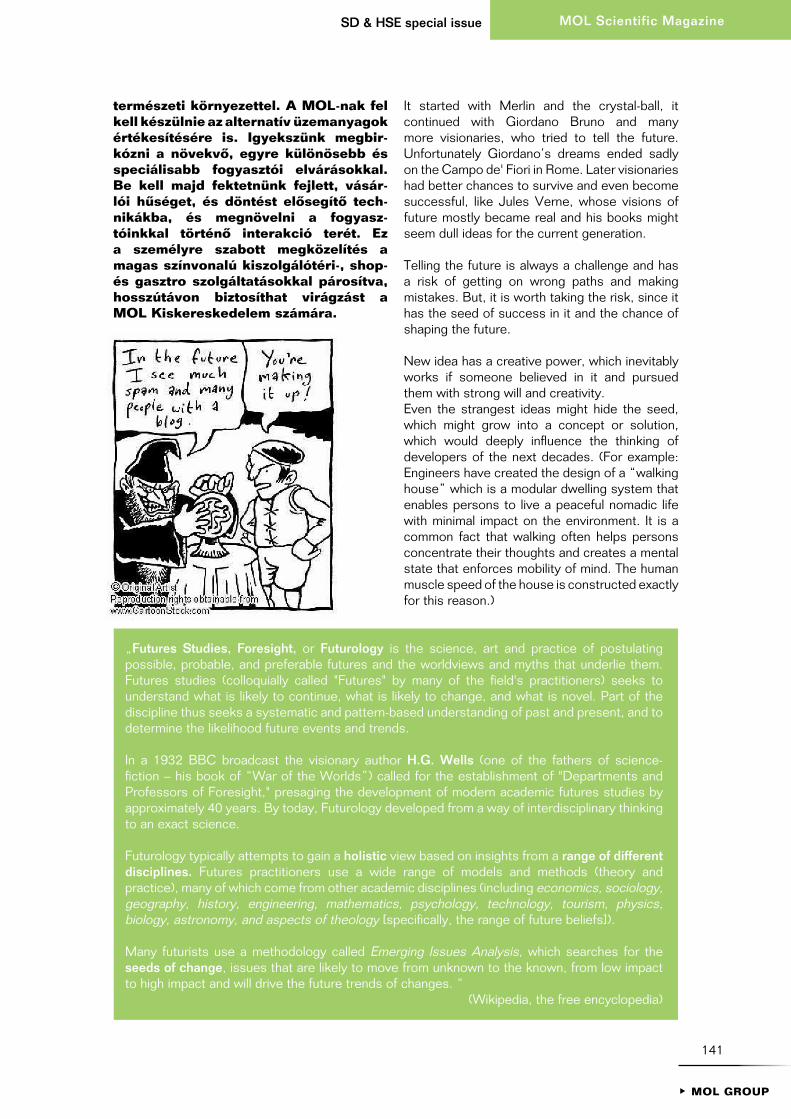
141
MOL Scientific MagazineSD & HSE special issue
1MOL GROUP
ter mészeti környezettel. A MOL-nak fel kell készülnie az alternatív üzemanyagok értékesítésére is. Igyekszünk megbir-kó zni a növekvô, egyre különösebb és speciálisabb fogyasztói elvárásokkal. Be kell majd fektetnünk fejlett, vásár-lói hûséget, és döntést elôsegítô tech-nikákba, és megnövelni a fogyasz-tóinkkal történô interakció terét. Ez a személyre szabott megközelítés a magas színvonalú kiszolgálótéri-, shop- és gasztro szolgáltatásokkal párosítva, hosszútávon biztosíthat virágzást a MOL Kiskereskedelem számára.
It started with Merlin and the crystal-ball, it continued with Giordano Bruno and many more visionaries, who tried to tell the future. Unfortunately Giordano’s dreams ended sadly on the Campo de' Fiori in Rome. Later visionaries had better chances to survive and even become successful, like Jules Verne, whose visions of future mostly became real and his books might seem dull ideas for the current generation.
Telling the future is always a challenge and has a risk of getting on wrong paths and making mistakes. But, it is worth taking the risk, since it has the seed of success in it and the chance of shaping the future.
New idea has a creative power, which inevitably works if someone believed in it and pursued them with strong will and creativity. Even the strangest ideas might hide the seed, which might grow into a concept or solution, which would deeply influence the thinking of developers of the next decades. (For example: Engineers have created the design of a “walking house” which is a modular dwelling system that enables persons to live a peaceful nomadic life with minimal impact on the environment. It is a common fact that walking often helps persons concentrate their thoughts and creates a mental state that enforces mobility of mind. The human muscle speed of the house is constructed exactly for this reason.)
„Futures Studies, Foresight, or Futurology is the science, art and practice of postulating possible, probable, and preferable futures and the worldviews and myths that underlie them. Futures studies (colloquially called "Futures" by many of the field's practitioners) seeks to understand what is likely to continue, what is likely to change, and what is novel. Part of the discipline thus seeks a systematic and pattern-based understanding of past and present, and to determine the likelihood future events and trends.
In a 1932 BBC broadcast the visionary author H.G. Wells (one of the fathers of science-fiction – his book of “War of the Worlds”) called for the establishment of "Departments and Professors of Foresight," presaging the development of modern academic futures studies by approximately 40 years. By today, Futurology developed from a way of interdisciplinary thinking to an exact science.
Futurology typically attempts to gain a holistic view based on insights from a range of different disciplines. Futures practitioners use a wide range of models and methods (theory and practice), many of which come from other academic disciplines (including economics, sociology, geography, history, engineering, mathematics, psychology, technology, tourism, physics, biology, astronomy, and aspects of theology [specifically, the range of future beliefs]).
Many futurists use a methodology called Emerging Issues Analysis, which searches for the seeds of change, issues that are likely to move from unknown to the known, from low impact to high impact and will drive the future trends of changes. “
(Wikipedia, the free encyclopedia)

142
SD & HSE special issueMOL Scientific Magazine
1MOL GROUP
Having in mind the idea of continuously moving towards innovative ideas were one of the main reasons to start studying and developing the concept of the “Filling station of the future” in Retail. There will be services, products, customer engagement techniques and engineering solutions in the outcome of this study, which today may seem futuristic – but, we need to pioneer this process and test some of the solutions to have experience when they come to be industrial standards.
Objectives and MethodologyOur goal is to create a vision about the Future Service Station. Where the Service Station represents: an object in its environment (social, ecological, etc), a sales concept and the materialization of our philosophy of our business in a 10-15-year-period.
To follow the path of a Futurologist, firstly an “Emerging Issues Analysis” has to be run to find “seeds of changes”. It means to identify a limited set of key strategic drivers, which, we strongly believe, will fundamentally impact the shape of the future petroleum retailing and our service station concept. The following 5 drivers were identified:
1. World economy and oil industry changes2. Social (demographic) changes, changes
in customer habit
3. Automotive technology developments4. Environmental trends, Sustainable
Development5. Engineering solution developments
Analyzing the strategic drivers – with a max 5-10 years outlook –, it is possible to identify those emerging issues and trends, which – with a
good likelihood – will shape the future. After the trend analysis, the following key questions can be answered.
1. What kind of products and services will we sell at the forecourt (incl. fuels) and in the store?
2. How will we engage our customers? 3. How the “Filling station of the future” will
look like as a technological object, as part of its environment?
Obviously estimations might change from time to time. The possible developments can get a different twist based on the collected experience and changing economic, market, consumer or technological parameters. Therefore, the trend-analysis must be repeated regularly and the development actions need to be re-assessed, justified or changed.
?

143
MOL Scientific MagazineSD & HSE special issue
1MOL GROUP
Emerging issues, seeds, driving factors of changesE C O N O M Y A N D O I L I N D U S T R Y
We believe that the current, rapid downfall of oil and oil-derivative prices and demand will recover soon and the growth of world energy consumption and consequently the increase of energy prices (fossil sources) will be continue on long term.
Efforts to implement energy-efficient automotive solutions and the effect of alternative energy sources (using as automotive power generator) are insignificant compared to those growth trends, which are moving the world and consequently, the oil industry. The importance of alternative energy sources will grow, but these only will color the picture, but wouldn’t change the basic picture around the Service Station.
Energy-efficiency is becoming a differentiator among market players (International Oil Companies are investing money in alternative fuels – bio, solar, wind, H2, geothermic sources). The automotive industry is bringing alternative engine technologies to the market, although currently these efforts have more of a public relation importance than a real economic impact on general supply/ demand trends.
However, it is important to note that Sustainability as a principle is turning to be a basic value in the modern society, so industry players must pay attention to this fact and meet stakeholder’s expectations.
C U S T O M E R H A B I T S
The most diverse and un-foreseeable picture is about the consumer ex pec tations. Most of the fundamental changes in politics, society,
world economy, and techno logy developments impact the customer and shape its view, behavior and finally its shopping manners. Although the impacts can be identified, the result
of all the impacts cannot be exactly found. It is very difficult to tell, how the future customer will behave exactly.Our derivations are based on the following group of parameters:
• Consumer confidence is shrinking – even more true during an economic recession (Maslow-effect)
• Demographic scissors are opening (for many, fuel becomes luxury – for many, much higher convenience expectations arise). Ageing of society is also strengthening this trend, considering the limited ability of the society in financing the growing pensioner segment.
• Concentration to cities continues, cars are gradually pushed out of the center, more alternative commuting tools are used (mass transportation, bicycle: „Critical Mass”)
• Increasing sense of responsibility for Sustainable Development is becoming a fundamental value, as fuel consumption an ideological question.
• Atomization of the society continues (virtual life, real communities are vanishing) – but also inverse trends are coming (wellness, organic food, healthily lifestyle) in the same time
• With the sophistication of retailing and marketing techniques and the continuous growth of energy prices (relative value in the shopping basket), we expect growing customer expectations for petroleum retailing in terms of quality and complexity of products and services.
The exact identification of “The Customer” is getting more and more difficult, therefore acces-sing and attracting needs more personalized and diverse approaches. Localization and custo-mization, even personalization will be the winning forces. We have to consider that convenience is getting a wider and wider category even on the filling stations, which need to be reflected in the product and service offer.
Oil companies must be prepared to develop from traditional fuel retailer to a convenience retailer, even more a personal service provider to retail and attract customers. E N V I R O N M E N T A L T R E N D S , S U S T A I N A B L E D E V E L O P M E N T
Sustainability will get from a „nice to have” point to more of a „stay in game” factor for industry players in the coming years, decades. The

144
SD & HSE special issueMOL Scientific Magazine
1MOL GROUP
“green service station” concept is getting more and more obviously an objective, both from products and services (at the forecourt and in the
shop) and construction (filling station as a part of the environment) point of view.
Regulators (governments, authorities, policy makers) are putting more and more pressure on oil companies with introducing stricter requirements, which will demand new, complex technological solutions in service station design to preserve environment.
Increased responsibility must be demonstrated in relation with the products and services, which are sold by the filling stations. Therefore, product stewardship is getting an important ability to be gained by market players (e.g.: product recall system/ obligatory waste oil and accumulator collection).
Certainly requirements toward oil companies to produce and sell alternative fuels will emerge (e.g.: increased bio-fuel content requirements in traditional fuels), but, currently, there is no foreseeable long-term pattern and final solution.
A U T O M O T I V E T R E N D S
Based on the analysis of the car manufacturers’ moves (developments) we can set up the following phases of possible changes.
Short-term development will focus on improving efficiency of internal combustion engines and creating low-emission solutions (e.g.: BMW efficient dynamics: auto start-stop, brake energy regeneration, electric power steering, air vent control, gear shift indicator, low resistance tires and similar systems at VW BlueMotion and Mercedes BlueTec. This includes combined direct injection with compressor and/or turbo charged engine, applying 3rd generation common rail diesel technology, using new materials (e.g.: magnesium engine blocks, thermoplastic body parts, carbon-Kevlar parts)
On medium term (somewhat parallel with short-term) we see a real potential in hybrid development. The Hybrid would become an affordable choice soon (e.g.: Toyota’s Hybrid-SynergyDrive, BMW’s ActiveHybrid).
On long-term, we see major limitations in the concept, that alternative fuels will become „the solution” (Hydrogen: supply, storage and transportation issues, heavy catalyst at extremely value and with safety issues; Bio-fuels: global economic issues with using resources of food; CNG/ LNG: limited usage, since filling points must be closer to gas-grid).
In summary, we expect no major shift from the current automotive philosophy, but we see real opportunities in exploiting efficiency reserves in traditional HC fuelled engine combined with hybrid technology for short- and mid term.
E N G I N E E R I N G S O L U T I O N S
The development of en-gineering solutions will be driven by the customer needs, products, servi-ces, perceptions of hy-giene, security, com fort.
It is also triggered by the economic pressure, but there will be a pulling force as well; new engineering solutions, materials, technologies, which will trigger new ideas on the market and might shape consumer habits as well.
Customer needs, new products on the forecourt:Automotive fuel technology development has to be prepared for the sale of alternative fuels, which might need different construction standards, storage and dispensing facilities. The current examples are either partial solutions (LNG filling points can be installed close to a grid), or “beta/ early solutions” (H2 fill ups, electricity discharging, nuclear capsule etc). Our current challenge is how to test to offer alternative fuels until there is no real customer need.
Economic pressure will result in primarily new energy supply sources and more efficient energy household of filling stations:
• Capturing alternative energy sources from the nature – wind-, sun-, geothermic energy and kinetic structure – is one of the most exciting rooms for innovative engineering solutions:• Example: Vertical Axis Wind Turbine
(VAWT) has been developed by a British company for the urban wind environment. While the large, >1MW VAWTs are primarily designed for the wind energy generation business, a 15 m high Vertical Wind Turbine is able supply the yearly power need of a 70 m2 flat and due to

145
MOL Scientific MagazineSD & HSE special issue
1MOL GROUP
its Triple Helix Design, it is quiet and aesthetic therefore can fit into living areas. The average yearly wind speed at some 15 m above ground, like Hungary, is 3.5 km/h and the optimal operational wind speed of VAWT is 10 m/s therefore the idea of a student from the Arizona State University is very exciting. The average speed on a motorway is approximately 115 km/h therefore the primary mode of transportation may be able to generate much more wind than the nature in its surrounding area, so capturing this potential seems an interesting research area.
• Reducing electricity consumptions with
new lighting solutions (LED lights, Solatube sunshine structures, Hybrid Solar Lighting system) and reducing water consumptions by rationalizing collection, recycling and consumption will significantly contribute to reduce our exposure to the energy sources.
The recent innovative engineering solutions and structures open the door for revolutionary changes in the construction industry:
• Aerogel holds 15 entries in Guinness Book Records, more than any other material. It is made by the supercritical drying obf liquid gels of alumina, chromia, tin oxide, or carbon. It is 99.8% empty space which makes it look semi-transparent. It is a better than ever insulator, it stops cold, it stops heat. With a shield of aerogel, you can protect yourself
from a flamethrower, or could build a warm dome on the moon.
• The Transparent Alumina, or glass-concrete will multiply the application of building materials, but the Nano-technology now is being considered as the absolute technology of the future.
• The Nano-technology is the research area of micro structures (the diameter of the human hair is 5000 times bigger than one nanometer). With its help for example, you can create perfectly smooth and even surfaces on any building materials which significantly reduces the cohesion capability of pollutions therefore there is no need of chemicals for cleaning.
What is the the Green filling station? For us it is the symbol of our future shaping developments. Due to the different natural conditions of geographically spread locations, the surrounding (eco-social) environment of the filling station we may not have standard solutions for each of the locations, but rather fit for the demand compliances. Here the application of those advanced techniques, which we introduced in prior parts, will be optimized to the environment and circumstances of the given filling station and we create an optimal solution. This is – what we call – the “green” solution.

146
SD & HSE special issueMOL Scientific Magazine
1MOL GROUP
The Green Filling Station – summary developments in progressThere will be two pilot stations built in Leányfalu and in Budapest, Istenhegyi Street between 2010 and 2012 where several of the following solutions will be tested:
G R E E N F I L L I N G S T A T I O N P I L O T S C E N A R I O S
• An almost emission-free-structure of CO2 and NOX and will be as much integrated in its natural environment as possible.
• Solar cells for supporting energy supply of the station (wind turbines will be tested separately due to the altering wind conditions of the country).
• LED lighting and Solatube systems will significantly reduce the electricity consumption of the building.
• Combination of Solar collectors and Geothermic-pumps for heating the water and the building will be optimized with recovery of thermo- energy of the ventilation and cooling equipment.
• Optimized biological waste water recycling and rainwater collections will help rationalizing water consumptions.
• Automatic shading system will allow reducing energy need of cooling the building in summer time and allowing the sun warming the building in winter time.
• Green facade, which is an advanced vertical and horizontal supplementary, plastic building structure, which with its living, but controlled flora and integrated watering system improves the micro-climate of the building therefore its energy household, but more importantly, the 22 m² of green facade neutralizes 1 tons of CO2 on a yearly basis.
D E V E L O P M E N T O F F U R T H E R S O L U T I O N T O I M P R O V E E N E R G Y E F F I C I E N C Y
MOL, together with the Hungarian motorway operator ÁAK, has been studying the opportunity to utilize transportation-wind on motorways to develop a potential power supply of motorway-rest-areas.
Based on our recently run Energy-house-holding Audit of filling stations we target to move our buildings from the energetic category “E” (better than average) to “B” (better than requested) in some ten years, by better insulation, optimum shadowing and lighting and deployment of new structures and technologies.
P R E P A R E F O R A L T E R N A T I V E F U E L S A N D A U T O M A T E D S O L U T I O N S O N F O R E C O U R T
There is no inevitably winning alternative technology on the market and currently we do not see a chance for a quick crystallization. In this area, MOL should follow and monitor market trends and must be prepared for quickly implementing alternative fuel technologies if it has a positive business case.

147
MOL Scientific MagazineSD & HSE special issue
1MOL GROUP
As cost-drivers are becoming more and more important factors, it is critical for MOL to develop the ability of operating low-cost retail forecourts, which might be a key weapon if economics and market trends force us to do so. Low-cost (unmanned technologies) should not mean eliminating the customer interaction; therefore the concept should include using sophisticated customer engagement technologies.
The ongoing development of the second generation “Fastlane” OPT module will bring a full solution for all payment methods (e.g.: cash, bankcard and fleet-card), which could be rolled-out as a tactical low-cost model to certain markets. The third generation “Fastlane” model will be integrated with proactive customer engagement technologies (e.g.: LCD screens, voice shower, etc.).
D E V E L O P M E N T O F A C O M P L E X C O N V E N I E N C E / G A S T R O C O N C E P T T O I M P R O V E S E R V I C E S
We launched the development of a complex convenience and gastro concept to establish a future platform for extending our shop CVP (Customer Value Proposition) to meet growing and more and more differentiated customer expectations in this field.
Our goal is to establish a framework, where we can cover customer needs across our full network portfolio (e.g.: from motorways to urban/ city locations) with a modular, segmented system of gastro offers. We aim to create a
watermark, with which we could differentiate our network from our competitors (e.g.: BP-Marks and Spencer in UK) and supporting fuel sales with maintaining our regular customer base. We align the service station design standards with the future gastro modules.
We create a gastro modules form simple coffee vending machines, bakery solutions, through coffees, fresh foods and eventually full restaurant services. We will also create tactical gastro modules, which might be used only seasonally or according to the local demand characteristic (e.g.: simple-food at urban areas, etc.) CVP on motorway service stations should get a special focus during the concept creation process, since these locations are crucial image-holders and substantially drive customer perception about the retail brand.
Leisure areas and complex services are also subject to long-term concept development.
“ I N D I V I D U A L I Z E ” C U S T O M E R E N G A G E M E N T To cope with increasing diversity of customer expectations and being able to access customers more and more on individual level with our offers and create a personalized relationship between the Customer and the Filling Station.
To reach this goal we aim to develop sophisticated loyalty and CRM techniques to cope with increased need for more personalized requirements Firstly we will build loyalty based customer database and introduce CRM approach
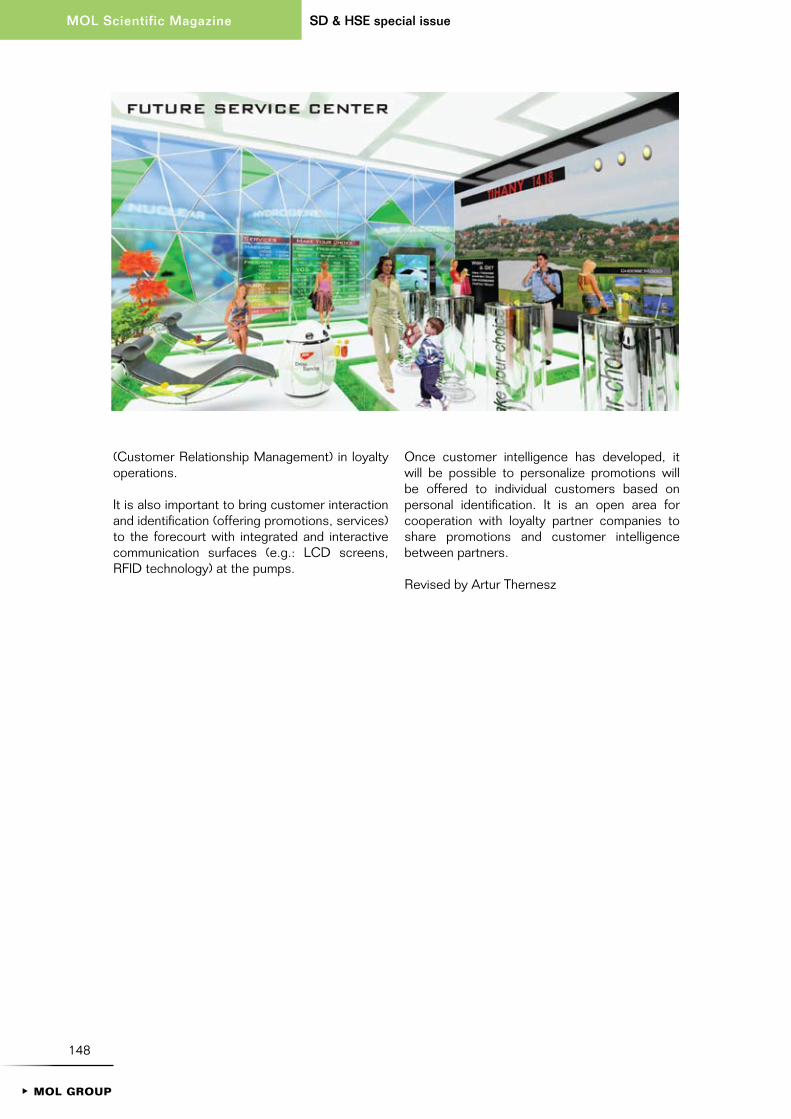
148
SD & HSE special issueMOL Scientific Magazine
1MOL GROUP
(Customer Relationship Management) in loyalty operations.
It is also important to bring customer interaction and identification (offering promotions, services) to the forecourt with integrated and interactive communication surfaces (e.g.: LCD screens, RFID technology) at the pumps.
Once customer intelligence has developed, it will be possible to personalize promotions will be offered to individual customers based on personal identification. It is an open area for cooperation with loyalty partner companies to share promotions and customer intelligence between partners.
Revised by Artur Thernesz