mohammed ahmed - diva-portal.org
TRANSCRIPT
Mohammed Ahmed
Service Quality in Accounting
Firms: its Effect on Client Satisfaction and Loyalty
A quantitative study based on the Swedish
listed companies
Business Administration Master’s Thesis
30 Credits
Term: Spring 2018
Supervisor: Bertrand Pauget
Acknowledgement
I would like to express my gratitude to:
- My family, friends, teachers, and colleagues who helped and
encouraged me.
- My supervisor Bertrand Pauget for his patience, support and valuable
guidance that helped me to accomplish the project.
- My examiner Markus Fellesson for his valuable feedback.
- The staff and library staff at Karlstad University for their support and
assistance.
- The respondents who helped me by answering the survey and sending
feedback.
- The opponent groups for their worthy comments, which played a
pivotal role in improving the project.
Karlstad, June 2018
______________________
Mohammed Ahmed
Abstract
Background: The quality of service is considered as an essential component
in any service industry. It has been evolved in service marketing and has often
been used in other research fields and sectors. Further, researchers have
emphasized the importance of measuring the quality dimensions over years
and in various industries in order to manage it. Also, they have proposed that
enhancing the quality of services enhances customer satisfaction and loyalty, in
turn that will enable the service provider to meet the changes and challenges in
its business environment.
Purpose: Based on listed companies’ perception at Nasdaq Stockholm OMX,
the study seeks to evaluate the service quality provided by accounting firms in
Sweden and determine the situation of its dimensions, as well as to explore
their direct impact on the client satisfaction and client loyalty. In addition, the
study utilizes the SERVPERF model to measure the service quality’s
dimensions.
Approach/methodology: To achieve the purpose, the study conducts a
deductive and quantitative approach with explanatory purpose. Also, the data
has been collected based an online questionnaire. It was sent to 450 listed
companies at Nasdaq Stockholm OMX, resulting in a sample of 58
respondents. The analysis has been conducted based on regression analysis.
Result/discussion: the research presents and discusses the result based on
two hypotheses groups separately. The first hypotheses group regarding the
impact of service quality and its dimensions on customer satisfaction. The
second hypotheses group concerning the impact of service quality and its
dimensions on customer loyalty.
Originality: To the researcher’s knowledge this study is considered as a first
attempt using a multi-dimension scale to assess the service quality of the
accounting firms in Sweden based on the perception of Swedish listed
companies.
Keywords: Quality of service, SERVQUAL, SERVPERF, customer loyalty,
customer satisfaction, Accounting firms, Nasdaq Stockholm OMX.
Contents 1. Introduction ......................................................................................................... 1
1.1. Background ................................................................................................... 1
1.2. Problem discussion ....................................................................................... 2
1.3. Aim ............................................................................................................... 4
1.4. Outline of the thesis ...................................................................................... 4
2. Theoretical framework ........................................................................................ 6
2.1. The importance of service quality ................................................................ 6
2.1.1. Financial scandals and collapses ........................................................... 6
2.1.2. Highly competitive market .................................................................... 7
2.1.3. Rapidly developing technologies........................................................... 8
2.2. Service quality concept ................................................................................. 8
2.3. Service quality models.................................................................................. 9
2.3.1. SERVQUAL model ............................................................................. 10
2.3.2. SERVPERF model .............................................................................. 10
2.3.3. The dimensions of service quality ....................................................... 11
2.4. Customer loyalty ........................................................................................ 12
2.5. Customer satisfaction ................................................................................. 13
2.6. Previous studies and hypotheses formulation ............................................. 14
2.6.1 Previous studies .................................................................................... 14
2.6.2. Formulation of hypotheses .................................................................. 15
3. Methodology ...................................................................................................... 18
3.1. Research approach ...................................................................................... 18
3.2. Research Method ........................................................................................ 19
3.3. Data Source ................................................................................................ 20
3.4. Operationalization and measurement ......................................................... 20
3.5. Pretesting .................................................................................................... 21
3.6. Data collection methods ............................................................................. 21
3.7. Population and Sampling ............................................................................ 22
3.7.1. Identification the research’s population .............................................. 22
3.7.2. Sampling .............................................................................................. 23
3.7.3. Selecting the sample size ..................................................................... 24
3.7.4. The process of random selection ......................................................... 24
3.8. Data analysis ............................................................................................... 25
3.8.1 Descriptive statistics ............................................................................. 25
3.8.2. Correlation analysis ............................................................................. 25
3.8.3 Regression analysis .............................................................................. 26
3.9. Research quality ......................................................................................... 26
3.9.1 Validity ................................................................................................. 27
3.9.2. Reliability ............................................................................................ 28
3.9.3. Ethical consideration ........................................................................... 29
4. Empirical findings and results .......................................................................... 31
4.1. The sample’s participants ........................................................................... 31
4.2. Descriptive statistics................................................................................... 32
4.3. Frequency table .......................................................................................... 33
4.4. Reliability analysis ..................................................................................... 33
4.5. Construct validity: ...................................................................................... 34
4.6. Hypothesis testing: First group .................................................................. 35
4.6.1. The impact of service quality on customer satisfaction ...................... 35
4.6.2. The impact of service quality dimensions on customer satisfaction ... 36
4.6.3. Summary of hypotheses testing: First group ....................................... 38
4.7. Hypothesis testing: Second group .............................................................. 39
4.7.1 The impact of service quality on customer loyalty .............................. 39
4.7.2. The impact of service quality dimensions on customer loyalty .......... 40
4.7.3. Summary of hypotheses testing: Second group .................................. 41
5. Discussion ......................................................................................................... 43
5.1. Descriptive statistic and frequency table ................................................... 43
5.2. Discussion of results: First group ............................................................... 43
5.3. Discussion of results: Second group .......................................................... 44
6. Conclusion ........................................................................................................ 46
6.1. Managerial implications ............................................................................. 47
6.3. Limitations and further research recommendations ................................... 48
7. References ......................................................................................................... 50
8. Appendix ........................................................................................................... 56
List of figures
Figure 1: Conceptual model of quality according to SEVQUAL & SERPERF ... 12 Figure 2: Conceptual model of service quality and customer satisfaction............ 16 Figure 3: Conceptual model of service quality and customer loyalty ................... 17
List of tables
Table 1: The sample’s participants ........................................................................ 31 Table 2: Descriptive statistics ................................................................................ 32
Table 3: Frequency table ....................................................................................... 33 Table 4: Cronbach’s alpha ..................................................................................... 34 Table 5: Constructive validity ............................................................................... 35 Table 6: Model summary of service quality and satisfaction ................................ 36 Table 7: ANOVAa concerning service quality and customer satisfaction ........... 36
Table 8: Model summary regarding quality dimensions and satisfaction ............. 37 Table 9: ANOVA
a regarding quality dimensions and satisfaction ........................ 37
Table 10: Coefficients table regarding quality dimensions and satisfaction ......... 37
Table 11:Summary of hypotheses outcomes: First group .................................... 39 Table 12: Model summary concerning service quality and customer loyalty ....... 40
Table 13: ANOVA concerning service quality and customer loyalty ................... 40
Table 14: Model summary regarding quality dimensions and loyalty .................. 41
Table 15: ANOVA regarding quality dimensions and loyalty .............................. 41
Table 16: Coefficients regarding quality dimensions and loyalty ......................... 41
Table 17: Summary of hypotheses outcomes: Second group ................................ 42
1
1. Introduction
In order to put the reader on the thesis track, this chapter will demonstrate
the background and the importance of service quality, discuss the research
problem, as well as demonstrate the aim and the research questions that
have been raised based on the problem discussion. Finally, the outline of
the thesis has been presented.
1.1. Background
Service quality is an essential element and strategic instrument for business
sustainability in today’s changeful and competitive business environment. It
has a crucial role in improving business performance, gaining competitive
merit, and meeting clients demands. Therefore, it is considered as a key factor
in enhancing customer relationships and achieving success (Chumpitaz
Caceres & Paparoidamis 2007; Jain & Gupta 2004; Kranias & Bourlessa 2013;
Reheul et al. 2013).
The service quality has become increasingly important and the requirement for
enhancing it has become a top priority due to the rapid growth of the service
sector and its growing contribution to the economy, as well as to meet the
challenges arising from increased competition (Carrillat et al. 2009; Mariotti et
al. 2013; Priporas et al. 2017b). As a result, the quality of service has gained
considerable growing interest among researchers and practitioners (Lewis
1989; Reheul et al. 2013).
Originally, the service quality has been developed in the field of service
marketing, and it has frequently been utilized in other research areas likewise
(Caruana 2002; Dahlgaard-Park 2015). Due to the non-material nature of the
services, great efforts have been made to understand, determine and measure
its quality in order to manage it (Aga & Safakli 2007; Asher 1990; Jain &
Gupta 2004).
Researchers have presented different views regarding service quality, which
has led to various definitions and measurement models. However, these views
are generally based on the subjective quality which relies on the perception of
client and his/her judgment. Besides, some researchers focused on the client's
expectations to assess the service quality. Others have depended on the client's
real perception, while other studies have based on the gap between the client's
expectations and the client's real perception to assess it (Cronin & Taylor
1992; Parasuraman & Zeithaml 2002; Smart 1995).
2
Currently, the multidimensional structure models SERVQUAL and
SERVPERF are considered as the most common scales (Dahlgaard-Park
2015; Reheul et al. 2013). They have been established by expert researchers,
and they have been refined through many stages, statistical examinations, and
empirical studies. Particularly, SERVQUAL evaluates the quality based on the
variance between client’s expectations and perceptions (Bearden & Netemeyer
2011; Parasuraman et al. 1988; Yildiz 2017).
Even though the SERVQUAL is still one of the most commonly used scales,
it has been criticized by many researchers in term of the expectations part.
Therefore, SERVPERF scale which bases on the perception section only of
SERVQUAL has been created as an alternative for SERVQUAL. More
precisely, a SERVPERF scale is the SERVQUAL scale without the
expectation part. It explains the quality based on an overall assessment of
perceived quality rather than relying on variation. Gradually, many researchers
have used SERVPERF, and recommended it, especially in the accounting
industry (Cronin & Taylor 1992; Dahlgaard-Park 2015; Jain & Gupta 2004;
Reheul et al. 2013).
Specifically, due to the increasing competition and increasing number of
accounting scandals, the accounting service providers have strived to offer
superior quality of accounting services with the aim of retaining current clients
and gaining new clients. In line with this, researchers have utilized accountancy
and service marketing literature to understand and measure the intangible
services quality of accounting firms to be able to manage it (Aga & Safakli
2007; Bean et al. 1996; Cory & Huttenhoff 2011).
1.2. Problem discussion
Changes in the business environment affect corporate sectors all over the
world (Jankalová 2012; Manzella 2005). Globally, the accounting industry faces
various changes and challenges (King & Fitzgerald 2016; Zainuddin &
Sulaiman 2016). Consequently, the accounting firms in Sweden are no
exception. Therefore, as any business sector, they have to respond to these
changes in order to maintain their relevance and sustainability in this volatile
and competitive environment (Jankalová 2012; King & Fitzgerald 2016;
Manzella 2005).
Some of these changes and challenges that are affecting the accounting
industry are: the increasing competition in today's markets coupled with the
privacy of accounting as a highly competitive industry offering similar services
3
(Richard & Chang 2012; Saxby et al., 2004; Jasinskas et al. 2016), as well as the
financial scandals and collapses that have affected confidence and the
relationship between the accounting firms and their clients (Cheng et al., 2009;
Cory & Huttenhoff 2011; Kalui & Mbakaya 2014). Last but not least,
developments in technology have led to the automation of traditional
accounting services and the creation of new service lines such as advisory
services (Ackerman 2017a, 2017b; King & Fitzgerald 2016).
In such today’s changeful and competitive business environment, the
researchers emphasize that enhancing customer satisfaction and loyalty plays a
significant role in having long-term relationships with clients, keeping business
surviving, and achieving success (Aga & Safakli 2007; Arokiasamy 2013; Ismail
et al. 2006; Nuchsarapringviriya & Fadzil 2015). Because loyal and satisfied
clients will have the willingness to deal with the firm over time, as well as they
will have the willingness to buy other services from the same firm, and lastly
they will attract new customers (General Accounting Officer [GAO] 2003;
Gilmore 2003; Prus & Brandt 1995).
The quality of service has been examined as one of the factors that may have a
direct and indirect impact on client satisfaction and loyalty by researchers in
different industries. They have proposed that enhancing the quality of services
will enhance customer satisfaction and loyalty, in turn, that enables the service
provider to meet the changes and challenges (Aga & Safakli 2007; Carrillat et
al. 2009; Dahlgaard-Park 2015; Kranias & Bourlessa 2013).
Researchers have based their studies on the subjective perception of the
quality as key approach to gain a deep understanding of measuring and
managing the quality of service (Parasuraman et al. 1988; Wetzels et al. 2000).
According to Zeithaml & Bitner, the quality of service is” a focused evaluation
that reflects the customer's perception of specific dimensions of service:
reliability, responsiveness, assurance, empathy, tangibles” (2003, p. 85). This
implies that the assessment of quality depends on the clients’ perceptions of
service quality’s dimensions. Accordingly, the businesses have to listen to the
customer’s voice and concentrate their efforts and resources to improve client-
driven quality in order to satisfy clients’ demands for the quality. Hence,
providing better service quality will increase the clients’ benefits, and enhance
the success of the service provider (Arokiasamy 2013; Bean et al. 1996;
Batagan et al. 2009; Parasuraman et al. 1988; Prus & Brandt 1995).
Considering that, providing high-quality services seems to be an essential and
prerequisite element for success. Researchers emphasize the importance of
4
evaluating services quality and its relationship with customer satisfaction and
customer loyalty in different industries and over time to determine their
changes and trends, and to provide the service providers with indicators to
determine the priority actions and decisions they should implement to enhance
the quality and settle major service problems (Caruana 2002; Dahlgaard-Park
2015; Ismail et al. 2006; Parasuraman et al. 1988). In line with this, this study is
considered as a first contribution and attempt to assess the services quality
dimensions of the accounting firms in Sweden based on the perception of
Swedish listed companies.
1.3. Aim
According to the above, the research aims to assess the quality of the
accounting service and its dimensions based on the perceptions of Swedish
listed companies as customers of accounting firms. Also, the study seeks to
examine the influence of quality and its dimensions on customer satisfaction
and customer loyalty.
In order to provide the management of accounting firms in Sweden with
indicators that allow them to invest their efforts and resources to enhance the
dimensions of quality and relationships with customers, and to meet changes
and challenges.
Accordingly, the thesis raises the following research questions:
-What are the levels of service quality dimensions provided by accounting firms based on the perception of Swedish listed companies?
-What are the direct impacts of service quality provided by accounting firms and its dimensions on the customer satisfaction based on the perception of Swedish listed companies?
-What are the direct impacts of service quality provided by accounting firms and its dimensions on the customer loyalty based on the perception of Swedish listed companies?
1.4. Outline of the thesis
This research project consists of six chapters, as follows:
Chapter one presents the background, problem discussion, the aim and the
research questions have been raised.
Chapter two presents the relevant literature and theory that covers the subject
of research and the basic concepts in the thesis.
5
Chapter three presents the research method has been used, as well as
describes other elements of the research design in line with collected data and
research goal.
Chapter four displays the findings of the empirical data that has been
collected from 58 respondents. Where the analysis has been conducted based
on regression analysis, the construct validity based on correlation analysis, and
the internal reliability based on Cronbach’s alpha test.
Chapter five discusses and explains the statistical findings that have been
presented in the result section and the outcome of hypotheses testing in the
light of the theory that has been presented in theoretical framework chapter.
Chapter six displays the conclusion of the research project, in addition to the
expected managerial implications, and finally the limitations and suggested
research for further reflection.
6
2. Theoretical framework
This chapter presents the relevant literature that covers the subject of
research and the basic concepts in the thesis, in order to construct a
relevant and solid foundation for the discussion in the following chapters.
2.1. The importance of service quality
Changes and challenges in the business world today such as financial scandals
and collapses, increasing competition, and advanced technology, have
emphasized the importance of service quality in accounting industry (Aga &
Safakli 2007; GAO 2003; King & Fitzgerald 2016; Zaman Groff &
Štumberger 2015). According to previous studies, high quality may lead to
increase the customer satisfaction and loyalty. As a result, that leads to increase
positive impacts such as getting the chance to supply the emerging needs of
clients, and decrease the negative impacts of changes and challenges (Gilmore
2003; Parasuraman et al. 1988).
2.1.1. Financial scandals and collapses
Quality of service plays a critical role in establishing and supporting customer
confidence (Wetzels et al. 2000). In recent decades, many financial collapse
and scandals have occurred in the business world such as WorldCom, Enron,
and Andersen LLP. The audit failure has been referred to as one of the main
reasons (Cheng et al. 2009; Cory & Huttenhoff 2011; Kalui & Mbakaya 2014;
Zaman Groff & Štumberger 2015). For instance, Andersen LLP was one of
the big five accounting firms and had been blamed for corporate frauds and
failures that caused the Enron’s collapse. Because of that, Andersen had gone
out of the business world, and now there is only big 4 instead of big 5 (Cheng
et al. 2009; Kalui & Mbakaya 2014). These collapses have emphasized the need
for a high-quality accounting service, and a close attention has been paid to
explore various factors that may have impacts on the audit quality (Kalui &
Mbakaya 2014). The performance and competency of accounting firm’s staff
are considered the most important factor in the service quality (Cheng et al.
2009; Morris & Empson 1998; Wetzels et al. 2000). Moreover, the clients’
perception of the service employees’ performance and competency is as an
essential component of the service quality measurement models like
SERVPERF (Wetzels et al. 2000). Therefore, accounting firms should be sure
that their staff is qualified, have the requisite skills and professional
characteristics to perform their job according to lawful requirements,
7
standards, and public's anticipation, hence ensure high-quality services (Cheng
et al. 2009; Morris & Empson 1998). Furthermore, the clients’ perception of
reliability and assurance form fundamental components of quality’s
measurement models, where items like achievements on time, accurate
records, the employees’ competence and knowledge, and enhancing trust plays
a significant role in the quality evaluation process (Parasuraman et al. 1988,
Cronin & Taylor 1992). According to previous studies, financial collapses have
highlighted the necessary need to improve service quality of accounting firms,
specifically, bridging the shortage of staff competencies and professional
characteristics (Cheng et al. 2009; Kalui & Mbakaya 2014; Wetzels et al. 2000).
2.1.2. Highly competitive market
The competition has increased in today’s markets (Aga & Safakli 2007;
Gilmore 2003). Increased competition has led many service companies to look
for profitable ways to distinguish themselves. One of the strategies associated
with the success of these companies is the provision of superior quality of
service (Aga & Safakli 2007; Parasuraman et al. 1988). According to
Dahlgaard-Park (2015) improving the quality of service assists organization to
get a competitive advantage and meet the clients' demands. That means the
positive assessment of service quality stimulates customers in preferring the
service providers (Wetzels et al. 2000). Therefore, if the service provider wants
to be distinctive and competes effectively he has to provide a distinctive
quality of services (Dahlgaard-Park 2015). Additionally, when the service
providers supply almost similar or identical services such as in the case in the
accounting firms, where the firms follow the same accounting rules and
standard, the quality of service will be a crucial factor to be distinctive from
others, hence maintaining the current clients and attracting new customers
(Parasuraman et al. 1988; Saxby et al., 2004; Jasinskas et al. 2016). Realizing the
role of service quality in the competitive market has encouraged the
researchers and practitioners to make repeated efforts in order to understand
the quality of service and the requirements of clients in view to enhance the
level of service quality. Consequently, a high quality of service increases the
firm's possibility to win a higher market share, satisfy the clients' demands,
enable the firm to get and retain competitive advantage, and increase the
profitability (Cronin & Taylor 1992; Dahlgaard-Park 2015).
8
2.1.3. Rapidly developing technologies
The rapidly development of technology has affected the accounting industry.
It has changed the type of provided services and the role of accounting
(Ackerman 2017a, 2017b; King & Fitzgerald 2016). The traditional and routine
accounting tasks as gathering and processing data have been automated. In
contrast, other service lines are growing gradually, specifically advisory services
like technology consulting and advanced financial planning (Ackerman 2017a,
2017b; King & Fitzgerald 2016).However, this change creates a challenge for
the accounting firms to maintain the relationship with their clients and to be
the chosen service provider for these other emerging services and needs by the
client. As a reaction to this challenge, Prus and Brandt (1995) refer that, the
satisfied and loyal clients usually have the willingness to increase and expand
their business with the current service provider through purchasing other
services. In addition, the U.S. Government Accountability Office mentions
that there is a high opportunity that the satisfied clients will use other services
and non-auditing services from the same accounting firm (GAO 2003).
Further, according to previous studies, service quality has a positive impact on
clients’ satisfaction and loyalty (Gilmore 2003; Ismail et al. 2006; Jasinskas et
al. 2016). Therefore, the businesses need to implement strategies that improve
the quality of services in order to enhance the clients’ satisfaction and loyalty
to boost the likelihood of expanding businesses with current clients and
provide them with new trends of accounting services (GAO 2003; Gilmore
2003; Prus & Brandt 1995; Wetzels et al. 2000).
2.2. Service quality concept
The service quality is one of the key components in any industry in today’s
highly competitive markets (Chumpitaz Caceres & Paparoidamis 2007; Aga &
Safakli 2007; Reheul et al. 2013). It is considered as a strategic instrument to
improve the business performance and to achieve the operational efficiency
(Jain & Gupta 2004; Kranias & Bourlessa 2013).
Primarily, quality of services has been evolved in the service marketing and has
often been used in other research fields and in different business sectors
(Caruana 2002; Dahlgaard-Park 2015). However, there is no consensus among
researchers about the quality’s definition, whether the quality should be
excellent or just should meet the specifications. That makes the task of
defining, measuring and managing service quality complicated (Dahlgaard-
Park 2015; Gilmore2003). Generally, there are two major aspects concerning
9
the definition of service quality. First, the objective or mechanistic quality
aspect which is determined based on the characteristics of the product as an
independent objective fact regardless the clients' perspective, and according to
this aspect, the quality of the product should meet certain specifications
(Holbrook & Corfman1985; Parasuraman et al. 1988; Smart 1995). Second, the
subjective, humanistic or perceived quality aspect which is determined based
on clients’ subjective judgment and their perception of the quality. Thus, it is a
measurement to which extent the level of the provided service satisfies the
client's requirement and expectation (Batagan et al. 2009; Cronin & Taylor
1992; Smart 1995; Parasuraman et al. 1988). This thesis is conducted based on
the perceived quality perspective in line with this definition: “service quality is
a focused evaluation that reflects the customer's perception of specific
dimensions of service: reliability, responsiveness, assurance, empathy,
tangibles” (Zeithaml & Bitner 2003, p. 85).
2.3. Service quality models
Researchers have suggested and used various models in order to measure the
quality of service based on the client perspective (Bearden & Netemeyer 2011;
Ismail 2006). Some researchers consider that the quality of service is a
measurement based on the clients' perception of the actual service only, others
believe it is a measurement based on the clients' expectations only, whereas
others claim it is the gap or difference between clients' expectation and the
perception they had from the actual service. In general, all the previous
perspectives agree that the quality is measured and determined by the
customers or the users of the services (Cronin & Taylor 1992; Parasuraman &
Zeithaml 2002)
SERVQUAL by Parasuraman et al. (1988, 1991), and SERVPERF by Cronin
and Taylor (1992) are the most common models for measuring quality and
have been used by a lot of researchers (Dahlgaard-Park 2015; Parasuraman&
Zeithaml 2002). Both are multi-dimension models and they assess service
quality based on five dimensions or attributes: reliability, assurance, tangibility,
empathy, and responsiveness (Cronin & Taylor 1992; Parasuraman et al. 1988,
1991; Reheul et al. 2013). However, according to the SERVQUAL paradigm,
the service quality is the variance or the gap between the clients’ expectations
and the actual perceived performance of the service. In contrast, SERVPERF
model considers the perception of actual performance only to assess and
measure the service quality (Cronin and Taylor 1992; Parasuraman et al. 1988,
1991).
10
In order to get a thorough understanding of the chosen model in this thesis
SERVPERF model, the study will demonstrate both models because
SERVPERF has been structured based on the SERVQUAL model.
2.3.1. SERVQUAL model
SERVQUAL is a common and a widely used model and has been refined
through many stages, statistical examinations, and empirical studies.
Particularly; SERVQUAL model is the result of comprehensive research
conducted in various sectors and industries such as credit cards, retail banking,
appliance maintenance, and securities brokerage (Bearden & Netemeyer 2011;
Parasuraman & Zeithaml 2002)
It measures the expectation of the clients towards service quality and the
clients’ perception of the actual or real performance of quality in order to
evaluate the service quality by comparing between the clients’ expectations and
perceptions (Gilmore 2003; Wetzels et al. 2000). Hence, according to this
paradigm, the service quality is “the discrepancy between consumers’
perception of service offered by a particular firm and their expectations about
firms offering such services” (Parasuraman et al. 1988, p. 14).
SERVQUAL is a multiple-item scale depends on two corresponding lists of 22
items which represent the different aspects of the five dimensions of the
service quality (Bearden& Netemeyer 2011; Parasuraman et al. 1991). Each
item or element was reformulated in two statements, one for measuring the
expectations towards the companies within the service sector that are being
examined, and the other statements for measuring perceptions about a
selected company's service quality. Thus, SERVQUAL uses 44 statements,
where a half of them examine the expectations part of the model, and the
other half examines the perceived performance (Bearden & Netemeyer 2011;
Parasuraman & Zeithaml 2002).
2.3.2. SERVPERF model
Researchers have criticized the expectations section of SERVQUAL model
and argued that there is no need to use expectation and perception sections
together because that makes the process complicated, and confusing (Cronin
& Taylor 1992; Reheul et al. 2013). Where some researchers refer to the
variance between the two sections as confirmation or satisfaction, and most of
the clients usually use only one of them in the assessment process. Also, they
have argued that some studies show that the clients’ expectations become less
11
over time, in turn, that will reflect as an increase in the quality, even though it
is not an actual or real improvement in quality (Cronin & Taylor 1992;
Dahlgaard-Park 2015). Furthermore, Parasuraman et al. (1991) have amended
the items that measure expectations part, because they have noticed that the
respondents’ expectations were unrealistic and normative.
Therefore, SERVPERF has been suggested as a model relies only on
perceived service performance section to assess the quality (Dahlgaard-Park
2015; Jain & Gupta 2004). This implies that it takes into account the overall
assessment of perceived quality rather than relying on variance (Cronin &
Taylor 1992; Jain & Gupta 2004). In addition, it is a multi-sector scale and
many researchers have recommended it (Reheul et al. 2013), and used it in
different sectors such as Saxby et al. (2004) and Reheul et al. (2013) in the
accounting industry and Jasinskas et al. (2016) in the hotels' sector. Hence, that
enhances its capability as a common scale in different industries.
Additionally, it is worth to mention, that using a long questionnaire may affect
negatively the response rate (Gray 2017). As a result, this study will utilize
SERVPREF model, which is a performance-based measure consists of 22
statements rather than 44 spread into five dimensions to measure the
perceived quality of services provided by accounting firms(see appendix)
(Bearden & Netemeyer 2011; Jain & Gupta 2004).
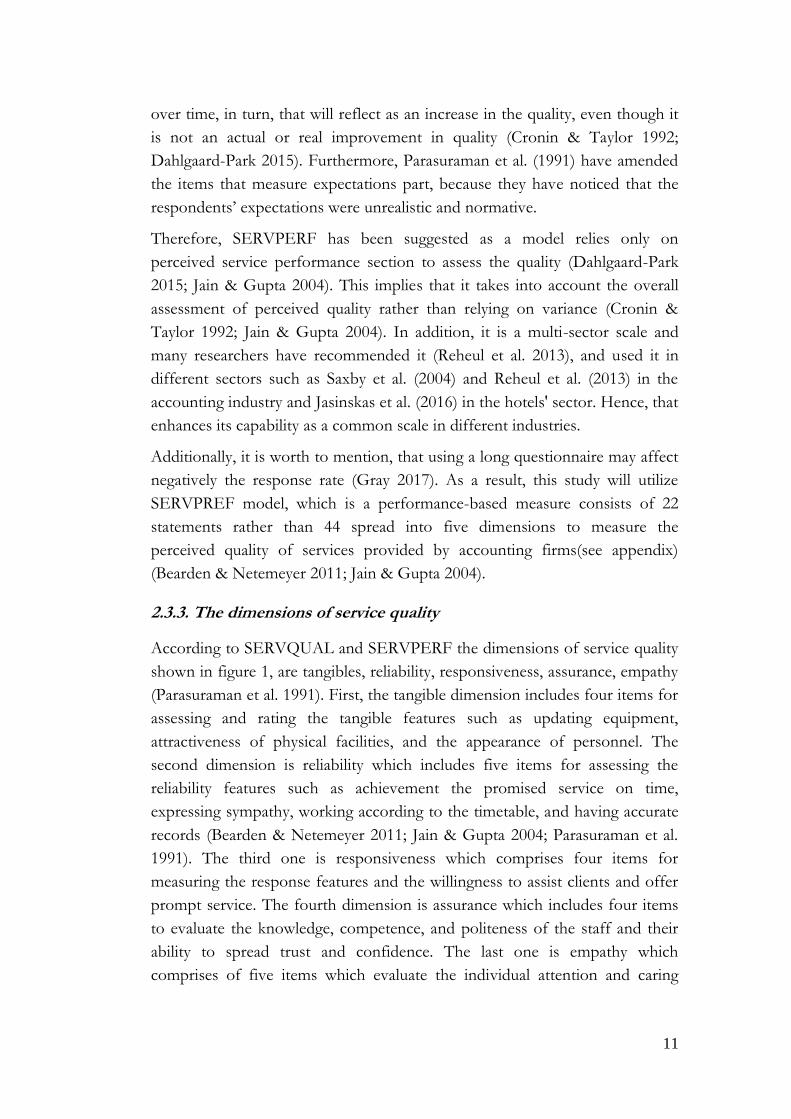
2.3.3. The dimensions of service quality
According to SERVQUAL and SERVPERF the dimensions of service quality
shown in figure 1, are tangibles, reliability, responsiveness, assurance, empathy
(Parasuraman et al. 1991). First, the tangible dimension includes four items for
assessing and rating the tangible features such as updating equipment,
attractiveness of physical facilities, and the appearance of personnel. The
second dimension is reliability which includes five items for assessing the
reliability features such as achievement the promised service on time,
expressing sympathy, working according to the timetable, and having accurate
records (Bearden & Netemeyer 2011; Jain & Gupta 2004; Parasuraman et al.
1991). The third one is responsiveness which comprises four items for
measuring the response features and the willingness to assist clients and offer
prompt service. The fourth dimension is assurance which includes four items
to evaluate the knowledge, competence, and politeness of the staff and their
ability to spread trust and confidence. The last one is empathy which
comprises of five items which evaluate the individual attention and caring
12
towards clients and their needs (Bearden& Netemeyer 2011; Jain& Gupta
2004; Parasuraman et al. 1991).
Figure 1: Conceptual model of quality according to SEVQUAL & SERPERF
The source: The model has been established based on (Parasuraman et al. 1991)
2.4. Customer loyalty
Customer loyalty is the core factor that helps to develop a sustainable
competitive advantage in business service (Gremler & Brown 1996; Wetzels et
al. 2000), and it has an increasingly important role in the highly competitive
markets (Richard & Zhang 2012). Generally, researchers agree that loyalty is a
complex construction (Ismail et al. 2006). Oliver defines loyalty as “a deeply
held commitment to re-buy or re-patronize a preferred product or service
consistently in the future, thereby causing repetitive same brand or same brand
set purchasing, despite situational influences and marketing efforts having the
potential to cause switching behavior” (Oliver 1999, p. 34). Further, loyalty
has two aspects or components. First, the attitudinal loyalty expresses the
emotional relationship between customers and company. Second, behavioral
loyalty reflects the actual action of repurchasing frequently from the same
company over time (Bandyopadhyay & Martel 2007; Richard & Zhang 2012;
Oliver 1991; Prus & Brandt 1995). In addition, based on reasoned action
theory, the attitudinal loyalty precedes and stimulates behavioral loyalty.
Therefore, many researchers have focused on the attitudinal side of loyalty
(Bandyopadhyay & Martel 2007; Davari & Strutton 2014; Richard & Zhang
2012; Oliver 1991).
13
Further, the loyal customers are very valuable. They commit to deal repeatedly
and frequently with the company, they recommend the company and its
products to others, they have the willingness to purchase other services from
the same firm, and they have a strong and long relationship with the supplier
over time (GAO 2003; Prus & Brandt 1995; Smith 2011; Speer 1996; Wetzels
et al. 2000). Consequently, the loyalty leads to a sustainable and long-term
relationship between the company and their clients and improves company's
financial performance. Therefore, it is very important to enhance the factors
that increase loyalty among customers (Mohd-Sanusi et al. 2012; Prus &
Brandt 1995; Wetzels et al. 2000).
According to prior studies, service quality is considered one of the factors that
have an impact on customer loyalty directly or indirectly (Bloemer et al. 1999;
Carrillat et al. 2009; Dahlgaard-Park 2015; Jasinskas et al. 2016; Kranias &
Bourlessa 2013; Mohd-Sanusi et al. 2012; Yildiz 2017). Consequently,
enhancing service quality may lead to enhance customer loyalty. This thesis
will test the positive direct impact of service quality on the customer loyalty.
Further, in order to evaluate customer loyalty, the thesis uses an evaluated
scale (see appendix). That has been applied in a prior study by Ismail et al.
(2006). This scale based on four key elements: talking positively about the
accounting firms, the willingness to deal with the company in the future,
inducing others to buy the services provided by the accounting firm and the
ability of the accounting firm to offer the best services (Ismail et al. 2006;
Zeithaml et al. 1996).
2.5. Customer satisfaction
Customer satisfaction is a key factor in achieving corporate goals (Anderson &
Fornell 2000; Gilmore 2003). It is an important indicator of the company's
financial future. That customer satisfaction leads to constant and growing sales
and profits, as well attract new customers. Therefore companies regard
customer satisfaction as a paramount element of survival and continuity
(Anderson & Fornell 2000; Ruth 2015).
Further, according to many researchers, quality of service is considered as a
precedent factor for client satisfaction and may affect it positively. That
implies the satisfaction of clients will increase by improving the quality of
service (Dahlgaard-Park 2015; GAO 2003; Gilmore 2003). Also, the service
quality and customer satisfaction are different and distinctive structures
(Parasuraman et al. 1988; Cronin & Taylor 1992; Oliver 1980). According to
14
Zeithaml & Bitner service quality is “a focused evaluation that reflects the
customer's perception of specific dimensions of service: reliability,
responsiveness, assurance, empathy, tangibles.”, whereas, “satisfaction, on
another hand, is more inclusive: it is influenced by perceptions of service
quality, product quality, and price as well as situational factors and personal
factors” (2003, p. 85). Likewise, Customer satisfaction and customer loyalty
are considered distinctive concepts (Oliver 1999; Prus and Brandt 1995; Story
& Hess 2006). It is not necessary that the satisfied customer will be a loyal
customer (Oliver 1999; Prus and Brandt 1995; Story & Hess 2006). This
means that the satisfied current customers may not deal with the company in
the future, where some of them remain loyal while others do not (Oliver 1999;
Prus and Brandt 1995; Story & Hess 2006). Accordingly, quality of service,
client satisfaction, and client loyalty are distinctive concepts (Dahlgaard-Park
2015; Ismail 2006). Practically, the study utilizes an indicator that has been
used in a prior study to assess the overall client satisfaction to accounting firms
by Ismail et al. (2006).
2.6. Previous studies and hypotheses formulation
This section sheds light on previous studies. As well, the research displays two
hypotheses groups. The first hypotheses group regarding the impact of service
quality and its dimensions on customer satisfaction. The second hypotheses
group concerning the impact of service quality and its dimensions on
customer loyalty.
2.6.1 Previous studies
Generally, in order to detect the complex setup of service marketing,
researchers have studied the various factors and their direct and indirect
relationships such as service quality, confirmation, customer satisfaction, trust,
commitment, purchase intention, word of mouth, customer loyalty, etc., with
the purpose of enabling service managers to utilize control, and manage these
variables and their relationships better (Chumpitaz Caceres & Paparoidamis
2007; Hidayat et al. 2015; Smith 2011; Wetzels et al. 2000; Yildiz 2017).
More specifically, the request for high-quality accounting services has
constantly increased to meet changes and challenges and to achieve success in
today’s business environment (Cory & Huttenhoff 2011; Kranias & Bourlessa
2013; Zaman Groff & Štumberger 2015). Along with this, the relationship
between service quality and client loyalty and/or satisfaction has attracted the
15
attention of many researchers and practitioners (Lewis 1989; Reheul et al.
2013).
According to prior studies, improving service quality may have a direct or
indirect influence on client satisfaction and client loyalty (Carrillat et al. 2009;
Kranias & Bourlessa 2013; Wetzels et al. 2000). Concerning the indirect
relationship, many researchers have studied the role of customer satisfaction as
one of the mediators in the relationship between service quality and client
loyalty such as Ismail et al. (2006) and Caruana (2002). In contrast, other
researchers have studied the direct relationship between the concepts service
quality- client loyalty such as Bloemer et al. (1999), Cronin & Taylor (1992)
Jasinskas et al. (2016), and Kranias & Bourlessa (2013), as well as service
quality- client satisfaction such as Saxby et al. (2004) and Aga & Safakli (2007).
In addition, those studies have been conducted in various fields and industries
(Gilmore 2003), for instance, in hotels sector Jasinskas et al. (2016), banking
sector Arokiasamy (2013) and Caruana( 2002), cargo companies Yildiz (2017),
sharing economy Priporas et al. (2017) and in accounting industry Ismail et al.
(2006) and Reheul et al. (2013). Also, the studies have got different results
regarding the significance of the relationship between service quality and other
concepts in different research fields and countries. However, in general, the
overall result is positive. Further, the researchers emphasize the need to
examine the influence of quality on the client satisfaction and loyalty in various
industries and over the years to identify changes and direction (Dahlgaard-
Park 2015; Gilmore 2003; Parasuraman & Zeithaml 2002).
2.6.2. Formulation of hypotheses
In line with what has been mentioned above. This research depending on the
accountancy and service marketing literature seeks to evaluate the perceived
quality dimensions of all services provided by accounting firms based on their
clients’ perceptions at Nasdaq Stockholm. Besides, it seeks to examine the
direct impact of quality and its dimensions on the customer satisfaction and
customer loyalty separately.
As stated by Gray (2017), it is essential to set hypotheses in quantitative
studies to examine the relationship between variables. Therefore, this research
tests two hypotheses groups. The first hypotheses group regarding the impact
of service quality and its dimensions on customer satisfaction, figure2. The
second hypotheses group concerning the impact of service quality and its
dimensions on customer loyalty, figure 3.
16
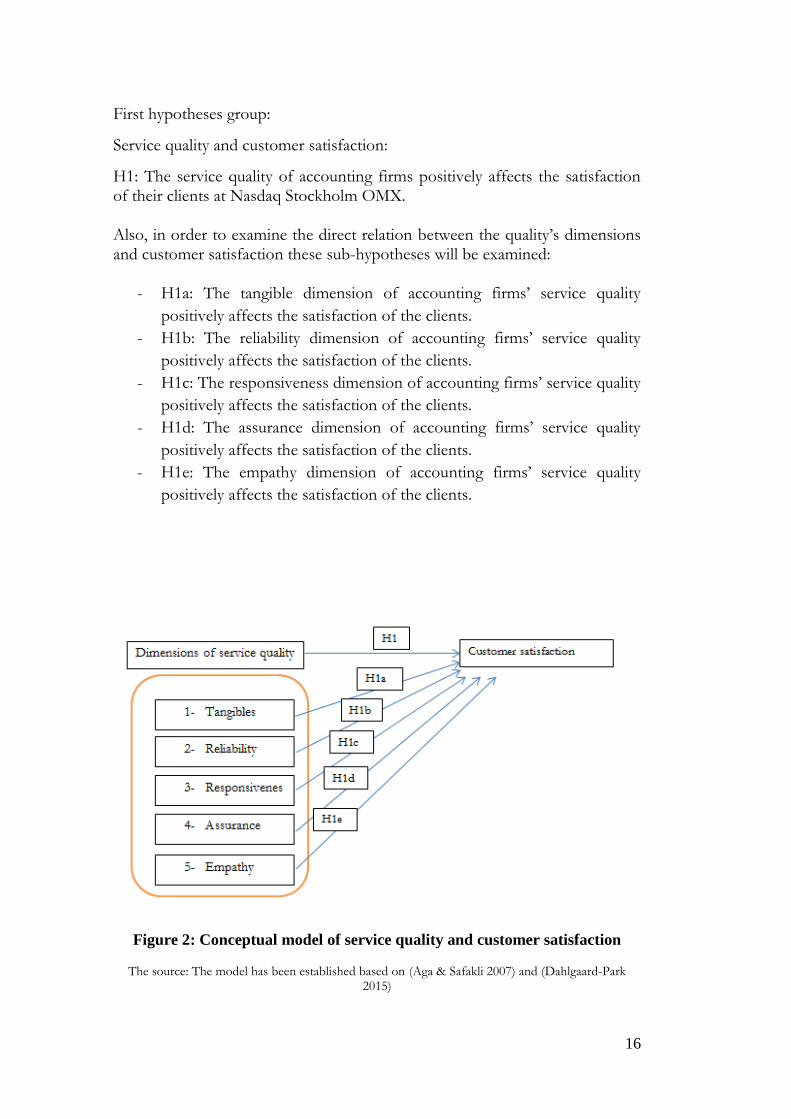
First hypotheses group:
Service quality and customer satisfaction:
H1: The service quality of accounting firms positively affects the satisfaction of their clients at Nasdaq Stockholm OMX. Also, in order to examine the direct relation between the quality’s dimensions and customer satisfaction these sub-hypotheses will be examined:
- H1a: The tangible dimension of accounting firms’ service quality
positively affects the satisfaction of the clients.
- H1b: The reliability dimension of accounting firms’ service quality
positively affects the satisfaction of the clients.
- H1c: The responsiveness dimension of accounting firms’ service quality
positively affects the satisfaction of the clients.
- H1d: The assurance dimension of accounting firms’ service quality
positively affects the satisfaction of the clients.
- H1e: The empathy dimension of accounting firms’ service quality
positively affects the satisfaction of the clients.
Figure 2: Conceptual model of service quality and customer satisfaction
The source: The model has been established based on (Aga & Safakli 2007) and (Dahlgaard-Park 2015)
17
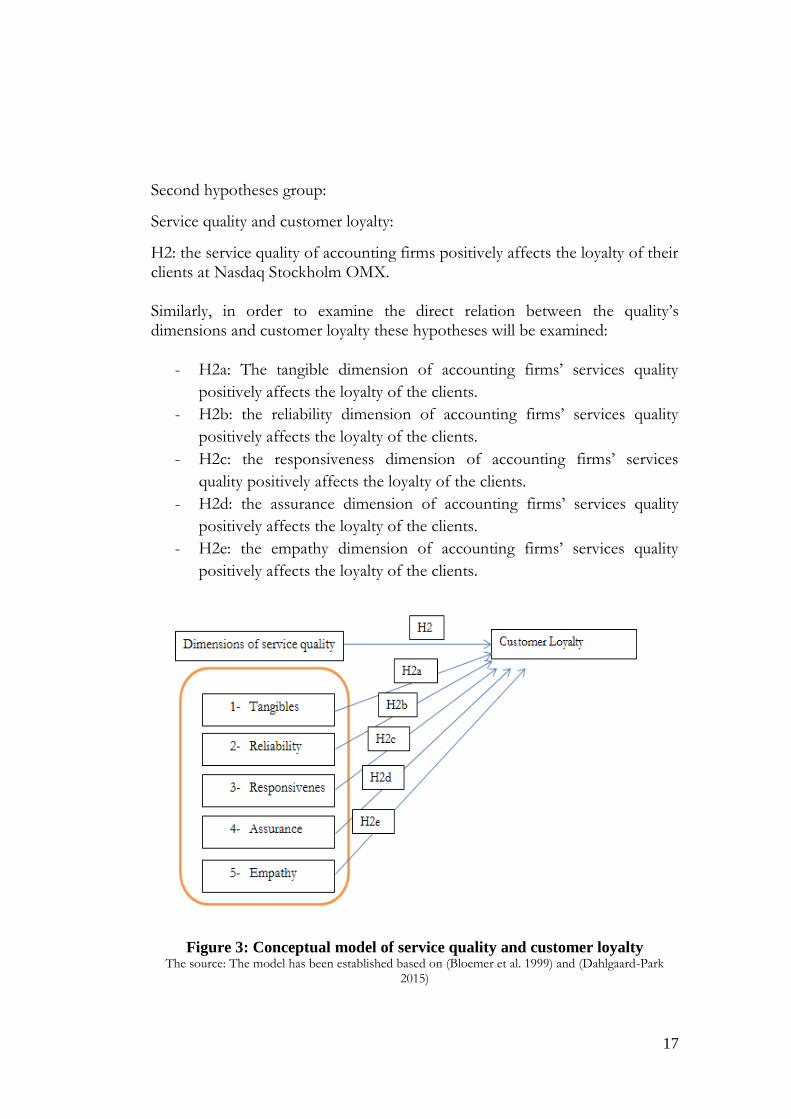
Second hypotheses group:
Service quality and customer loyalty:
H2: the service quality of accounting firms positively affects the loyalty of their clients at Nasdaq Stockholm OMX. Similarly, in order to examine the direct relation between the quality’s dimensions and customer loyalty these hypotheses will be examined:
- H2a: The tangible dimension of accounting firms’ services quality
positively affects the loyalty of the clients.
- H2b: the reliability dimension of accounting firms’ services quality
positively affects the loyalty of the clients.
- H2c: the responsiveness dimension of accounting firms’ services
quality positively affects the loyalty of the clients.
- H2d: the assurance dimension of accounting firms’ services quality
positively affects the loyalty of the clients.
- H2e: the empathy dimension of accounting firms’ services quality
positively affects the loyalty of the clients.
Figure 3: Conceptual model of service quality and customer loyalty The source: The model has been established based on (Bloemer et al. 1999) and (Dahlgaard-Park
2015)
18
3. Methodology
This chapter presents the research method and approach that have been
used, as well as describes other elements of the research design as the
operational definition, collection methods, population and sampling and
lastly the research quality and ethical considerations. Further, the research
will compute the results by using SPSS program.
3.1. Research approach
According to Gray (2017), the chosen research approach should be
appropriate to attain the study’s aim. Thus, based on the aim of the study, the
researcher can adopt a deductive or inductive approach. If the aim of the study
is to examine and explain the relationship between concepts in order to test
existent theories or hypotheses then the deductive approach will be
appropriate. In contrast, if the aim of the research is to construct and generate
a new theory, then inductive approach will be appropriate. Accordingly, in the
deductive approach, the theoretical perspective will be determined before
conducting the study. In contrast, in the inductive approach, the research may
begin with gathering and analyze data, and then the theory will be created
based on the data after undertaking the study (Bryman & Bell 2015; Gray
2017; Saunders et al. 2011).
This research seeks to test existent hypotheses or theories concerning the
relationship between different concepts or variables. Therefore the deductive
approach will be the most suitable approach. Generally, the process of
deductive approach follows many steps. Firstly, the researcher has to
determine the theories and underlying concepts that are most suitable to the
aim of the study and the testing hypothesis. Then, in order to observe the
underlying concepts and control them, the study has to operationalize them or
make them measurable by creating the indicators or variables that measure
them. Lastly, testing the hypothesis through comparing the empirical or
collecting data with the theory in order to confirm or reject the hypothesis
(Gray 2017; Saunders et al. 2011).
Furthermore, this study is classified as an explanatory study according to its
purpose. That, it has been conducted in order to explain the relationship and
its direction between variables (Collis & Hussey 2013; Gray 2017), quality of
service as an independent variable in one hand, and customer satisfaction and
loyalty as dependent variables on the other hand. Consequently, this research
will adopt a deductive approach with explanatory purpose.
19
3.2. Research Method
One of the most important points in the business research design is selecting
the method of the study, whether it will be a quantitative, qualitative or mixed
study because that will affect the choice of data collecting and analysis
methods (Bryman & Bell 2015; Gray 2017).
The quantitative and qualitative methods have many different aspects in
approaching the research process. First, concerning the focus of the research,
commonly the quantitative research seeks deductively to test and verify an
existent theory, through exploring the relationship between the concepts that
form the theory in order to support or reject it. In contrast, the qualitative
research seeks inductively to construct a theory based on the collecting data of
the study. Second, with regard to researcher engagement in the study, typically
in the quantitative study, there is a space between the researcher and the
researched subject settings, where the tools used to collect data does not
require an intensive direct contact with the participants and the field under
researching. While the qualitative research, generally, requires a deep direct
involvement with the respondents and the studying field in order to gain a
deep understanding of the subject. Third, with regard to the scope of findings
and the nature of data, the quantitative study collects and analyzes numerical
data that measures the concepts of the theory and seeks to generalize the
findings. Whereas in the qualitative research the type of data is more various,
however, it uses and handles generally textual data in view to get an in-depth
insight of the researched subject (Bryman & Bell 2015; Gray 2017; Saunders et
al. 2011).
In general, quantitative research aims to quantify the concepts that form the
current theory and examine the relationship between them in order to confirm
the suggested hypothesis or refuse it with the aim of generalizing the findings.
In contrast, the qualitative research aims to gain an in-depth insight of specific
case through collecting almost textual data to establish a theory based on the
collecting data (Bryman & Bell 2015; Gray 2017). Consequently, this research
aims to examine and explain the relationship between the services quality
provided by accounting firms on one hand, and the clients’ satisfaction and
loyalty on the other hand. In other words, the thesis examines the influence
and the relationship between numeral variables. As a result, the study adopts a
quantitative method to achieve that.
20
3.3. Data Source
There are two types of data according to their source, primary data, and
secondary data. The classification of data depends on the relationship between
the data and the researcher. If the data has been gathered specifically for
attaining the purpose of the research project by the researchers who undertake
the study then the data type will be considered primary. In contrast, if the data
has been gathered by external or other researchers who do not share in the
research then the data type is considered secondary. In other words, the
secondary data is an existed and available data that has been produced by
external researchers (Collis & Hussey 2013; Easterby-Smith et al. 2012; Gray
2017). With regard to the secondary data, the study has used peer-reviewed,
scientific relevant literature, journals and articles to construct and support the
theoretical framework of the research project. As well, to obtain primary data,
the study has to adopt one or more of data gathering methods such as
questionnaires, focus groups, or semi-structured interviews to gather the data
related to the variables or concepts of the research project (Collis & Hussey
2013; Easterby-Smith et al. 2012; Gray 2017).
3.4. Operationalization and measurement
The researcher has to operationalize the hypothesis before choosing the
research instrument (Bryman & Bell 2015; Gray 2017). According to Gray
(2017, p. 144), the operationalization or the operational definition is “A
concise statement that assigns meaning to a constructor variable by specifying
the activities necessary to measure it”. Therefore, it is essential to determine
the main variables that express the hypothesis in operational terms. The
operational definition shows what should be measured. Simply put,
determination the key variables that will be measured to examine the
hypothesis (Atkinson 2012; Gray 2017; Saunders et al. 2011).
Accordingly, the study will make use of three key variables to test the
hypotheses. These variables are quality of service as an independent variable in
one hand, and customer satisfaction and loyalty as dependent variables on the
other hand. As well the study will use five sub-variables to measure quality’s
dimensions (see appendix). Besides, the researcher will utilize a seven-point
Likert scale to measure these variables.
21
3.5. Pretesting
The researchers emphasize the importance of implementing a pre-test or a
pilot test before conducting the actual survey to ensure that the items are
understood and eliminate errors in order to enhance reliability and validity at
this stage (Atkinson 2012; Lavrakas 2008). In addition, pre-testing provides the
study with suggestions for improving the questionnaire, redrafting unclear
questions, deleting similarly asked questions, and determining the actual
response time of the survey (Atkinson 2012; Lavrakas 2008). Consequently,
before administrating the actual survey, the survey has been revised and
discussed with professor supervisor, other professors and colleagues. Finally,
the survey has been pretested by sending the survey to a limited number of the
respondents (15) in order to get any suggestions and improve it.
3.6. Data collection methods
Collecting data is the main stage of the research process. Nothing can be
succeeded without using a reliable and valid data gathering tool. Generally,
there are many techniques to collect data like questionnaire, observation, and
interview. The chosen data collecting instrument has to fit for the aim of the
study (Bryman & Bell 2015; Collis & Hussey 2013; Gray 2017).
For instance, if the research seeks to gain deep insight or the opinions of a
limited group of participants, an interview schedule will be appropriate for this
case. While, in the case of evaluating and measuring variables and exam the
relationships between them, and using standardized questions with large
number relatively of participants the survey questionnaire will be the most
proper instrument to collect data (Gray 2017; Saunders et al. 2011).
Additionally, the adopted research methodology, whether quantitative or
qualitative, plays a significant role in choosing the suitable tools for collecting
data. Generally, a survey questionnaire is the most used and suitable tool for
quantitative researchers. Also, the available time and budget should be taken
into consideration (Bryman & Bell 2015; Gray 2017).
Based on the above, this study will utilize the survey questionnaire as a tool to
collect data due to many reasons. First, this study has already adopted a
quantitative approach with an explanatory purpose in order to verify the
relationship between many variables. Second, the cost in the case of the
questionnaire is less relatively comparing with other tools with respect to
respondents’ number. Therefore, the survey questionnaire will be the best
22
instrument to gather the required data at reasonable cost and time (Brill 2008;
Bryman & Bell 2015; Gray 2017).
Survey Questionnaire:
As mentioned previously, the study will use the questionnaire as a tool to
collect the empirical data. The questionnaire is considered one of the most
popular techniques to collect primary data in quantitative researchers, where
the respondents are asked to answer a collection of the same predefined
questions (Atkinson 2012; Bryman & Bell 2015; Lavrakas 2008).
Using a valid and reliable data gathering tool is substantial to achieve
successful research. Consistent with this, the study makes use of existed
validated constructed scales (Atkinson 2012; Gray 2017; Saunders et al. 2011),
the SERVPERF model, which is a validated questionnaire to evaluate the
perceived quality by clients. Besides, the study will use a validated model
consists of indicators adapted from Ndubisi (2003) and Zeithaml et al.(1996)
and have been used by Ismail et al. (2006) to assess customer satisfaction and
customer loyalty in audit firms(Ismail et al. 2006).Essentially, it is better to
utilize validated existing scales than developing own scales because these scales
commonly have been used by many researchers, and have been evolved by
expert and specialized researchers who have verified the validity and the
reliability of them(Gray 2017; Saunders et al. 2011).
In addition, concerning the type of questionnaire, the questionnaires could be
paper-based questionnaire sent by post, or online or web-based questionnaire
which is considered an increasingly common method of undertaking surveys,
and powerful instrument especially in the case of large number of participants
(Gray 2017; Wolf 2008). Practically, the study will make use of Google form to
design and distribute online questionnaire. Consequently, as a measurement
instrument, the research will use an online questionnaire comprises of closed
rating questions with an ordinal Likert scale of seven points.
3.7. Population and Sampling
The targeted population in this thesis is the 582 Swedish listed companies at
Nasdaq Stockholm OMX, while the sample is 58 companies.
3.7.1. Identification the research’s population
The population is “a precisely defined body of people or objects under
consideration for statistical purposes” (Collis & Hussey 2013, p 62). This study
23
seeks to evaluate the quality of services provided by accounting firms and its
influence on the client’s satisfaction and loyalty. According to Gray (2017), the
study has to target the right participants. In addition, the clients or the
beneficiary are the best who can evaluate the quality of service (Batagan et al.
2009; Bean et al. 1996; Wetzels et al. 2000). Therefore, the 582 listed
companies at Nasdaq Stockholm OMX , in their capacity as clients of
accounting firms, have been chosen as the targeted population in order to test
the existent theories with respect to these three elements: common location
(Sweden), kind of service (all services provided by the accounting firms), and
time of the study (2018).
Concerning the information of the listed companies at Stockholm Stock
Exchange, the study has utilized Amadeus1 database as a secondary data
source, it provides overall information on the companies in Europe for
academic and educational purposes. Consequently, according to Amadeus
database, the population of this study is 582 companies. Furthermore, the
respondents have to be knowledgeable and able to answer the questions
(Bryman & Bill 2015; Lavrakas 2008). Therefore, the respondents will be the
employees who are in charge of dealing and engaging with auditing firms such
as the head or the employees in auditing and control, accounting, or finance
department.
3.7.2. Sampling
The careful sampling process of participants is one of the essential
components of any research project. It is the process of selecting a sample
from a population, where the population is all potential elements that are
included in the research, while the sample is the set of elements has been
chosen from the population by the researcher for conducting the study
(Easterby-Smith et al. 2012; Gray 2017; Guthrie 2010). The sampling process
is conducted due to different reasons like the large size of the population, the
limited resources available for undertaking the study with respect to the time
and cost. In order to have a representative sample the sample size and the
random selection play a key role. Firstly, the large size of the sample leads to
increased quality and the representativeness of the sample (Easterby-Smith et
al. 2012; Gray 2017; Guthrie 2010). Secondly, by applying the random
probability sampling process each unit in the population takes the same
opportunity to be in the chosen sample. Having representative sample is
1 Bureau van Dijk (2018). Amadeus. https://amadeus.bvdinfo.com [2018-02-28]
24
crucial in generalizing the outcomes of the study to the parent population
(Bryman & Bill 2015; Gray 2017).
3.7.3. Selecting the sample size
Many ways have been proposed to select the minimum size of the research
sample (Green 1991; Gray 2017). First, in general, the sample size should be
greater than 40 based on a statistical perspective (Byrne 2017). Further,
according to Easterby-Smith et al. (2012), 10% of the population is acceptable,
so the sample size in this study should range from 50 to 60. However, the
researcher has decided first to send the survey to 150, but because the
response rate was not enough the survey has been sent to 450 participants and
reminders have been sent also, in order to increase response rate and ensure
the statistical minimum of the answers which is 40, and reach to acceptable
size 50-60 (Byrne 2017; Easterby-Smith et al. 2012).
As a result, 58 companies have responded, and most of the respondents are
managers in auditing and control, accounting, or finance department, which
increase the quality of responses.
However, the response rate has been affected by various factors. Generally,
there have been many holidays during this time of year. Some participants also
sent e-mails apologizing for being unable to respond because they have many
duties and little time currently, and some of them actually help other students
in their theses. In addition, others do not want to share their own data.
3.7.4. The process of random selection
The random sample is a sample where its elements have been chosen
randomly from the population, where each of them has the same probability
to be in the selecting sample (Bryman & Bill 2015; Guthrie 2010). In order to
get a random sample or to select the members of the sample randomly, the
researcher can use statistical tables or a special program like Randomizer
program2 which has been used by this study (Gray 2017). Where, the
Randomizer program provides a list of the members that will form and
construct the random sample, after filling the setting of the population and
sample (Gray 2017).
2 Research Randomizer (2018). Randomizer. https://www.randomizer.org/ [2018-03-28]
25
3.8. Data analysis
The analytical approach should be selected at the designing stage of the study,
and it should be appropriate for the type of the collected data. Hence, the
initial step is selecting the type of data whether nominal, ordinal, interval or
ratio because it will affect the type of statistical tests and the analytical
approach (Gray 2017; Guthrie 2010). Accordingly, based on the purpose of
the scale, the study’s data type has been classified as an ordinal data, which is
the most suitable for the questions that rate the degree of agreement, quality,
or views, according to Gray (2017). Hence, it is compatible with the general
logic of the research project and the research instrument (Gray 2017).
3.8.1 Descriptive statistics
Descriptive statistics are used to describe and analyze the data from a
particular sample based on the frequency distribution method. The frequency
distribution method measures and provides statistical information about the
central tendency of the data and its dispersion such as the mean which
measures the average of responses, and the standard deviation which measures
the degree of responses’ spread around the average (Bryman & Bell 2015;
Gray 2017; Guthrie 2010).
The study will calculate the mean and standard deviation in order to determine
the situation of the five dimensions in the Swedish accounting firms according
to the participants, as well the customer satisfaction and loyalty. Further, the
study will use frequency table to calculate the cumulative percentage to the
responses which have low evaluation or less than 5 points.
3.8.2. Correlation analysis
Correlation analysis is used to describe and examine the relations between
variables. Generally, the strength of the association is determined according to
the value of the correlation coefficient. Also, the direction of this relationship
positive or negative is determined according to the sign of the correlation
coefficient (Gray 2017; Saunders et al. 2011). The value of correlation
coefficient (r) moves in the range between (+1, 0, -1) where +1 means there is
a perfect positive relationship; zero means there is no relationship, lastly -1
means there is a strong negative relationship(Gray 2017; Saunders et al. 2011).
Regardless the sign of the correlation coefficient, if its value is between (0.01 -
0, 29) the relation is small; if it is between (030- 0, 49) the relation is medium;
if it is between (0, 50- 1.00) the relation is large (Gray 2017).
26
The study will calculate the Pearson Correlation which is “A statistical formula
for calculating the correlation coefficient between two variables” (Gray 2017,
p. 642), in order to assess the relationships between the independent variables
or service quality dimensions with the aim of verifying the construct validity
(Bryman & Bell 2015).
3.8.3 Regression analysis
The essential objective of regression analysis is to examine and predict the
influence of an independent variable on another dependent variable, as well as
to select the trend of the relationship. In other words, it helps in assessing and
measuring the statistical significance of the relationship between independent
and dependent variables (Gray 2017; Saunders et al. 2011). There are many
techniques related to regression analysis. For instance, simple linear regression
when there is only one independent variable, whereas if there are many
independent variables then the regression will be multiple regressions
regardless the number of the dependent variables. The value of regression
coefficient R2 takes a value between zero and one, when its value close to 0
that means the independent variable has not a statistical significance impact on
the dependent variable, and when its value close to one the value of R Square
shows how much of the variance in the dependent variables could be
interpreted by the independent variable (Gray 2017; Saunders et al. 2011).
The thesis will conduct regressions analysis to determine the impact of service
quality and its dimensions as independent variables on the customer
satisfaction and loyalty as dependent variables.
3.9. Research quality
Validity and reliability are key factors in determining the data quality of the
research study (Bryman & Bell 2015; Saunders et al. 2011). Where the validity”
is concerned with whether the findings are really about what they appear to be
about.”(Saunders et al. 2011, p. 157), and reliability is “The degree to which an
instrument will produce similar results at a different period” (Gray 2017, p.
780). Therefore in order to enhance the quality of the project the researcher
has to verify and assure validity and reliability (Bryman & Bill 2015; Saunders
et al. 2011).
27
3.9.1 Validity
Primarily, in order to assure the validity of the questionnaire as a research tool,
the questions have to measure the entire content of the concepts that have
been operationalized accurately, no more or less (Atkinson 2012). In other
words, the researchers have to verify construct validity “refers to the extent to
which your measurement questions actually measure the presence of those
constructs you intended them to measure” (Saunders et al. 2011, p. 373).
Consequently, the degree of the measurement instrument’s validity depends
on the extent of matching between the research instrument and the specific
operational areas of study (Atkinson 2012; Gray 2017; Saunders et al. 2011).
According to Bryman & Bell (2015), the researchers can rely on examining the
relationships between independent variables as an approach to assure the
construct validity. Accordingly, the thesis will base on correlation analysis to
verify construct validity.
Further, relating to the internal validity “The extent to which changes in the
dependent variable can be attributed to the independent variable, rather than
to an extraneous variable” (Gray 2017, p.147). Randomization or random
sampling leads to assure internal validity where the random allocation prevents
bias. For that reason, the study has used a special program so called
Randomizer to ensure random sampling process (Bryman & Bill 2015; Gray
2017). In contrast, with regard to external validity, having irrelevant and
spurious questions makes the questionnaire longer, and that leads to decrease
the rate of responses, in turn, it may restrict the generalization of the
outcomes and the external validity, where the external validity is “The extent
to which research results can be generalized to the population as a whole”
(Gray 2017, p. 775). Also, using common scales have been used by other
researchers will support and demonstrate the feasibility of the outcomes,
which assures the external validity (Gray 2017; Saunders et al. 2011).
In addition, issue related to the arrangement of the questionnaire, and forming
of questions could affect validity. Therefore, in order to increase the validity,
as well as to ensure that the structure of questionnaire is well-arranged, and the
wording of questions is clear, the questionnaire has been discussed with the
supervisor, and has been first sent to a limited number of participants with aim
of getting notes to remove any ambiguity and help the participants to
understand the questions and answer correctly (Easterby-Smith et al. 2012;
Gray 2017; Trobia 2008).
28
Generally, it is recommended to utilize validated prepared scales in academic
literature. Where these scales have been established by expert and skilled
researchers, they have been published in scientific and academic journals, and
lastly, they have been tested to verify their validity and reliability (Gray 2017;
Saunders et al. 2011). In consequence, to assure the research validity, the study
utilizes the SERVPERF scale, which is the result of many statistical and
empirical studies in various sectors, and it has been used and recommended by
many researchers (Cronin & Taylor 1992; Dahlgaard-Park 2015; Jain & Gupta
2004; Reheul et al. 2013). Additionally, the study has followed random
selection to enhance the internal validity and external validity. Moreover, other
researchers have used the same scales in different contexts and this enhances
the feasibility of the study's outcomes, hence the external validity. Also, the
thesis will base on correlation analysis to examine relationships between
variables and verify construct validity (Bryman & Bell 2015). Regarding the
literature review or theory, the research utilizes peer-reviewed, scientific
relevant literature, books, and articles to construct and cover the theoretical
framework and the methodology in order to achieve the purpose of the
research project (Bryman & Bill 2015; Collis & Hussey 2013; Guthrie 2010).
3.9.2. Reliability
The research tools have to be reliable and valid to ensure the data quality of
the study. Further, the reliability is a prerequisite condition for validity, if the
research instrument is unreliable, then it will not be valid. The reliability
indicates mainly to the stability and consistency in the scale (Bryman & Bell
2015; Gray 2017; Knapp 2008). According to Gray (2017, p. 162), the
reliability is “an indication of consistency between two measures of the same
thing”).
Also, there are many methods to measure reliability such as stability and
internal reliability. Stability implies there is a constancy or limited variation in
the measure’s results over time. In contrast, internal reliability refers to the
consistency and coherence between the indicators or items that form the scale.
In other words, it measures the degree of homogeneity between the items on
the questionnaire and if they are interdependent (Bryman & Bell 2015; Gray
2017). The need to reliability increases in the case of using a multiple- item
measure, where the score is the average or overall result of the items’ answers
of the model (Bryman & Bell 2015; Prus & Brandt 1995).
29
In order to examine the internal reliability, research uses Cronbach’s alpha test.
The value of Alpha coefficient varies between zero and one, where the value
one indicates to perfect internal reliability, and value zero means there is no
internal reliability. In general, as a rule of thumb, when the value of the Alpha
coefficient is more than 0.7 this refers to an acceptable degree of reliability
(Bryman & Bell 2015; Easterby-Smith et al. 2012; Gray 2017). Accordingly, the
study will compute the value of Alpha coefficient to test the internal reliability.
Furthermore, Many errors can occur in the data entry process when
performed manually, affecting the reliability of data analysis (Gray 2017). In
order to overcome this problem, the study uses the Google Form program to
create automatically a file contains participants' responses, thus avoiding errors
that happen in the manual data entry process.
3.9.3. Ethical consideration
There is an increasing awareness of the importance of ethical considerations in
the research projects. Further, researchers have to be aware of their ethical
responsibilities to the participants whether individuals or organization and
explain how the study will adhere to ethical principles. The ethical principles
of research imply the moral principles have been followed in the project
(Bryman & Bell 2015; Gray 2017; Guthrie 2010; Roberts 2010).
In general, regardless the research methods, the principles of ethical conduct
cover four major areas. First, the research should not cause physical or mental
harm to the participants, for instance, the research has to avoid intrusive
questions and let the participants express their opinions voluntary. Second, the
research has to get informed consent of respondents, for instance, it should
show that participants give their approval freely. Third, the study has to
protect and respect the privacy of the respondents where it is not acceptable
to invade their privacy like using covert observation or confidential records,
and the research should make the participants identity anonymous if it is
required. Lastly, it should not use deception like pretending that the research
aims to achieve something but it seeks to something else.
This research adopts an online survey questionnaire as a research instrument.
However, in all research methods including a survey questionnaire, adhering to
research ethics is a necessity and leads to increase the response rate (Gray
2017; Roberts 2010; Saunders et al. 2011). This study adheres to the main
principles of ethics. Consequently, will seek to avoid intrusive questions and
inform the participants with the main aim of the survey in order to avoid

30
deception and causing harm to the respondents. Concerning ensuring
informed approval of respondents in the online questionnaire, the
questionnaire's response is usually considered as a sign of approval, because
the recipient can simply ignore the questionnaire if he/she does not want to
participate. Last but not least, concerning privacy and preserving the
anonymity of the respondents, the study has used Google Form, thus the
responses will be received and handled anonymously (Gray 2017; Guthrie
2010; Roberts 2010).
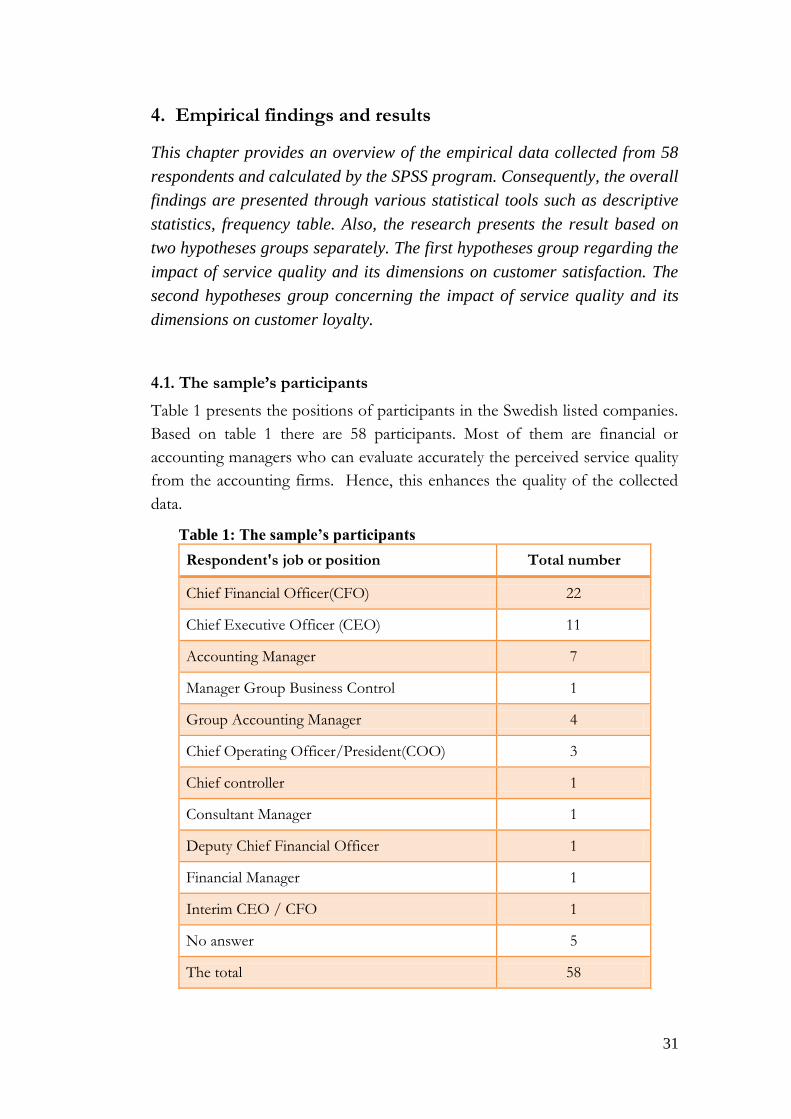
31
4. Empirical findings and results
This chapter provides an overview of the empirical data collected from 58
respondents and calculated by the SPSS program. Consequently, the overall
findings are presented through various statistical tools such as descriptive
statistics, frequency table. Also, the research presents the result based on
two hypotheses groups separately. The first hypotheses group regarding the
impact of service quality and its dimensions on customer satisfaction. The
second hypotheses group concerning the impact of service quality and its
dimensions on customer loyalty.
4.1. The sample’s participants
Table 1 presents the positions of participants in the Swedish listed companies.
Based on table 1 there are 58 participants. Most of them are financial or
accounting managers who can evaluate accurately the perceived service quality
from the accounting firms. Hence, this enhances the quality of the collected
data.
Table 1: The sample’s participants
Respondent's job or position Total number
Chief Financial Officer(CFO) 22
Chief Executive Officer (CEO) 11
Accounting Manager 7
Manager Group Business Control 1
Group Accounting Manager 4
Chief Operating Officer/President(COO) 3
Chief controller 1
Consultant Manager 1
Deputy Chief Financial Officer 1
Financial Manager 1
Interim CEO / CFO 1
No answer 5
The total 58
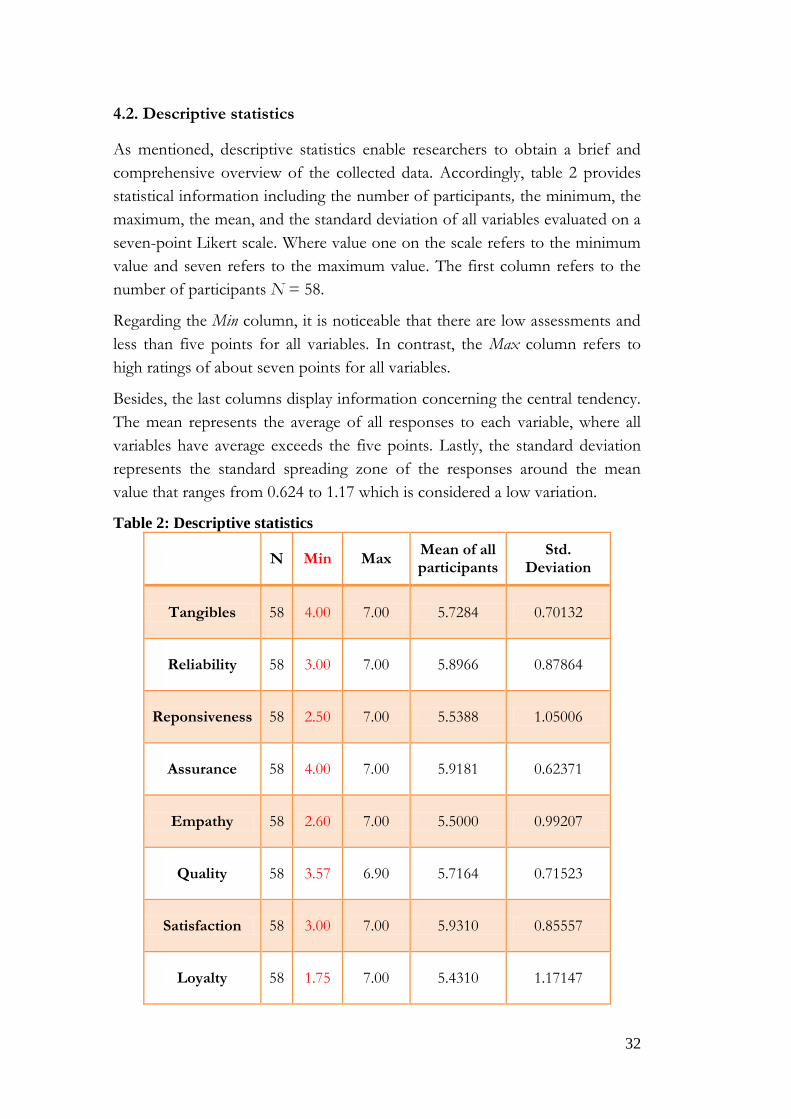
32
4.2. Descriptive statistics
As mentioned, descriptive statistics enable researchers to obtain a brief and
comprehensive overview of the collected data. Accordingly, table 2 provides
statistical information including the number of participants, the minimum, the
maximum, the mean, and the standard deviation of all variables evaluated on a
seven-point Likert scale. Where value one on the scale refers to the minimum
value and seven refers to the maximum value. The first column refers to the
number of participants N = 58.
Regarding the Min column, it is noticeable that there are low assessments and
less than five points for all variables. In contrast, the Max column refers to
high ratings of about seven points for all variables.
Besides, the last columns display information concerning the central tendency.
The mean represents the average of all responses to each variable, where all
variables have average exceeds the five points. Lastly, the standard deviation
represents the standard spreading zone of the responses around the mean
value that ranges from 0.624 to 1.17 which is considered a low variation.
Table 2: Descriptive statistics
N Min Max
Mean of all participants
Std. Deviation
Tangibles 58 4.00 7.00 5.7284 0.70132
Reliability 58 3.00 7.00 5.8966 0.87864
Reponsiveness 58 2.50 7.00 5.5388 1.05006
Assurance 58 4.00 7.00 5.9181 0.62371
Empathy 58 2.60 7.00 5.5000 0.99207
Quality 58 3.57 6.90 5.7164 0.71523
Satisfaction 58 3.00 7.00 5.9310 0.85557
Loyalty 58 1.75 7.00 5.4310 1.17147
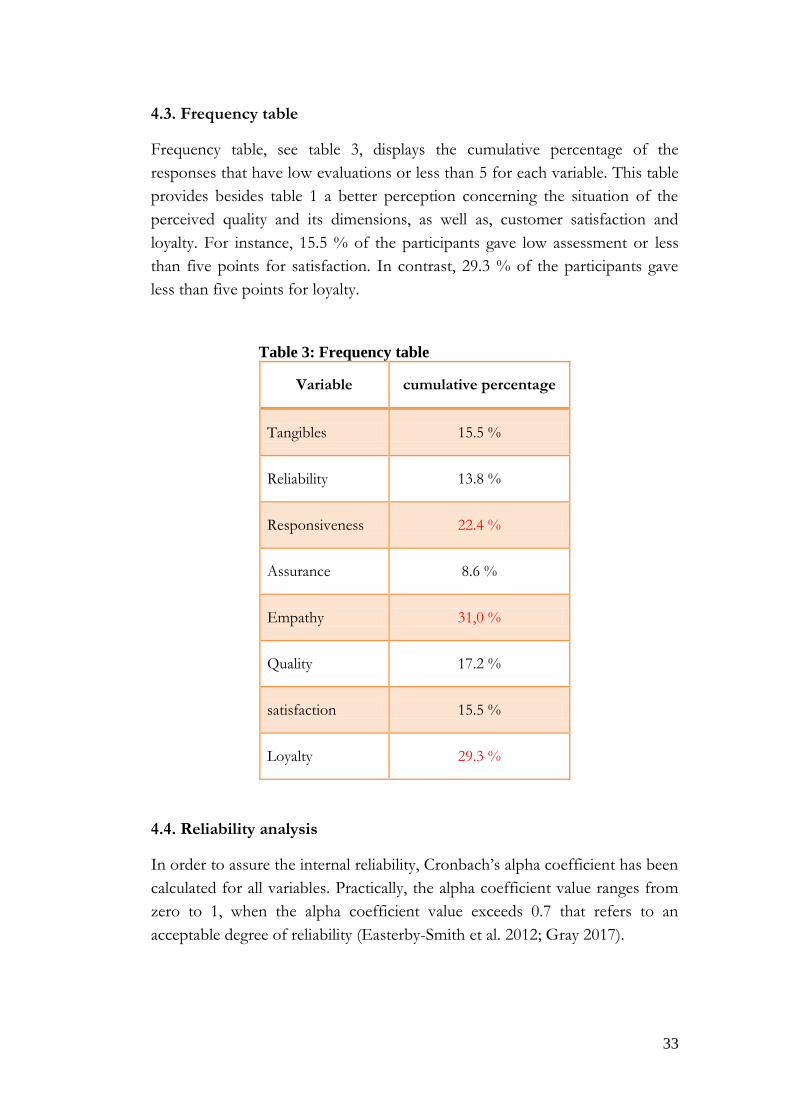
33
4.3. Frequency table
Frequency table, see table 3, displays the cumulative percentage of the
responses that have low evaluations or less than 5 for each variable. This table
provides besides table 1 a better perception concerning the situation of the
perceived quality and its dimensions, as well as, customer satisfaction and
loyalty. For instance, 15.5 % of the participants gave low assessment or less
than five points for satisfaction. In contrast, 29.3 % of the participants gave
less than five points for loyalty.
Table 3: Frequency table
Variable cumulative percentage
Tangibles 15.5 %
Reliability 13.8 %
Responsiveness 22.4 %
Assurance 8.6 %
Empathy 31,0 %
Quality 17.2 %
satisfaction 15.5 %
Loyalty 29.3 %
4.4. Reliability analysis
In order to assure the internal reliability, Cronbach’s alpha coefficient has been
calculated for all variables. Practically, the alpha coefficient value ranges from
zero to 1, when the alpha coefficient value exceeds 0.7 that refers to an
acceptable degree of reliability (Easterby-Smith et al. 2012; Gray 2017).
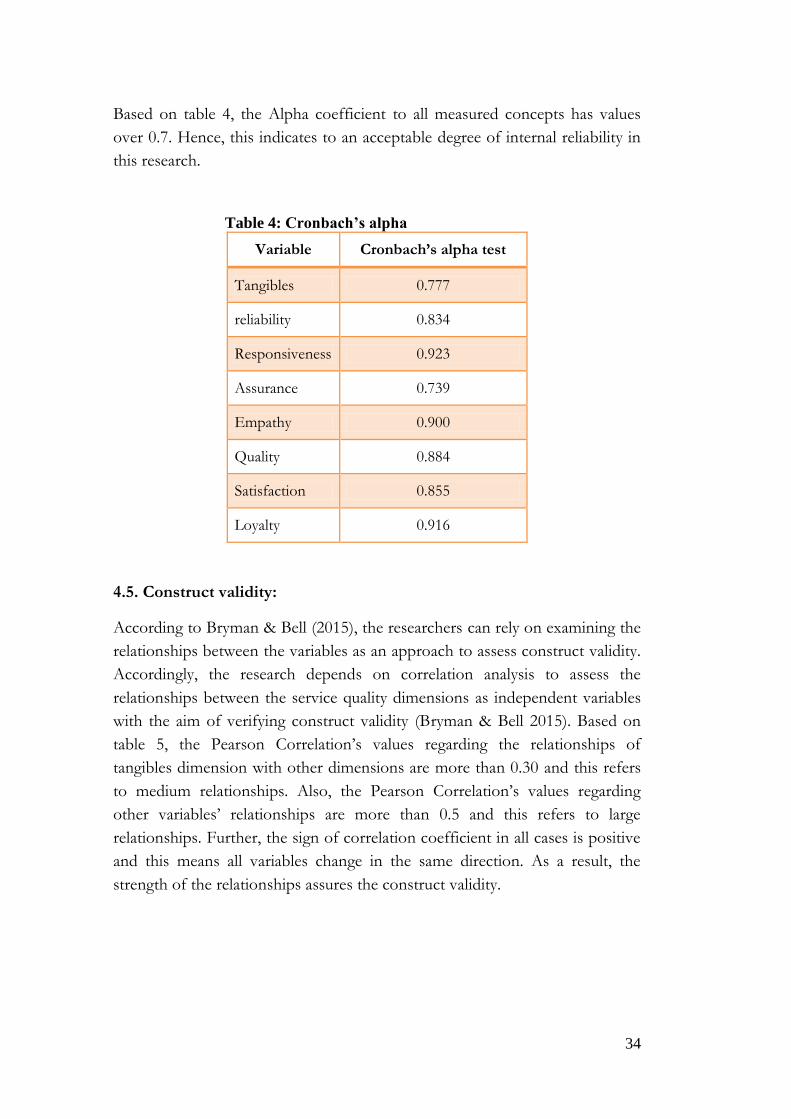
34
Based on table 4, the Alpha coefficient to all measured concepts has values
over 0.7. Hence, this indicates to an acceptable degree of internal reliability in
this research.
Table 4: Cronbach’s alpha
Variable Cronbach’s alpha test
Tangibles 0.777
reliability 0.834
Responsiveness 0.923
Assurance 0.739
Empathy 0.900
Quality 0.884
Satisfaction 0.855
Loyalty 0.916
4.5. Construct validity:
According to Bryman & Bell (2015), the researchers can rely on examining the
relationships between the variables as an approach to assess construct validity.
Accordingly, the research depends on correlation analysis to assess the
relationships between the service quality dimensions as independent variables
with the aim of verifying construct validity (Bryman & Bell 2015). Based on
table 5, the Pearson Correlation’s values regarding the relationships of
tangibles dimension with other dimensions are more than 0.30 and this refers
to medium relationships. Also, the Pearson Correlation’s values regarding
other variables’ relationships are more than 0.5 and this refers to large
relationships. Further, the sign of correlation coefficient in all cases is positive
and this means all variables change in the same direction. As a result, the
strength of the relationships assures the construct validity.
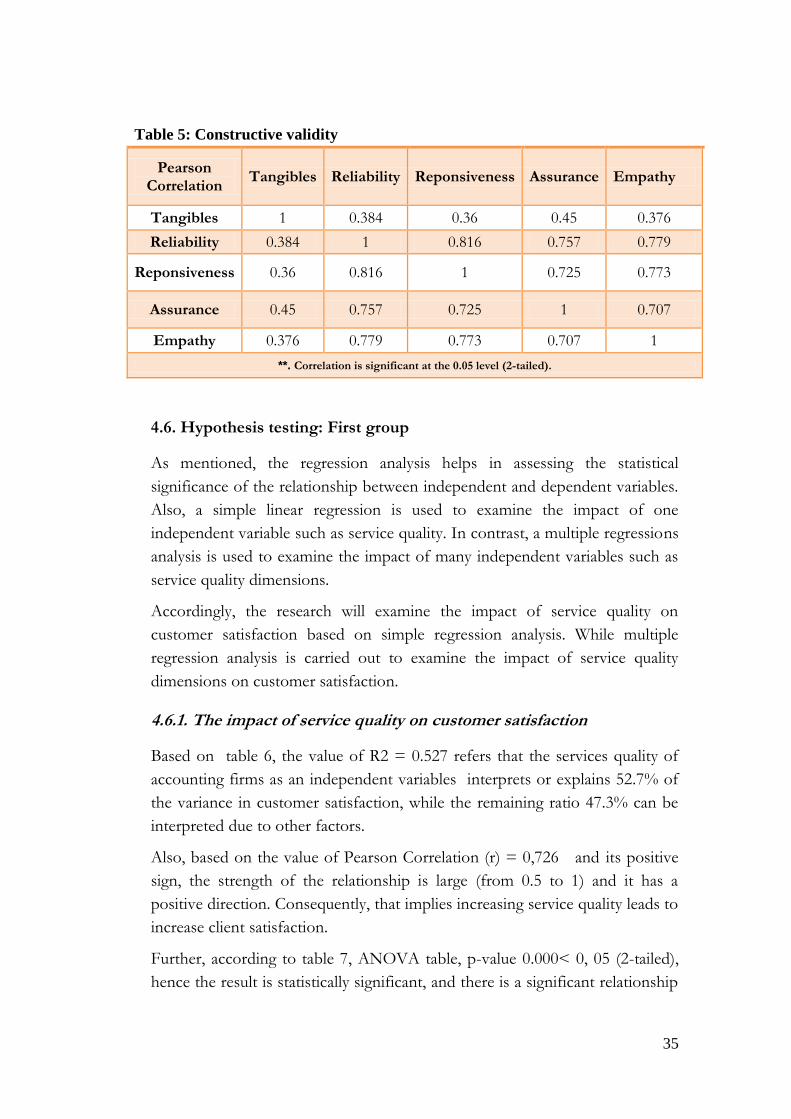
35
Table 5: Constructive validity
Pearson Correlation
Tangibles Reliability Reponsiveness Assurance Empathy
Tangibles 1 0.384 0.36 0.45 0.376
Reliability 0.384 1 0.816 0.757 0.779
Reponsiveness 0.36 0.816 1 0.725 0.773
Assurance 0.45 0.757 0.725 1 0.707
Empathy 0.376 0.779 0.773 0.707 1
**. Correlation is significant at the 0.05 level (2-tailed).
4.6. Hypothesis testing: First group
As mentioned, the regression analysis helps in assessing the statistical
significance of the relationship between independent and dependent variables.
Also, a simple linear regression is used to examine the impact of one
independent variable such as service quality. In contrast, a multiple regressions
analysis is used to examine the impact of many independent variables such as
service quality dimensions.
Accordingly, the research will examine the impact of service quality on
customer satisfaction based on simple regression analysis. While multiple
regression analysis is carried out to examine the impact of service quality
dimensions on customer satisfaction.
4.6.1. The impact of service quality on customer satisfaction
Based on table 6, the value of R2 = 0.527 refers that the services quality of
accounting firms as an independent variables interprets or explains 52.7% of
the variance in customer satisfaction, while the remaining ratio 47.3% can be
interpreted due to other factors.
Also, based on the value of Pearson Correlation (r) = 0,726 and its positive
sign, the strength of the relationship is large (from 0.5 to 1) and it has a
positive direction. Consequently, that implies increasing service quality leads to
increase client satisfaction.
Further, according to table 7, ANOVA table, p-value 0.000< 0, 05 (2-tailed),
hence the result is statistically significant, and there is a significant relationship
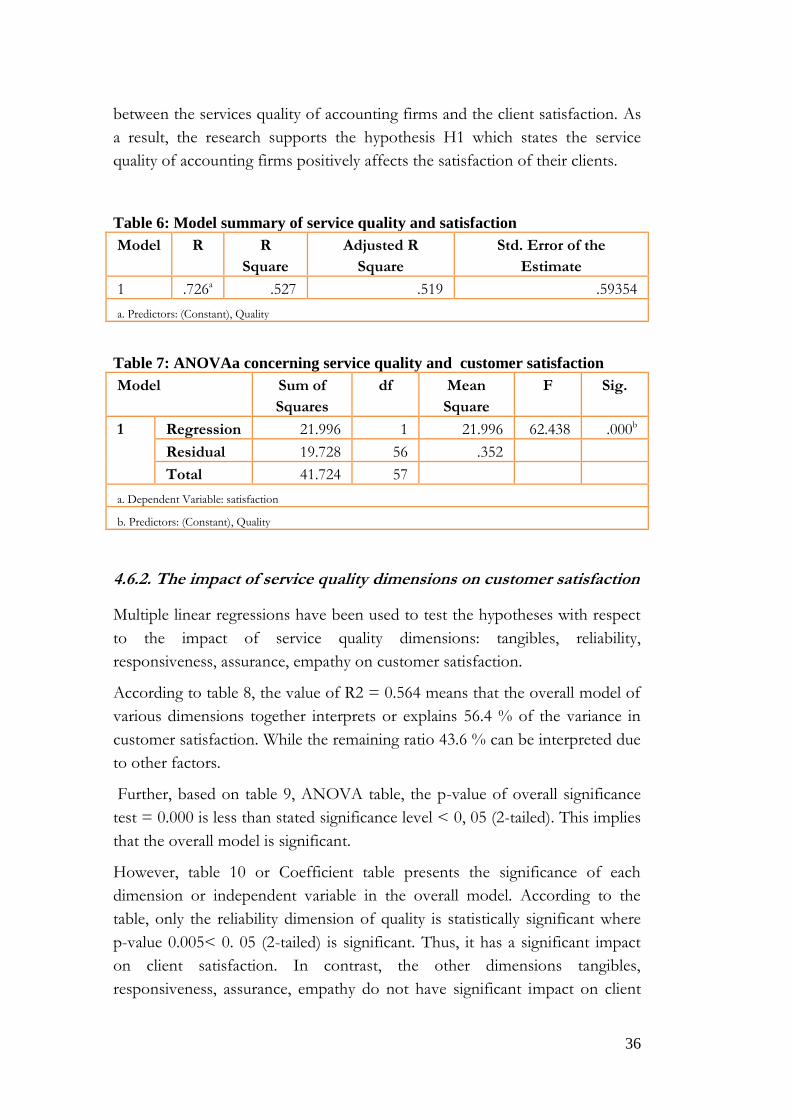
36
between the services quality of accounting firms and the client satisfaction. As
a result, the research supports the hypothesis H1 which states the service
quality of accounting firms positively affects the satisfaction of their clients.
Table 6: Model summary of service quality and satisfaction
Model R R
Square
Adjusted R
Square
Std. Error of the
Estimate
1 .726a .527 .519 .59354
a. Predictors: (Constant), Quality
Table 7: ANOVAa concerning service quality and customer satisfaction
Model Sum of
Squares
df Mean
Square
F Sig.
1 Regression 21.996 1 21.996 62.438 .000b
Residual 19.728 56 .352
Total 41.724 57
a. Dependent Variable: satisfaction
b. Predictors: (Constant), Quality
4.6.2. The impact of service quality dimensions on customer satisfaction
Multiple linear regressions have been used to test the hypotheses with respect
to the impact of service quality dimensions: tangibles, reliability,
responsiveness, assurance, empathy on customer satisfaction.
According to table 8, the value of R2 = 0.564 means that the overall model of
various dimensions together interprets or explains 56.4 % of the variance in
customer satisfaction. While the remaining ratio 43.6 % can be interpreted due
to other factors.
Further, based on table 9, ANOVA table, the p-value of overall significance
test = 0.000 is less than stated significance level < 0, 05 (2-tailed). This implies
that the overall model is significant.
However, table 10 or Coefficient table presents the significance of each
dimension or independent variable in the overall model. According to the
table, only the reliability dimension of quality is statistically significant where
p-value 0.005< 0. 05 (2-tailed) is significant. Thus, it has a significant impact
on client satisfaction. In contrast, the other dimensions tangibles,
responsiveness, assurance, empathy do not have significant impact on client
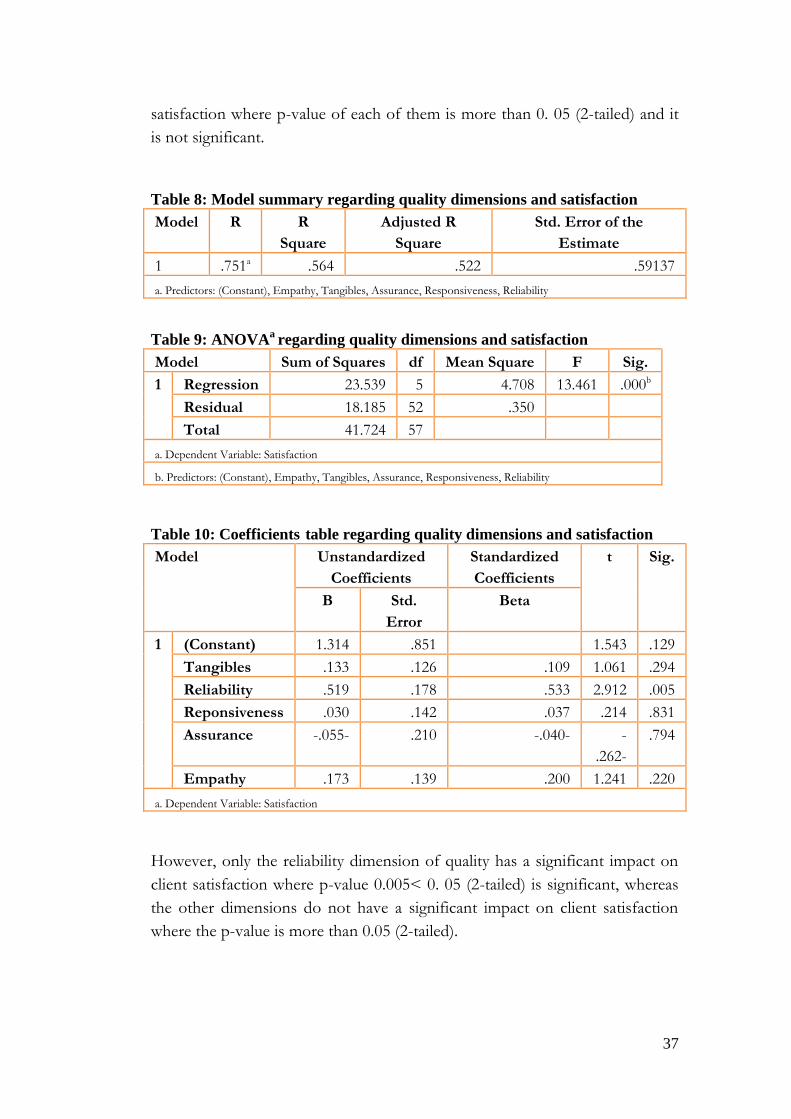
37
satisfaction where p-value of each of them is more than 0. 05 (2-tailed) and it
is not significant.
Table 8: Model summary regarding quality dimensions and satisfaction
Model R R
Square
Adjusted R
Square
Std. Error of the
Estimate
1 .751a .564 .522 .59137
a. Predictors: (Constant), Empathy, Tangibles, Assurance, Responsiveness, Reliability
Table 9: ANOVAa
regarding quality dimensions and satisfaction
Model Sum of Squares df Mean Square F Sig.
1 Regression 23.539 5 4.708 13.461 .000b
Residual 18.185 52 .350
Total 41.724 57
a. Dependent Variable: Satisfaction
b. Predictors: (Constant), Empathy, Tangibles, Assurance, Responsiveness, Reliability
Table 10: Coefficients table regarding quality dimensions and satisfaction
Model Unstandardized
Coefficients
Standardized
Coefficients
t Sig.
B Std.
Error
Beta
1 (Constant) 1.314 .851 1.543 .129
Tangibles .133 .126 .109 1.061 .294
Reliability .519 .178 .533 2.912 .005
Reponsiveness .030 .142 .037 .214 .831
Assurance -.055- .210 -.040- -
.262-
.794
Empathy .173 .139 .200 1.241 .220
a. Dependent Variable: Satisfaction
However, only the reliability dimension of quality has a significant impact on
client satisfaction where p-value 0.005< 0. 05 (2-tailed) is significant, whereas
the other dimensions do not have a significant impact on client satisfaction
where the p-value is more than 0.05 (2-tailed).
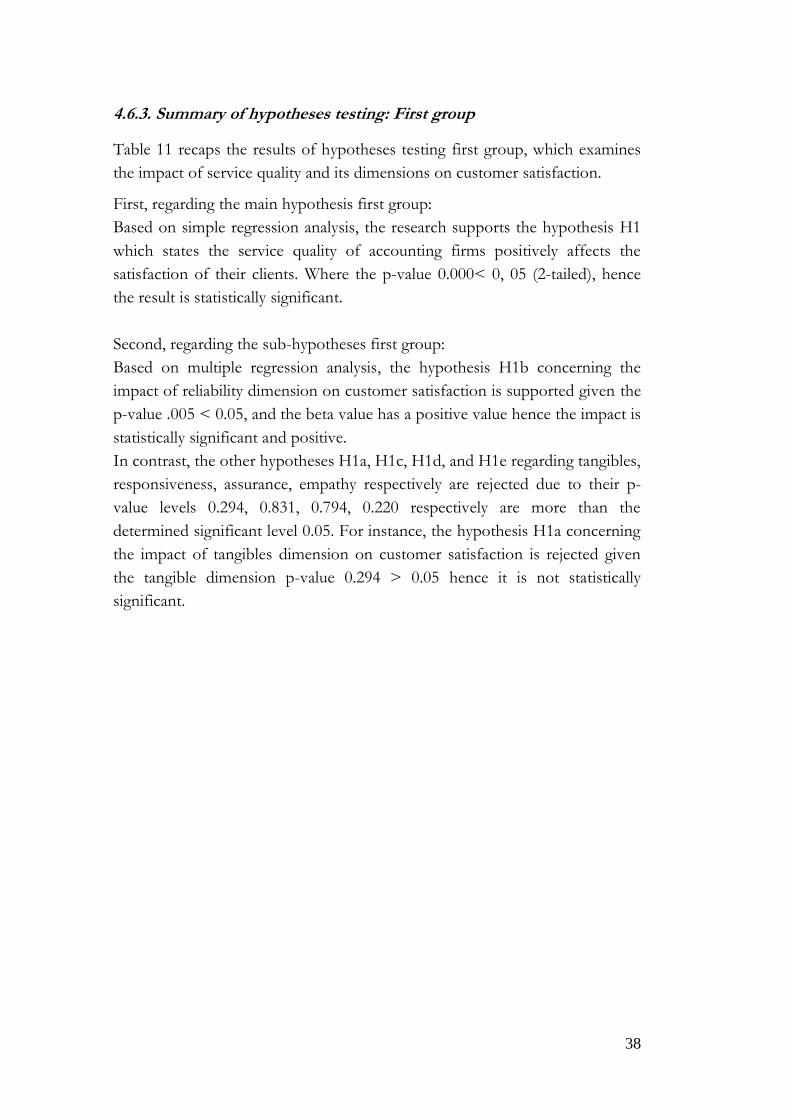
38
4.6.3. Summary of hypotheses testing: First group
Table 11 recaps the results of hypotheses testing first group, which examines
the impact of service quality and its dimensions on customer satisfaction.
First, regarding the main hypothesis first group:
Based on simple regression analysis, the research supports the hypothesis H1
which states the service quality of accounting firms positively affects the
satisfaction of their clients. Where the p-value 0.000< 0, 05 (2-tailed), hence
the result is statistically significant.
Second, regarding the sub-hypotheses first group:
Based on multiple regression analysis, the hypothesis H1b concerning the
impact of reliability dimension on customer satisfaction is supported given the
p-value .005 < 0.05, and the beta value has a positive value hence the impact is
statistically significant and positive.
In contrast, the other hypotheses H1a, H1c, H1d, and H1e regarding tangibles,
responsiveness, assurance, empathy respectively are rejected due to their p-
value levels 0.294, 0.831, 0.794, 0.220 respectively are more than the
determined significant level 0.05. For instance, the hypothesis H1a concerning
the impact of tangibles dimension on customer satisfaction is rejected given
the tangible dimension p-value 0.294 > 0.05 hence it is not statistically
significant.
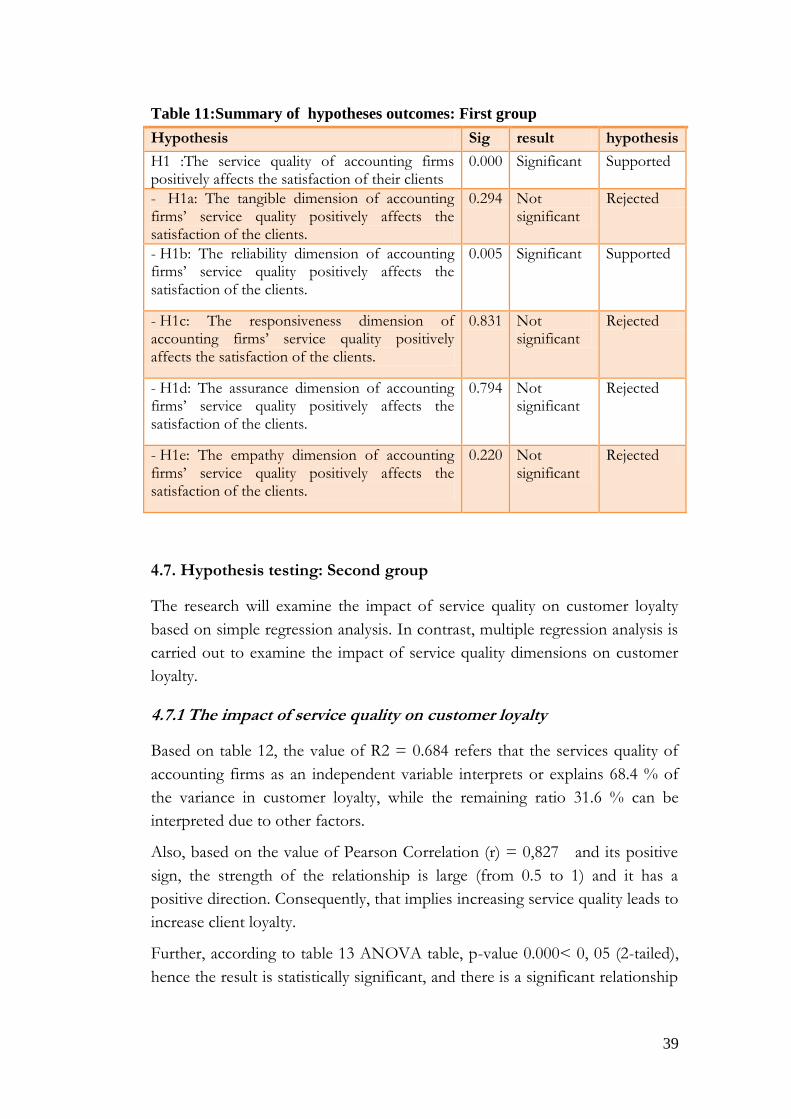
39
Table 11:Summary of hypotheses outcomes: First group
Hypothesis Sig result hypothesis
H1 :The service quality of accounting firms positively affects the satisfaction of their clients
0.000 Significant Supported
- H1a: The tangible dimension of accounting firms’ service quality positively affects the satisfaction of the clients.
0.294 Not significant
Rejected
- H1b: The reliability dimension of accounting firms’ service quality positively affects the satisfaction of the clients.
0.005 Significant Supported
- H1c: The responsiveness dimension of accounting firms’ service quality positively affects the satisfaction of the clients.
0.831 Not significant
Rejected
- H1d: The assurance dimension of accounting firms’ service quality positively affects the satisfaction of the clients.
0.794 Not significant
Rejected
- H1e: The empathy dimension of accounting firms’ service quality positively affects the satisfaction of the clients.
0.220 Not significant
Rejected
4.7. Hypothesis testing: Second group
The research will examine the impact of service quality on customer loyalty
based on simple regression analysis. In contrast, multiple regression analysis is
carried out to examine the impact of service quality dimensions on customer
loyalty.
4.7.1 The impact of service quality on customer loyalty
Based on table 12, the value of R2 = 0.684 refers that the services quality of
accounting firms as an independent variable interprets or explains 68.4 % of
the variance in customer loyalty, while the remaining ratio 31.6 % can be
interpreted due to other factors.
Also, based on the value of Pearson Correlation (r) = 0,827 and its positive
sign, the strength of the relationship is large (from 0.5 to 1) and it has a
positive direction. Consequently, that implies increasing service quality leads to
increase client loyalty.
Further, according to table 13 ANOVA table, p-value 0.000< 0, 05 (2-tailed),
hence the result is statistically significant, and there is a significant relationship
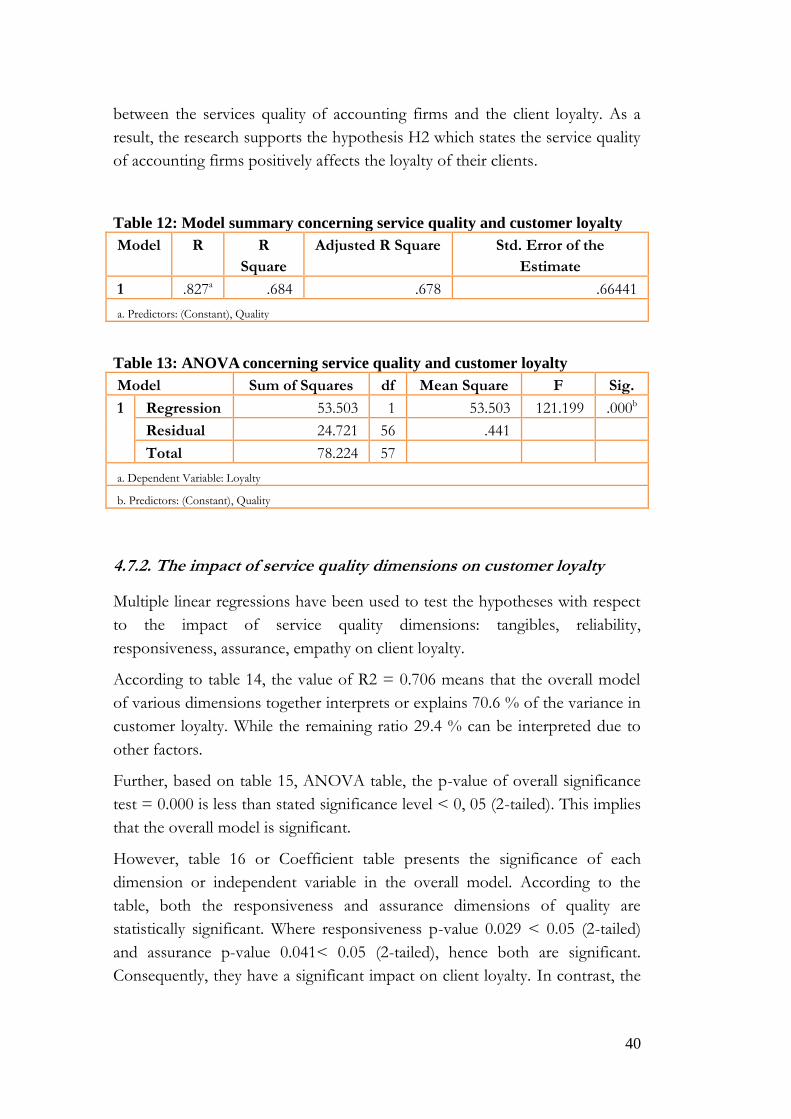
40
between the services quality of accounting firms and the client loyalty. As a
result, the research supports the hypothesis H2 which states the service quality
of accounting firms positively affects the loyalty of their clients.
Table 12: Model summary concerning service quality and customer loyalty
Model R R
Square
Adjusted R Square Std. Error of the
Estimate
1 .827a .684 .678 .66441
a. Predictors: (Constant), Quality
Table 13: ANOVA concerning service quality and customer loyalty
Model Sum of Squares df Mean Square F Sig.
1 Regression 53.503 1 53.503 121.199 .000b
Residual 24.721 56 .441
Total 78.224 57
a. Dependent Variable: Loyalty
b. Predictors: (Constant), Quality
4.7.2. The impact of service quality dimensions on customer loyalty
Multiple linear regressions have been used to test the hypotheses with respect
to the impact of service quality dimensions: tangibles, reliability,
responsiveness, assurance, empathy on client loyalty.
According to table 14, the value of R2 = 0.706 means that the overall model
of various dimensions together interprets or explains 70.6 % of the variance in
customer loyalty. While the remaining ratio 29.4 % can be interpreted due to
other factors.
Further, based on table 15, ANOVA table, the p-value of overall significance
test = 0.000 is less than stated significance level < 0, 05 (2-tailed). This implies
that the overall model is significant.
However, table 16 or Coefficient table presents the significance of each
dimension or independent variable in the overall model. According to the
table, both the responsiveness and assurance dimensions of quality are
statistically significant. Where responsiveness p-value 0.029 < 0.05 (2-tailed)
and assurance p-value 0.041< 0.05 (2-tailed), hence both are significant.
Consequently, they have a significant impact on client loyalty. In contrast, the
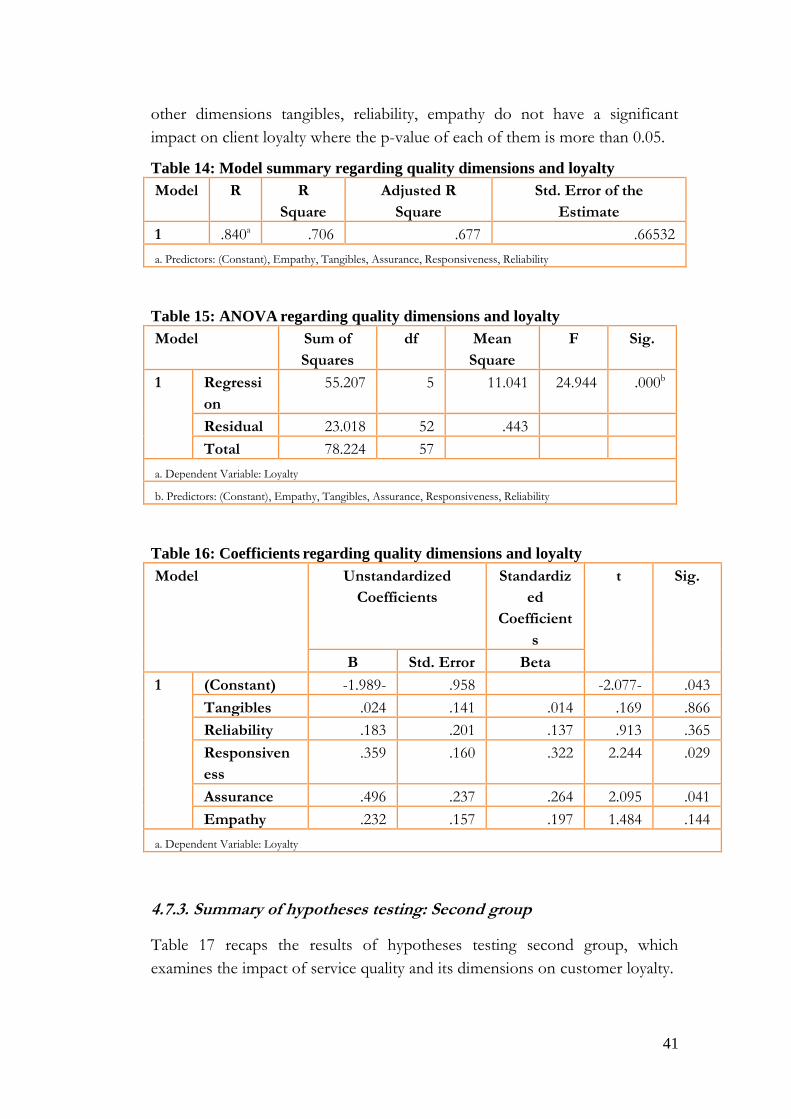
41
other dimensions tangibles, reliability, empathy do not have a significant
impact on client loyalty where the p-value of each of them is more than 0.05.
Table 14: Model summary regarding quality dimensions and loyalty
Model R R
Square
Adjusted R
Square
Std. Error of the
Estimate
1 .840a .706 .677 .66532
a. Predictors: (Constant), Empathy, Tangibles, Assurance, Responsiveness, Reliability
Table 15: ANOVA regarding quality dimensions and loyalty
Model Sum of
Squares
df Mean
Square
F Sig.
1 Regressi
on
55.207 5 11.041 24.944 .000b
Residual 23.018 52 .443
Total 78.224 57
a. Dependent Variable: Loyalty
b. Predictors: (Constant), Empathy, Tangibles, Assurance, Responsiveness, Reliability
Table 16: Coefficients regarding quality dimensions and loyalty
Model Unstandardized
Coefficients
Standardiz
ed
Coefficient
s
t Sig.
B Std. Error Beta
1 (Constant) -1.989- .958 -2.077- .043
Tangibles .024 .141 .014 .169 .866
Reliability .183 .201 .137 .913 .365
Responsiven
ess
.359 .160 .322 2.244 .029
Assurance .496 .237 .264 2.095 .041
Empathy .232 .157 .197 1.484 .144
a. Dependent Variable: Loyalty
4.7.3. Summary of hypotheses testing: Second group
Table 17 recaps the results of hypotheses testing second group, which
examines the impact of service quality and its dimensions on customer loyalty.
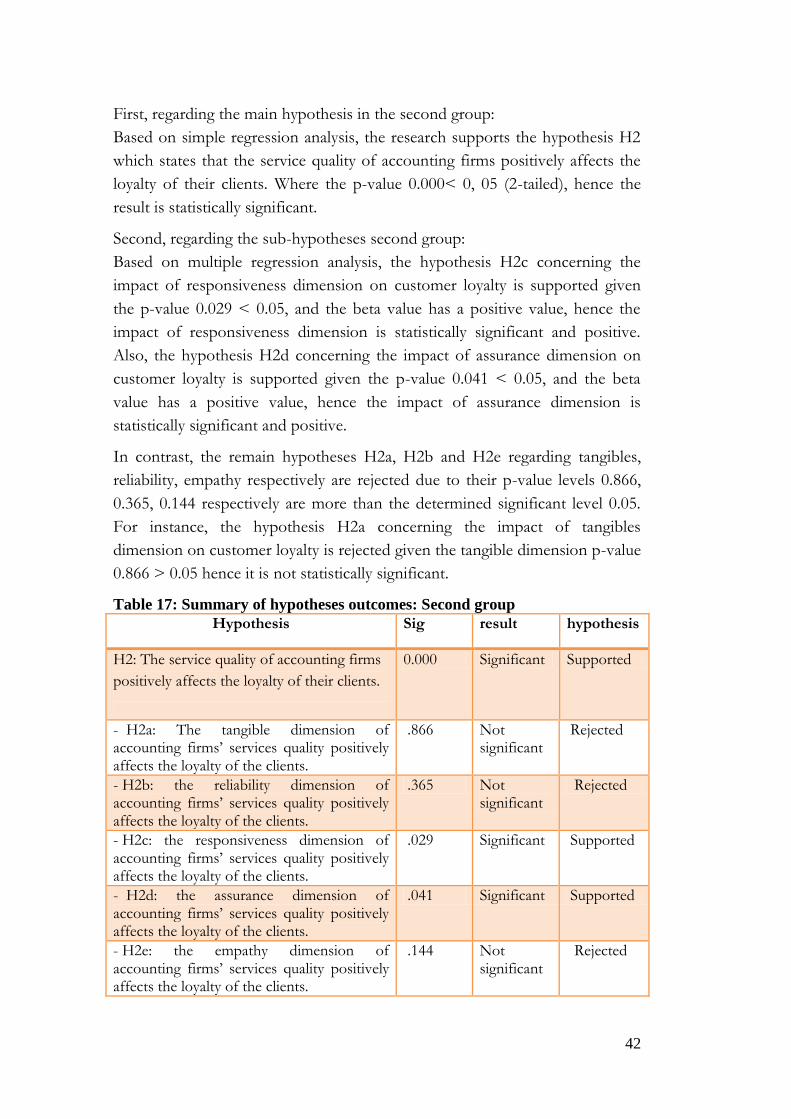
42
First, regarding the main hypothesis in the second group:
Based on simple regression analysis, the research supports the hypothesis H2
which states that the service quality of accounting firms positively affects the
loyalty of their clients. Where the p-value 0.000< 0, 05 (2-tailed), hence the
result is statistically significant.
Second, regarding the sub-hypotheses second group:
Based on multiple regression analysis, the hypothesis H2c concerning the
impact of responsiveness dimension on customer loyalty is supported given
the p-value 0.029 < 0.05, and the beta value has a positive value, hence the
impact of responsiveness dimension is statistically significant and positive.
Also, the hypothesis H2d concerning the impact of assurance dimension on
customer loyalty is supported given the p-value 0.041 < 0.05, and the beta
value has a positive value, hence the impact of assurance dimension is
statistically significant and positive.
In contrast, the remain hypotheses H2a, H2b and H2e regarding tangibles,
reliability, empathy respectively are rejected due to their p-value levels 0.866,
0.365, 0.144 respectively are more than the determined significant level 0.05.
For instance, the hypothesis H2a concerning the impact of tangibles
dimension on customer loyalty is rejected given the tangible dimension p-value
0.866 > 0.05 hence it is not statistically significant.
Table 17: Summary of hypotheses outcomes: Second group
Hypothesis Sig result hypothesis
H2: The service quality of accounting firms
positively affects the loyalty of their clients.
0.000 Significant Supported
- H2a: The tangible dimension of accounting firms’ services quality positively affects the loyalty of the clients.
.866 Not significant
Rejected
- H2b: the reliability dimension of accounting firms’ services quality positively affects the loyalty of the clients.
.365 Not significant
Rejected
- H2c: the responsiveness dimension of accounting firms’ services quality positively affects the loyalty of the clients.
.029 Significant Supported
- H2d: the assurance dimension of accounting firms’ services quality positively affects the loyalty of the clients.
.041 Significant Supported
- H2e: the empathy dimension of accounting firms’ services quality positively affects the loyalty of the clients.
.144 Not significant
Rejected
43
5. Discussion
This chapter discusses and explains the statistical findings that have been
presented in the result section. Also, discusses and explains the outcome of
the two hypotheses groups separately in the light of the theory that has been
presented in the theoretical framework chapter.
5.1. Descriptive statistic and frequency table
First of all, according to descriptive statics, all variables have perceived average
value over five on a seven-point Likert scale. This implies that the levels of
quality and its dimensions in accounting firms based on the Swedish listed
companies’ perception are large. Also, customer satisfaction and customer
loyalty have average value over five on a seven-point Likert scale.
However, considering the Min column in the descriptive table, besides the
cumulative percentage in the frequency table which refers to the responses
that have low evaluations or less than 5 for each variable, it will be noticed, for
instance that 22.4 % of the respondents have given less than five points to
responsiveness dimension. The low evaluation to this dimension refers to a
lack in the willingness of staff to assist clients and offer prompt service,
although the mean value concerning the responsiveness dimension is large.
Consequently, even though the overall outcome based on averages indicates a
health condition where the mean of all variables is more than five points, the
frequency table has revealed places of problems that should be considered and
addressed.
Further, according to frequency table the cumulative percentage of customer
satisfaction is 15.5 %, while the cumulative percentage of customer loyalty is
29.3 %. This means that participants who rated less than five points to loyalty
exceeded the customers who rated less than five points to satisfaction. This is
consistent with the theory in second chapter that states it is not necessary that
the satisfied customer will be a loyal customer, where the satisfied current
customers might not deal with the company in the future (Oliver 1999; Prus
and Brandt 1995; Story & Hess 2006).
5.2. Discussion of results: First group
Where, the first group represents the hypotheses regarding the impact of
quality and its dimensions on customer satisfaction.
44
H1: The service quality of accounting firms positively affects the satisfaction
of their clients at Nasdaq Stockholm OMX. Besides other sub-Hypotheses
which examine the impact of service quality dimensions on customer
satisfaction H1a, H1b, H1c H1d, and H1e.
Initially, the prior studies have suggested that service quality has a positive
impact on customer satisfaction (Aga & Safakli 2007; Carrillat et al. 2009;
Dahlgaard-Park 2015; Kranias & Bourlessa 2013). Based on the outcomes of
hypothesis testing in this research, the hypothesis H1 has been supported.
This means the service quality of accounting firms positively affects the
satisfaction of their clients at Nasdaq Stockholm OMX. Subsequently, this
finding is consistent with prior studies which state that service quality
positively affects customer satisfaction.
Additionally, in order to determine the impact of service quality dimensions
which are: tangibles, reliability, responsiveness, assurance, and empathy on
customer satisfaction individually, five sub-hypotheses which are: H1a, H1b,
H1c H1d, and H1e have been examined based on multiple regression analysis
with the aim of providing accounting firms with indicators that allowing them
to identify the dimensions that have strongest impact on customer satisfaction.
Consequently, this will help the accounting firms to invest their efforts and
resources in an effective way.
According to sub-hypotheses testing has been carried out, the reliability
dimension has the strongest impact on customer satisfaction. Consequently,
this result is considered as indicator for the accounting firms. This indicator
states that in order to enhance customer satisfaction the accounting firms have
to adopt procedures and policies that enhance reliability dimension as a key
factor in enhancing customer satisfaction. Where reliability dimension refers to
features such as having accurate records and the capability to deliver promised
services at the planned time confidently. In other words, it refers to
faithfulness and credibility (Bearden & Niemeyer 2011; Jain & Gupta 2004;
Parasuraman et al. 1991).
5.3. Discussion of results: Second group
Where, the second group represents the hypotheses regarding the impact of
quality and its dimensions on customer loyalty.
H2: The service quality of accounting firms positively affects the loyalty of
their clients at Nasdaq Stockholm OMX. Besides other sub-Hypotheses which
45
examine the impact of service quality dimensions on customer loyalty H2a,
H2b, H2c H2d, and H2e.
With regards to Hypothesis H2, the study has concluded based on the simple
regression analysis that the service quality of accounting firms positively
affects the loyalty of their clients at Nasdaq Stockholm OMX. Hence, the
hypothesis H2 is supported. Also, this finding is consistent with prior studies
that have concluded that service quality positively affects customer loyalty
(Bloemer et al. 1999; Carrillat et al. 2009; Dahlgaard-Park 2015; Jasinskas et al.
2016; Kranias & Bourlessa 2013; Mohd-Sanusi et al. 2012; Yildiz 2017). In
short, enhancing service quality leads to enhance client loyalty.
Further, in order to provide accounting firms with indicators that enable them
to determine the dimensions that have strongest impact on customer loyalty.
The thesis has examined the influence of service quality dimensions which are:
tangibles, reliability, responsiveness, assurance, and empathy on customer
loyalty individually. Accordingly, five sub-hypotheses which are: H2a, H2b,
H2c H2d, and H2e have been tested based on multiple regression analysis.
The sub-hypotheses testing results show that both the responsiveness and
assurance dimensions have the strongest impact on customer loyalty. This
provides the accounting firms with guidelines. These guidelines indicate that in
order to enhance customer loyalty, accounting firms must focus their efforts
and invest their resources to enhance both responsiveness and assurance
dimensions. Consequently, this will help the accounting firms to invest their
efforts and resources in an effective way. Where responsiveness (helpfulness)
measuring the response features and the willingness to assist clients and offer
prompt service. While assurance dimension measures the knowledge,
competence, and ethical conduct of the staff and their ability to spread trust
and confidence (Bearden & Niemeyer 2011; Jain & Gupta 2004; Parasuraman
et al. 1991).
46
6. Conclusion
This chapter displays the conclusion of the research project, in addition to
the expected managerial implications, and finally the limitations and
suggested research for further reflection.
The thesis aims to evaluate the service quality and its dimensions of
accounting firms based on the perception of Swedish listed companies at
Nasdaq Stockholm OMX, in their capacity as clients of the accounting firms.
Also, it seeks to examine the impact of service quality and its dimensions on
customer satisfaction and customer loyalty.
As mentioned, previous studies have suggested that service quality positively
effects client satisfaction and client loyalty. Accordingly, that leads to
strengthen the relationship with clients and enable business to meet the
changes and challenges in its environment such as financial scandals and
collapses, advanced technology, and increasing competition. As a result, that
leads to maintain business continuity and achieves success (Dahlgaard-Park
2015; Gilmore 2003; Ismail et al 2006; King & Fitzgerald 2016).
This research utilizes the SERVPERF as multidimensional model to measure
the statues of accounting service quality based on its dimensions which are
tangibles, reliability, responsiveness, assurance and empathy. This will help in
assessing the contribution of each dimension individually, identify the status of
service quality dimensions (Dahlgaard-Park 2015; Parasuraman & Zeithaml
2002), and determine their influence on client satisfaction and client loyalty.
Consequently, providing accounting firms in Sweden with indicators that help
them to identify the most appropriate procedures they should apply to boost
customer satisfaction and loyalty.
To sum up, regarding the status of service quality and its dimensions, the
thesis concludes that the service quality and all its dimensions have high level
depending on the average value of each concept. Generally, this implies that
the accounting firms in Sweden are aware of changes and challenges in its
environment and they have generally taken the procedures that allow them to
meet them. However, looking at the result from another aspect on the basis of
frequency table reveals weaknesses regarding responsiveness, empathy
dimensions that 22.4 % of respondents give less than five points as an
evaluation of responsiveness dimension for example.
47
Also, concerning the impact of service quality and its dimensions on customer
satisfaction, the thesis concludes that improving services quality in accounting
firms positively affects client satisfaction. However, with regard to the
individual impact of service quality dimensions, the multi-regression analysis
shows that only the reliability dimension has a significant impact on customer
satisfaction. Therefore, this indicates that the accounting firms have to
concentrate their efforts and take the procedures that enable them to improve
reliability dimension in order to boost customer satisfaction effectively.
Last but not least, with regard to the influence of service quality and its
dimensions on customer loyalty, the thesis initially concludes that enhancing
services quality in accounting firms positively affects client loyalty. In contrast,
regarding the impact of dimensions, the multi-regression analysis shows that
both responsiveness and assurance have the strongest and significant impact
on customer loyalty. Therefore, this indicates the most important service
quality dimensions based on client perception.
6.1. Managerial implications
To the researcher’s knowledge, this study is considered as a first attempt
almost that has used the multidimensional model to evaluate service quality in
accounting firms in Sweden.
Approaching quality as a multidimensional concept based on client perception
enables the service managers to determine the status of each dimension
separately, as well as the impact of each of them on customer satisfaction and
customer loyalty. This enables the service provider to identify the key
dimensions that have the strongest impact through clients’ lens. Consequently,
providing service management in accounting firms with indicators that assist
them to apply the most appropriate procedures to each dimension and
concentrate their efforts and resources with the aim of meeting the clients’
quality needs.
Generally, based on customers’ perception the study has concluded that the
levels of the quality and its dimensions are high according to the values of
averages, but at the same time, the study has referred to some weaknesses
based on the frequency table, for instance in the case of responsiveness
dimension where 22.4 % of the respondents gave less than five points to this
dimension. Also, this research has concluded that the reliability dimension has
the significant impact on customer satisfaction. In contrast, both
responsiveness and assurance have the significant impact on customer loyalty.
48
Thereby, the service managers in accounting firms may consider these
dimensions in their policies and procedures in order to get effective result
regards their aims. However, the small size of the sample should be taken into
account as a restriction in generalizing the outcomes.
Therefore, it could be considered that the essential contribution of the study is
emphasizing the importance of measuring service quality dimensions.
Accordingly, from a practical point of view the accounting firm as a service
provider has to evaluate the service quality and its dimensions over years based
on its clients’ perception to select the places of trouble and take the
appropriate actions to treat them quickly and directly. In order to enhance
client satisfaction and loyalty and meet novel challenges in its business
environment.
For instance, if the problem with regard to reliability dimension this maybe
means there is a problem in delivering promised services at the planned time
confidently (Parasuraman et al. 1991). Thus the accounting firm has to
determine the clients who have this problem and the responsible employees in
order to reveal the main reasons behind the trouble and find the solution.
6.3. Limitations and further research recommendations
As mentioned, originally, the service quality has been developed in service
marketing field, and it has frequently been utilized in other research areas.
Further, the market of business services has a complicated setting, overlapping
relationships, and various variables and factors such as service quality,
confirmation, customer satisfaction, trust, commitment, purchase intention,
etc.,(Caruana 2002; Dahlgaard-Park 2015; Wetzels et al. 2000).
Consequently, this thesis has sought to portray and illustrate a part of this large
and complex scene, where it is difficult to study all variables, which is
considered one of the limitations related to this study. At the same time, this
calls for further research to study other variables such as trust, commitment,
and purchase intention as well as well as the relationships and overlapping
roles of these variables in order to draw the other parts in the scene.
Another limitation regards the sample size 58, although it is considered
acceptable and the most respondents are account managers and CEOs which
enhances the quality of the data, having larger sample size is better (Gray
2017).

49
In addition, this thesis has considered all kind of accounting services based on
Swedish listed companies in different fields and industries. Therefore, many
further researches can be suggested on different levels. That implies, for
instance, studying a certain accounting service rather than all services in order
to get a more accurate assessment. Also, other studies may expand the
population to conclude all clients in Sweden not only the clients at Nasdaq
Stockholm, as well studying the accounting firms’ clients in specific business
sector or industry. Besides, further researchers can make use of the size of the
client firm as a control variable to determine if the size plays any role in the
perceived quality of the accounting services.
50
7. References
Aga, M., & Safakli, O. V. (2007). An empirical investigation of service quality and customer satisfaction in professional accounting firms: Evidence from North Cyprus. Problems and Perspectives in Management, 5(3), 84-98.
Anderson, E. & Fornell, C. (2000). The customer satisfaction index as a leading indicator. In Swartz, T. A. & Iacobucci, D. Handbook of services marketing & management. Thousand Oaks: Sage, pp. 255-268.
Arokiasamy, A. A. (2013). The Impact of Customer Satisfaction on Customer Loyalty and Intentions to Switch in the Banking Sector in Malaysia. Journal of Commerce (22206043), 5(1), 14-21.
Ackerman, J.L. (2017). The CPA Firm of the Future. CPA Journal, 87 (5), 71-71.
Ackerman, J.L. (2017b). What CPAs Can Learn from Apple. CPA Journal, 87 (10), 71-71.
Asher, J. (1990). Quantifying quality in service industries. Total Quality Management, 1(1), 89-94
Atkinson, M. (2012). Key concepts in sport and exercise research methods. London: Sage.
Bandyopadhyay, S., & Martell, M. (2007). Does attitudinal loyalty influence behavioral loyalty? A theoretical and empirical study. Journal of Retailing and
Consumer Services, 14(1), 35-44.
Batagan, L., Pocovnicu, A., &Capisizu, S.(2009). E-service quality management. Journal of Applied Quantitative Methods, 4(3), 372-381.
Bakir, S. T. (2004). A distribution-free Shewhart quality control chart based
on signed-ranks. Quality Engineering, 16(4), 613-623.
Bearden, W. O., Netemeyer, R. G. & Haws, K. L. (2011). Attitudes about the performance of business firms, satisfaction and post-purchase behavior, social agencies, and the marketplace. In Bearden, W.O., Netemeyer, R.G. & Haws, K.L. Handbook of marketing scales: multi-item measures for marketing and consumer behavior research, Thousand Oaks, Sage, pp.387-476.
51
Bloemer, J., de Ruyter, K., & Wetzels, M. (1999). Linking perceived service quality and service loyalty: A multi-dimensional perspective. European Journal of Marketing, 33(11/12), 1082.
Bryman, A., & Bell, E. (2015). Business research methods. Oxford: Oxford University Press.
Brill, J. (2008). Mail questionnaire. In Lavrakas, P. (Ed.) Encyclopedia of survey research methods. Thousand Oaks. Sage, pp.442-443. Byrne, D. (2017). What is sampling? Project Planner. 10.4135/9781526408563. Caceres, R., & Paparoidamis, N. G. (2007). Service quality, relationship satisfaction, trust, commitment and business-to-business loyalty. European
journal of marketing, 41(7/8), 836-867.
Caruana, A. (2002). Service loyalty: The effects of service quality and the mediating role of customer satisfaction. European journal of
marketing, 36(7/8), 811-828.
Cronin Jr., J. J., & Taylor, S. A. (1992). Measuring Service Quality: A Reexamination and Extension. Journal of Marketing, 56(3), 55-68.
Cheng, Y., Liu, Y., & Chien, C. 2009. The association between auditor quality and human capital. Managerial Auditing Journal, 24(6),523-541.
Carrillat, F. A., Jaramillo, F., & Mulki, J. P. (2009). Examining the impact of service quality: a meta-analysis of empirical evidence. Journal of Marketing
Theory and Practice, 17(2), 95-110.
Caruana, A. (2002). Service loyalty: the effects of service quality and the mediating role of customer satisfaction. European Journal of
Marketing, 36(7/8), 811-828.
Cory, S., & Huttenhoff, T. (2011). Perspectives of non-public accountants about accounting education and certifications: an exploratory investigation.
Journal of Finance and Accountancy, 6, 77-89. Collis, J., & Hussey, R. (2013). Business research: a practical guide for
undergraduate and postgraduate students. Basingstoke: Palgrave Macmillan.
Davari, A., & Strutton, D. (2014). Marketing mix strategies for closing the gap between green consumers' pro-environmental beliefs and behaviors.
Journal of Strategic Marketing, 22(7), 563-586.
52
Dahlgaard-Park, S. (Ed.) (2015). The Sage encyclopedia of quality and the service economy (Vols. 1-2). Thousand Oaks: Sage.
Easterby-Smith, M., Thorpe, R., & Jackson, P. R. (2012). Management
research. Thousand Oaks: Sage.
General Accounting Officer (GOA). (2003). Accounting Firm Consolidation: Selected Large Public Company Views on Audit Fees, Quality, Independence, and Choice. Report to the Senate Committee on Banking, Housing and Urban Affairs and the House Committee in Financial Services. GAO-03-1158.
Gray, D.E. (2017). Doing Reserach in the Business World. London: Sage Publications.
Green, S. B. (1991). How many subjects does it take to do a regression
analysis? Multivariate behavioral research, 26(3), 499-510.
Gremler, D., & Brown, W. (1996). Service loyalty: its nature, importance, and implications. Advancing service quality: A global perspective, 5, 171-181.
Gilmore, A. 2003. Services marketing and management. London: Sage Publications.
Holbrook, M. B., & Corfman, K. P. (1985). Quality and value in the consumption experience: Phaedrus rides again. Perceived quality, 31(2), 31-
.57
Ismail, I., Haron, H., Nasir Ibrahim, D., & Mohd Isa, S.. (2006). Service quality, client satisfaction and loyalty towards audit firms. Managerial Auditing Journal. 21(7), 738-756.
Jain, S. K., & Gupta, G. (2004). Measuring service quality: SERVQUAL vs.
SERVPERF scales. Vikalpa, 29(2), 25-38.
Jasinskas, E., Streimikiene, D., Svagzdiene, B., & Simanavicius, A. (2016). Impact of hotel service quality on the loyalty of customers. Economic Research-Ekonomska Istraživanja, 29(1), 559-572.
Jankalová, M. (2012). Business Excellence evaluation as the reaction on changes in global business environment. Procedia-Social and Behavioral Sciences, 62, 1056-1060. Kalui, F., & Mbakaya, J. (2014). An Analysis of Audit Quality Attributes and Client Satisfaction for Companies Quoted at The Nairobi Securities Exchange. Scholarly Research Journals, I (V), 764-785.
53
King, R. & Fitzgerald, L. (2016). Challenges facing the accounting profession: maintaining relevance in a changing environment. In Wilkinson, A., Hislop, D. & Coupland, C (Eds.) Perspectives on contemporary professional work. Cheltenham: Edward Elgar Pub. Ltd, pp. 187–210.
Kranias, A., & Bourlessa, M. (2013). Investigating the relationship between service quality and loyalty in Greek banking sector. Procedia Economics and
Finance, 5, 453-458. Knapp, T. (2008). Reliability. In P. J. Lavrakas (Ed.), Encyclopedia of survey research methods. Thousand Oaks: Sage, pp. 714-714. Lavrakas, P. J. (Ed.) (2008). Encyclopedia of survey research methods. Thousand Oaks: Sage. Lewis, B. R. (1989). Quality in the service sector: a review. International
Journal of Bank Marketing, 7(5), 4-12. Mariotti, S., Nicolini, M., & Piscitello, L. (2013). Vertical linkages between foreign MNEs in service sectors and local manufacturing firms. Structural
Change and Economic Dynamics, 25, 133-145.
Manzella, J. L. (2005). Grasping Globalization: Its Impact and Your Corporate Response. Williamsville: Electronic & Database Publishing.
Mohd-Sanusi, Z., Mat-Isa, Y., Mohamed, M., Teck-Heang, L., & Mohd-Iskandar, T. (2012). The importance of financial audit: benefits, challenges and service quality towards client loyalty. In ISBEIA 2012 - IEEE Symposion on Business, Engineering and Industrial Applications, pp. 614-618.
Morris, T., & Empson, L. (1998). Organisation and expertise: an exploration of knowledge bases and the management of accounting and consulting firms. Accounting, Organizations and Society, 23(5-6), 609-624
Mohammed, M. A., Cheng, K. K., Rouse, A., & Marshall, T. (2001). Bristol, Shipman, and clinical governance: Shewhart's forgotten lessons. The Lancet, 357(9254), 463-467.
Nuchsarapringviriya, F., & Fadzil, S. (2015).Service Quality, Customer Satisfaction and Customer Loyalty in Thailand’s Audit Firms. International Journal of Management and Applied Science, 1(5), 34-40.
Oliver, R. (1980). A Cognitive Model of the Antecedents and Consequences of Satisfaction Decisions. Journal of Marketing Research, 17(4), 460-469.
54
Parasuraman, A., Berry, L. L., & Zeithaml, V. A. (1991). Refinement and reassessment of the SERVQUAL scale. Journal of Retailing, 67(4), 420-450.
Parasuraman, A., & Zeithaml, V. A. (2002). Understanding and improving service quality: a literature review and research agenda. In Weitz, B. A. & Wensley, R. Handbook of marketing, London: Sage, pp. 339-367.
Parasuraman, A., Zeithaml, V. A., & Berry, L. L. (1988). SERVQUAL: A Multiple-Item Scale for Measuring Consumer Perceptions of Service Quality. Journal of Retailing, 64(1), 12-40.
Priporas, C. V., Stylos, N., Rahimi, R., & Vedanthachari, L. N. (2017). Unraveling the diverse nature of service quality in a sharing economy: a social exchange theory perspective of Airbnb accommodation. International
Journal of Contemporary Hospitality Management, 29(9), 2279-2301.
Priporas, C. V., Stylos, N., Vedanthachari, L. N., & Santiwatana, P. (2017b). Service quality, satisfaction, and customer loyalty in Airbnb accommodation in Thailand. International Journal of Tourism Research, 19(6),
.693-704
Prus, A., & Brandt, D. R. (1995). Understanding your customers. Marketing Tools, 2(5), 10.
Reheul, A., Van Caneghem, T., & Verbruggen, S. (2013). Auditor Performance, Client Satisfaction and Client Loyalty: Evidence from Belgian Non-Profits. International Journal of Auditing, 17 (1), 19-37.
Richard, J. E., & Zhang, A. (2012). Corporate image, loyalty, and commitment in the consumer travel industry. Journal of Marketing Management, 28(5-6), 568-593.
Roberts, C. M. (2010). What are the ethical considerations in research?. In Roberts, C.M. The dissertation journey: a practical and comprehensive guide to planning, writing, and defending your dissertation, Thousand Oaks: Corwin Press, pp. 31-44.
Ruth, M. (2015). Customer satisfaction. Salem Press Encyclopedia.
Saxby, C., Ehlen, C., & Koski, T.( 2004). Service Quality in Accounting Firms: The Relationship of Service Quality to Client Satisfaction and Firm/Client Conflict. Journal of Business & Economics Research, 2(11), 75-86.
Saunders, M. N. (2011). Research methods for business students, 5. ed. Harlow:
Pearson.

55
Speer, T. L. (1996). They complain because they care. American Demographics, 18(5), 13.
Smart, K. T. (1995). Defining quality in technical communication: A holistic approach. Technical communication, 42(3), 474-481.
Smith, A. (2011). Internal social marketing: Lessons from the field of services marketing. In Hastings, G., Angus, K. & Bryant, C. A. (red.) (2011). The Sage handbook of social marketing. Thousand Oaks: Sage, pp. 298-316.
Trobia, A. (2008). . Questionnaire. In P. J. Lavrakas (Ed.) Encyclopedia of survey research methods. Thousand Oaks: Sage Publications, pp. 653-655. Wetzels, M., De Ruyter, K., & Lemmink, J. (2000). Antecedents and Consequences of Service Quality. In. Swartz, T.A. & Iacobucci, D. (Eds.) Handbook of services marketing and management, Thousand Oaks: Sage, pp. 343-
.356 Wolf, J. (2008). Self-administered questionnaire. In P.J. Lavrakas (Ed.), Encyclopedia of survey research methods. Thousand Oaks: Sage Publications, pp. 804-804.
Yildiz, E. (2017). Effects of Service Quality on Customer Satisfaction, Trust, Customer Loyalty and Word of Mouth: An Application on Cargo Companies in Gümüşhane. Global Journal of Economics & Business, 6(12). Zainuddin, Z. N., & Sulaiman, S. (2016). Challenges faced by management accountants in the 21st century. Procedia Economics and Finance, 37, 466-470 Zaman Groff, M., Slapničar, S., & Štumberger, N. (2015). The influence of professional qualification on customer perceptions of accounting services quality and retention decisions. Journal of Business Economics and Management,
.753-768 ,(4)16
Zeithaml, V.A., Berry, L.L. & Parasuraman, A. (1996), The behavioral consequences of service quality, Journal of Marketing, 60(2), 31-46.

56
8. Appendix

57
