module 8 - further charting
TRANSCRIPT

The Responsible Trader Lessons
The Responsible Trader Lessons
The Responsible Trader’s - POVModule 8 – Further Charting

The Responsible Trader Lessons
The Responsible Trader Lessons
The Responsible Trader’s - POV• The Responsible Trader's POV (Point of View).
• These are my notes, my own additional research and studies on the Topic that I posted, and my personal observations and opinions that I am sharing to further enhance our knowledge and understanding.
• Some of these were previously posted on “The Responsible Trader” thread, Stock Market Pilipinas (www.stockmarketpilipinas.com). This is the latest version of previous posts I made.
• Some of these plus further explanations and discussions will be appearing in my forthcoming book “The Responsible Trader.”

The Responsible Trader Lessons
The Responsible Trader Lessons
Our topic this week is a continuation of Module 2 –Charting Basics where I suggested that you create your own key words for remembering candlestick patterns.
Instead of doing a review of Module 7, let us go over what we have learned so far about candlesticks.
Review of Module 2 – Charting Basics

The Responsible Trader Lessons
The Responsible Trader Lessons
A Japanese candlestickIs composed of two lines. A vertical line called the shadow or wick and the full height represents the trading range.
HIGH
LOW
Two Horizontal Lines representingOpen and Close For the periodUsually connected as Rectangle
CLOSE
OPEN
Shadow or Wick
Shadow or Wick
HIGH
LOW
OPEN
CLOSE

The Responsible Trader Lessons
The Responsible Trader Lessons
Japanese Candlesticks with Real Body and without or very little Wicks or Shadows are called Marubozu
Green Marubozu - Bullish Red Marubozu - Bearish
Close Same as
High
Open Same as
Low
Close Same as
Low
Open Same as
High

The Responsible Trader Lessons
The Responsible Trader Lessons
A Doji is a Candlestick with no Real body. Doji’s signify indecision on the part of the Buyers and the Sellers. There are four of them:
Cross Doji 4-Price DojiGravestone DojiDragonfly Doji
.

The Responsible Trader Lessons
The Responsible Trader Lessons
Japanese Candlestick Charting is better understood by looking at the historical context when the method was developed.
It became popular during the 16th and 17th centuries when the feudal lords waged constant wars with each other. In Japan this era is known as Sengoku Jidai or “Age of Country at War.”

The Responsible Trader Lessons
The Responsible Trader Lessons
This was also the time when the Ninjas were used for stealth missions – to gather information and murder Daimyos or warlords. As a natural consequence, most of the terms used in candlestick charting refer to war, military strategy and the martial arts.
You should not be surprised, therefore, when you see terms like “Dark Cloud Cover, Morning Star, Evening Star, Three White or Black Soldiers, Three Rising Methods, Long White or Black Line,Piercing Lines, Three River Bottoms, Advanced Block etc.

The Responsible Trader Lessons
The Responsible Trader Lessons
Steve Nison, learned about the method in Japan and brought it to the United States.
The method became popular in the U.S. and other countries because it captures market sentiment better than the line charts by providing deeper insight into the direction of the market. It not only illustrates the trend but also the forces underneath it.

The Responsible Trader Lessons
The Responsible Trader Lessons
The most significant candlestick patterns have been thoroughly discussed in the MCTA video so I will no longer discuss them here. I will just focus on some salient points.
There are three simple rules in detecting candlestick patterns and determining possible actions to be taken
1. Size – Larger candles play an important role when identifying patterns.
2. Shape – The shape of the candlestick or pattern determines the type of pattern generated, the possible trading signal and the potential direction of the trend.
3. Location – The location of a candlestick pattern assists in determining the possible trading signal. The location also determines what the pattern is called.

The Responsible Trader Lessons
The Responsible Trader Lessons
1. Size – the larger and more solid the candles, the higher the sentiment
Increasing size of green candles show bullish sentiment
Increasing size of red candles show bearish sentiment
Charts courtesy of Amibroker Charting Software
The Responsible Trader Lessons
The Responsible Trader Lessons
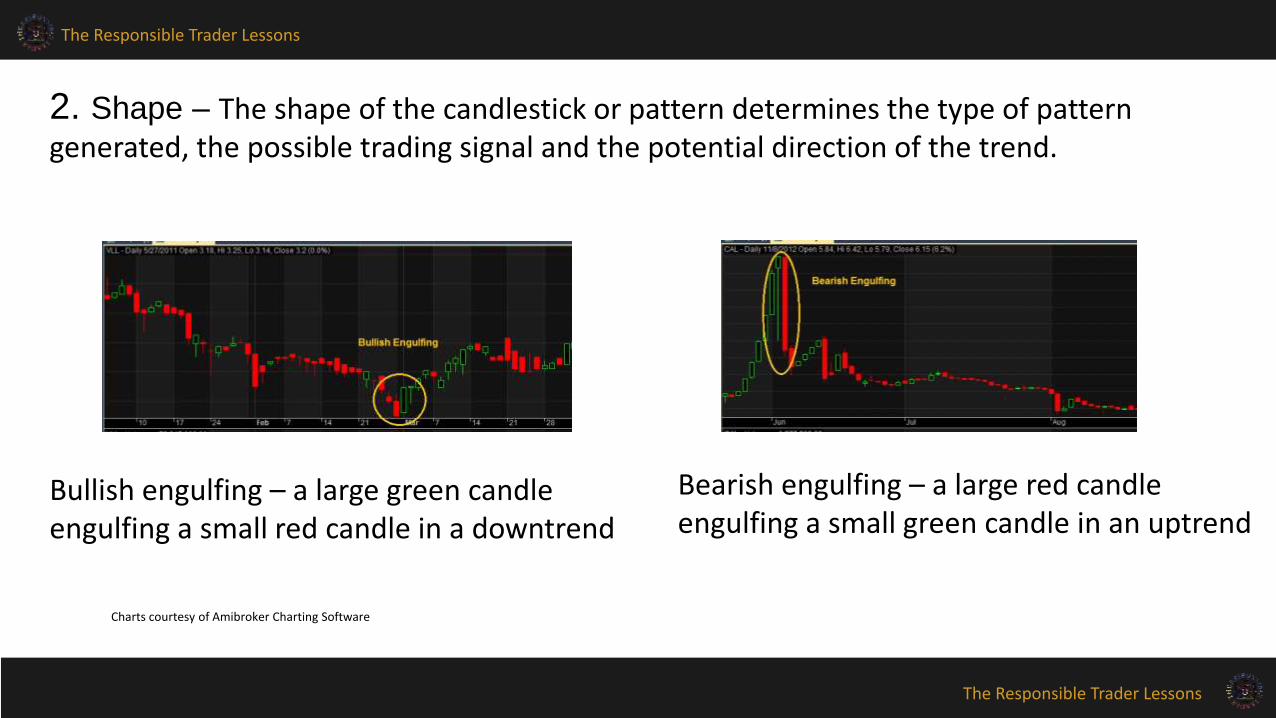
2. Shape – The shape of the candlestick or pattern determines the type of pattern generated, the possible trading signal and the potential direction of the trend.
Bullish engulfing – a large green candle engulfing a small red candle in a downtrend
Bearish engulfing – a large red candle engulfing a small green candle in an uptrend
Charts courtesy of Amibroker Charting Software

The Responsible Trader Lessons
The Responsible Trader Lessons
Single Candle Patterns – the Hammer and the Hanging Man – both have the same shape but their names vary depending on their location.
Hammer in a Downtrend, a Reversal Signal A Hanging Man in an Uptrend, a Reversal Signal
3. Location – determines what the Pattern is called
Charts courtesy of Amibroker Charting Software

The Responsible Trader Lessons
The Responsible Trader Lessons
Candlestick Addition
Just identify the open. Here since the first candle in the series is green, the open for the whole series is the bottom of the first candle’s body. Then you identify the highest in the series and it becomes the high, the lowest in the series becomes the low. Since the last candle in the series is green, the close for the series is at the top of the last candle’s body. The result is a green Marubozu with a small wick or shadow.
You can easily convert a series of candles into one. Below is an example for a series of candles from a 30-minute chart of DNL from COL’s trading platform.

The Responsible Trader Lessons
The Responsible Trader Lessons
Candlestick ReadingIn the absence of additional information , you can read a candlestick by starting with the open and ending with the close. Where you go after the open depends on the color of the candle. If the candle is green you go to the highest price in the trading range then proceed to the lowest of the trading range and vice versa. The candle we saw in the last slide is read as follows:
1) Opened at 16.12
2) Buyers bought it as High as 16.32
3) Sellers sold it as Low as 16.12 same as open
4) But buyers were eventuallyable to close it a16.30 showing thatBuyers are in control
DATA:Open 16.12High 16.32Low 16.12Close 16.30

The Responsible Trader Lessons
The Responsible Trader Lessons
1. Candlesticks should be used together with other forms of technical analysis, trendlines, support and resistance.
2. Candlesticks should be used in connection with clear trends, whether uptrend or downtrend. The candlestick patterns are not useful in a sideways market.
3. The more agreement between signals (candle patterns and technical analysis) the more likely the reversal.
4. The candle line shows the force behind each move, as well as the price.5. The candlestick pattern requires both the shape and the trend.6. A candlestick pattern alone is not justification for a new trade.7. Candlesticks do not give price targets.8. Set stop loss levels by other means and know when you are wrong and must exit the trade.
Principles to be observed when using Japanese Candlesticks

The Responsible Trader Lessons
The Responsible Trader Lessons
Point and Figure Chart On a Point and figure chart, day-to-day price movements are plotted without taking into consideration the passage of time. Point and figure charts are composed of a number of columns that either consist of a series of stacked X's or O's. A column of X's is used to illustrate a rising price, while O's represent a falling price. As you can see from the chart on the left, this type of chart is used to filter out non-significant price movements, and enables the trader to easily determine critical support and resistance levels. Traders will place orders when the price moves beyond identified support/resistance levels.

The Responsible Trader Lessons
The Responsible Trader Lessons
Candle Volume Chart
CandleVolume charts merge volume into candlesticks. This allows chartists to analyze both price action and volume with one look at the price chart.
The charts show candlestick patterns as well as classical chart patterns, such as triangles and wedges, to generate signals.
Charts courtesy of StockCharts.com

The Responsible Trader Lessons
The Responsible Trader Lessons
Three Line Break
Three Line Break charts ignore time and only change when prices move a certain amount. In this regard, these charts are quite similar to Point & Figure charts.
Three Line Break charts show a series of vertical white and black lines. White lines represent rising prices, while black lines portray falling prices. Prices continue in the same direction until a reversal is warranted. A reversal occurs when the closing price exceeds the high or low of the prior two lines.Charts courtesy of StockCharts.com

The Responsible Trader Lessons
The Responsible Trader Lessons
RenkoInvented in Japan, Renko charts ignore time and focus solely on price changes that meet a minimum requirement. The chart got its name from the Japanese word for bricks, "renga".
A renko chart is constructed by placing a brick in the next column once the price surpasses the top or bottom of the previous brick by a predefined amount. White bricks are used when the direction of the trend is up, while black bricks are used when the trend is down. This type of chart is very effective for traders to identify key support/resistance levels. Transaction signals are generated when the direction of the trend changes and the bricks alternate colors.
In this regard, these charts are quite similar to Point & Figure charts. Instead of X-Columns and O-Columns, Renko charts use price “bricks” that represent a fixed price move.
The Responsible Trader Lessons
The Responsible Trader Lessons
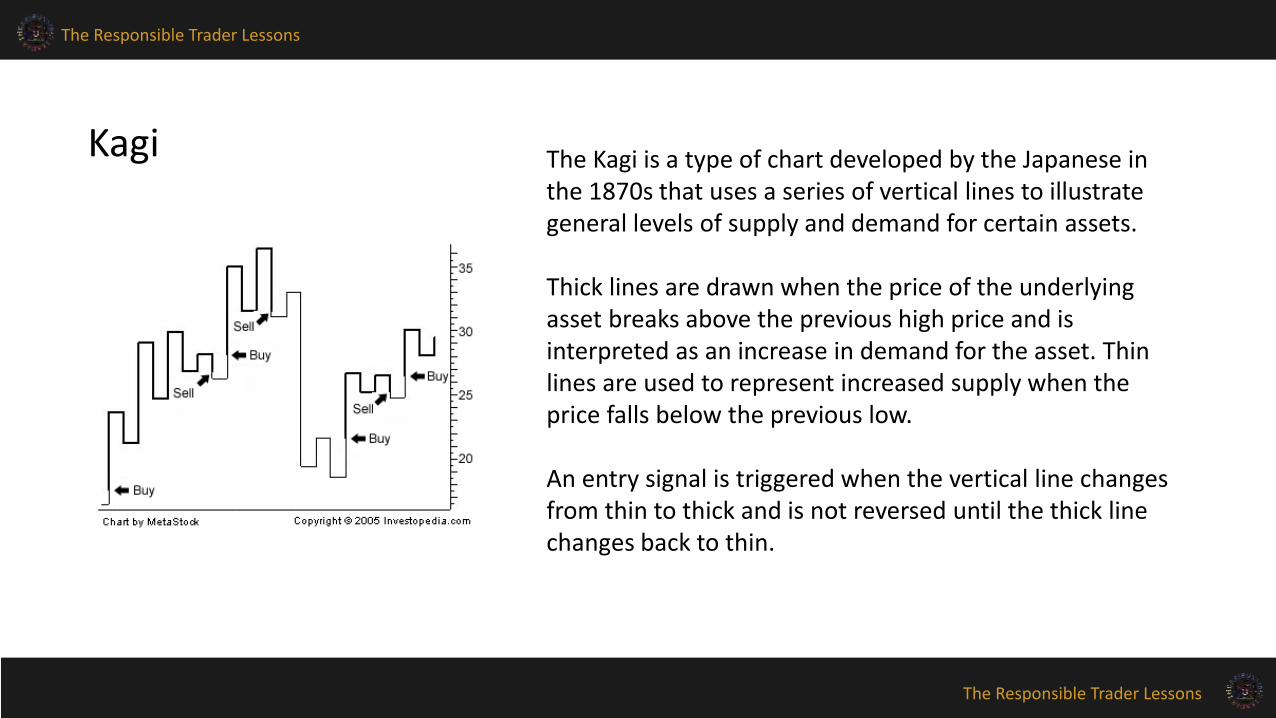
Kagi The Kagi is a type of chart developed by the Japanese in the 1870s that uses a series of vertical lines to illustrate general levels of supply and demand for certain assets.
Thick lines are drawn when the price of the underlying asset breaks above the previous high price and is interpreted as an increase in demand for the asset. Thin lines are used to represent increased supply when the price falls below the previous low.
An entry signal is triggered when the vertical line changes from thin to thick and is not reversed until the thick line changes back to thin.

The Responsible Trader Lessons
The Responsible Trader Lessons
For your information, in connection with my Advocacy, Responsible Trading, I have established the following in order to reach out to you more effectively and serve you better.Please visit, like and share:
My Blog:http://www.theresponsibletrader.com– where I write and share lessons on trading and my thoughts about trading in particular and life in general
My Facebook Page: https://www.facebook.com/theresponsibletrader – where I share what’s on my mind and make posts to groups where I am a member of
My YouTube Channel: https://www.youtube.com/theresponsibletrader – where you can view and download my TRT-POV (The Responsible Trader’s Point of View) and other videos I intend to make
My Slideshare: http://www.slideshare.net/TheResponsibleTrader – where you can view and download copy of the Powerpoint Presentation of my TRT-POV (The Responsible Trader’s Point of View) and other presentations I intend to make