module 5 slides
TRANSCRIPT
Prof. Christian Terwiesch
QualityIntroduction

Prof. Christian Terwiesch
Quality Introduction
I said that the worst thing about healthcare would be waiting, not true; worst thing are defects
Two dimensions of quality: conformance and performance
Our focus will be on conformance quality
Motivating example: the sinking ship / swiss cheese logic

Prof. Christian Terwiesch
Assembly Line Defects
Assembly operations for a Lap-top
9 Steps
Each of them has a 1% probability of failure
What is the probability of a defect?
Prof. Christian Terwiesch
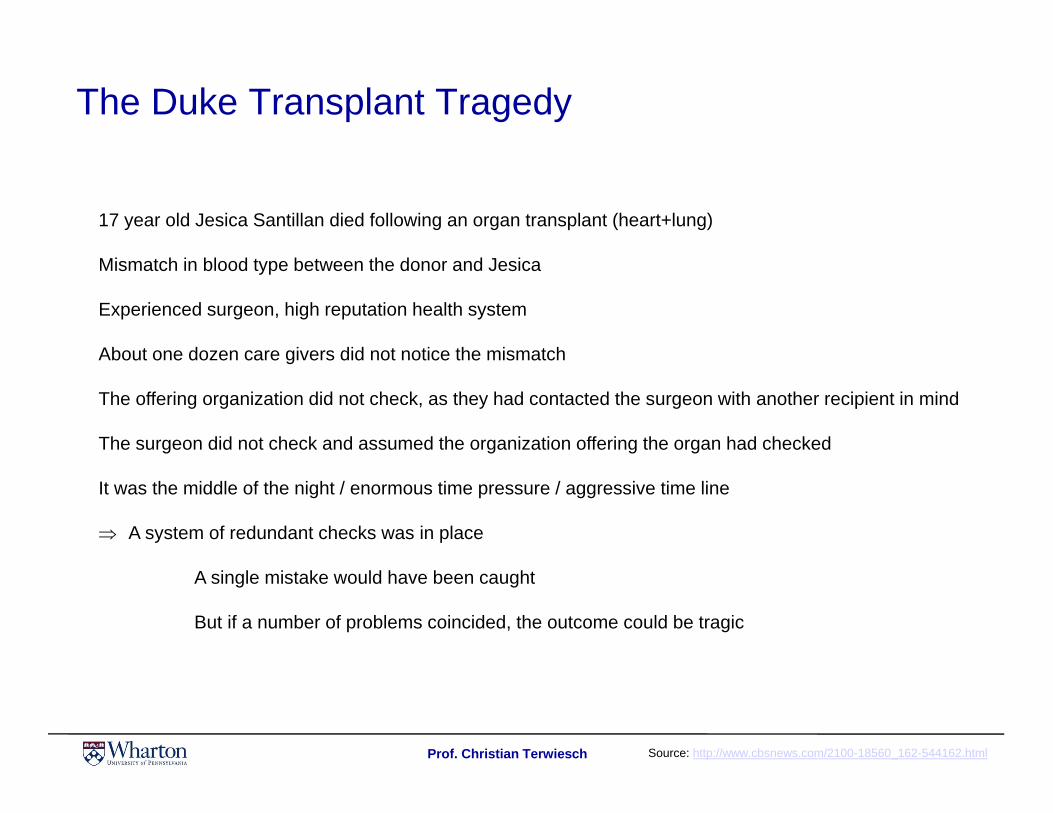
The Duke Transplant Tragedy
Source: http://www.cbsnews.com/2100-18560_162-544162.html
17 year old Jesica Santillan died following an organ transplant (heart+lung)
Mismatch in blood type between the donor and Jesica
Experienced surgeon, high reputation health system
About one dozen care givers did not notice the mismatch
The offering organization did not check, as they had contacted the surgeon with another recipient in mind
The surgeon did not check and assumed the organization offering the organ had checked
It was the middle of the night / enormous time pressure / aggressive time line
A system of redundant checks was in place
A single mistake would have been caught
But if a number of problems coincided, the outcome could be tragic
Prof. Christian Terwiesch
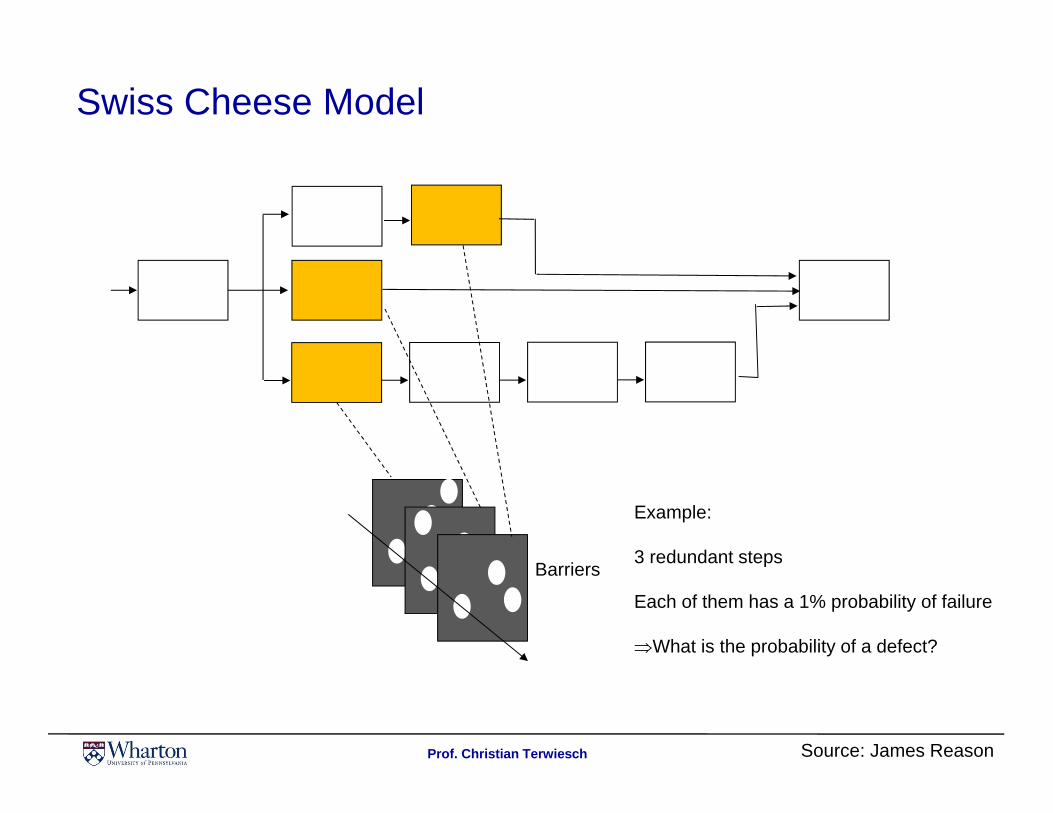
Swiss Cheese Model
Source: James Reason
Barriers
Example:
3 redundant steps
Each of them has a 1% probability of failure
What is the probability of a defect?

Prof. Christian Terwiesch
The Nature of Defects
Assembly line example: ONE thing goes wrong and the unit is defective
Swiss cheese situations: ALL things have to go wrong to lead to a fatal outcome
Compute overall defect probability / process yield
When improving the process, don’t just go after the bad outcomes, but also after the internal process variation (near misses)

Prof. Christian Terwiesch
QualityDefects / impact on flow

Prof. Christian Terwiesch
Impact of Defects on Flow
5 min/unit
4 min/unit50% defectScrap 6 min/unit

Prof. Christian Terwiesch
Impact of Defects on Flow
5 min/unit
4 min/unit30% defectRework 2 min/unit
Prof. Christian Terwiesch
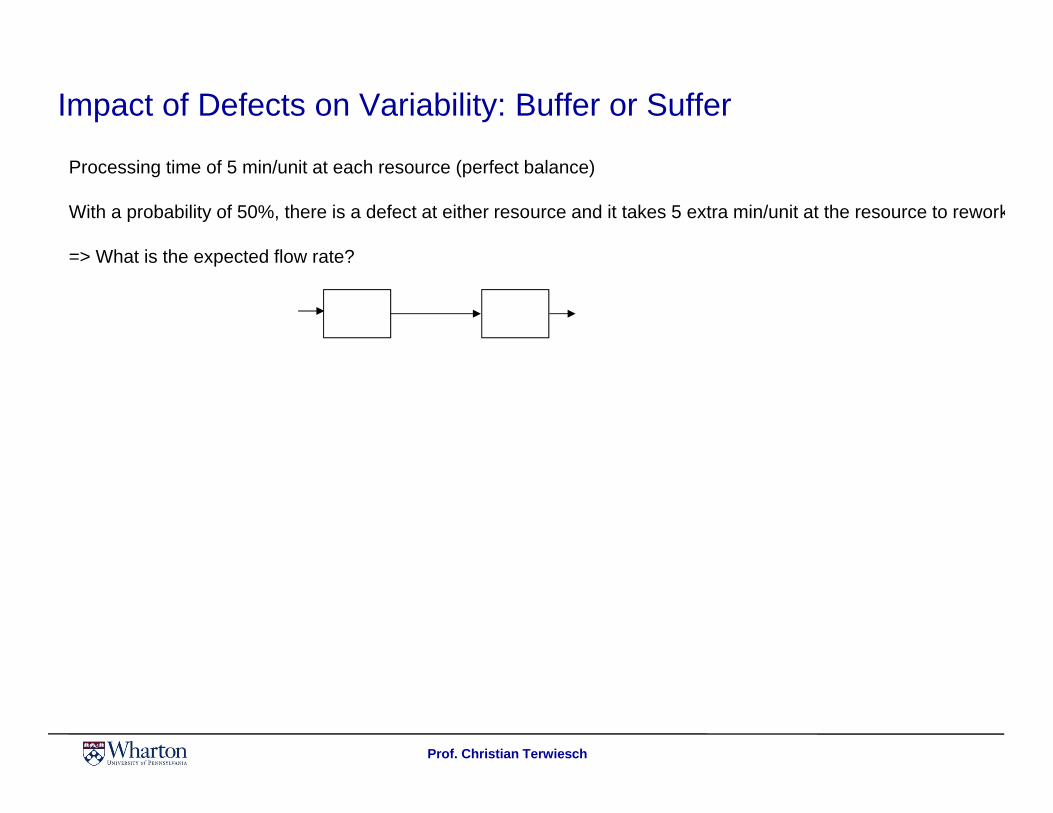
Impact of Defects on Variability: Buffer or Suffer
Processing time of 5 min/unit at each resource (perfect balance)
With a probability of 50%, there is a defect at either resource and it takes 5 extra min/unit at the resource to rework
=> What is the expected flow rate?

Prof. Christian Terwiesch
The Impact of Inventory on Quality
Inventory takes pressure off the resources (they feel buffered): demonstrated behavioral effects
Expose problems instead of hiding them
Inve
ntor
y in
pro
cess
Buffer argument:“Increase inventory”
Toyota argument:“Decrease inventory”

Prof. Christian Terwiesch
Operations of a Kanban System: Demand Pull
• Visual way to implement a pull system• Amount of WIP is determined by
number of cards
• Kanban = Sign board • Work needs to be authorized by demandAuthorize
productionof next unit

Prof. Christian Terwiesch
QualitySix sigma and process capability
Prof. Christian Terwiesch
Gurkenverordnung:http://de.wikipedia.org/wiki/Verordnung_(EWG)_Nr._1677/88_(Gurkenverordnung)
Failure of a pharmacy
Intro: two types of variability
Prof. Christian Terwiesch
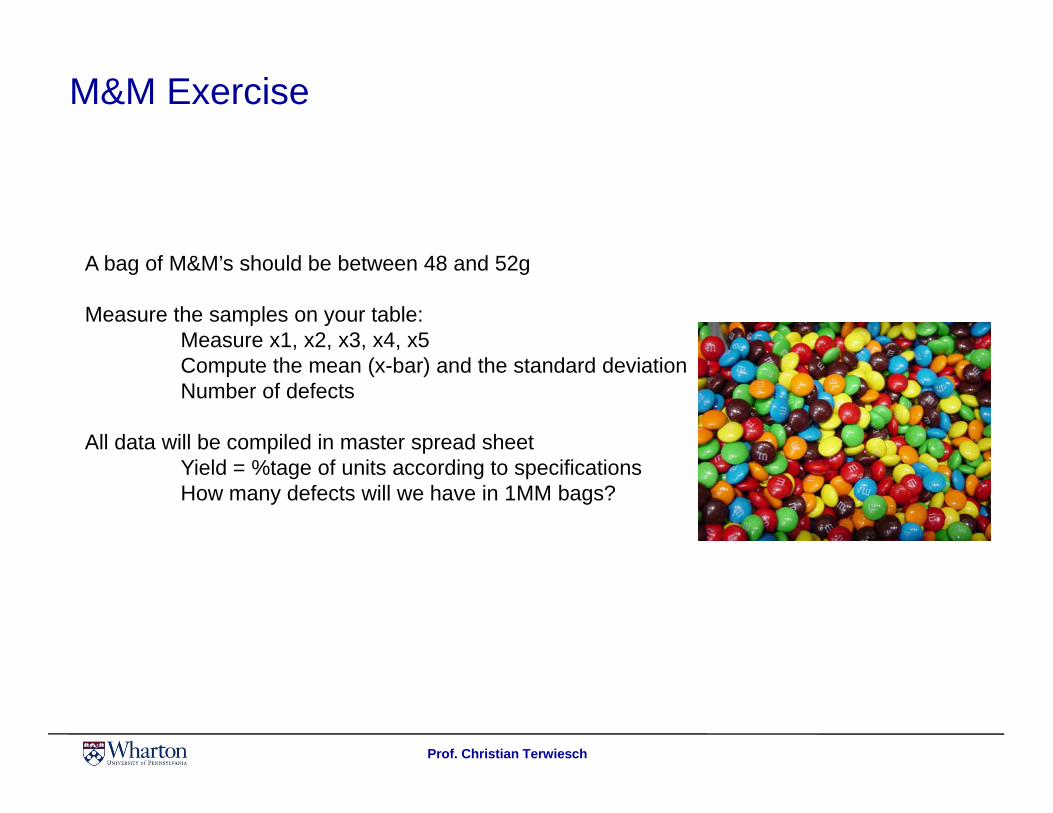
M&M Exercise
A bag of M&M’s should be between 48 and 52g
Measure the samples on your table:Measure x1, x2, x3, x4, x5Compute the mean (x-bar) and the standard deviationNumber of defects
All data will be compiled in master spread sheetYield = %tage of units according to specificationsHow many defects will we have in 1MM bags?

Prof. Christian Terwiesch
Process capability measure
• Estimate standard deviation in excel• Look at standard deviation relative to specification limits
3
Upper Specification Limit (USL)
LowerSpecificationLimit (LSL)
X-3A X-2A X-1A X X+1A X+2 X+3A
X-6B X X+6B
Process A(with st. dev A)
Process B(with st. dev B)
6LSLUSLC p
x Cp P{defect} ppm
1 0.33 0.317 317,000
2 0.67 0.0455 45,500
3 1.00 0.0027 2,700
4 1.33 0.0001 63
5 1.67 0.0000006 0,6
6 2.00 2x10⁻⁹ 0,00
Measure Process Capability: Quantifying the Common Cause Variation
Prof. Christian Terwiesch
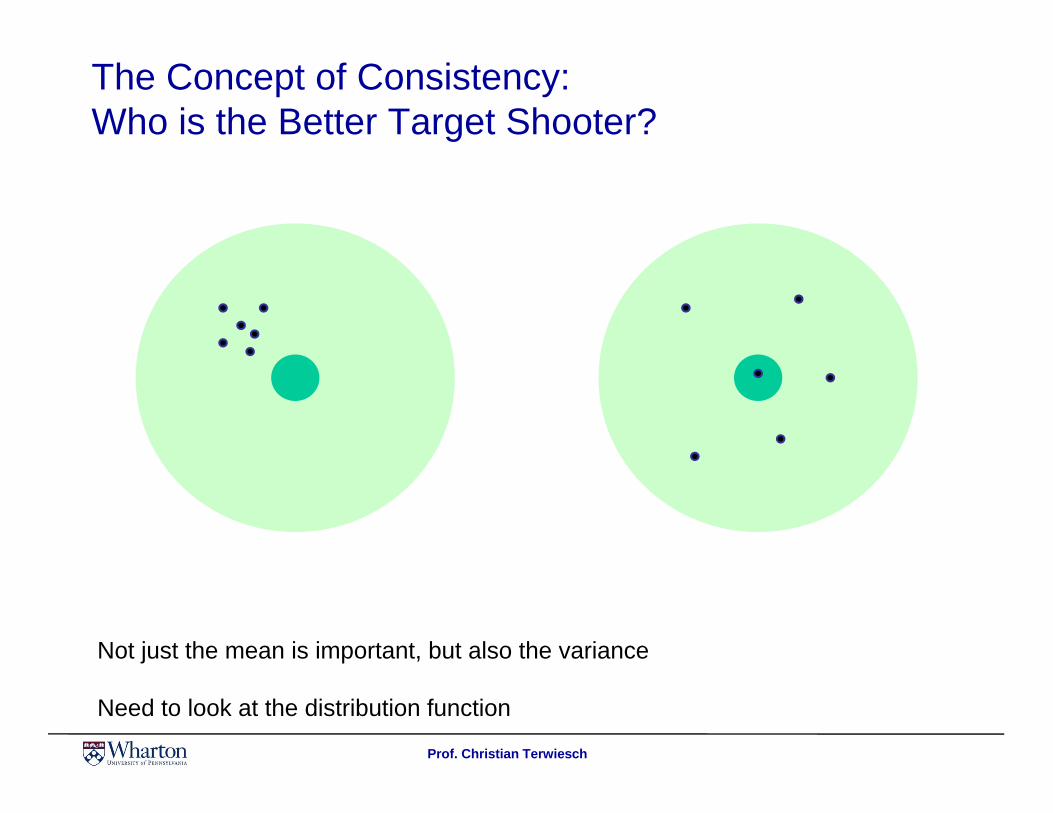
Not just the mean is important, but also the variance
Need to look at the distribution function
The Concept of Consistency:Who is the Better Target Shooter?

Prof. Christian Terwiesch
QualityTwo types of variation

Prof. Christian Terwiesch
Common Cause Variation (low level)
Common Cause Variation (high level)
Assignable Cause Variation
• Need to measure and reduce common cause variation• Identify assignable cause variation as soon as possible• What is common cause variation for one person might be
assignable cause to the other
Two Types of Variation
Prof. Christian Terwiesch
M&M Exercise
Analysis of new sample in production environment
=> Show this in Excel
Prof. Christian Terwiesch
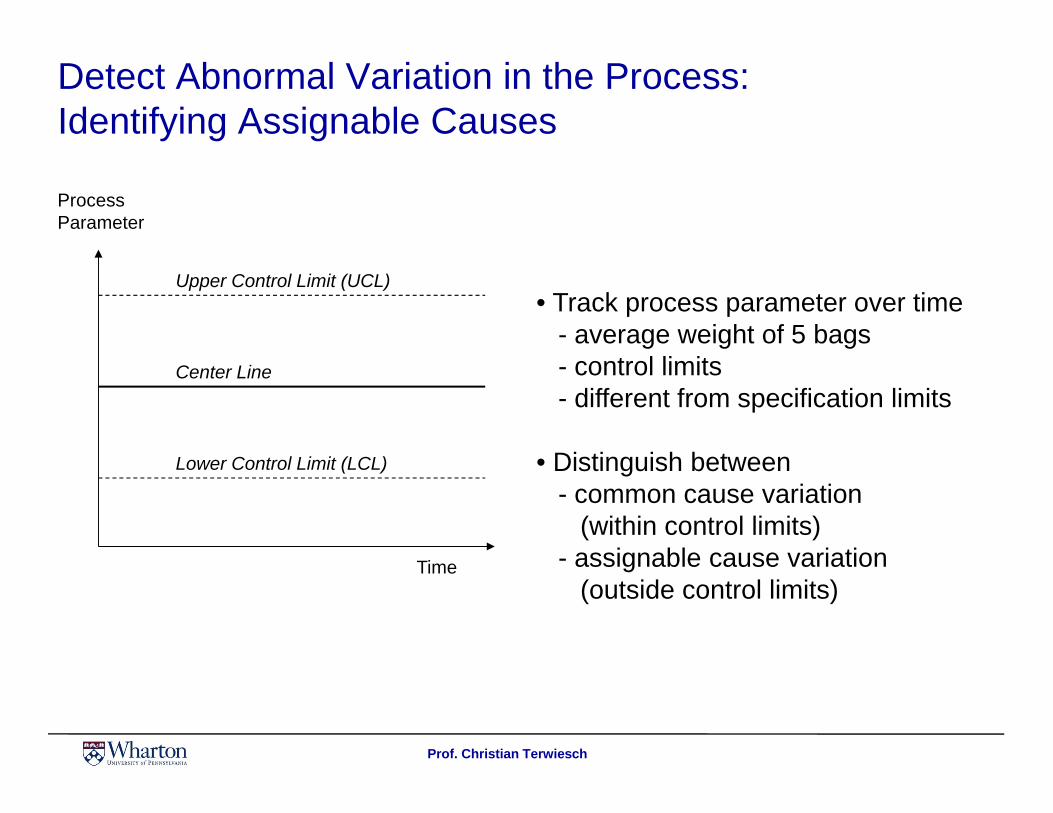
Time
ProcessParameter
Upper Control Limit (UCL)
Lower Control Limit (LCL)
Center Line
• Track process parameter over time- average weight of 5 bags- control limits- different from specification limits
• Distinguish between- common cause variation
(within control limits)- assignable cause variation
(outside control limits)
Detect Abnormal Variation in the Process: Identifying Assignable Causes

Prof. Christian Terwiesch
Statistical Process Control
CapabilityAnalysis
ConformanceAnalysis
Investigate forAssignable Cause
EliminateAssignable Cause
Capability analysis • What is the currently "inherent" capability of my process when it is "in control"?
Conformance analysis• SPC charts identify when control has likely been lost and assignable cause
variation has occurred
Investigate for assignable cause• Find “Root Cause(s)” of Potential Loss of Statistical Control
Eliminate or replicate assignable cause• Need Corrective Action To Move Forward

Prof. Christian Terwiesch
QualityDetect / Stop / Alert

Prof. Christian Terwiesch
71
2345
68
ITAT=7*1 minute
3
1
2
4
ITAT=2*1 minute
Good unit
Defective unit
Information Turnaround Time
Inventory leads to a longer ITAT (Information turnaround time) => slow feed-back and no learning
Assume a 1 minute processing time

Prof. Christian Terwiesch
Cost of a Defect: Catching Defects Before the Bottleneck
What is the cost of a defect?
Defect detected before bottleneck
Defect detected after bottleneck
Bottleneck
Buy pasta / ingredients for $2 per meal
Prepare Cook ServeServe food for $20 per meal
Prof. Christian Terwiesch
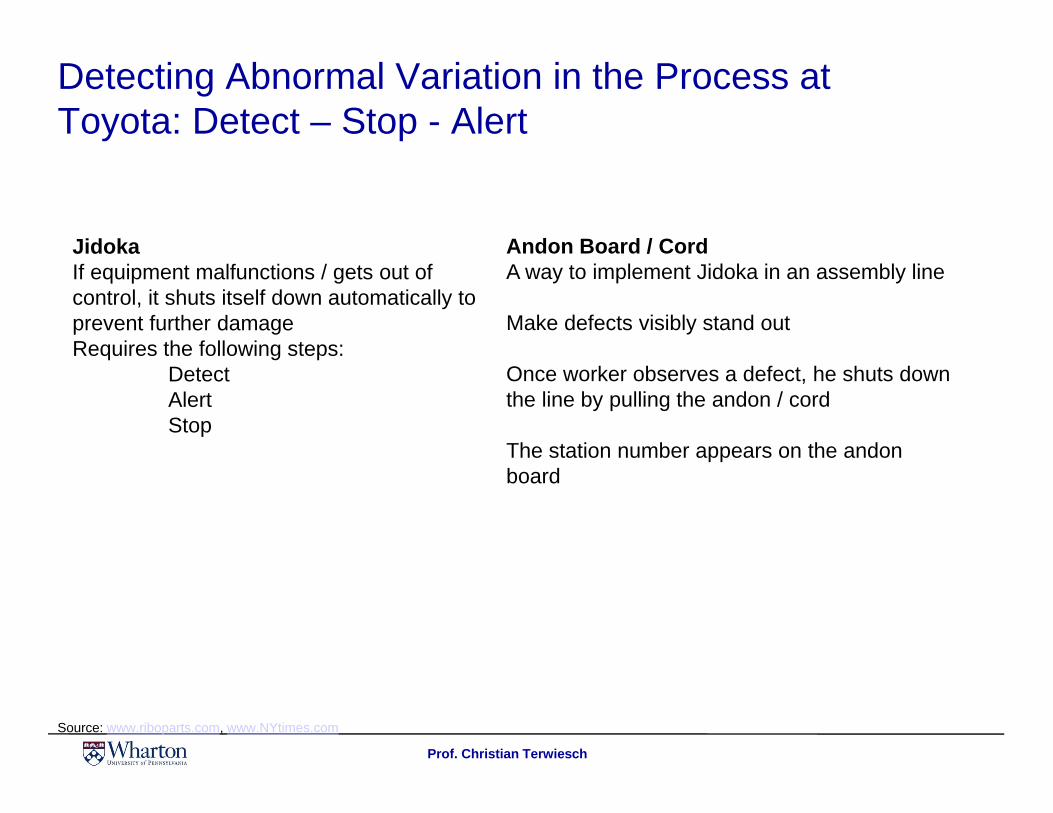
Detecting Abnormal Variation in the Process at Toyota: Detect – Stop - Alert
Source: www.riboparts.com, www.NYtimes.com
JidokaIf equipment malfunctions / gets out of control, it shuts itself down automatically to prevent further damageRequires the following steps:
DetectAlertStop
Andon Board / Cord A way to implement Jidoka in an assembly line
Make defects visibly stand out
Once worker observes a defect, he shuts down the line by pulling the andon / cord
The station number appears on the andonboard
Prof. Christian Terwiesch
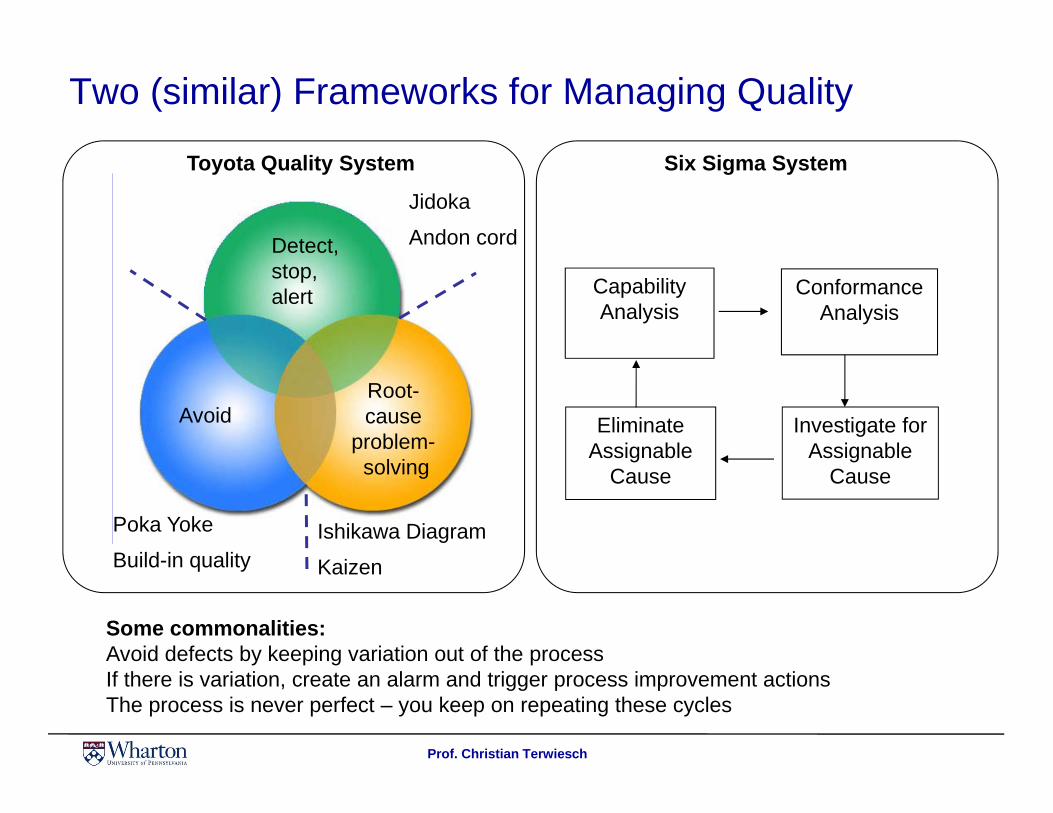
Detect, stop, alert
Jidoka
Andon cord
Root-cause
problem-solving
Ishikawa Diagram
Kaizen
Avoid
Poka Yoke
Build-in quality
Two (similar) Frameworks for Managing Quality
Toyota Quality System
CapabilityAnalysis
ConformanceAnalysis
Investigate forAssignable
Cause
EliminateAssignable
Cause
Six Sigma System
Some commonalities:Avoid defects by keeping variation out of the process If there is variation, create an alarm and trigger process improvement actionsThe process is never perfect – you keep on repeating these cycles
Prof. Christian Terwiesch
QualityProblem solve / improve

Prof. Christian Terwiesch
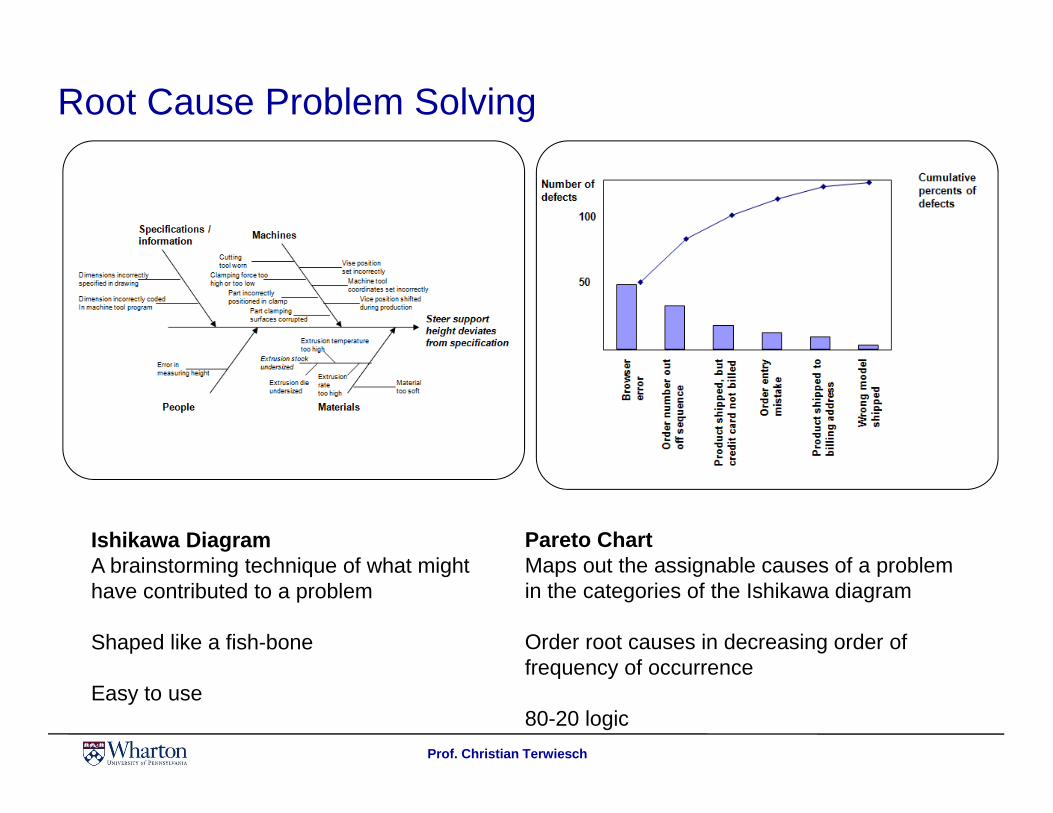
Root Cause Problem Solving
Ishikawa Diagram A brainstorming technique of what might have contributed to a problem
Shaped like a fish-bone
Easy to use
Pareto ChartMaps out the assignable causes of a problem in the categories of the Ishikawa diagram
Order root causes in decreasing order of frequency of occurrence
80-20 logic
Prof. Christian Terwiesch
The Power of Iterative Problem-solvingM
odel
sR
ealit
y
Prof. Christian Terwiesch
Root Cause Problem Solving
Ishikawa Diagram A brainstorming technique of what might have contributed to a problem
Shaped like a fish-bone
Easy to use
Pareto ChartMaps out the assignable causes of a problem in the categories of the Ishikawa diagram
Order root causes in decreasing order of frequency of occurrence
80-20 logic

Prof. Christian Terwiesch
ConclusionLean Operations

Prof. Christian Terwiesch
The Ford Production System
Influenced by Taylor; optimization of work
The moving line / big machinery => focus on utilization
Huge batches / long production runs; low variety
Produced millions of cars even before WW2
Model built around economies of scale=> Vehicles became affordable to the middle class

Prof. Christian Terwiesch
The Toyota Production System
Toyota started as a maker of automated looms
Started vehicle production just before WW2
No domestic market, especially following WW2
Tried to replicate the Ford model (produced about 10k vehicles)
No success due to the lack of scale
Around 1950, TPS was born and refined over the next 30 years Systematic elimination of waste Operating system built around serving demand

Prof. Christian Terwiesch
Introduction
19031st car
19081st Model
T
1911F.W.
Taylor
19131st
movingline
19232.1
millionvehicles/
yearCost USD/unit
19161904 1926
950
360 290Key idea of TPS: systematic elimination
of non-value-adding activities
1933Founded
1946Major strike
1950Start of
TPS
1960sSupplierdevelop-
ment
1980sTrans-plants
Mass production driven by economies of scale impossible– Low production volume (1950):
GM 3,656,000 – Toyota 11,000– Low productivity (Japan 1/9 of US)– Lack of resources
Taylorism: Standardized parts and workpatterns (time studies)
Moving line ensuring working at same paceProcess driven by huge, rapid machinery
with inflexible batch production
Source: McKinsey
Key idea of Ford: cost reduction throughcheap labor and economies of scale

Prof. Christian Terwiesch
Zero non-value added activities (muda)
Production flow synchronized with demand (JIT)One-unit-at-a-time flow
Mixed model production (heijunka)Match production demand based on Takt time
Pull instead of pushSupermarket / KanbanMake-to-order
Quality methods to reduce defectsFool-proofing (poka-yoke) and visual feed-backDetect-stop-alert (Jidoka)
Defects at machines (original Jidoka)Defects in assembly (Andon cord)
Flexibility
Standardization of work
Worker involvementQuality circles (Kaizen)Fishbone diagrams (Ishikawa)Skill development / X-training
Reduction of VariabilityQuartile AnalysisStandard operating procedures
Adjustment of capacity to meet takt-time
Reduce inventory to expose defects
Toyota Production System: An Overview

Prof. Christian Terwiesch
The Three Enemies of Operations
Is associated with longer wait times and / or customer loss
Requires process to hold excess capacity (idle time)
Buffer or suffer
Often times: quality issues
Variability
Use of resources beyond what is needed to meet customer requirements• 7 different types of waste• OEE framework• Lean: do more with less
WasteWork Value-adding
WasteWork Value-adding
Waste
Inflexibility
Additional costs incurred because of supply demand mismatches• Waiting customers or• Waiting (idle capacity)
Capacity
Customerdemand
Source: Reinecke / McKinsey

Prof. Christian Terwiesch
QualityReview Questions

Prof. Christian Terwiesch
Pharmacy Medication ErrorA pharmacy in a Philadelphia suburb wants to investigate the likelihood of making a medication error. There are two ways in which a patient can end up with the wrong medication:- In about 2% of the cases, the doctor fills out the prescription incorrectly. Nobody in the pharmacy catches
these errors- In about 1% of the cases, the pharmacist makes a mistake in picking the medication according to the
prescription. The pharmacy has an internal quality inspection process that catches about 97% of the errors made by the pharmacist.
Another source of quality control is the patients. The pharmacy estimates that about half of the errors made by the physician are recognized by the patient. However, the patient is only able to recognize 10% of the mistakes done at the pharmacy.
What is the likelihood that the patient is presented with a wrong medication?
What is the likelihood that the patient leaves the pharmacy with the wrong medication?

Prof. Christian Terwiesch
Four Step Process with Rework and Scrap Consider the following four step assembly operation with quality problems. All resources are staffed with one operator. - The first resource has a processing time of 4 minutes per unit - The second resource has a processing time of 3 minutes per unit. This process suffers from a high yield
loss and 50% of all products have to be scrapped after this step.- The third resource also suffers from quality problems. However, instead of scrapping the product, the third
resource reworks it. The processing time at the third resource is 5 minutes per unit. In the 30% of the products in which the product needs to be reworked, this extends to a total (initial processing time plus rework) processing time of 10 minutes per unit. Rework always leads to a non-defective unit.
- No quality problems exist at the first and final resource. The processing time is 2 minutes per unit.
For every unit of demand, how many units have to flow through the third step in the process?
Where in the process is the bottleneck?
What is the process capacity?

Prof. Christian Terwiesch
Chicken EggsA farmer focusing on the production of eco-friendly chicken eggs collects the following data about his output. In a sample of 50 eggs, the farmer finds the average egg to weigh 47 grams. The standard deviation of the egg weight is 2 grams and the distribution of weights resembles a normal distribution reasonably closely.
The farmer can sell the eggs to a local distributor. However, they have to be in the interval between 44 grams and 50 grams (i.e., the lower specification limit is 44 grams and the upper specification limit is 50 grams).
What is the capability score of the eco-friendly chicken egg operation?
What percentage of the produced eggs fall within the specification limits provided by the local distributor?
By how much would the farmer have to reduce the standard deviation of the operation if his goal were to obtain a capability score of Cp=2/3 (i.e., get 4.5% defects)?

Prof. Christian Terwiesch
Process capability measure
• Estimate standard deviation in excel• Look at standard deviation relative to specification limits
3
Upper Specification Limit (USL)
LowerSpecificationLimit (LSL)
X-3A X-2A X-1A X X+1A X+2 X+3A
X-6B X X+6B
Process A(with st. dev A)
Process B(with st. dev B)
6LSLUSLC p
x Cp P{defect} ppm
1 0.33 0.317 317,000
2 0.67 0.0455 45,500
3 1.00 0.0027 2,700
4 1.33 0.0001 63
5 1.67 0.0000006 0,6
6 2.00 2x10⁻⁹ 0,00
Measure Process Capability: Quantifying the Common Cause Variation

Prof. Christian Terwiesch
Toyota Word MatchingPlease write the letter corresponding to the most appropriate example or definition from choices (a – k below) on the blank line next to each word below.a) Examples of this include: workers having to make unnecessary movements (i.e. excessive reaching or walking to get tools or parts), working on parts that are defective and idle time.b) A system that enables a line worker to signal that he or she needs assistance from his or her supervisor, for example in the case of a defect. Used to implement the Jidoka principle.c) A brainstorming technique that helps structure the process of identifying underlying causes of an (usually undesirable) outcome d) As an example of this philosophy, workers at Toyota often times make suggestions for process improvement ideas. e) A method that controls the amount of work-in-process inventory f) If an automotive assembly plant used this technique, the adjacent cars on an assembly line would be mixed models (e.g. Model A with sunroof, Model A without sunroof, Model B, Model B with sunroof), in proportions equal to customer demand.g) Making production problems visible and stopping production upon detection of defects
Please only add ONE LETTER to each of the following terms:
Kanban ____Muda ____Heijunka ____ Andon cord ____ Kaizen ____ Ishikawa ____ Jidoka ____