module 1 - introduction and overview
TRANSCRIPT

Training course to enhance collection of
fisheries and aquaculture statistics
Module 1 - Introduction and overview
2018

2
Background (1/2)
• The Global Strategy to improve Agriculture and Rural Statistics,(Global Strategy (GS)), aims to build national statistical systems’technical capacity to produce a minimum set of core agricultural datain the crop, livestock and fishery sectors.
• Knowledge of the status and trends of capture fisheries, includingtheir socio-economic aspects, is key to sound policy development,better decision-making and responsible fisheries management.
• Based on a series of guidelines and technical handbooks, the GS hasprepared training materials to be used in workshops and academiccourses.

3
Background (2/2)• The GS, together with FAO, has developed several guidelines on
producing fisheries and aquaculture statistics:
For sample-based fishery surveys, see the technical handbookavailable at http://www.fao.org/3/a-y2790e.pdf
Guidelines to Enhance Small-Scale Fisheries and AquacultureStatistics through a Household Approach:http://gsars.org/en/guidelines-to-enhance-small-scale-fisheries-and-aquaculture-statistics-through-a-household-approach/
Master Sampling Frame for SSF and Aquaculture Statistics(forthcoming)
International Training Course in Fisheries Statistics and DataCollection available at http://www.fao.org/3/a-i3639e.pdf
Brochure on producing quality, cost-efficient and sustainable SSFand Aquaculture Statistics (GSARS, forthcoming)

4
General objectives
• To introduce basic concepts on the importance of fisheries andaquaculture information
• To strengthen the technical capacity of statistical producers(statistical offices and other institutions involved in theproduction of fishery statistics) to set up and operate systems forthe cost-effective collection and compilation of small-scalefishery and aquaculture statistics
• To support broad policy objectives of sustainable harvesting ofaquatic resources, food security and economic sustainability
• To respond to pressing Sustainable Development Goals andnational policy goals

5
Specific objectives• At the end of this training, participants will be able to:- Define concepts and list indicators related to SSF and
aquaculture, and understand their importance in facilitatingpolicy development and better decision-making
- Understand and apply appropriate concepts to set surveydesigns, and collect and compile statistics on SSF andaquaculture
- Gain awareness of the technologies available to assist dataproducers in setting up and operating cost-effective andquality data collection and compilation
- Sustain the technical capacity gained through continuous self-learning, using the GSARS knowledge resources availableonline and through peer-to-peer knowledge transfer

6
Target audience
Training module
Audience
Ministries of fishery/agriculture and national statistical offices Training centres
Top management
Survey managers/supervisors
Statisticians Technical/analytical staff
Teaching staff & students
1.Rationale, concepts, classifications & indicators in SSF& aquaculture
√ √ √ √ √
2. Refresher on biostatistics and statistics x √ √ √ √
3. Fish total catch data through landing & effort surveys x √ √ √ √
4.
Socio-economic, nutrition and conservation data through pop/agric. censuses and survey approaches
x √ √ √ √
5.CAPI and data analysis technology to support data collection and compilation
x √ √ √ √
6. Demo of OPEN ARTFISH x √ √ √ √

Training course to enhance collection of fisheries and
aquaculture statistics
Module 1 – General introduction:rationale, concepts, classifications and indicators of SSF and aquaculture statistics

8
Module 1: Rationale, concepts, classifications & indicators in SSF & aquaculture
Outline
1. Definitions of Small-Scale Fishery (SSF) and aquaculture
2. Rationale
− WHY collect information on SSF and aquaculture
− WHY capacity development in collecting SSF and aquaculture statistics
3. Indicators of SSF and aquaculture statistics
4. International classifications used to harmonize collection and reporting of statistics of SSF and aquaculture

9
Definition of Small-Scale Fishery (SSF)
and aquaculture 1

10
Introduction• The fishery sector is a complex system of interacting factors,
involving the state of biological resources as well astechnological, economic and sociocultural issues
• Data on fishery statistics, fish stocks, fishing operations,fishers, fishing communities and the environment arenecessary to maintain harvesting regimes that minimizenegative impact on habitats and fishing communities
• Food security and poverty alleviation through decentlivelihoods are achieved on the basis of sound informationcollected from communities involved in both SSF andaquaculture

11
• Fisheries are harvested for their value (commercial,recreational, subsistence)
• Marine fisheries cover those that obtain fish from oceansand seas (coastal, offshore, etc.)
• Inland fishers include those who capture fish from freshwater resources (open water, flooded water)
• Post-harvest: Fresh or Preserved (dried, smoked, salted... )
Introduction

12
Capture fisheries can be classified as • Industrial fishing
• Small-scale and artisanal fishing
©FAO/J. Cort / FAO
Introduction

13
Post harvest/drying fish in UgandaBeach seine
Introduction

14
• Pelagic species: sardines, anchovies, tunas...
• Benthic/demersal species: cods, rays, shrimps, crabs, mussels, oysters
• In fisheries, the term fish is used as a collective term and includes themajor commercial fish species groups: finfish, mollusks (such ascuttlefish, octopus), and crustaceans (shrimps, lobsters, etc.)
Introduction

15
Small-Scale Fishery (SSF)
• SSF is a fisheries subsector that encompasses all activities alongthe value chain of aquatic resources (marine and freshwater), atpre-harvest, harvest and post-harvest. SSF provide nutritious foodfor local, national and international markets and thus play animportant role in food security and poverty eradication.
• There is no agreed definition at global level, as SSF is highlydynamic and diverse (depending on fishing vessel size, theoperational distance from shore, level of mechanization, etc.)
• FAO Voluntary Guidelines for Securing Sustainable Small-Scale Fisheries in theContext of Food Security and Poverty Eradication (the SSF Guidelines) is thefirst internationally agreed instrument to be dedicated entirely to theimmensely important – but until then often neglected – SSF sector:http://www.fao.org/3/i4356en/I4356EN.pdf

16
Small-Scale Fishery (SSF)• Post-harvest processing includes unloading, sorting/grading,
bleeding/gutting/washing, preserving, and processing andstorage, as well as the activities relating to selling own products
• Collecting reliable and informative data from SSF is difficultbecause of the scattered distribution of landing sites (oftenlocated in inaccessible areas) with a multitude of seasonallyshifting fishing techniques that target dynamic multispecies fishpopulations

17
• Aquaculture refers to the farming of aquatic organisms, includingfish, molluscs, crustaceans and aquatic plants
• “Farming” refers to some form of intervention in the rearingprocess to enhance production, i.e. regular stocking, feeding andprotection from predators
• “Farming” also implies the individual or corporate ownership ofthe stock cultivated and harvested
• Aquatic organisms that are exploitable by the public as acommon property resource, with or without appropriatelicenses, are the harvest of fisheries – not aquaculture
• For statistical purposes, aquatic organisms that are harvested byan individual or corporate body that owned them throughouttheir rearing period are considered aquaculture outputs
Aquaculture

18
• Aquaculture production specifically refers to output fromaquaculture activities, which are designated for final harvest forconsumption. Output is reported in weight (generally in tonnes oflive weight equivalent for aquatic animals, in wet weight for aquaticplants). Aquaculture production is reported in the FAO Yearbook byculture environment, of which there are three: freshwater,brackishwater and marine water.
• Hatchery production specifically refers to production of seed fromindoor or outdoor hatchery/nursery facilities and is usually reportedin numbers.
http://www.fao.org/fishery/collection/global-aquaculture-production/en
Aquaculture

21
RATIONALE2 1. Why collect information on SSF and aquaculture?
2. Why foster capacity development in collecting information on SSF and aquaculture?

22
Introduction• Biological and environmental data are obtained
from ad hoc scientific research• The output/production of capture fishery from sea
and inland waters is obtained from routine sample-based catch and effort surveys (i.e. routine data collection)
• Socio-economic data on fishers and fishing communities are obtained through household surveys and community surveys

23
Sampling FRAME
WHY SSF and aquaculture statistics is important?
Manage natural resources (fish stocks)
Measure contribution to development (SDGs)
Meet international data commitments
Fishery management forsustainable harvesting Food security
United Nations Fish Stocks Agreement, Art. 8, Code of
conduct for responsible fisheries, Art. 7.4.4
Obligation of States to report fisheries statistics to FAO under Article XI of the
FAO Constitution
Overfishing detection Poverty alleviation
Fisheries dependent and independent information for
stock assessmentGDP contribution
Why statistics?fishery

24
The FAO State of World Fisheries and Aquaculture2018 highlights the critical importance of fisheriesand aquaculture for the food, nutrition andemployment of millions of people.
The fishery and aquaculture sectors provide morethan 20 percent of the average per capita animalprotein intake for 3 billion people (more than 50percent in some less developed countries) and isespecially critical for rural populations, which oftenhave less diverse diets and higher rates of foodinsecurity.
Estimates of fish consumption per capita reached arecord of 20.3 kg/person in 2016.
It has grown steadily in developing regions from6.0 kg in 1961 to 19.3 kg in 2015.
Importance of fisheries and aquaculture worldwide

25
Total fish production in 2016 reached an all-time high of 171 million tons, of which88% was utilized for direct human consumption.Fish among highly traded commodities globally. Global aquaculture production(including aquatic plants) in 2016 was 110.2 million tons, with the first-sale value re-estimated at USD 243.5 billion.
Importance of fisheries and aquaculture worldwide

26
Global trends in world’s marine fish stocks (FAO SOFIA, 2018)
Fish stocks that are within biologically sustainable levels exhibited a decreasingtrend from 90% in 1974 to 66.9% in 2015.
In contrast, percentage of stocks fished at unsustainable levels increased from10% in 1974 to 33.1% in 2015
Importance of fisheries and aquaculture worldwide

27
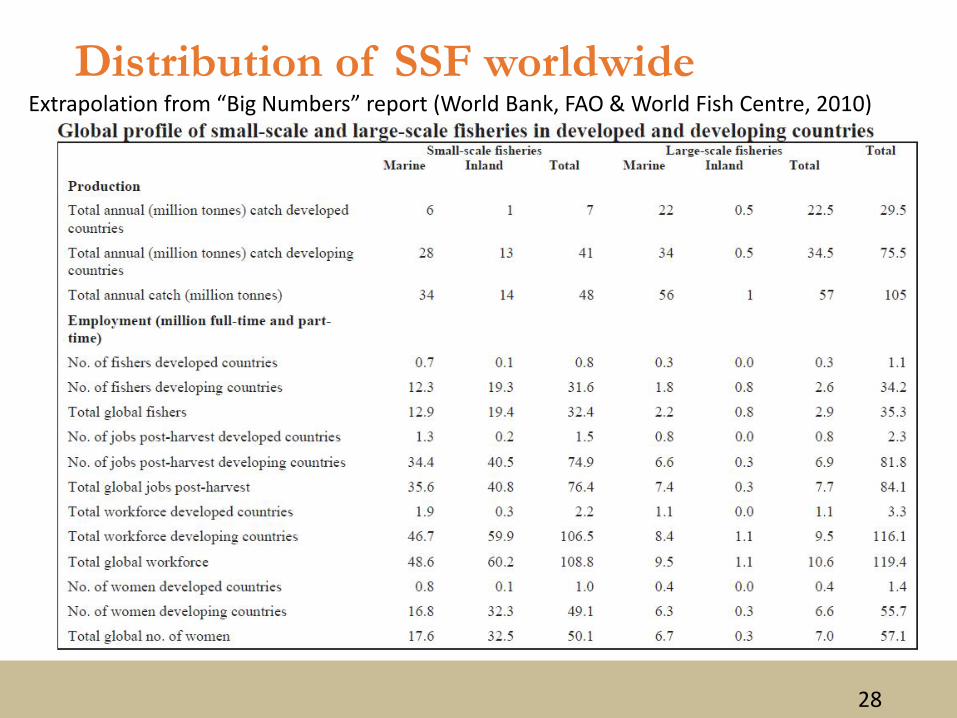
Importance of SSF worldwide• Capture fisheries production (do not include the aquaculture
sector) 105 million tonnes total annual catch
‒ 45.7 percent SSF vs 54.3 percent large-scale fisheries
‒ 71.9 percent from developing countries vs 28.1 percent fromdeveloped countries
45.7 percent, i.e. 48 million tonnes, total annual catch from SSF
‒ 85.4 percent from developing countries
‒ 14.6 percent from developed countries
28
Distribution of SSF worldwideExtrapolation from “Big Numbers” report (World Bank, FAO & World Fish Centre, 2010)

29
Employment in SSF worldwide• SSF employs millions of people on a full-time and part-time basis at pre-
harvest and post-harvest stages• This does not include the aquaculture sector• Figures from “Big Numbers” (World Bank, FAO & World Fish Centre, 2010)
32.4 million fishers ‒ 97.5 percent are from developing countries; 2.5 percent are from developed countries
76.4 million post-harvest jobs ─ 98 percent in developing countries, 2 percent in developed countries
108.8 million global workforce ‒ 97.8 percent in developing countries, 2.2 percent in developed
countries 51.1 million women in global workforce ‒ 98 percent in developing countries, 2 percent in developed countries

30
Sustainable Development Goals (SDGs)
In September 2015, more than 150 world leaders attended the UNSustainable Development Summit to formally adopt an ambitious newsustainable development agenda. Agreed by the 193 Member States of theUN, the Agenda is formally titled “Transforming Our World: 2030 Agendafor Sustainable Development”.
The 2030 Agenda builds on the Millennium Development Goals andconsists of a Declaration, 17 Sustainable Development Goals(SDGs), 169 Targets, a section on means of implementation and renewedglobal partnership, and a framework for review and follow-up. The 2030Agenda went into effect on 1 January 2016.
http://www.fao.org/sustainable-development-goals/indicators/en/

31
Sustainable Development Goals (SDGs)

32
Food and agriculture are key to achieving the entire set of SDGs, and many are directly relevant to fisheries and aquaculture
Sustainable Development Goals (SDGs)

33
Sustainable Development Goals (SDGs)
• E-learning course: SDG Indicator 14.b.1 – Securing sustainable small-scale fisheries
http://www.fao.org/elearning/#/elc/en/course/SDG14B1
• Global database https://unstats.un.org/sdgs/indicators/database/

34
Sampling FRAME
• SDGs and national policy goals put pressure on fishery statistics producers innational statistical systems/fishery ministries to produce statistics on thefishery sector
• SSF and aquaculture contribute significantly to nutrition andlivelihood/economic sustenance, where they are practised
• SDGs and national policy goals now focus on the sustainable development ofthe SSF as a principal contributor to poverty alleviation and food security, bybringing together responsible fisheries and social development in coastal andinland fishing communities around the world
• Statistics are necessary to support the sustainable development of the SSFsector
• This also requires securing information on aquaculture activities at householdlevel (SG1, 2)
Sustainable Development Goals (SDGs)

35
Capacity development in SSF and aquaculture
Challenges in data collection systems in fisheries monitoring include:
• lack of human and financial resources• Insufficiency of capacity/knowledge in fisheries monitoring at
local level• lack of appropriate, cost-effective data collection systems• lack of reliable, adequate and accurate information• Gaps in data collection, processing and analysis

36
• Capacity development activities aim to address SSF and aquaculture data production gaps
• Data gaps can be filled using improved statistical methods, guidelines and training material, covering production of: ‒ Marine and inland water SSF statistics through landing and effort surveys‒ Aquaculture statistics from household surveys ‒ Socio-economic data of fishing households and communities through
census/survey framework
• Focus of capacity development is on achieving sustainability of data collection in the long term
• Thus, capacity is to be developed on collecting SSF statistics data using sample-based approaches that are cost-effective yet provide an acceptable degree of statistical reliability
Capacity development in SSF and aquaculture

37
Indicators for SSF and aquaculture3

38
Policy/required information and indicatorsPOLICY GOAL REQUIRED INFORMATION INDICATORSSustainable management of aquatic resources
Fishing effort Number of fishing vessels, by typeNumber of active fishing days/trips/hoursGear usedMesh size usedOpen/closed seasons
Catch production Catch by species by gearCatch Per Unit of Effort (CPUE) (calculated)
Biological data MSY (calculated)Identify endangered speciesEnvironmental variablesLength frequenciesMaturity statusStomach contentAge (otolith)
Abundance Biomass (calculated)Catch per Unit of Effort (CPUE) (calculated)
Enforcement of management measures and regulations
Incidents with IUU vessels, quantity of IUU fishingComplaints of artisanal fishers vs industrial fishery

39
Policy/required information and indicators
POLICY GOAL REQUIRED INFORMATION
INDICATORS
To create job opportunities within fishing communities
Socio-economic data Number of mature and non-mature members in household (hh)Level of education of each household memberNumber of employed/unemployed per householdIncome level of employed household membersNumber of full-time fishersNumber of people using motorized vessels per communityNumber of fish smokersNumber of fishers per ethnic groupNumber of workers in processingAge distribution in fishing communities
Cultural data Social constraints preventing people from fishing
The following are the policy goals, information required and indicators identified at an SSF workshop in Africa.

40
Policy/required information and indicatorsPOLICY GOAL REQUIRED
INFORMATIONINDICATORS
To ensure food security Disposition of fish production
Post-harvest loss
Import–export (volume & value)
Total fish production EffortCatchFleet structure
Consumption pattern Total populationPer capita consumption
Projected demand and supply
Population growth (including migration)
Availability of fish products to local population
Trends of local prices
No. of cold storages per province/state/local government, etc.
Volume of fish to local marketStorage capacityVolume of fish in cold storage

41
Policy/required information and indicators
POLICY GOAL REQUIRED INFORMATION INDICATORS
To generate foreign earnings
Information on international markets
International pricesSupply and demand in international marketsTrends of international marketsCost of transportationValue and quantity of exported products
Compliance with international regulations and standards
Volume of certified export fish
Knowledge on type of products exported
Quantity, nature, destination of fish exports
Knowledge on the capacity to produce export products
Number of processing units, actors, type of end products
42
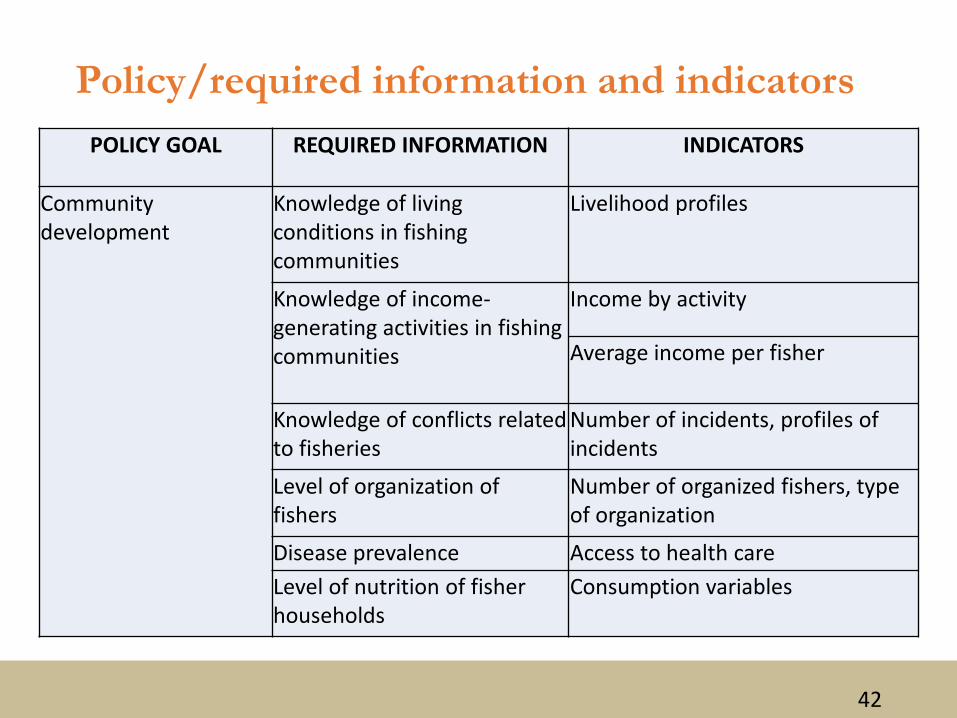
Policy/required information and indicatorsPOLICY GOAL REQUIRED INFORMATION INDICATORS
Community development
Knowledge of living conditions in fishing communities
Livelihood profiles
Knowledge of income-generating activities in fishing communities
Income by activity
Average income per fisher
Knowledge of conflicts related to fisheries
Number of incidents, profiles of incidents
Level of organization of fishers
Number of organized fishers, type of organization
Disease prevalence Access to health careLevel of nutrition of fisher households
Consumption variables

43
Indicators from scientific surveys
• Specialized scientific studies conducted on water bodies and aquatic resources require information to advise on when and how best to harvest aquatic resources, for the purpose of enabling the growth and reproduction of species to replenish exploited stocks. The data sought include:− Biological diversity, stock size and age of biological
diversity− Reproduction rates and growth rate of biological
diversity − Data of impact on ecosystem from environmental
pollution, climate change, etc.

44
Indicators from effort and landing surveys
• Effort and landing surveys are two separate surveys that produce data necessary to estimate total catch (output) and value of total catch of capture fishery for marine or inland waters, such as lakes and major rivers.− Effort surveys provide data on the capacity exerted to catch fish:
boat/vessel type, capacity, attached gear used to catch fish and duration spent on water body catching fish
− Landing surveys provide details on the fish caught and brought to shore, described in terms of species, weight and prevailing price at first sale
− Multiplying effort and landing data enable estimation of total catch, reported by month
− Total catch by species against prevailing price provides the value of total landings, reported by month

45
SSF and aquaculture indicators from households and community surveys
• GSARS has developed:− The household survey approach, to obtain nutritional
and socio-economic data on households practicing SSF and aquaculture
− Indicator or variable lists, to collect data from households and communities practicing SSF and aquaculture

48
International classifications used in fisheries and aquaculture statistics 4

49
The CWP international classifications
Since 1960, the Coordinating Working Party on Fishery Statistics (CWP) hasprovided a mechanism to coordinate the fishery statistical programmes ofregional fishery bodies and other intergovernmental organizations with aremit related to fishery statistics (CCAMLR, EUROSTAT, FAO, GFCM, ICCAT,ICES, IOTC, NAFO and OECD, SEAFO, SPC, WCPFC, etc.).

50
The CWP international classifications• Statistics on fisheries and aquaculture are based on the same concepts and
definitions that are used for national statistics. The definitions are agreedupon by the UN Statistical Commission, the highest decision-making body forinternational statistical activities regarding the establishment of statisticalstandards, the development of concepts and methods, and theirimplementation at the national and international level.
• The CWP supplements these harmonized definitions with concepts that arespecific to fisheries and aquaculture statistics and that are essential tofacilitate the exchange and reporting of data.
• The CWP Handbook is divided into three main sections: (1) Capture fisheries(2) Aquaculture and (3) General concepts and socio-economic statistics thatare of common concern to both activities.http://www.fao.org/fishery/cwp/handbook/M/en
• FAO is the CWP Secretariat and is the custodian and maintainer of the CWPinternational classifications, presented in the CWP Handbook.

51
1) The ASFIS (Aquatic Sciences and Fisheries Information System) list of species for fishery statistics purposes
• The ASFIS list has been in use since 2000 and includes approximately 12 750 species (as at 2017) in six different languages; the author name; and the ISCCAP code.
• Each species is given a unique code.
http://www.fao.org/fishery/collection/asfis/en
The CWP international classifications
52
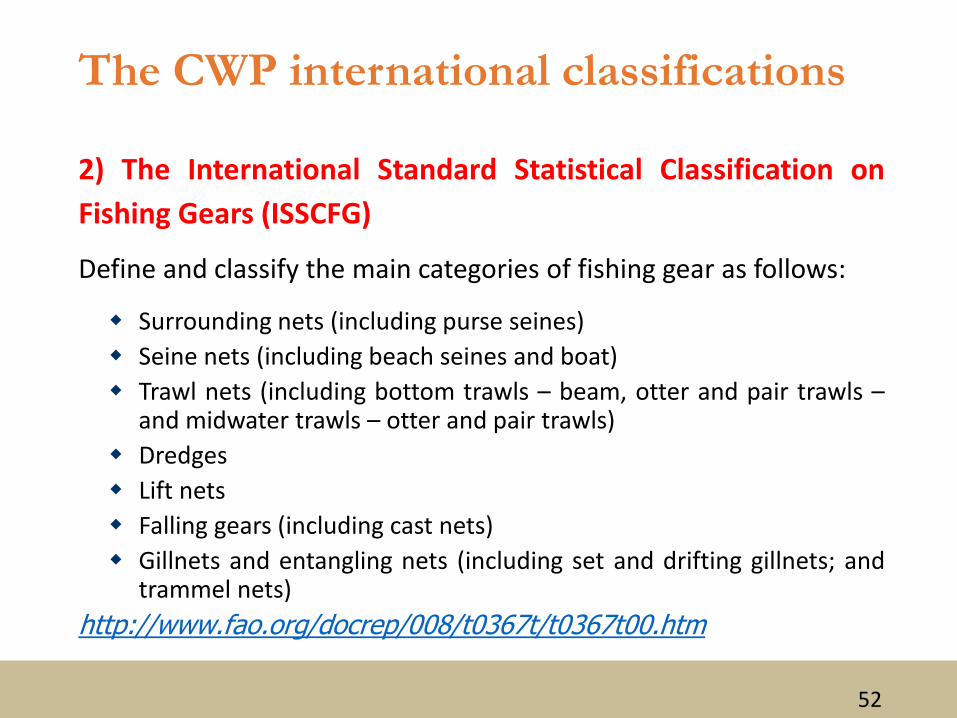
The CWP international classifications
2) The International Standard Statistical Classification onFishing Gears (ISSCFG)
Define and classify the main categories of fishing gear as follows:
Surrounding nets (including purse seines) Seine nets (including beach seines and boat) Trawl nets (including bottom trawls – beam, otter and pair trawls –
and midwater trawls – otter and pair trawls) Dredges Lift nets Falling gears (including cast nets) Gillnets and entangling nets (including set and drifting gillnets; and
trammel nets)http://www.fao.org/docrep/008/t0367t/t0367t00.htm

53

54

55
The CWP international classifications3) The International Standard Statistical Classification of FisheryVessels by Vessels Types (ISSCFV)
Define and classify the main categories of fishing vessel as follows:
http://www.fao.org/3/a-bt983e.pdf

56

57

58
The International Standard Industrial Classification of All Economic Activities (ISIC – Rev. 4) • The Guidelines describe the ISIC activities that are relevant and related to the fisheries
sector
• See the Guidelines to enhance small-scale fisheries and aquaculture through a household approach (p. 101)
The Central Product Classifications (CPC)• Detailed structure and correspondences of CPC Version 2.1 subclasses to ISIC Rev.4,
Harmonized System 2012 and CPC Version 2
• Guidelines to enhance small-scale fisheries and aquaculture (p. 111)
• The Guidelines provide description of the CPCs relevant and related to fisheries sector
These classifications are maintained by UNSD:
https://unstats.un.org/unsd/classifications/unsdclassifications/
Other international classifications

59
References
• GSARS. 2017. Guidelines to enhance small-scale fisheries and aquaculture through a household approach. GSARS Guidelines: Rome. Available at http://gsars.org/en/guidelines-to-enhance-small-scale-fisheries-and-aquaculture-statistics-through-a-household-approach/
• De Graaf, G.J., Nunoo, F., Ofori Danson, P., Wiafe, G., Lamptey, E. & Bannerman, P. 2015. International training course in fisheries statistics and data collection, FAO Fisheries and Aquaculture Circular No. 1091. FAO Publication: Rome. Available at http://www.fao.org/3/a-i3639e.pdf

Thank you