modified homogeneous relaxation model for the r744 trans
TRANSCRIPT

Accepted Manuscript
Title: Modified homogeneous relaxation model for the r744 trans-critical flow
in a two-phase ejector
Author: Michal Haida, Jacek Smolka, Armin Hafner, Michal Palacz, Krzysztof
Banasiak, Andrzej J. Nowak
PII: S0140-7007(17)30394-8
DOI: https://doi.org/doi:10.1016/j.ijrefrig.2017.10.010
Reference: JIJR 3778
To appear in: International Journal of Refrigeration
Received date: 27-6-2017
Revised date: 27-9-2017
Accepted date: 8-10-2017
Please cite this article as: Michal Haida, Jacek Smolka, Armin Hafner, Michal Palacz, Krzysztof
Banasiak, Andrzej J. Nowak, Modified homogeneous relaxation model for the r744 trans-critical
flow in a two-phase ejector, International Journal of Refrigeration (2017),
https://doi.org/doi:10.1016/j.ijrefrig.2017.10.010.
This is a PDF file of an unedited manuscript that has been accepted for publication. As a service
to our customers we are providing this early version of the manuscript. The manuscript will
undergo copyediting, typesetting, and review of the resulting proof before it is published in its
final form. Please note that during the production process errors may be discovered which could
affect the content, and all legal disclaimers that apply to the journal pertain.

Modified homogeneous relaxation model for the R744
trans-critical flow in a two-phase ejector
Michal Haidaa
, Jacek Smolkaa, Armin Hafner
b, Michal Palacz
a, Krzysztof Banasiak
c,
Andrzej J. Nowaka
a Institute of Thermal Technology, Silesian University of Technology, Konarskiego 22, Gliwice 44-100, Poland b NTNU Department of Energy and Process Engineering, Kolbjørn Hejes vei 1d, 7465 Trondheim, Norway c SINTEF Energy Research, Kolbjørn Hejes vei 1d, 7465 Trondheim, Norway
Highlights
The modified homogeneous relaxation model of the R744 two-phase ejector was
proposed.
The application range of the proposed model is for a motive nozzle pressure above 59
bar.
The proposed model improved the motive nozzle mass flow rate accuracy when
compared to the homogeneous equilibrium model.
Abstract
The proposed modified homogeneous relaxation model (HRM) applied to the numerical
model of a CO2 two-phase ejector was numerically investigated and developed based on the
optimisation of the relaxation time (RT) correlation. The optimisation procedure was
performed using a genetic algorithm. The study of the RT definition on model accuracy was
carried out using literature correlations, constant relaxation time, and by comparing the
developed modified HRM with experimental results. The modified HRM showed the higher
accuracy of the motive nozzle mass flow rate (MFR) than that of the other available numerical
models for the subcritical operating regimes and similar high accuracy as the homogeneous
equilibrium model (HEM) for the trans-critical operating regimes. The application range of
the modified HRM was defined for the motive nozzle pressure above 59 bar to predict the
Corresponding author. Tel: +48 32 2371661
E-mail address: [email protected] (Michal Haida)
Page 1 of 46
2
motive nozzle MFR with the relative error below 15%. For the motive nozzle pressure level
below 59 bar, the modified HRM improved the accuracy of the motive MFR prediction by 5%
to 10% compared to the HEM formulation.
Keywords: R744, ejector, two-phase flow, relaxation model, relaxation time,
refrigeration system
Nomenclature
Roman Letter
dP Pressure lift bar
Total enthalpy kJ kg-1
Specific enthalpy kJ kg-1
k Effective thermal conductivity W m-1
K-1
Specific entropy kJ kg-1
K-1
Mass flow rate kg s-1
Pressure bar
t Time s
Temperature K
Velocity vector m s-1
x Local vapour quality
Greek Letters
Void fraction
Non dimensional pressure difference
Relative error %
Relaxation time s
Φ Mass entrainment ratio
Π Pressure ratio
ρ Density kg m-3
Stress tensor N m-2
Vapour generation rate kg m-3
s-1
Subscripts
Page 2 of 46

3
crit Critical conditions
eq Equilibrium state
exp Experimental result
motive Motive parameter
ml Metastable conditions
num Numerical result
opt Optimal value
sat Saturation line
suction Suction parameter
sv Saturated vapour
Abbreviations
EERC Ejector expansion refrigeration cycle
GA Genetic algorithm
HEM Homogenous equilibrium model
HRM Homogenous relaxation model
MFR Mass flow rate
OC Operating condition
OF Objective function
RT Relaxation time
Other symbols
Reynolds averaged
Favre averaged
1 Introduction
Due to the restrictive legal regulations for environmental protection in refrigeration, common
synthetic refrigerants are replaced by environmentally friendly natural refrigerants, such as
carbon dioxide (denoted as R744). R744 is classified as a non-toxic and a non-flammable
fluid with the low global warming potential index GWP of 1, and ozone depletion potential
index of 0. Lorentzen was one of the first researchers who proposed and then patented a trans-
critical carbon dioxide system for automotive air conditioning. This led to the design and
manufacturing of comparative refrigeration systems with CO2 as the main working fluid when
Page 3 of 46

4
compared to the cooling system with the classical synthetic refrigerant, i.e. R134a (Lorentzen,
1990). Currently, the R744 refrigeration systems are mostly introduced in cold climates as the
result of the relatively low efficiency at high surrounding temperatures. One of the solutions
to improve the energy performance of the CO2 trans-critical refrigeration cycle is the
implementation of the two-phase ejector as the main expansion device in the cycle.
The replacement of the expansion valve with the ejector in the CO2 trans-critical vapour
compression cycle improves energy performance as reported in theoretical and experimental
investigations (Sumeru et al., 2012). Li and Groll (2005) analysed the CO2 ejector expansion
refrigeration cycle (EERC) based on the modified non-dimensional ejector solver proposed by
Kornhauser (1990). The authors stated that the coefficient of performance (COP)
improvement of the EERC was more than 16% at the typical air conditioning operating
conditions. The energy performance improvement of the R744 ejector expansion trans-critical
cycle up to 18.6% was indicated by Deng et al. (2007). However, the authors concluded that
the experimental investigation of the R744 refrigeration cycle with a well-designed ejector is
required. Elbel and Hrnjak (2008) presented the experimental investigation of the trans-
critical R744 cycle with a prototype ejector. The experimental results confirmed the energy
performance improvement of the EERC up to 7% and the influence of the ejector geometry
on the COP value. The two-phase ejector with designed geometry, based on the delayed
equilibrium model, improved the energy performance of the R744 refrigeration system up to
8% (Banasiak et al., 2012).
Hafner et al. (2014) presented the design concept of the R744 multi-ejector system with non-
continuously controllable ejectors for a supermarket application. The steady-state simulation
for the ejector constant efficiency of 20% showed COP improvement between 10% at 15 °C
and 20% at 45 °C ambient temperature compared to the reference booster system. Transient
simulations were performed based on the annual variable ambient temperature and annual
variable load profiles for heating and cooling modes for three different climate regions. The
COP for cooling mode increased between 20% and 30% during the winter and 17% in the
Mediterranean region, 16% in Middle Europe, and 5% in Northern Europe during the
summer. Haida et al. (2016) presented the experimental investigation of the R744 multi-
ejector refrigeration system based on energy and exergy analysis. The author stated that the
COP and the exergy efficiency of the multi-ejector system increased up to 8% and 13.7%
compared to the reference parallel-compression system at the typical supermarket operating
conditions.
Page 4 of 46

5
The dynamic simulations and the experimental investigation of the R744 multi-ejector system
indicated high potential of the two-phase ejector implementation in the refrigeration system.
The ejectors designed for such systems should offer high efficiency for the considered
operating conditions. Various complex numerical models were formulated to analyse and
design the CO2 ejectors (Elbel and Lawrence, 2016). The computational fluid dynamics
(CFD) model of the ejector required information about the flow turbulence to properly predict
the mass flow rates of both streams. Mazzelli et al. (2015) investigated the supersonic ejector
performance prediction of different turbulence models based on the experimental and
numerical analyses. The authors stated that each turbulence model predicted the motive and
suction nozzle mass flow rates (MFR) with small differences compared to the experimental
results. The k-ω SST model obtained the best accuracy compared to the ε-based models. The
numerical investigation of the different turbulence models implemented with the numerical
steam ejector model by Besagni and Inzoli (2017) confirmed that the k-ω SST model reached
the best agreement with the experimental data concerning global and local flow quantities.
The homogeneous fluid flow assumption in the numerical model allows for the prediction of
the two-phase flow behaviour inside the ejector. Lucas et al. (2014) used HEM to simulate the
R744 two-phase flow inside the ejector. The numerical results showed the discrepancy of the
CFD model motive nozzle mass flux within 10% and the accuracy of the pressure recovery
was 10% without the suction flow entrainment and 20% with the suction flow. Smolka et al.
(2013) performed three-dimensional modelling of the single- and two-phase flow of a real
fluid based on the enthalpy-based energy equation, in which the specific enthalpy was an
independent variable. The computational model was tested and validated for the single-phase
R141b ejector, and for the two-phase R744 ejector. This approach was successfully followed
in the work of Giacomelli et al. (2016). The foregoing HEM was used to design and
manufacture the multi-ejector expansion pack with four different ejectors with a binary profile
for the R744 parallel-compression refrigeration system (Palacz et al., 2015), which was
experimentally investigated by Banasiak et al. (2015).
Palacz et al. (2017b) used genetic and evolutionary algorithms to optimise the ejector shape of
the R744 two-phase ejector based on the HEM at the operating conditions typical for
supermarket application. The optimisation procedure was performed on four ejectors with
different capacity to maximise each ejector’s efficiency. The authors indicated ejector
efficiency improvement up to 6% compared to the designed ejector for a multi-ejector R744
supermarket refrigeration system. Apart from the numerical investigation and the shape
Page 5 of 46

6
optimisation of the two-phase ejector, HEM was used to analyse the two most common types
of the diesel injector nozzles (Salvador et al., 2015).
Palacz et al. (2015) analysed the HEM accuracy, which was applied to three-dimensional
CFD-based simulations of R744 expansion inside a two-phase ejector. The computational
results of the motive nozzle MFR were compared to the measured MFR for a wide range of
operating conditions. The analysis showed the acceptable application of the HEM approach
for the operating regimes near or above the critical point. Unfortunately, the inaccuracy of the
model increased with decreasing motive nozzle temperature and decreasing distance to the
saturation line. According to Palacz et al. (2015), more complex mathematical models such as
the homogenous relaxation model (HRM) should be used to improve the optimisation tool for
a wider range of the operating conditions.
HRM was proposed by Bilicki and Kestin (1990) as a linearised expansion. The authors
described the difference in HEM and HRM approaches with special attention to a study of
dispersion, characteristics, choking and shock waves. The relation of the empirical correlation
of the relaxation time (RT) and the quality of the flashing fluid was described in Bilicki and
Kestin (1990). Downar-Zapolski et al. (1996) presented the comparison of the results obtained
on the basis of the HRM and HEM solutions and available experimental data. The validation
procedure was performed for one-dimensional flashing water flow to predict the critical
MFRs and the pressure distributions. HRM predicted with good accuracy both the pressure
distributions and the critical MFRs, while HEM underestimated the critical MFRs by over
20% for a small value of inlet sub-cooling (Downar-Zapolski et al., 1996).
The investigation of HRM for the CO2 supersonic two-phase flow through the ejector motive
nozzle was presented in the work of Angielczyk et al. (2010). The numerical results were
validated for three different converging-diverging nozzle diameters with the experimental
results taken from Nakagawa et al. (2009). In addition, a new correlation for the CO2
relaxation time was proposed. The authors concluded that the additional information such as
temperature profiles, quality profiles and critical flow rate would be required to calibrate the
numerical model and define a suitable correlation for the relaxation time.
Brown et al. (2013) developed and validated HRM for the full bore rupture of the dense phase
CO2 pipelines discharge behaviour simulations. The authors presented the impact of the
various constant relaxation times together with the calculated relaxation time based on the
definition given in the study of Angielczyk et al. (2010). According to Brown et al. (2013),
Page 6 of 46

7
the numerical model predicted the discharge behaviour with reasonable accuracy in
comparison to the limited real data. Omission of the delayed phase transition underestimated
the discharge rate of CO2 in the pipelines.
Colarossi et al. (2012) applied HRM for the R744 condensing two-phase ejector simulations
based on the CFD open-source OpenFOAM model proposed by Schmidt et al. (2010). The
CFD model was built based on the Eulerian pseudo-fluid approach. Surprisingly, the
validation procedure of the pressure distribution of the ejector indicated high inaccuracy of
the model in most cases, especially for a refrigeration system with the internal heat exchanger.
According to Colarossi et al. (2012), the assumed motive nozzle inlet boundary conditions
and the turbulence model strongly influenced the pressure prediction of the CFD results.
Similar work was presented in the study of Palacz et al. (2017a) where the accuracy of HEM
and HRM were compared for the R744 two-phase ejector at the operating conditions for
supermarket applications. The relaxation time was defined based on the correlation presented
by Angielczyk et al. (2010). The calculations of both models used the computational tool
called ejectorPL; the results of the motive nozzle MFR and the entrainment ratio were
compared based on the experimental results (Palacz et al., 2015). The authors stated that the
HRM results obtained an accuracy improvement up to 5% compared to the HEM results,
which was possibly caused by the relaxation time formulation.
The aim of this paper is to improve HRM applied in the CFD model of the R744 two-phase
ejector and investigate the influence of the RT definition on the R744 two-phase flow
behaviour. The study of the RT definition on model accuracy was performed using the
literature correlations, constant values of the RT, and the modified RT. The correlation of RT
was the result of the genetic algorithm optimisation procedure integrated with the ejectorPL
computational tool. The constant coefficients that describe the RT correlation were
parametrised to define the limitation of the objective function in the HRM optimisation
procedure. The modified RT correlation was implemented to the modified HRM approach in
order to extend the application range of the proposed model. The numerical results were
validated with the experimental results carried out at the SINTEF Energy Research laboratory
in Trondheim, Norway at typical supermarket refrigeration operating conditions.
2 Methodology
The modification of HRM required information about the mathematical formulation of the
R744 two-phase ejector numerical model. The CFD model approach together with the
Page 7 of 46

8
detailed description of HRM and the main parameters described in the two-phase ejector
performance are presented in the following section.
2.1 HRM model approach
The numerical model of the two-phase flow inside the ejector was formulated based on the
governing equations of mass, momentum and enthalpy conservation at the steady-state listed
below (Smolka et al., 2013):
(1)
(2)
(3)
where the symbols ( ) and ( ) denote the Reynolds- and Favre-averaged quantities,
respectively. In addition, is the fluid density, is the velocity vector, is the fluid pressure,
is the stress tensor, is the total enthalpy, is the effective thermal conductivity and is
the fluid temperature. The additional vapour mass balance equation is defined as the total
derivative of the quality equal to the vapour generation rate divided by the total density.
(4)
where is the vapour generation rate, is the vapour quality. The total enthalpy defined in
Eq. (5) is a sum of the specific enthalpy and the kinetic energy:
(5)
where is the specific enthalpy. According to Downar-Zapolski et al. (1996), the specific
enthalpy and the total density of the mixture can be defined as follows:
(6)
(7)
Page 8 of 46

1
where and are the specific enthalpy and the density in metastable conditions,
respectively, and are the specific enthalpy and the density of the saturated vapour,
respectively, is the void fraction of the mixture. The void fraction is the local quality of the
mixture multiplied by the ratio of the local density and the density of the saturated vapour:
(8)
The vapour mass balance equation presented in Eq. (4) can be defined based on a linearised
expansion proposed by Bilicki and Kestin (1990):
(9)
where and are the instantaneous and the equilibrium quality and is RT. According to
Downar-Zapolski et al. (1996), RT for low pressure (up to 10 bar for water) can take the
form:
(10)
where is the constant reference RT of 6.51e-04 s, and are the constant coefficients
set to -0.257 and -2.24, respectively, and is the non-dimensional pressure difference, which
is given below:
(11)
where is the saturation pressure at given motive nozzle temperature . RT for
higher pressures with the constant coefficients for R744 is defined in the work of (Angielczyk
et al., 2010) in the following manner:
(12)
where is the constant reference RT of 2.14e-07 s, and are set to -0.54 and -1.76,
respectively, and is the other form of the non-dimensional pressure difference adapted for
the supercritical parameters (Angielczyk et al., 2010):
(13)
Page 9 of 46

9
where is the critical pressure of CO2, is the motive nozzle specific entropy and
is the saturation pressure at the given motive nozzle specific entropy. The saturation
pressure defined by the given motive nozzle specific entropy allows for the calculation of the
non-dimensional pressure difference for the motive nozzle temperature above the critical
temperature. The determination of the saturation pressure was shown in Figure 1.
The formulation of RT led to investigation of the correlation of the relaxation time and the
local parameters of the two-phase flow. RT was analysed either as a constant value or for
different values of the constant coefficients. The HRM approach was implemented with the
numerical model of the two-phase ejector. The numerical simulations of the R744 two-phase
flow led to calculation of the two-phase flow behaviour as well as the ejector performance,
which describes the possibility of the suction nozzle flow entrainment by the expanded
motive nozzle flow at increase of the mixed flow pressure. The mass entrainment ratio is
the ejector performance parameter defined as a ratio of the suction MFR and the motive MFR:
(14)
The pressure lift is the ejector specific parameter, which shows the difference of the outlet
pressure and the suction nozzle pressure expressed as:
(15)
The foregoing parameters were used to define the different operating conditions of the two-
phase ejector to perform the modified HRM investigation for ejector performance. The
accuracy of the modified HRM was investigated based on the experimental data.
3 Test campaign
The modified HRM investigation was performed based on the designed R744 two-phase
ejector presented in Figure 2. The ejector was implemented in the multi-ejector module,
which was designed to ensure the maximum system flexibility at different ambient
temperatures and cooling capacities of the refrigeration system (Banasiak et al., 2015). The
set of the main geometry parameters of the designed ejector installed in the multi-ejector
module is presented in Table 1.
Page 10 of 46

12
The operating conditions presented in Table 2 were set for typical supermarket refrigeration
applications. The defined points were selected to perform the analysis in the region for which
HEM and HRM with RT defined in the literature obtained both high and low accuracy of the
motive and suction mass flow rates (Palacz et al., 2017a). The motive nozzle pressure varied
from 50 bar to 95 bar. The numerical investigation is performed for either trans-critical
conditions or subcritical conditions linked to the ambient temperature. The suction nozzle
pressure is related to the evaporation temperature in the medium-temperature evaporator
between -10 °C and -6 °C. The outlet conditions were set to analyse the accuracy of the HRM
model for different values of the pressure lift. For clarity, the motive and suction nozzle
conditions were also presented on p-h diagram in Figure 3.
The set of the operating conditions presented in Table 2 was used to validate the modified
HRM results based on the experimental data carried out at SINTEF Energy Research
laboratory in Trondheim, Norway. The modification of the RT formulation was performed to
minimise the discrepancy of the modified HRM motive nozzle MFR compared to the
experimental data.
4 Computational procedure for the relaxation time modification
The numerical investigation was performed using the commercial ANSYS software on the
ejectorPL platform (Palacz et al., 2015). The purpose of the ejectorPL software is to automate
the simulation process by combining and controlling the geometry together with the mesh
generator ANSYS ICEM CFD, executing the solver in ANSYS Fluent for the flow
simulation, and finally processing the results data for the ejector operation. The ejectorPL is
modified for the different constant coefficients of the RT correlation.
The partial differential equations of the mathematical model were solved based on the
PRESTO scheme for the pressure discretisation and the second-order upwind scheme for the
other variables considered in the CFD model. The coupled method was employed for the
coupling of the pressure and velocity fields. The 2-D axisymmetric ejector geometry was
Page 11 of 46

13
discretised with a fully structured grid of less than 10,000 elements with a minimum
orthogonal quality of 0.9. The wall roughness was set to 2 µm according to the ejectors
manufacturers (Banasiak and Hafner, 2013). The ejector mesh independence study was
provided in the previous studies where the discretisation process was also presented (Smolka
et al. (2013) and Palacz et al. (2016)). The real fluid properties of R744 were approximated
based on data obtained using the REFPROP libraries (Lemmon et al., 2013).
The k-ω SST model was used to model the turbulent flow inside the ejector (Fluent, 2011).
According to Mazzelli et al. (2015), the k-ω SST model showed the best agreement of the
global and local flow parameters inside the ejector. Hence, the foregoing turbulence model
was applied into the CFD model to simulate the flow behaviour inside the R744 two-phase
ejector. During the numerical investigation of the modified HRM, the k-ω SST model
properly predicted the mixing process of both streams inside the pre-mixer and the mixing
chamber. Moreover, the turbulence model indicated local flow vortex for the operating
conditions with the high pressure lift. Hence, the mass entrainment possibility of the motive
nozzle stream was very low or even negligible.
The CFD simulations were performed in two steps. Firstly, the HEM calculations were
computed. The convergence criterion was reached when the MFR imbalance was below 1%
and both motive nozzle and suction nozzle MFRs were stabilised. When the HEM
calculations obtained the convergence criterion, the HRM computations were performed until
the similar convergence criterion was reached. In this manner, the convergence problems for
all the investigated operating points were not observed.
The accuracy of the selected parameter of the numerical model was calculated as the relative
error between the experimental (exp) and the numerical results (num) of the motive nozzle
MFR or the suction nozzle MFR.
(16)
where is the relative error, is the motive nozzle MFR or the suction nozzle MFR given
by the experimental data or the numerical results. The acceptable relative difference between
the experimental and the numerical results was assumed as less than or equal to 10%.
The RT formulation was modified by the change of the constant coefficients. In the first step,
RT was defined as a constant value throughout the ejector to evaluate the influence of the
relaxation on the motive stream expansion process and the mixing process in the mixing
Page 12 of 46

14
section. The mapping of each RT constant coefficient was performed by use of a genetic
algorithm, which had been applied for a shape optimisation (Corriveau et al., 2010; Gallegos
Muñoz et al., 2011; Smolka, 2013a, b). The genetic algorithm was implemented on the
ejectorPL platform to perform the mixer-shape optimisation and the ejector-shape
optimisation by Palacz et al. (2016); (2017b). The aim of the genetic algorithm application
was to minimise the objective function (OF), which is the motive nozzle MFR discrepancy for
the selected number of the cases presented in Table 2.
(17)
where is the total number of selected cases. The population size was 10 individuals per
generation. The uniform crossover between the individuals, jump mutations and creep
mutations were performed with a probability equal to 0.5, 0.02 and 0.04. Elitism strategy was
used to keep the best individual. The optimal solution was obtained after approximately 20
generations. The GA executes the following steps:
1. The control program executes the GA, which generates a population of constants
defined relaxation time parameters
2. The population of sets of relaxation time constants parameters is input to the
computational tool (ejectorPL)
3. The control program obtains the solutions for all individuals in the population, where
solutions are obtained for each of the chosen operating conditions
4. The control code ensures that all of the computational tool processes have finished
5. The computational tool calculates the discrepancy of the motive nozzle MFR for the
all considered OCs and the all individuals
6. The GA processes the computational results to calculate and then evaluate the
objective function OF
7. The RT constants of the best individual (highest OF value) are saved
8. The control code goes to Step 1
The constant coefficients described the RT correlation in Eq. (12) were considered in the
optimisation procedure to minimise the discrepancy of the modified HRM against the
experimental data. The variation range for each selected parameter was set in the following
ranges: , , . The number of
possibilities was 50 for each optimised parameter.
Page 13 of 46

15
The investigation of the RT modification was performed either for the constant value or by
use of the genetic algorithm to improve the modified HRM accuracy compared to HEM and
HRM with the RT correlation presented by Downar-Zapolski et al. (1996) and Angielczyk et
al. (2010) at specific operating conditions.
5 The RT constants investigation
In this section, the RT constants investigation are presented and discussed. The influence of
the different RT constant on R744 two-phase flow behaviour compared to the HEM results
is analysed in Section 5.1. The analysis of the exponent a in Eq. (12) was discussed in Section
5.2. The influence of the exponent b in Eq. (12) was presented in Section 5.3.
5.1 RT constant
The different RT constant values influenced the expansion process and mixing process in
the R744 two-phase flow. Figure 4 presents the pressure distribution along the axis of the
two-phase ejector at the operating conditions represented by three motive nozzle pressure
levels in subcritical and trans-critical regimes. The pressure distribution is shown for the
HEM results and for the RT constant in the range from 10-6
s to 10-3
s related to the HRM
investigation of the R744 two-phase flow inside the pipelines for different presented by
Brown et al. (2013). The increase of RT decreased the pressure in the diverging part. The
pressure level at the end of the motive nozzle is lower for HRM compared to HEM.
Moreover, HRM indicated the shock wave close to the motive nozzle outlet. The expansion
waves were generated earlier in HRM; therefore, for the high relaxation time both streams
were well mixed in the mixer due to stabilisation of the flow velocity. The pressure difference
of HEM and HRM for relaxation time above 10-5
s after the throat was 5 bar, 13 bar, and 5 bar
at OC #2, #11, and #20. The metastable effect decreased the pressure in the motive
converging-diverging nozzle, which resulted in the increase of the critical MFR.
Figure 5 presents the vapour quality distribution along the axis of the two-phase ejector at the
operating conditions presented in Figure 4. Similar to the pressure distribution, the vapour
quality distribution is shown for the HEM results and for the constant relaxation time in the
range from 10-6
s to 10-3
s. The increase of RT constant delayed the evaporation of the
Page 14 of 46

16
motive stream. The vapour quality distribution is close to the HEM results for RT below 10-5
s. For of 10-3
s the motive stream slightly evaporated through the pre-mixing chamber and
the mixer. RT above 10-5
s influenced the mixing process; thereby the mixed stream obtained
the equilibrium state far from the beginning of the mixing section. In the motive nozzle, the
metastable effect delayed the evaporation of the motive stream. Therefore, the density
increased in the motive nozzle due to the superheated liquid flow through the nozzle and the
decrease of the pressure distribution during the increase of RT constant .
Figure 6 presents the velocity field of the motive nozzle, suction nozzle, pre-mixing chamber
and the mixer for different specified RT constant at the operating condition #6 listed in
Table 2. The velocity of the motive stream decreased rapidly after the first shock as a result of
RT increase. The velocity profile for RT of 10-6
s is similar to the velocity profile obtained by
HEM as a result of the metastable effect omission. The motive stream in the diverging part of
the motive nozzle accelerated faster when RT constant was increased as a result of the higher
influence of the metastability. However, the maintenance of RT constant above 10-4
s in
the mixer caused the motive stream to slow down, which affected the lower entrainment of
the suction stream. Therefore, RT constant correlation defined as a function of the void
fraction and the non-dimensional pressure difference led to determining the real metastable
region inside the ejector. The different behaviours of the two-phase flows inside the ejector
for either subcritical or trans-critical operating conditions force setting different relaxation
time coefficients at different motive nozzle pressure ranges.
5.2 Exponent a
The exponent a in Eq. (12) determines the influence of the local void fraction value on the
relaxation time. Hence, the parametrisation procedure of the exponent a was performed to
analyse the accuracy of the HRM motive nozzle MFR. Figure 7 presents the motive nozzle
MFR discrepancy of HRM for different exponents a in the range from -3.0 to 1.0 at OC #12
defined in Table 2. Based on the results presented in Section 5.1, the investigation was
performed for two different RT constants in Eq. (12). The exponent b in Eq. (12) was set to
-1.56 according to Angielczyk et al. (2010). The HRM motive nozzle MFR discrepancy
slightly varied in the range from approximately 21% to 23% for RT constant of 2.14e-07 s.
The best HRM accuracy of approximately 4.0% was obtained for the exponent a of -1.0 and
Page 15 of 46

17
RT constant of 7.0e-06. It can be seen that the increase of the RT constant showed
higher influence of the void fraction parameter on the HRM accuracy. Therefore, the increase
of the exponent a above -1.00 increased the motive nozzle MFR discrepancy of HRM.
Figure 8 presents the contour plots of the HRM absolute pressure in the diverging part of the
motive nozzle, suction nozzle and mixing section for different constants presented in Eq. (12)
at OC #12 defined in Table 2. The exponent a was defined as -1.5 and -1.0 for RT constant
of 2.14e-07 s and of 7.00e-06 s. The exponent b was set to -1.56 according to Angielczyk et
al. (2010). The negligible influence of the void fraction parameter can be observed for low
value of the RT constant due to local low value of the relaxation time. The increase of the
RT constant decreased the local absolute pressure value in the diverging part of the motive
nozzle. Moreover, the change of the exponent a from -1.5 to -1.0 reduced the shock waves in
the pre-mixing chamber for RT constant of 2.14e-06 s. Moreover, the pressure increased
earlier in the mixing section for RT constant of 7.00e-06 s. Hence, the change of the
exponent a influenced on the mixing process of both streams.
5.3 Exponent b
The non-dimensional pressure difference parameter influenced the relaxation time value
based on the local pressure value compared to the saturation pressure and the critical pressure.
Therefore, the parametrisation procedure of the exponent b presented in Eq. (12) was
performed. Figure 9 presents the HRM motive nozzle MFR discrepancy for different
exponents b in the range from -3.0 to 1.0 at the operating conditions #12 defined in Table 2.
In similar to the results presented in Figure 7, the investigation was performed for two
different RT constants . The value of the exponent a was set to -0.54 according to
Angielczyk et al. (2010). The discrepancy of HRM was in the range from approximately 27%
to 32% for RT constant of 2.14e-07 s and the lowest accuracy was obtained for b of -1.25.
The highest HRM motive nozzle MFR accuracy of approximately 6% was reached for the
exponent b of -1.76 and RT constant of 7.0e-06 s. The increase of b above -1.75 increased
the HRM discrepancy up to approximately 21% for b of 1.
Page 16 of 46

18
The influence of the exponent b value on the absolute pressure field of HRM in the diverging
part of the motive nozzle, the suction nozzle and the mixing-section was presented in Figure
10. The analysis was performed for two exponents b of -1.5 and -1.0 at the operating
conditions #13 presented in Table 2. Similar to the investigation of the exponent a presented
in Figure 8 the RT constant was set to 2.14e-07 s and 7.00e-06 s. The exponent a was
defined as -0.54 according to Angielczyk et al. (2010). It can be observed that the change of b
obtained slightly different local values of the absolute pressure at the end of the motive nozzle
and in the pre-mixing chamber for RT constant of 2.14e-07 s. Hence, the increase of the
RT constant up to 7.0e-06 s increased the pressure in the diverging part of the motive
nozzle. Moreover, the exponent b of -1.0 obtained higher local values of the absolute pressure
in the motive nozzle and insignificant pressure difference in the pre-mixer when compared to
b of -1.5. In the mixer, the absolute pressure increased for b of -1.0 when compared to the b
of -1.5 for the RT constant of 7.00e-06 s.
The investigation of each constants presented in Eq. (12) indicated different global and local
values of the two-phase flow parameters inside the R744 related to the influence on the
relaxation time. The proper modifications of the constants for different operating regimes
allows for the improvement of the modified HRM and the application range extension in the
subcritical region.
6 Modified HRM validation
The RT constants investigation indicated high influence of the RT value on the expansion
process in the motive nozzle and the mixing process in the pre-mixing chamber as well as in
the mixer. Therefore, the RT correlation should increase the influence of the metastable effect
in the subcritical operating regime and simultaneously omit the evaporation delay in the trans-
critical operating regime. The modification of the RT correlation was performed by use of the
genetic algorithm to optimise the values of the RT coefficients presented in Eq. (12). The
modified HRM was optimised for three selected pressure ranges, depending on the influence
of the metastable effect on the motive stream evaporation process delay. The subcritical
Page 17 of 46

19
region was defined for two pressure ranges either above 59 bar or below 59 bar to take into
consideration the motive flow evaporation delay for proper motive nozzle pressure level. The
optimised relaxation time coefficients as well as minimum value of the objective function for
each selected motive nozzle pressure range are listed in Table 3. In addition, the optimisation
procedure of each pressure range was performed for four selected operating conditions
presented in Table 2 to investigate the modified HRM accuracy at a wide range of operating
conditions and minimise the computational time of the optimisation procedure. The lowest
OF was obtained for trans-critical operating conditions due to negligible influence of the
metastable effect.
Figure 11 shows the motive nozzle MFR discrepancy of the investigated CFD models at the
operating conditions above the critical point. The results given by HEM and HRM with the
RT correlation defined by Angielczyk et al. (2010) and Downar-Zapolski et al. (1996) were
compared to the modified HRM results. Each investigated numerical model obtained accuracy
within ±10%. The HEM results overestimated the motive nozzle MFR for the motive nozzle
pressure above 85 bar compared to the experimental data. The discrepancy of HEM was
below 5% at operating points close to the critical point. HRM with RT correlation presented
in Eq. (12) increased the motive nozzle MFR at each investigated point. Hence, the HRM
reached higher discrepancy of the motive nozzle MFR than HEM for motive nozzle pressure
above 85 bar. In addition, the motive nozzle MFR of HRM based on the RT correlation
presented by Angielczyk et al. (2010) was overestimated at OC #3 compared to the
experimental data. The motive nozzle MFRs of HRM with RT correlation presented by
Downar-Zapolski et al. (1996) were overestimated for each investigated point besides OC #7
compared to the experimental results. The modified HRM had similar results to HEM. The
modified HRM motive nozzle MFR accuracy was similar to HEM in the trans-critical
operating regime.
The suction nozzle MFR discrepancy of each investigated CFD model at the operating
conditions above critical point is shown in Figure 12. The HEM results had a discrepancy
below 10% at OC #1 and #7. The highest suction nozzle MFR discrepancy was approximately
32%. The different relaxation time correlations significantly influenced the suction MFR.
HRM with RT correlation defined in Eq. (12) had a discrepancy of approximately 40% at OC
#3 and #6. The suction nozzle MFR discrepancy of HRM with RT presented by Downar-
Page 18 of 46

20
Zapolski et al. (1996) was in the range of approximately 12% to 35%. The suction nozzle
MFR accuracy of the modified HRM varied in the range of 15% to approximately 25%.
Therefore, the modified HRM obtained underestimated MFR of the suction stream for the
motive nozzle pressure above the critical point compared to the experimental data as the result
of the defined turbulence model.
The motive nozzle MFR accuracy of HEM, HRM with the literature relaxation time
correlations and modified HRM at the operating conditions in the range of 59 bar to the
critical point are shown in Figure 13. The HEM motive nozzle MFR discrepancy was over
15% at each investigated point. Decreasing the motive nozzle pressure range increased the
underestimation of the HEM motive nozzle flow. The HRM results with the RT correlation
presented by Angielczyk et al. (2010) improved the model accuracy compared to HEM.
Although the HRM discrepancy was over 15% for OC #9, #12 and #13, HRM with the RT
correlation defined by Downar-Zapolski et al. (1996) had better accuracy compared to HEM
and HRM with the RT correlation defined by Angielczyk et al. (2010). The best accuracy was
obtained by the modified HRM at each investigated operating point. The modified HRM
discrepancy of the motive nozzle MFR was below 10% for motive nozzle pressure in the
range from 60 bar to 68 bar. The modified HRM was accurate below 15% at OC #13. The
optimisation of the RT coefficients in the modified HRM led to numerical investigation of the
R744 two-phase ejector with the highest accuracy of the CFD model at motive nozzle
pressure above 58 bar.
Figure 14 presents the suction nozzle MFR discrepancy of HEM and HRMs at the motive
nozzle pressure in the range of 59 bar to the critical point. The HEM results had a similar
entrained flow at OC #9 compared to the experimental data. However, the HEM accuracy of
the suction nozzle MFR was in the range of 15% to 30% at the remaining operating points.
HRM with RT correlation presented by Angielczyk et al. (2010) overestimated the entrained
flow at OC #9; the discrepancy was approximately -20%. The HRM obtained similar suction
nozzle MFR accuracy compared to HEM at OC #10, #12 and #13. At OC #11, the suction
nozzle MFR discrepancy was approximately 20%. The discrepancy of HRM with RT
presented by Downar-Zapolski et al. (1996) was in the range of approximately 5% to 30% at
OC #10, #11 and #12. The entrained stream was overestimated by the HRM at OC #9 and
Page 19 of 46

21
#13; the accuracy was -50% and approximately -1%. The high overestimation of the suction
MFR by both HRMs was obtained due to the high pressure lift and a very small . The
suction nozzle MFR discrepancy of the modified HRM varied in a range from 10% to
approximately 20% at OC #9, #12 and #13. The underestimation of the entrained flow over
40% was obtained at OC #10 and #11.
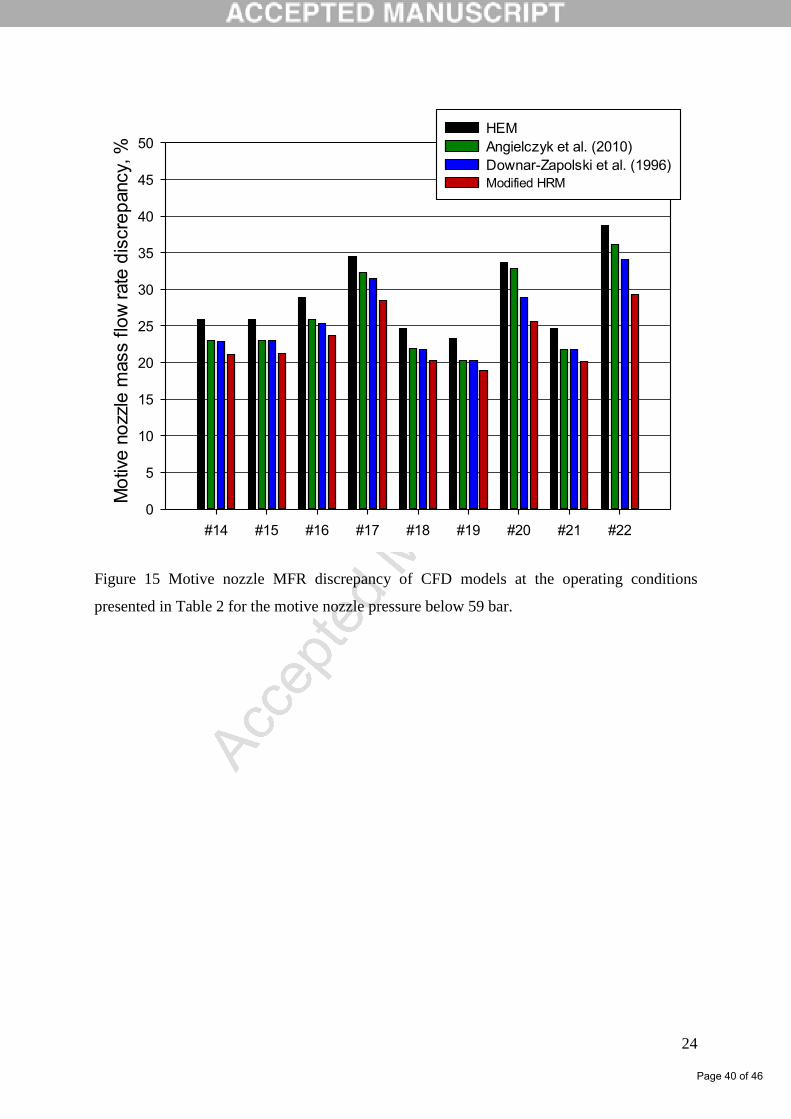
The motive nozzle MFR accuracy of the investigated numerical models for the motive nozzle
pressure below 59 bar is presented in Figure 15. The HEM motive nozzle MFR discrepancy
was over 20% at each investigated point. The lowest HEM motive nozzle MFR accuracy was
approximately 40% at OC #22. The HRM results for RT defined by the literature correlations
took into account the influence of the metastable effect on the motive nozzle flows similar to
each other. Therefore, the accuracy of both relaxation models was higher compared to HEM
by up to approximately 5%. The optimised RT correlation had the best improvement of the
motive nozzle MFR accuracy at each investigated operating condition. The modified HRM
had lower motive nozzle MFR discrepancy compared to HRM with the literature RT
correlations in the range from 2% to 5%. However, the discrepancy obtained by the modified
HRM was still above 10% at each operating point. The modified HRM improved the accuracy
of the motive nozzle MFR compared to the HEM approach by 5% to 10%, but the assumed
homogenous relaxation flow was not able to predict the real fluid flow.
The suction nozzle MFR discrepancy of each investigated CFD model at the operating
conditions below 59 bar is shown in Figure 16. HEM had a discrepancy of over 35% at each
operating point. The HRM suction nozzle MFR discrepancy with RT defined in Eq. (12) was
over 30% at OC #14, #16, #18, #20, #21 and #22. The HRM significantly overestimated the
suction nozzle MFR at #15 and #19. The best accuracy was obtained at OC #17 slightly
below 15%. The HRM suction nozzle MFR accuracy with the RT correlation presented by
Downar-Zapolski et al. (1996) was similar to the HEM accuracy at OC #16, #17 #18, #20 and
#22. In addition, the overestimation of the entrainment flow was reached at OC #14, #15 and
#19 and the discrepancy was below -15% for #15 and #19. At OC #21, the numerical model
had accuracy below 5%. The modified HRM underestimated the entrained stream at each
operating point. The suction nozzle MFR accuracy of the modified HRM was below 15% at
OC #14, #15 and #17. Therefore, the modified HRM obtained the best suction nozzle mass
Page 20 of 46

22
flow rate prediction for the motive nozzle pressure below 59 bar compared to HEM and
HRMs with the RT correlation presented in the literature.
Figure 17 presents the motive and suction nozzle MFR discrepancies of the modified HRM on
the pressure-specific enthalpy diagram. The best accuracy of the motive nozzle MFR
presented in Figure 17(a) was obtained in the transcritical regime close to the critical
temperature. In the subcritical region, the discrepancy of the modified HRM motive nozzle
MFR was below 5% above 60 bar and close to the saturation line. In the subcritical region
below 60 bar, the accuracy of the modified HRM decreased and the motive nozzle MFR
discrepancy was over 20% for most investigated points. The suction nozzle MFR discrepancy
of the modified HRM was presented in Figure 17(b). The best accuracy was obtained for
operating points with high superheat. The highest suction nozzle MFR discrepancy was of
100% due to the high pressure lift and the suction stream of the modified HRM was not
entrained by the motive stream. The accuracy of the modified HRM for suction nozzle
pressure in the range from 30 bar to 35 bar was differentiated according to the defined
pressure lift..
The improvement of the modified HRM accuracy was obtained due to the significant increase
of the meta-stability influence on the expansion process in the converging-diverging motive
nozzle. Figure 18 presents the expansion process of the motive stream of HEM and the
modified HRM on the pressure-specific enthalpy diagram and the pressure-specific volume
diagram. The fluid flow parameters in the throat of both CFD models are marked on the
diagrams. The modified HRM expanded much deeper in the high-pressure stream in the
motive nozzle. Hence, the modified HRM motive nozzle flow reached the pressure level of
approximately 43 bar in the throat, where the HEM motive nozzle flow reached a pressure
level up to 50 bar. The motive nozzle stream expanded for HEM and the modified HRM up to
approximately 27 bar and 23 bar.
The lower pressure of the modified HRM high-pressure stream in the converging-diverging
nozzle and the relaxation of the motive flow indicated much lower specific volume compared
to HEM flow through the motive nozzle. The foregoing effects increased the density of the
motive stream especially in the throat, thereby the motive nozzle MFR increased depending
on RT. The influence of the meta-stability effect can be observed right after the liquid
saturation line and around the throat. The modified HRM flow had shock wave generation at
Page 21 of 46

23
the end of the converging-diverging nozzle because of the effect of the high pressure
difference in the mixing section.
7 Conclusions
The numerical investigation of the proposed modified HRM of the R744 two-phase ejector
was performed based on the analysis of the motive nozzle MFR accuracy and mass
entrainment ratio accuracy. The MFRs given by the CFD results were compared to the
experimental results. The RT correlation of the modified HRM was optimised based on the
developed genetic algorithm integrated with the ejectorPL platform. The influence of the
three RT constants values on ejector performance was analysed. The CFD results of the
modified HRM were compared to the HEM results and HRM models with different relaxation
time correlations given by the literature.
An increase of the RT constant delayed the evaporation process of the motive high pressure
liquid stream. Therefore, the value of RT above 10-4
s significantly decreased the quality and
the pressure of the motive fluid in the converging-diverging nozzle independently of the
operating conditions. However, RT strongly influenced the shock wave generations and the
mixing process in the pre-mixing chamber and the mixer. RT above 10-4
s slowed down the
motive stream in the mixing section, which affected the ejector performance. The
modifications of the exponents a and b influenced the global and local values of the two-
phase flow at different RT constant Hence, the modification of each RT constants at
selected operating regime let to improve the accuracy of the modified HRM.
The modified HRM obtained the best accuracy of the motive nozzle MFR for the subcritical
operating regimes compared to HEM and the other HRM models based on different literature
relaxation time correlations. For the trans-critical operating regimes, the small constant
relaxation time value in the modified HRM limited the metastable effect of the two-phase
flow. As a result, the modified HRM results had similar accuracy compared to the HEM
results. The application range of the modified HRM was extended to 59 bar for the motive
nozzle pressure. The resulting motive nozzle MFR discrepancy was below 15% for the
investigated operating conditions. The suction nozzle MFR accuracy of the modified HRM
was similar to HEM at most of the investigated operating points. For the motive nozzle
pressure level below 59 bar, the modified HRM improved the accuracy of the motive MFR in
Page 22 of 46

24
the range of 5% to 10% compared to HEM and HRMs with RT correlations given by
literature.
Acknowledgment
The authors gratefully acknowledge the financial support of the Research Council of Norway
through project No. 244009/E20.
Reference
Angielczyk, W., Bartosiewicz, Y., Butrymowicz, D., Seynhaeve, J.-M., 2010. 1-D Modeling
Of Supersonic Carbon Dioxide Two-Phase Flow Through Ejector Motive Nozzle
International Refrigeration and Air Conditioning Conference. Purdue e-Pubs, Purdue
University.
Banasiak, K., Hafner, A., 2013. Mathematical modelling of supersonic two-phase R744 flows
through converging–diverging nozzles: The effects of phase transition models. Appl. Therm.
Eng. 51, 635-643.
Banasiak, K., Hafner, A., Andresen, T., 2012. Experimental and numerical investigation of
the influence of the two-phase ejector geometry on the performance of the R744 heat pump.
Int. J. Refrigeration 35, 1617-1625.
Banasiak, K., Hafner, A., Kriezi, E.E., Madsen, K.B., Birkelund, M., Fredslund, K., Olsson,
R., 2015. Development and performance mapping of a multi-ejector expansion work recovery
pack for R744 vapour compression units. Int. J. Refrigeration 57, 265-276.
Besagni, G., Inzoli, F., 2017. Computational fluid-dynamics modeling of supersonic ejectors:
Screening of turbulence modeling approaches. Appl. Therm. Eng. 117, 122-144.
Bilicki, Z., Kestin, J., 1990. Physical Aspects of the Relaxation Model in Two-Phase Flow.
Proceedings of the Royal Society of London A: Mathematical, Physical and Engineering
Sciences 428, 379-397.
Brown, S., Martynov, S., Mahgerefteh, H., Proust, C., 2013. A homogeneous relaxation flow
model for the full bore rupture of dense phase CO2 pipelines. Int. J. Greenh. Gas Control 17,
349-356.
Colarossi, M., Trask, N., Schmidt, D.P., Bergander, M.J., 2012. Multidimensional modeling
of condensing two-phase ejector flow. Int. J. Refrigeration 35, 290-299.
Corriveau, G., Guilbault, R., Tahan, A., 2010. Genetic algorithms and finite element coupling
for mechanical optimization. Advances in Engineering Software 41, 422-426.
Deng, J.q., Jiang, P.x., Lu, T., Lu, W., 2007. Particular characteristics of transcritical CO2
refrigeration cycle with an ejector. Appl. Therm. Eng. 27, 381-388.
Downar-Zapolski, P., Bilicki, Z., Bolle, L., Franco, J., 1996. The non-equilibrium relaxation
model for one-dimensional flashing liquid flow. International Journal of Multiphase Flow 22,
473-483.
Elbel, S., Hrnjak, P., 2008. Experimental validation of a prototype ejector designed to reduce
throttling losses encountered in transcritical R744 system operation. Int. J. Refrigeration 31,
411-422.
Page 23 of 46

25
Elbel, S., Lawrence, N., 2016. Review of recent developments in advanced ejector
technology. Int. J. Refrigeration 62, 1-18.
Fluent, A., 2011. Ansys Fluent User's Guide. PA, Canonsburg.
Gallegos Muñoz, A., Ayala-Ramírez, V., Alfaro-Ayala, J.A., Toledo Acosta, B.M., 2011.
Optimization of the transition piece applying genetic algorithms. Appl. Therm. Eng. 31, 3214-
3225.
Giacomelli, F., Biferi, G., Mazzelli, F., Milazzo, A., 2016. CFD Modeling of the Supersonic
Condensation Inside a Steam Ejector. Energy Procedia 101, 1224-1231.
Hafner, A., Forsterling, S., Banasiak, K., 2014. Multi-ejector concept for R-744 supermarket
refrigeration. Int. J. Refrigeration 43, 1-13.
Haida, M., Banasiak, K., Smolka, J., Hafner, A., Eikevik, T.M., 2016. Experimental analysis
of the R744 vapour compression rack equipped with the multi-ejector expansion work
recovery module. Int. J. Refrigeration 64, 93-107.
Kornhauser, A.A., 1990. The Use of an Ejector as a Refrigerant Expander, International
Refrigeration and Air Conditioning Conference. Purdue e-Pubs, Purdue University, p. 11.
Lemmon, E.W., Huber, M.l., McLinden, M.O., 2013. NIST Standard Reference Database 23:
Reference Fluid Thermodynamic and Transport Properties-REFPROP, Standard Reference
Data Program, 9.1 ed. National Institute of Standards and Technology, Gaithersburg.
Li, D., Groll, E.A., 2005. Transcritical CO2 refrigeration cycle with ejector-expansion device.
Int. J. Refrigeration 28, 766-773.
Lorentzen, G., 1990. Trans-critical vapour compression cycle device. Google Patents.
Lucas, C., Rusche, H., Schroeder, A., Koehler, J., 2014. Numerical investigation of a two-
phase CO2 ejector. Int. J. Refrigeration 43, 154-166.
Mazzelli, F., Little, A.B., Garimella, S., Bartosiewicz, Y., 2015. Computational and
experimental analysis of supersonic air ejector: Turbulence modeling and assessment of 3D
effects. International Journal of Heat and Fluid Flow 56, 305-316.
Nakagawa, M., Berana, M.S., Kishine, A., 2009. Supersonic two-phase flow of CO2 through
converging–diverging nozzles for the ejector refrigeration cycle. Int. J. Refrigeration 32,
1195-1202.
Palacz, M., Haida, M., Smolka, J., Nowak, A.J., Banasiak, K., Hafner, A., 2017a. HEM and
HRM accuracy comparison for the simulation of CO2 expansion in two-phase ejectors for
supermarket refrigeration systems. Appl. Therm. Eng.
Palacz, M., Smolka, J., Fic, A., Bulinski, Z., Nowak, A.J., Banasiak, K., Hafner, A., 2015.
Application range of the HEM approach for CO2 expansion inside two-phase ejectors for
supermarket refrigeration systems. Int. J. Refrigeration.
Palacz, M., Smolka, J., Kus, W., Fic, A., Bulinski, Z., Nowak, A.J., Banasiak, K., Hafner, A.,
2016. CFD-based shape optimisation of a CO2 two-phase ejector mixing section. Appl.
Therm. Eng. 95, 62-69.
Palacz, M., Smolka, J., Nowak, A.J., Banasiak, K., Hafner, A., 2017b. Shape optimisation of
a two-phase ejector for CO2 refrigeration systems. Int. J. Refrigeration 74, 210-221.
Salvador, F.J., Carreres, M., Jaramillo, D., Martínez-López, J., 2015. Comparison of microsac
and VCO diesel injector nozzles in terms of internal nozzle flow characteristics. Energy
Convers. Manag. 103, 284-299.
Page 24 of 46

26
Schmidt, D.P., Gopalakrishnan, S., Jasak, H., 2010. Multi-dimensional simulation of thermal
non-equilibrium channel flow. International Journal of Multiphase Flow 36, 284-292.
Smolka, J., 2013a. CFD-based 3-D optimization of the mutual coil configuration for the
effective cooling of an electrical transformer. Appl. Therm. Eng. 50, 124-133.
Smolka, J., 2013b. Genetic algorithm shape optimisation of a natural air circulation heating
oven based on an experimentally validated 3-D CFD model. Int. J. Therm. Sci. 71, 128-139.
Smolka, J., Bulinski, Z., Fic, A., Nowak, A.J., Banasiak, K., Hafner, A., 2013. A
computational model of a transcritical R744 ejector based on a homogeneous real fluid
approach. Applied Mathematical Modelling 37, 1208-1224.
Sumeru, K., Nasution, H., Ani, F.N., 2012. A review on two-phase ejector as an expansion
device in vapor compression refrigeration cycle. Renew. Sustain. Energy Rev. 16, 4927-4937.
Page 25 of 46

11
Figure 1 Saturation pressure determination of the transcritical motive nozzle operating
conditions.
Figure 2 The R744 two-phase ejector geometry.
Page 26 of 46

11
Figure 3 R744 Pressure - specific enthalpy diagram of the operating conditions: (a) motive
nozzle and (b) suction nozzle conditions.
Page 27 of 46

12
Figure 4 Pressure distribution (in Pa) along axis of the two-phase ejector for HRM with
different RT constant compared to the HEM results at OC: (a) #2, (b) #12, and (c) #18
presented in Table 2.
Page 28 of 46

13
Page 29 of 46

14
Figure 5 Vapour quality distribution along axis of the two-phase ejector for HRM with
different RT constant compared to the HEM results at OC #2 (a), #12 (b), and #18 (c)
presented in Table 2.
Page 30 of 46

15
Figure 6 Velocity field (in m/s) for (a) HEM and different RT constants of (b) 10-6
s, (c)
10-5
s, (d) 10-4
s, (e) 10-3
s for OC #6 presented in Table 2.
Page 31 of 46

16
Figure 7 The motive nozzle MFR discrepancy of HRM with different exponent a denoted as a
in Eq. (12) for OC #12 presented in Table 2.
0%
5%
10%
15%
20%
25%
30%
35%
-3.5 -3 -2.5 -2 -1.5 -1 -0.5 0 0.5 1 1.5
Mo
tive
no
zzle
mas
s fl
ow
rat
e d
iscr
epan
cy
Exponent a in Eq. (12), -
, , 6
Page 32 of 46

17
Figure 8 Absolute pressure field (in Pa) for HRM with different constants defined in Eq. (12)
for OC #12 presented in Table 2: (a) ; (b) ; (c) ; (d) .
(a)
(b)
(c)
(d)
Pa
6
Page 33 of 46

18
Figure 9 The motive nozzle MFR discrepancy of HRM with different exponent b defined in
Eq. (12) for OC #12 presented in Table 2.
0%
5%
10%
15%
20%
25%
30%
35%
-3.5 -3 -2.5 -2 -1.5 -1 -0.5 0 0.5 1 1.5
Mo
tive
no
zzle
mas
s fl
ow
rat
e d
iscr
epan
cy
Exponent b in Eq. (12), -
, , 4
Page 34 of 46

19
Figure 10 Absolute pressure field (in Pa) for HRM with different constants defined in Eq.
(12): (a) ; (b) ; (c) ; (d) .
4
4
(a)
(b)
(c)
(d)
Pa
Page 35 of 46

20
#1 #2 #3 #4 #5 #6 #7 #8
Mot
ive
nozz
le m
ass
flow
rate
dis
crep
ancy
, %
-10
-8
-6
-4
-2
0
2
4
6
8
10
HEMAngielczyk et al. (2010)Downar-Zapolski et al. (1996)Modified HRM
Figure 11 Motive nozzle MFR discrepancy of CFD models at the operating conditions
presented in Table 2 for the motive nozzle pressure above the critical point.
Page 36 of 46

21
#1 #2 #3 #4 #5 #6 #7 #8
Suct
ion
nozz
le m
ass
flow
rate
dis
crep
ancy
, %
0
5
10
15
20
25
30
35
40
45
50 HEMAngielczyk et. al (2010)Downar-Zapolski et. al (1996)Modified HRM
Figure 12 Suction nozzle MFR discrepancy of CFD models at the operating conditions
presented in Table 2 for the motive nozzle pressure above the critical point.
Page 37 of 46

22
#9 #10 #11 #12 #13
Mot
ive
nozz
le m
ass
flow
rate
dis
crep
ancy
, %
0
5
10
15
20
25
30
35
40
45
50HEMAngielczyk et al. (2010)Downar-Zapolski et al. (1996)Modified HRM
Figure 13 Motive nozzle MFR discrepancy of CFD models at the operating conditions
presented in Table 2 for the motive nozzle pressure in the range from 59 bar to the critical
point.
Page 38 of 46

23
#9 #10 #11 #12 #13
Suc
tion
nozz
le m
ass
flow
rate
dis
crep
ancy
, %
-70
-60
-50
-40
-30
-20
-10
0
10
20
30
40
50HEMAngielczyk et. al (2010)Downar-Zapolski et. al (1996)Modified HRM
Figure 14 Suction nozzle MFR discrepancy of CFD models at the operating conditions
presented in Table 2 for the motive nozzle pressure in the range from 59 bar to the critical
point.
Page 39 of 46
24
#14 #15 #16 #17 #18 #19 #20 #21 #22
Mot
ive
nozz
le m
ass
flow
rate
dis
crep
ancy
, %
0
5
10
15
20
25
30
35
40
45
50HEMAngielczyk et al. (2010)Downar-Zapolski et al. (1996)Modified HRM
Figure 15 Motive nozzle MFR discrepancy of CFD models at the operating conditions
presented in Table 2 for the motive nozzle pressure below 59 bar.
Page 40 of 46

25
#14 #15 #16 #17 #18 #19 #20 #21 #22
Suc
tion
nozz
le m
ass
flow
rate
dis
crep
ancy
, %
-100-90-80-70-60-50-40-30-20-10
0102030405060708090
100
HEMAngielczyk et. al (2010)Downar-Zapolski et. al (1996)Modified HRM
Figure 16 Suction nozzle MFR discrepancy of CFD models at the operating conditions
presented in Table 2 for the motive nozzle pressure below 59 bar.
Page 41 of 46

26
Figure 17 R744 pressure–specific enthalpy diagram of the modified HRM MFR discrepancies
at the operating conditions presented in Figure 3 for (a) motive nozzle and (b) suction nozzle.
Page 42 of 46

27
Figure 18 Motive nozzle expansion process for HEM and modified HRM at OC #13
presented in Table 2: (a) pressure-specific enthalpy diagram, (b) pressure-specific volume
diagram.
Page 43 of 46
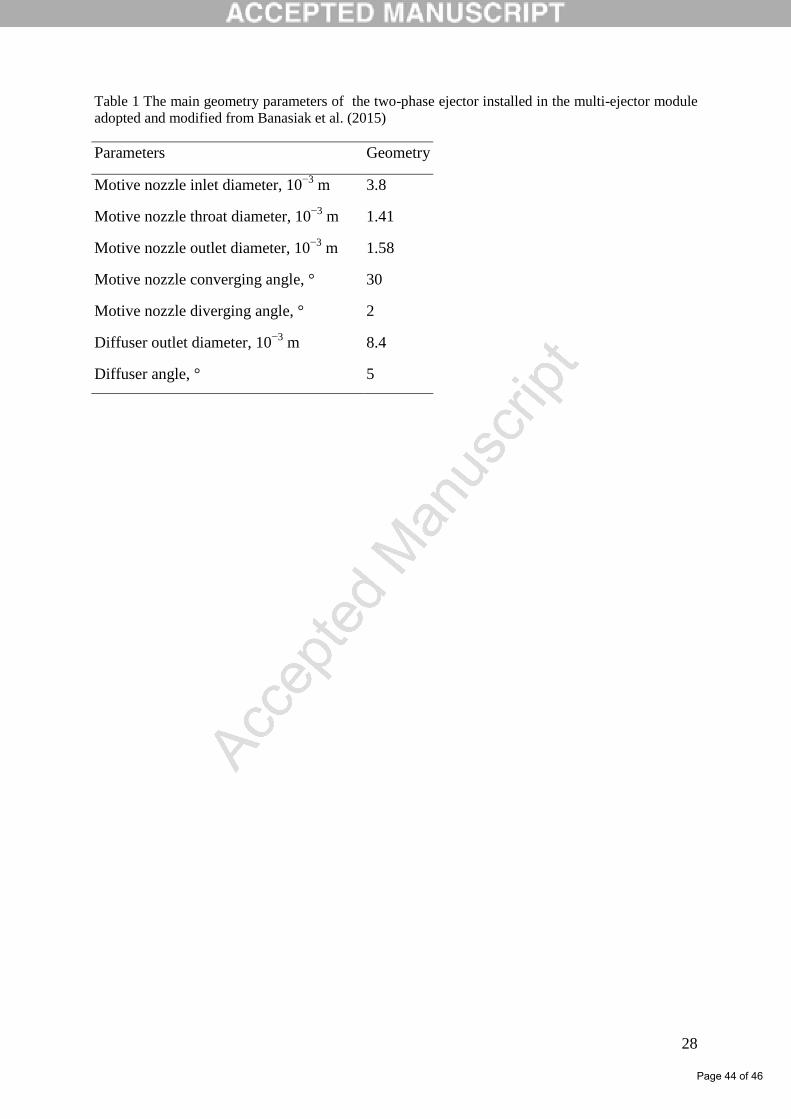
28
Table 1 The main geometry parameters of the two-phase ejector installed in the multi-ejector module
adopted and modified from Banasiak et al. (2015)
Parameters Geometry
Motive nozzle inlet diameter, 10−3
m 3.8
Motive nozzle throat diameter, 10−3
m 1.41
Motive nozzle outlet diameter, 10−3
m 1.58
Motive nozzle converging angle, ° 30
Motive nozzle diverging angle, ° 2
Diffuser outlet diameter, 10−3
m 8.4
Diffuser angle, ° 5
Page 44 of 46

29
Table 2. Set of the operating conditions (OC) for R744 two-phase ejector.
OC No Motive nozzle Suction nozzle Outlet
Pressure Temperature Pressure Temperature Pressure
- bar K bar K bar
#1 94.35 309.12 30.69 277.61 35.86
#2 85.35 305.57 31.42 278.45 38.24
#3 80.69 299.97 30.97 278.15 34.39
#4 76.56 301.49 27.33 274.01 32.87
#5 90.39 307.67 31.22 278.45 37.27
#6 82.94 301.48 31.52 279.68 37.32
#7 80.98 299.97 31.15 278.15 34.39
#8 78.45 301.71 31.72 278.86 38.28
#9 67.57 293.33 28.36 277.44 36.77
#10 66.62 295.53 27.87 274.93 32.88
#11 66.51 295.56 28.21 275.36 34.85
#12 61.79 293.42 29.93 276.73 33.87
#13 59.27 281.91 29.14 275.72 34.83
#14 58.41 283.15 27.82 277.71 34.83
#15 56.67 283.35 27.79 276.13 34.87
#16 55.71 285.79 32.46 279.72 36.01
#17 53.93 279.48 27.30 278.85 34.23
#18 58.48 283.14 27.91 266.59 36.80
#19 58.02 282.49 31.73 279.11 36.75
#20 57.89 288.59 29.18 272.45 36.79
#21 57.71 282.94 31.70 279.21 37.17
#22 53.08 284.49 27.86 270.83 34.85
Page 45 of 46

30
Table 3 Optimised relaxation time coefficients and the minimum objective function OFmin for
specified motive nozzle pressure ranges.
Motive nozzle pressure range
Operating
conditions
(see Table 2)
OFmin
73.77 bar #1 ÷ #4 1.00-07 0.00 0.00 2%
59 bar 73.77 bar #9 ÷ #12 9.00E-06 -0.67 -1.73 6%
59 bar #14 ÷ #17 1.50E-06 -0.67 -2.00 23%
Page 46 of 46