modernization strategy for irrigation management ... strategy for irrigation management karnataka -...
TRANSCRIPT

WORKING DOCUMENT NOT to be quoted
1
MASSCOTE Shimoga January 2007
Modernization Strategy for Irrigation Management
KARNATAKA - INDIA
BHADRA PROJECT
WORKING DOCUMENT NOT to be quoted
2
CURRENCY EQUIVALENTS
Currency Unit = Indian Rupee (Rs) US$1.0 = Rs 45.34
MEASURES AND EQUIVALENTS 1 meter = 3.28 feet 1 ha = 2.47 acres 1 km = 0.620 miles 1 cubic meter (m3) = 35.310 cubic feet 1 million acre foot (MAF) = 1.234 Billion cubic meter (Bm3) 1 cubic feet per second (cusec) = 28.5 litre per second (l/s) = 0.0285 cubic meter per second (m3/s) TMC = Thousand Million Cubic Feet = 28.3 Million Cubic Meters MCM = Million Cubic Meter
ABBREVIATIONS AND ACRONYMS AGLW Agriculture Water Resources Development and Management Service of the Land and
Water Development Division of FAO CA Command Area CCA Culturable Command Area CR Cross regulator DO Direct outlet FAO Food and Agriculture Organization FO Farmer Organization GCA Gross Command Area ITRC Irrigation Training and Research Centre (California Polytechnic University) KNNL LMA Local Management Agency MAF Million Acre Feet MASSCOTE M&E Monitoring and Evaluation NCA Net Command Area (irrigable) O&M Operations and Maintenance OFWM On-Farm Water Management RAP Rapid Appraisal Procedure WUA Water Users Association

WORKING DOCUMENT NOT to be quoted
3
Introduction and Background..................................................................................................... 5 1. THE MASSCOTE APPROACH ........................................................................................... 6
Presentation of the methodology............................................................................................ 6 2. The Bhadra Project................................................................................................................. 8
Bhadra irrigation project ........................................................................................................ 8 Embedded irrigation systems ............................................................................................... 10 Irrigated agriculture.............................................................................................................. 12 Modernization programs in Bhadra project. ........................................................................ 12
National Water Management Plan NWMP...................................................................... 12 The 2007 Project: Rehabilitation focus............................................................................ 13
Step 1. RAPID DIAGNOSIS: RAP ................................................................................... 14 RAP Methodology ........................................................................................................... 14 RAP in Bhadra ................................................................................................................. 16 External indicators ........................................................................................................... 16 Accounting for actual irrigation ....................................................................................... 16 Internal Performance Indicators ....................................................................................... 18 Features about the Service ............................................................................................... 19 Main problems along the distribution network ................................................................ 20 Lack of real participatory management: WUA................................................................ 21 Lack of water level control .............................................................................................. 21 Small pockets of water scarcity........................................................................................ 21
Step 2. SYSTEM CAPACITY AND SENSITIVITY.......................................................... 23 Storage capacity ............................................................................................................... 23 The issue of Management Capacity at main reservoir. .................................................... 24 Conveyance ...................................................................................................................... 25 Diversion .......................................................................................................................... 26 Distribution ...................................................................................................................... 26 Water level Control .......................................................................................................... 27 Measurements .................................................................................................................. 28 Safety................................................................................................................................ 29 Transmission and communication: .................................................................................. 29
SENSITIVITY of the irrigation structures........................................................................... 30 Low sensitive offtakes along the main/branch canals...................................................... 30 Sensitivity of Water level along the secondary canals..................................................... 31 High sensitive offtakes along the secondary canals ......................................................... 31
STEP 3: THE PERTURBATIONS ................................................................................... 32 Linked perturbation to existing buffer storage................................................................. 32
Step 4 MAPPING WATER NETWORKS & WATER BALANCE/ACCOUNTING........ 34 NETWORKS.................................................................................................................... 34 WATER ACCOUNTING: ............................................................................................... 34 RAINFALL ...................................................................................................................... 34 STREAM FLOW FROM OUTSIDE THE COMMAND................................................ 34 Groundwater..................................................................................................................... 35 CANAL WATER ISSUES .............................................................................................. 36 OUTFLOWS .................................................................................................................... 36 EVAPOTRANSPIRATION:............................................................................................ 36 Water recycling facility.................................................................................................... 37 Water Balance: a first proxy ............................................................................................ 37 Seasonal water balance .................................................................................................... 38
Step 5 MAPPING THE COST of OPERATION................................................................. 39
WORKING DOCUMENT NOT to be quoted
4
Cost of Management Operation and Maintenance........................................................... 39 Improving service at an increased cost ............................................................................ 40
Step 6 SERVICE to USERS................................................................................................. 41 Bhadra: a multiple-uses system....................................................................................... 41 A spatially variable service to agriculture/farmers .......................................................... 42 The principle of Arranged service is proposed ................................................................ 43 The vision......................................................................................................................... 44
Step 7 PARTITIONING IN MANAGEMENT UNITS....................................................... 45 Management levels........................................................................................................... 45
Step 8 MAPPING THE DEMAND FOR CANAL OPERATION ...................................... 47 Main criteria for partitioning the CA for canal operation demand .................................. 47
Step 9 CANAL OPERATION IMPROVEMENTS............................................................. 48 The critical issue of canal lining ...................................................................................... 52
Step 10 AGGREGATING AND CONSOLIDATING MANAGEMENT .......................... 53 Step 11 PLAN FOR MODERNIZATION........................................................................... 53
Annexure-I/I SALIENT FEATURES OF BHADRA RESERVOIR PROJECT..................... 54 Appendix II RAP Internal Indicators .................................................................................... 56 Appendix III Step 2 Capacity and Sensitivity................................................................... 64 Appendix IV Issues from the main reservoir ......................................................................... 69

WORKING DOCUMENT NOT to be quoted
5
Introduction and Background A FAO mission1 visited Karnataka State to carry out a MASSCOTE training workshop in Shimoga Karnataka from 17th January to 2 February 2007 as part of a collaborative program between the Government of Karnataka and FAO, and more specifically a joint program between FAO and KNNL targeting the re-engineering/modernization of irrigation management under the control of KNNL corporate. This mission is the third MASSCOTE exercise organised by FAO for KNNL, after the Gathaprabha project carried out in October 2006 and Gondorinola and Bennithora projects carried out in December 2006. The set of 3 Masscote was planned as part of the FAO-KNNL collaborative activities aiming at developing a modernization strategy for KNNL. The mission organized a training workshop on modernization of irrigation management for 45 participants with a focus on Bhadra project, field visits and working group sessions together with short lecturing have been carried out from 20th January till the 2nd of February 2007. The application presented here has been developed through a training workshop in Karnataka with engineers and managers from the KNNL. The contributions of the working group sessions at this workshop (RAP–MASSCOTE) have been largely included in this report. The MASSCOTE exercise has been further carried out to its completion by a team of KNNL, comprising officers from KNNL HQ as well as some officers from the Bhadra project. The conclusions and proposals are still under a process of refinement and validation by the Bhadra local team and FAO, what is proposed here is reflecting the outcomes of the workshop, no further investigations has been incorporated. This MASSCOTE draft report has several purposes:
• produce food for thought for decision-makers in Karnataka before engaging in investment plans, particularly on how to ensure that diagnosis and solutions are investigated properly in modernization projects;
• suggest some specific strategies to managers of KNNL-Bhadra on how they should make the best use of the modernization investment plan which is about to start with mainly works of canal lining.
• lay the foundations of a more elaborate modernization plan, with some initial steps planned for 2008.
1 The FAO mission consisted of D. Renault, (Senior Irrigation Management Officer, AGLW FAO HQ Rome), and P.S. Rao (Senior Officer of India FAO Bureau Delhi).

WORKING DOCUMENT NOT to be quoted
6
1. THE MASSCOTE APPROACH The methodology used in the study is called Mapping System and Services for Canal Operation Techniques (MASSCOTE). It has been developed by the Land and Water Division (AGLW) of FAO on the basis of its experience in modernizing irrigation management in Asia. MASSCOTE integrates/complements tools such as the rapid appraisal procedure (RAP) and Benchmarking to enable a complete sequence of diagnosis of external and internal performance indicators and the design of practical solutions for improved management and operation of the system. MASSCOTE is a methodology aiming at the evaluation of current processes and performance of irrigation systems and the development of a project for modernization of Canal Operation. Operation is a complex task involving key activities of irrigation management which implies numerous aspects which have to be combined in a consistent manner. These aspects are:
• service to users • cost of producing the services • performance M& E • Constraints and opportunities on Water resources • Constraints and opportunities of the physical systems
MASSCOTE aims to organize project development into a stepwise revolving frame including:
• mapping the system characteristics, the water context and all factors affecting management; • delimiting manageable subunits; • defining the strategy for service and operation for each unit; • aggregating and consolidating the canal operation strategy at the main system level.
MASSCOTE is an iterative process based on ten successive steps, but more than one round is required in order to determine a consistent plan. Some steps need to be rediscussed and refined several times before achieving a satisfactory level of consistency.
Presentation of the methodology The first steps of MASSCOTE are conducted for the entire command area with the goal of identifying homogeneous managerial units for which specific options for canal operation are further sought by running the various steps of MASSCOTE for each unit taken separately. Then, aggregation and consolidation is carried out at the main system level. Thus, the methodology uses a back-and-forth or up-and-down approach for the different nested levels of management.

WORKING DOCUMENT NOT to be quoted
7
10 STEPS of MASSCOTE MAPPING.... 1. PHASE A BASELINE INFORMATION
1. THE PERFORMANCE RAPID APPRAISAL PROCESS (RAP)
Initial rapid system diagnosis and performance assessment through the RAP: the primary objective of the RAP is to allow qualified personnel to systematically and quickly determine key indicators of the system in order to identify and prioritize modernization improvements. The second objective is to start mobilizing the energy of the actors (managers and users) for modernization. The third objective is to generate a baseline assessment, against which progress can be measured.
2 THE CAPACITY AND SENSITIVITY of the SYSTEM
The assessment of the physical capacity of irrigation structures to perform their function of conveyance, control, measurement, etc. Assessing the sensitivity of irrigation structures (offtakes and cross-regulators), identification of singular points. Mapping the sensitivity of the system.
3 THE PERTURBATIONS Perturbations analysis: causes, magnitudes, frequency and options for coping with
4 THE NETWORKS & WATER BALANCES
This entails assessing the hierarchical structure and the main features of the irrigation and drainage networks, on the basis of which partition of the system into subsystems will be made. Water accounting should be undertaken, considering both surface water and groundwater, and mapping the opportunities and constraints related to them.
5 THE COST of O&M Mapping the costs associated with current operational techniques and resulting services, disaggregating the different cost elements; cost analysis of options for various level of services with current techniques and with improved techniques.
2. PHASE B IMPROVING CANAL OPERATION MATURING SERVICE ORIENTED MANAGEMENT
6 THE SERVICE to USERS
Mapping and economic analysis of the potential range of services to be provided to users at various levels of the systems. The services should be based on a compromise between the water management strategies, the agriculture objectives and the willingness to pay by users.
7 PARTITIONING INTO MANAGEMENT SUB-UNITS
The irrigation system management should be partitioned into few level of management and the command area should be divided and subunits (subsystems and/or subcommand areas) that are held homogeneous and/or separate from one another by a singular point or a particular borderline.
8 ASSESSING THE DEMAND FOR OPERATION
Assessing the resources, opportunity and demand for improved canal operation at the different levels of management and within the local management units.
9 IDENTIFYING CANAL OPERATION IMPROVEMENTS
Identifying improvement options (service and economic feasibility) for each management unit for (i) water management, (ii) water control, and (iii) canal operation)
10 INTEGRATING AND CONSOLIDATING MANAGEMENT
Integration of the preferred options at the system level, and functional cohesiveness check. Consolidation and design of an overall information management system for supporting operation
A PLAN FOR MODERNIZATION AND M&E
Finalizing a modernization strategy and progressive capacity development Select/choose/decide/phasing the options for improvements Plan for M&E of the project inputs and outcomes.

WORKING DOCUMENT NOT to be quoted
8
2. The Bhadra Project The project is located in the Western part of the State.
Plate 1. Karnataka map with the location of the Bhadra project..
Bhadra irrigation project Project Description The river Bhadra raises from the Varaha hills in the Western Ghats of Chikkmagalur district. The Bhadra basin gets 82 % of inflow from SW monsoon (June to September) and 18% from NE monsoon (October to December). The basin has a catchment area of about
WORKING DOCUMENT NOT to be quoted
9
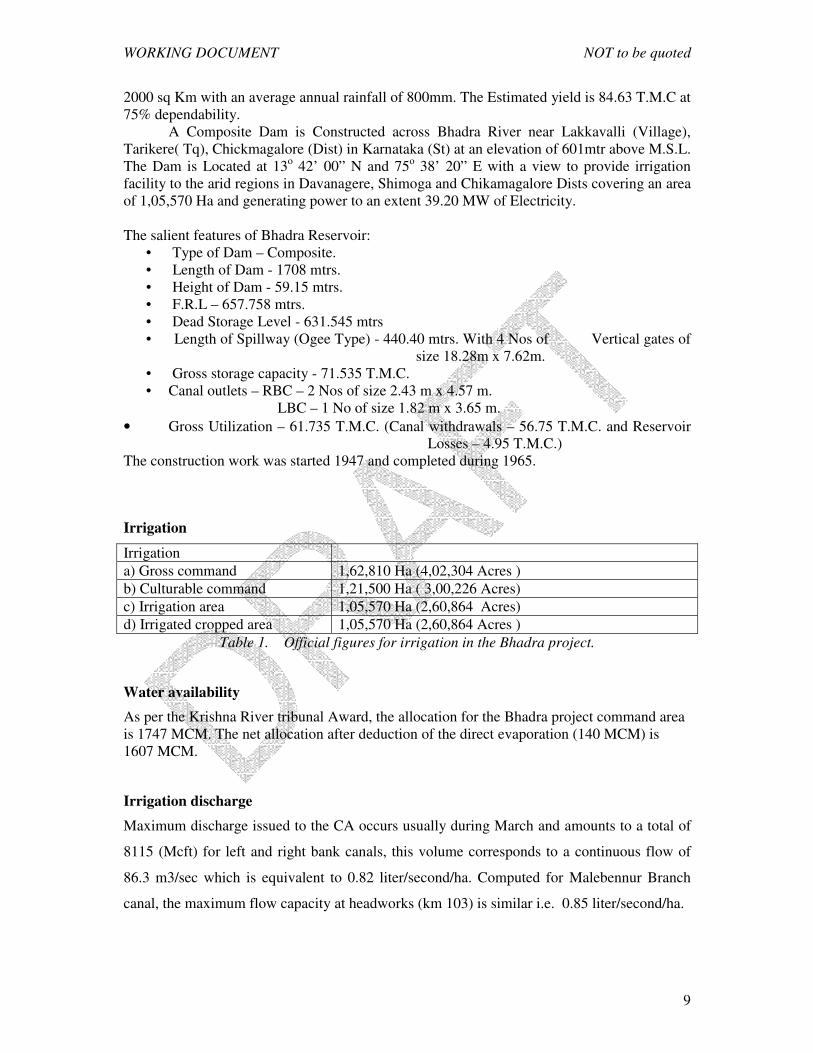
2000 sq Km with an average annual rainfall of 800mm. The Estimated yield is 84.63 T.M.C at 75% dependability. A Composite Dam is Constructed across Bhadra River near Lakkavalli (Village), Tarikere( Tq), Chickmagalore (Dist) in Karnataka (St) at an elevation of 601mtr above M.S.L. The Dam is Located at 13o 42’ 00” N and 75o 38’ 20” E with a view to provide irrigation facility to the arid regions in Davanagere, Shimoga and Chikamagalore Dists covering an area of 1,05,570 Ha and generating power to an extent 39.20 MW of Electricity. The salient features of Bhadra Reservoir:
• Type of Dam – Composite. • Length of Dam - 1708 mtrs. • Height of Dam - 59.15 mtrs. • F.R.L – 657.758 mtrs. • Dead Storage Level - 631.545 mtrs • Length of Spillway (Ogee Type) - 440.40 mtrs. With 4 Nos of Vertical gates of
size 18.28m x 7.62m. • Gross storage capacity - 71.535 T.M.C. • Canal outlets – RBC – 2 Nos of size 2.43 m x 4.57 m.
LBC – 1 No of size 1.82 m x 3.65 m. • Gross Utilization – 61.735 T.M.C. (Canal withdrawals – 56.75 T.M.C. and Reservoir
Losses – 4.95 T.M.C.) The construction work was started 1947 and completed during 1965.
Irrigation
Irrigation a) Gross command 1,62,810 Ha (4,02,304 Acres ) b) Culturable command 1,21,500 Ha ( 3,00,226 Acres) c) Irrigation area 1,05,570 Ha (2,60,864 Acres) d) Irrigated cropped area 1,05,570 Ha (2,60,864 Acres )
Table 1. Official figures for irrigation in the Bhadra project.
Water availability
As per the Krishna River tribunal Award, the allocation for the Bhadra project command area is 1747 MCM. The net allocation after deduction of the direct evaporation (140 MCM) is 1607 MCM.
Irrigation discharge
Maximum discharge issued to the CA occurs usually during March and amounts to a total of
8115 (Mcft) for left and right bank canals, this volume corresponds to a continuous flow of
86.3 m3/sec which is equivalent to 0.82 liter/second/ha. Computed for Malebennur Branch
canal, the maximum flow capacity at headworks (km 103) is similar i.e. 0.85 liter/second/ha.

WORKING DOCUMENT NOT to be quoted
10
Plate 2 partition of the Bhadra CA
Embedded irrigation systems
1. Gondi Anicut Channel
Across the river 16 km downstream of Bhadra reservoir an old system built in 1925 the Gondi anicut project irrigates mainly on the right bank 4500 ha with a discharge of 285 cusecs. Flows is issued from the Bhadra reservoir.
Plate 4. Gondi Anicut (Left) and Shantisagar Tank (right)
.
NETWORK OF CANALS AT A GLANCE (RESERVOIR)
LEFT BANK CANAL Command Area -8300 Ha
Discharge -380 Cusecs Total Length: 77.00 Km
No. of Distributories: 51+9 DPO.
RIGHT BANK CANAL Command Area -93000 Ha Discharge – 2650 Cusecs Total Length: 103.00 KM
No. of Distributories: 29 Nos.
ANVERI BRANCH CANAL Command Area – 6319 Ha
Discharge – 208 cusecs Total Length: 67.00 Km
No. of Distributories: 40 Nos.
MALEBENNUR BRANCH CANAL Command Area – 23,774 Ha
Discharge – 620 cusecs Total Length: 48.00 Km
No. of Distributaries: 42 Nos..
DAVANGERE BRANCH CANAL Command Area –30286 Ha
Discharge - 1170Cusecs Total Length: 90.00 Km
No. of Distributaries: 27 Nos.
HARIHAR BRANCH CANAL Command Area – 15,337 Ha
Discharge – 364 Cusecs Total Length: 20.70 Km
No. of Distributaries: 16Nos.
D.B. KERE PICKUP
Left Bank Canal. Command Area – 1618 ha
Discharge – 53 cusecs Total Length: 26.20 Km
No. of DPO’s – 45.
Right Bank Canal. Command Area – 2662 Ha.
Discharge – 118 Cusecs Total Length: 33.00 Km
No. of DPO’s: - 23.
Offtake @ ch 79.80KM Offtake @ ch 103.00KM
Offtake @ ch 64.80KM Seepage
Seepage

WO
RK
ING
DO
CU
ME
NT
NO
T to
be
quot
ed
11
Pla
te 3
. In
dex
map
of t
he B
hadr
a Ir
riga
tion
Pro
ject
WORKING DOCUMENT NOT to be quoted
12
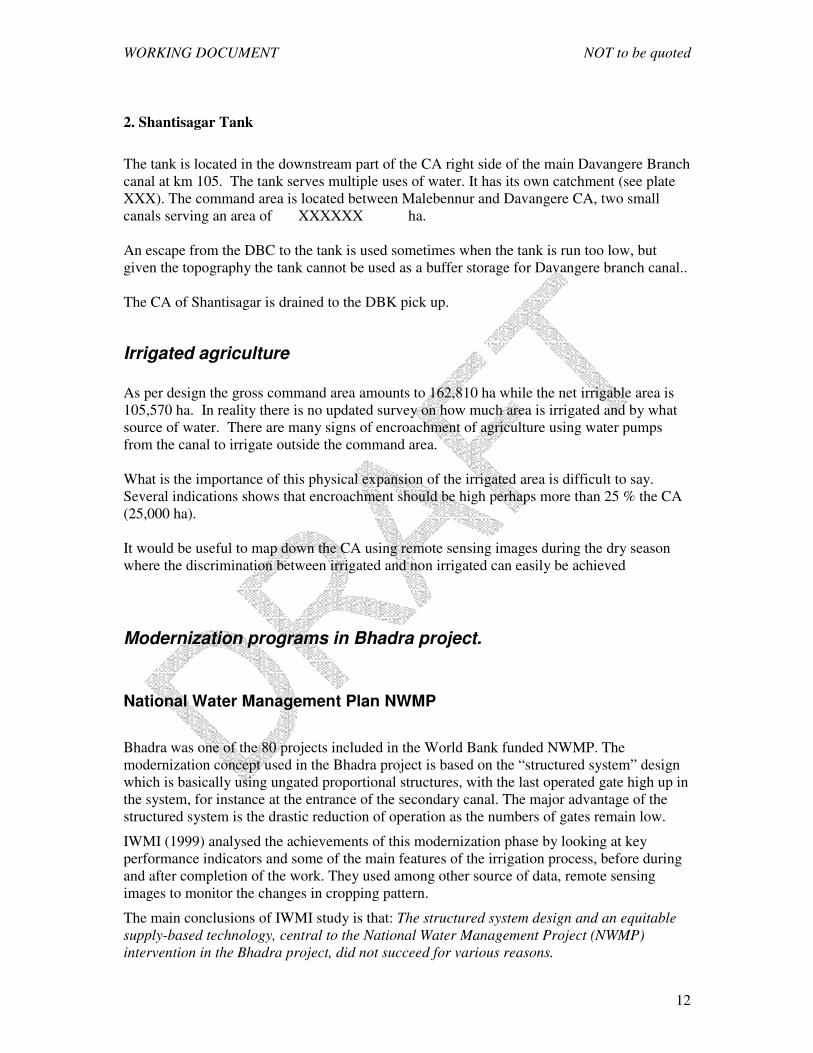
2. Shantisagar Tank
The tank is located in the downstream part of the CA right side of the main Davangere Branch canal at km 105. The tank serves multiple uses of water. It has its own catchment (see plate XXX). The command area is located between Malebennur and Davangere CA, two small canals serving an area of XXXXXX ha. An escape from the DBC to the tank is used sometimes when the tank is run too low, but given the topography the tank cannot be used as a buffer storage for Davangere branch canal.. The CA of Shantisagar is drained to the DBK pick up.
Irrigated agriculture As per design the gross command area amounts to 162,810 ha while the net irrigable area is 105,570 ha. In reality there is no updated survey on how much area is irrigated and by what source of water. There are many signs of encroachment of agriculture using water pumps from the canal to irrigate outside the command area. What is the importance of this physical expansion of the irrigated area is difficult to say. Several indications shows that encroachment should be high perhaps more than 25 % the CA (25,000 ha). It would be useful to map down the CA using remote sensing images during the dry season where the discrimination between irrigated and non irrigated can easily be achieved
Modernization programs in Bhadra project.
National Water Management Plan NWMP
Bhadra was one of the 80 projects included in the World Bank funded NWMP. The modernization concept used in the Bhadra project is based on the “structured system” design which is basically using ungated proportional structures, with the last operated gate high up in the system, for instance at the entrance of the secondary canal. The major advantage of the structured system is the drastic reduction of operation as the numbers of gates remain low.
IWMI (1999) analysed the achievements of this modernization phase by looking at key performance indicators and some of the main features of the irrigation process, before during and after completion of the work. They used among other source of data, remote sensing images to monitor the changes in cropping pattern.
The main conclusions of IWMI study is that: The structured system design and an equitable supply-based technology, central to the National Water Management Project (NWMP) intervention in the Bhadra project, did not succeed for various reasons.

WORKING DOCUMENT NOT to be quoted
13
Reasons proposed by IWMI for the failure of the structured concept are:
• the lack of participatory development (WUAs)
• the operating procedures did not consider the heavy rainfall and its spatial variability across the command area.
• the cropping pattern was unrealistic, particularly with lack of farmer acceptance and adherences to rules of operation.
• lack of proper mechanisms to insure sufficient maintenance of the system.
As far as operation is concerned the main reason for missing the target is that the canal supply needs to be variable to value high rainfall in the CA whereas the operation has remained with full discharge running only.
The 2007 Project: Rehabilitation focus With the purpose of realizing timely and equitable water distribution a modernization project has been recently designed and will be implemented in 2007. This project is called “Modernization Project” however according to FAO definition it should be called “Rehabilitation project” as no modernization concepts are introduced in it. The major works proposed are:
• Repairs to service and emergency gates, painting, grouting and stilling basin. • Providing appropriate lining for Main canals, Branch canals, pickup canal,
Distributories and minors. • Rehabilitation of old structures like Aqueducts, Gates and other structures.
According to the Irrigation officials the proposed project could realize high cost
effective irrigation system as the project shows the high Benefit Cost ratio of 2.54 which justifies the top priority given for modernization by the Government of Karnataka. By “modernizing” the canal system, achieving the 76% of conveyance efficiency with planned utilization of 61.70 T.M.C is possible.
In the 1st phase, the modernization of works to an extent of Rs 471 crores are taken up. .

WORKING DOCUMENT NOT to be quoted
14
3. MASSCOTE in Bhadra project
Step 1. RAPID DIAGNOSIS: RAP A RAP (Rapid Appraisal Procedure) was carried out as part of the first step of the exercise during the January 2007workshop. The following sections is the RAP executive summary.
RAP Methodology The RAP is a quick and focused examination of irrigation systems and projects that can give a reasonably accurate and pragmatic description of the status of irrigation performance and provide a basis for making specific recommendations related to hardware and management practices. The first step in evaluating irrigation performance, whether at the farm level or an entire irrigation project, is to perform a rapid appraisal (RAP) of the system as it is being operated. The RAP can be described as follows:
The Rapid Appraisal Process (RAP) for irrigation projects is a 1-2 week process of collection and analysis of data both in the office and in the field. The process examines external inputs such as water supplies, and outputs such as water destinations (ET, surface runoff, etc.). It provides a systematic examination of the hardware and processes used to convey and distribute water internally to all levels within the project (from the source to the fields). External indicators and internal indicators are developed to provide (i) a baseline of information for comparison against future performance after modernization, (ii) benchmarking for comparison against other irrigation projects, and (iii) a basis for making specific recommendations for modernization and improvement of water delivery service.
Use of a systematic RAP for irrigation projects was introduced in a joint FAO/IPTRID/World Bank publication entitled Water Reports 19 (FAO) – Modern Water Control and Management Practices in Irrigation – Impact on Performance (Burt and Styles 1999). That publication provides an explanation of the RAP approach and gives the results from RAPs the authors conducted at 16 international irrigation projects. Refer to Water Report 19 for further background to the RAP approach, available directly from FAO (http://www.fao.org/icatalog/inter-e.htm). RAP is now fully integrated as the STEP 1 or the foundation of the new approach developed by FAO for modernization strategy and plans which is called MASSCOTE. A key component of the successful application of the RAP and MASSCOTE approaches is the knowledge and experience of qualified technical experts that can make proper design and modernization decisions. It is critical that MASSCOTE-RAPs are conducted by irrigation professionals with an extensive understanding of the issues related to modern water control. This technical capacity building will be addressed initially through training workshops that are going to be held by the FAO. In addition to making proper recommendations for modernization, evaluators using the RAP approach must have the ability to synthesize the

WORKING DOCUMENT NOT to be quoted
15
technical details of a project with the concepts of water delivery service into a functional design that is easy-to-use and efficient. Key performance indicators from the RAP help to organize perceptions and facts, thereby facilitating the further development of a modernization plan through the different steps of MASSCOTE. From the RAP we have already some good indications on:
• Further investigations that should be carried out for the development of the modernization plan.
• Specific actions that can be taken to improve project performance • Specific weakness in project operation, management, resources, and hardware • The potential for water conservation within a project
Broad goals of modernization are to achieve improved irrigation efficiency, better crop yields, less canal damage from uncontrolled water levels, more efficient labor, improved social harmony, and an improved environment by reducing a project’s diversions or increasing the quality of its return flows. In general, these goals can only be achieved by paying attention to internal details, or the internal indicators. The RAP addresses these specific internal details to evaluate how to improve water control throughout the project, and how to improve the water delivery service to the users.
Looking at different management levels
When one analyzes a project by “levels” (office, main canal, second level canal, third level canal, distributaries, field), a huge project can be understood in simple terms. The operators of the main canal only have one objective – everything they do should be done to provide good water delivery service to their customers, the distributary/minor canals (and perhaps a few direct outlets from the main canal). This “service concept” must be understood and accepted by everyone, from the chief engineer to the lowest gate operator. Once it is accepted, then the system management becomes very simple. Personnel on each level are only responsible for that level’s performance. An important step of MASSCOTE is precisely to start from this diagnosis and re-organize the management of the system into units which are functional, responsible and responsive and consistent with the main features diagnosed in the gross command areas. Again in these newly constructed projects diagnosis has been made on the Design, the Planned , the Stated by managers and NOT on practices which have not yet started. Main canal operators do not need to understand the details of that day’s flow rate requirements for all the individual fields. Of course, in order to subscribe to the service concept, operators generally need to know that their ultimate customer is the farmer. But the details of day-to-day flow rates do not need to be known at all levels. Rather, the main canal operators have one task to accomplish – to deliver flow rates at specific turnouts (offtakes) with a high degree of service.

WORKING DOCUMENT NOT to be quoted
16
RAP in Bhadra A Rapid Appraisal Procedure was carried out in both projects focused on planned project operations and the current status of canal system infrastructure. The objective was to identify the key factors related to water control, measurement and communications in the system as well as to the social organisations. The completed results of the RAP including those for the main canal, secondary and tertiary canals, and final deliveries are contained in excel files attached.
Participants were divided into 4 groups: – Group 1: UPSTREAM LB and RB (km 0 to km 30) – Group 2: MIDSTREAM (km 30 to km 80) and Anveri Branch – Group 3: MIDSTREAM (km 80 to km 103) and Malebennur Branch – Group 4: DOWNSTREAM (km 103 to end of system)
They spent 2 days on the field and gave ratings to all internal indicators. During a plenary session rating were reviewed and finalized.
External indicators
The external indicators compare input and output of an irrigation system to describe overall performance. These indicators are expressions of various forms of efficiency, for example water use efficiency, crop yield, and budget. But they do not provide any detail on what internal processes lead to these outputs and what should be done to improve the performance. They, however, could be used for comparing the performance of different irrigation projects, nationally or internationally. Once these external indicators are computed, they are used as a benchmark for monitoring the impacts of modernization on improvements in overall performance. A first estimation of the external indicators has been carried out during the workshop. It has led to the estimated value per ha of 1154 $ while productivity of water amounts to 0.15 $ m3. Both external indicators are high with respects to international standards, this is the consequence of having a significant part of the cropping pattern allocated to cash crops.
Accounting for actual irrigation In this first estimation based on project data, the area under perennial crops (sugarcane and garden) is estimated at 25000 ha that is 25 % of the official CA and 20 % of the actual CA including unauthorized. However there are ample evidences from the field visit that these figures are far too low. Another rough estimation with the following assumptions supported by field visits was made afterwards:
• 25 % of extra irrigated areas, mostly focused on cash crops, putting the total actual CA to 130,000 ha (not including Gondi Anicut and Shantisagar irrigated areas)

WORKING DOCUMENT NOT to be quoted
17
• The upstream part of the CA is covered by rice at 20% [ LBC + RBC down to km 80 and Anveri branch] official area is 40 921 ha
• the downstream part of the CA by rice at 60% [ Malebennur Davangere + DBK Pick up]. Official area is 64000 ha.
Plate 5. Irrigated uphill side of the canal using direct lifting in the canal or the canal-fed shallow groundwater These assumptions lead to the cropping pattern summarize in table 2. . Perennial Rabi Kharif Perennial Sugarcane 30000 ha Garden
(Aricanut + Coconut)
30000 ha
Total 60000 ha Rice 40000 ha 60000 ha Dry crops 10000 ha 10000 ha Fallow 20000 ha Total 130000 ha 130000 ha
Table 2. Second guess estimates for cropping pattern and irrigated areas. With these assumptions on the cropping pattern, the contribution from garden reaches 61 % of the total gross product in the actual CA (360 Millions$/year). External indicators amounted to respectively 2187 $ ha and 0.23 $ m3 while the irrigation intensity amounts to 185 %.
WORKING DOCUMENT NOT to be quoted
18
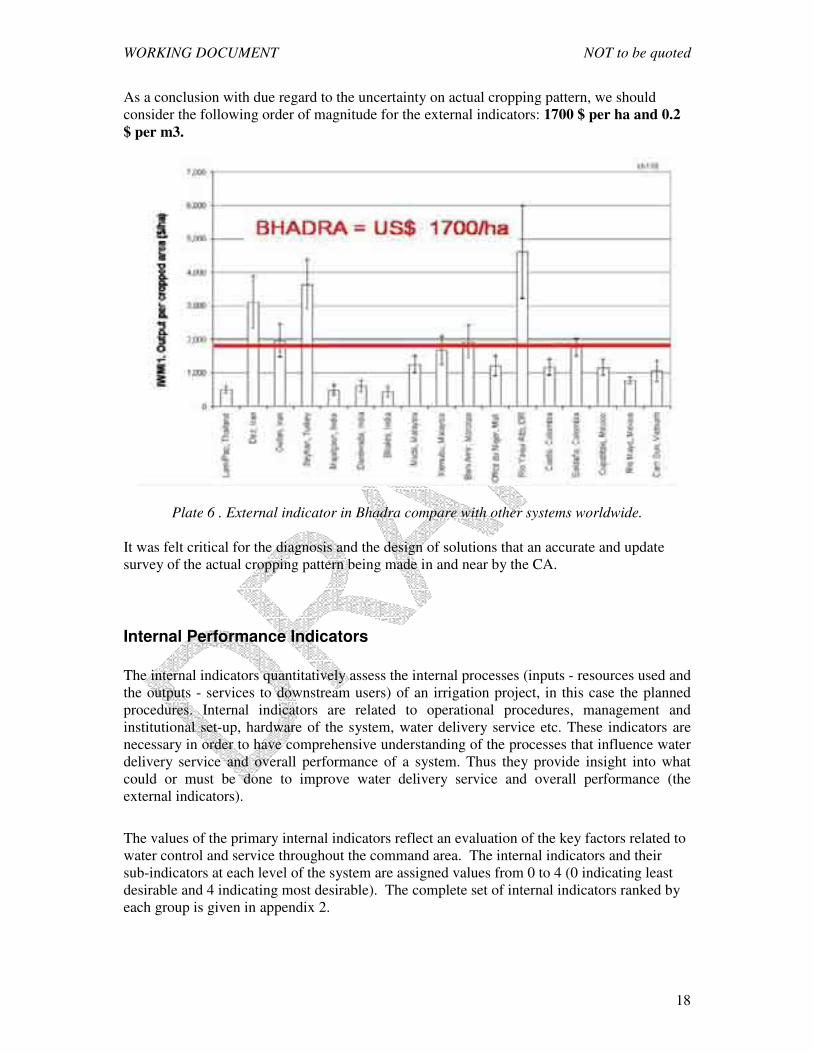
As a conclusion with due regard to the uncertainty on actual cropping pattern, we should consider the following order of magnitude for the external indicators: 1700 $ per ha and 0.2 $ per m3.
Plate 6 . External indicator in Bhadra compare with other systems worldwide. It was felt critical for the diagnosis and the design of solutions that an accurate and update survey of the actual cropping pattern being made in and near by the CA.
Internal Performance Indicators The internal indicators quantitatively assess the internal processes (inputs - resources used and the outputs - services to downstream users) of an irrigation project, in this case the planned procedures. Internal indicators are related to operational procedures, management and institutional set-up, hardware of the system, water delivery service etc. These indicators are necessary in order to have comprehensive understanding of the processes that influence water delivery service and overall performance of a system. Thus they provide insight into what could or must be done to improve water delivery service and overall performance (the external indicators).
The values of the primary internal indicators reflect an evaluation of the key factors related to water control and service throughout the command area. The internal indicators and their sub-indicators at each level of the system are assigned values from 0 to 4 (0 indicating least desirable and 4 indicating most desirable). The complete set of internal indicators ranked by each group is given in appendix 2.

WORKING DOCUMENT NOT to be quoted
19
Features about the Service
Social Order
Social "Order" in the Canal System operated by paid employees 0.5
Degree to which deliveries are NOT taken when not allowed, or at flow rates greater than allowed 1.0
Noticeable non-existence of unauthorized turnouts from canals. 0
Lack of vandalism of structures. 0.3
Table 3. Social Order indicators
The social order in Bhadra is ranked very low 0.5 which confirms statement made by previous study (IWMI) when analysing the failure of the structured distribution system implemented during NWMP. Unauthorized irrigation is wide spread, and the distribution structures along the secondary canals are largely tampered.
Service to farmers
Actual Water Delivery Service to Individual Ownership Units (e.g., field or farm) 1.1
Measurement of volumes 0
Flexibility 1
Reliability 1 Apparent equity. 1
Table4. Service to farmers The service to farmers is ranked very low [1.1] significantly below average when compare to others system worldwide (Plate 5). Service by main canal
Actual Stated Actual Water Delivery Service by Main Canal to the Second Level Canals 1.8 1.8
Flexibility 1 1 Reliability 2 3
Equity 2 4
Control of flow rates to the submain as stated 1.5 0
Table5. Service from main to secondary canals

WORKING DOCUMENT NOT to be quoted
20
Plate 7. Actual and Stated Delivery at farm level. The service by the main canal to secondary canal is ranked at 1.8 (Actual = Stated) which set Bhadra project about the average when compare with other indicators recorded in other systems worldwide (Plate 8.) .
Plate 8. Actual and stated service from the main canal
Main problems along the distribution network The two previous indicators i.e. low service to farmers and average delivery service by main canal is a clear indication that the main issue of operation and service delivery lies within the secondary network and below.

WORKING DOCUMENT NOT to be quoted
21
This analysis is confirmed by the comparison of indicators at various level of the system Plate 9 showing a decreasing of performance with the level of network.
Internal indicators
0
0.5
1
1.5
2
2.5
3
Main Second Tertiary
Indi
cato
rs
Turnouts Communication
Plate 9. Indicators per canal level
Lack of real participatory management: WUA
Water User Associations 0.2 Percentage of all project users who have a functional, formal unit that participates in water distribution 0
Actual ability of the strong Water User Associations to influence real-time water deliveries to the WUA. 0
Ability of the WUA to rely on effective outside help for enforcement of its rules 1
Legal basis for the WUAs 1
Financial strength of WUAS 0 Table 6. Water Association assessment
The ranking for WUA is extremely low. Basically the investment on participatory management has remained so far on paper.
Lack of water level control The lack of water level control affects all levels of the network but the consequences on the flows is limited along the main canal as discharge remains quite constant and offtakes are low sensitive, while it highly increases below the main canal (see Plate 10).
Small pockets of water scarcity For the whole system in Kharif season water is abundant and allows for cropping 100 % of the CA, while Rabi season is facing water shortages, which can be severe depending on the storage in the reservoir at the end of Kharif. Over a period of 33 years 6 years have seen severely limited amounts of water during Rabi (1 year out of 5).

WORKING DOCUMENT NOT to be quoted
22
Plate 10 Recent lined canal showing the poor design of irrigation structure to control water flows (farmers are using stones and straws to block the water –of course the process is not leak free)
This water scarcity does not affect the entire CA in the same way. During the field survey, indications of water scarcity were sought for and the conclusions is that only the very downstream part of the CA is facing problems to ensure a second crop as it can be seen in the plate below. Although we were told that water scarcity is widely spread out at the tail-end of each secondary canal, evidence of that is not straightforward on the ground. In most places the heavy presence of perennial crops and the type of natural vegetation indicates that 2 irrigated crops a year is regularly the pattern. Water scarcity does exist but on very limited pockets such as in downstream part of DBK Pick up and Davangere CAs as shown in plate 11. Improving equity and service to tail-enders is certainly a major objective which can be obtained.
Plate 11. Identifying water scarcity: Left tail end of SC 14 in Malebennur Branch Canal with typical perennial vegetation thriving on double irrigation/year – Right Area where only one crop a year is grown (No perennial vegetation and a typical dry zone bush) (downstream reaches of DBK pick up.
WORKING DOCUMENT NOT to be quoted
23
Step 2. SYSTEM CAPACITY AND SENSITIVITY. Objective: Assessing the physical capacity of irrigation structures to perform their function of transport, control, measurement, etc. Assessing the sensitivity of Irrigation Structures (offtakes and regulators), identification of singular points. Mapping the sensitivity.
Storage capacity Storage at Main Dam Calculation shows that the Bhadra dam reservoir capacity and availibity is good (see appendix). However the management of the storage/reservoir should be improved by introducing a dynamic operation accounting for expected runoff from the main catchment and rainfall within the CA during Kharif (see Step 9). Storage at other dams • Gondi anicut: storage sufficient • Debekere Pick up: the storage capacity of the reservoir has to be increased by raising the spill level (adding gates at spill structure). Buffer storages • on initial reaches of main canal (BRRBC & BRLBC) are sufficient but needs improvements and regulating arrangements. For instance there are about 11 tanks attached to LBC which could certainly be included as buffer storage in the network. • on DBC (Davangere) buffer storage are insufficient. Harapanahalli, Margondanahalli, and Kondajji tanks along DBC needs restoration like desilting to increase storage capacity. • More buffer storages are required along MBC & DB kere pick up canals. Buffer storages at 3.2 Km of DB kere & 6 th Km of RBC of DB kere needs restoration & improvements for additional storage. Better use of existing facilities as buffer storage:
The Shantisagar tank located at the upstream part of DBC can be fed by surplus water from DBC (at Ch 4.600 km of Davanagere Branch canal) and used as a buffer storage. Water cannot be re-inject into DBC but can drained down to the DBK pick up to overcome shortages in tail end command for second crop.
Increasing the capacity of existing tanks in command area like Kondajji tank (Harapanahalli Branch Canal), Hadadi tank (HBC) , Lokikere tank (7th zone of DBC), Bathikere to be used as a buffer storage.
Buffer storage tanks On the Distributory network of MBC. Water from Dy-6 of MBC is let out to the Koolambi tank and in turn serves the atchkat of about 900Acre.
Buffer storage tanks On the Distributory network of RBC. Buffer Storage tank for DY-19 of RBC which gets supply from tail end of Dy-18 and out let -14 of D-19. Which serves irrigation to the some atchkat of Dy-19.
WORKING DOCUMENT NOT to be quoted
24
There is a pick-up across Anvery branch Canal @ Ch 8.1km. This canal proceeds further from the pick-up.
Balancing Reservoirs on Harappanahalli Distributory :- 4 Nos. 1. Hiremegalakere @ 9th km of HPD. 2. Malagondanahalli tank on 9C ( third level canal) of HPD. 3. Kondajji tank @ tail end of 9C( third level canal) of HPD. 4. Harasapura pick-up on HPD. Developing new buffer storage:
New buffer storages along Anvery Branch canal, Malebennur Branch canal, Harapanahalli Branch Canal (like Kondajji tank) to be investigated.
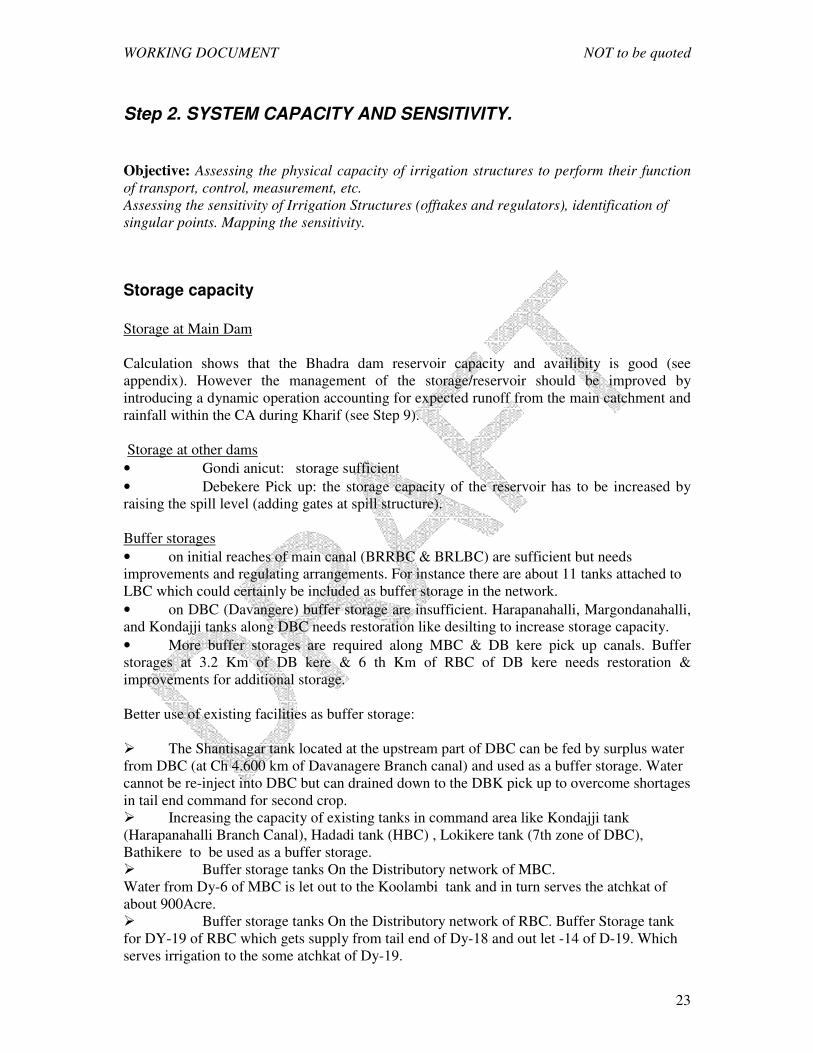
The issue of Management Capacity at main reservoir. As said previously storage capacity at the main dam is sufficient, however the management of the reservoir is not organized in the best way one can think of. The capacity of reservoir management should be drastically increased together with the canal system. At present the issues from the dam are maintained constant whatever happens in terms of rainfall in the CA. Only when the reservoir runs very low in Rabi i.e. close to dead storage level, they are practising ON-OFF issues. Flexibility of issues with rainfall is too low As illustrated in plate 10 for a sequence of days taken during Kharif 2004, the reduction of the issues when there is significant rainfall in the CA does not occurred or only on a limited period and limited cutback. As a result the reservoir was not full at Kharif’s end, and the issues during the following Rabi were reduced accordingly. It should be assumed that another management strategy with more efforts in the command area to harvest rainfall and avoid waste of water during Kharif is likely to yield to significant increased of the water availability during the following Rabi season.
Plate 12. Issues from Bhadra during Kharif 05 and 06 and Rabi 05/06
BHADRA- W a te r issue s from re se rvoir in cuse cs
0
500
1000
1500
2000
2500
3000
Q c
usec
s
29/07/05 27/11/05 06/01/06 31/05/06 11/07/06 15/11/06
LBC
RBC

WORKING DOCUMENT NOT to be quoted
25
Issues and rainfall RBC
0
10
20
30
40
50
60
70
80
02/0
8/20
04
03/0
8/20
04
04/0
8/20
04
05/0
8/20
04
06/0
8/20
04
07/0
8/20
04
08/0
8/20
04
09/0
8/20
04
10/0
8/20
04
11/0
8/20
04
12/0
8/20
04
13/0
8/20
04
14/0
8/20
04
15/0
8/20
04
16/0
8/20
04
17/0
8/20
04
18/0
8/20
04
19/0
8/20
04
20/0
8/20
04
21/0
8/20
04
Dis
char
ge
m3/
s R
ain
fall
mm
Rainfall
Issues
Plate 13. Illustration of the low reactivity of issues with respect to rainfall [Kharif sequence in August 2004]
Conveyance Carrying capacity of Main canals, secondary canals & other canals is sufficient but needs routine maintenance like desilting. The main feature related to Conveyance are: • Encroachment of FB is observed all along the canal • Carrying capacity of some aqueducts in initial reaches is insufficient. • Syphons on DBC are insufficient • Leakages in aqueducts, siphons etc.. • Scouring of canal sides, siltation, vegetation growth here and there. • In Distributories & Minors, siltation and vegetation and damage of structures, temporary obstructions by farmers are common.
Plate 14. Left encroachment of the free board along ABC- Right leaks from parent canal
through a wall at old headwords of Anveri Branch
WORKING DOCUMENT NOT to be quoted
26
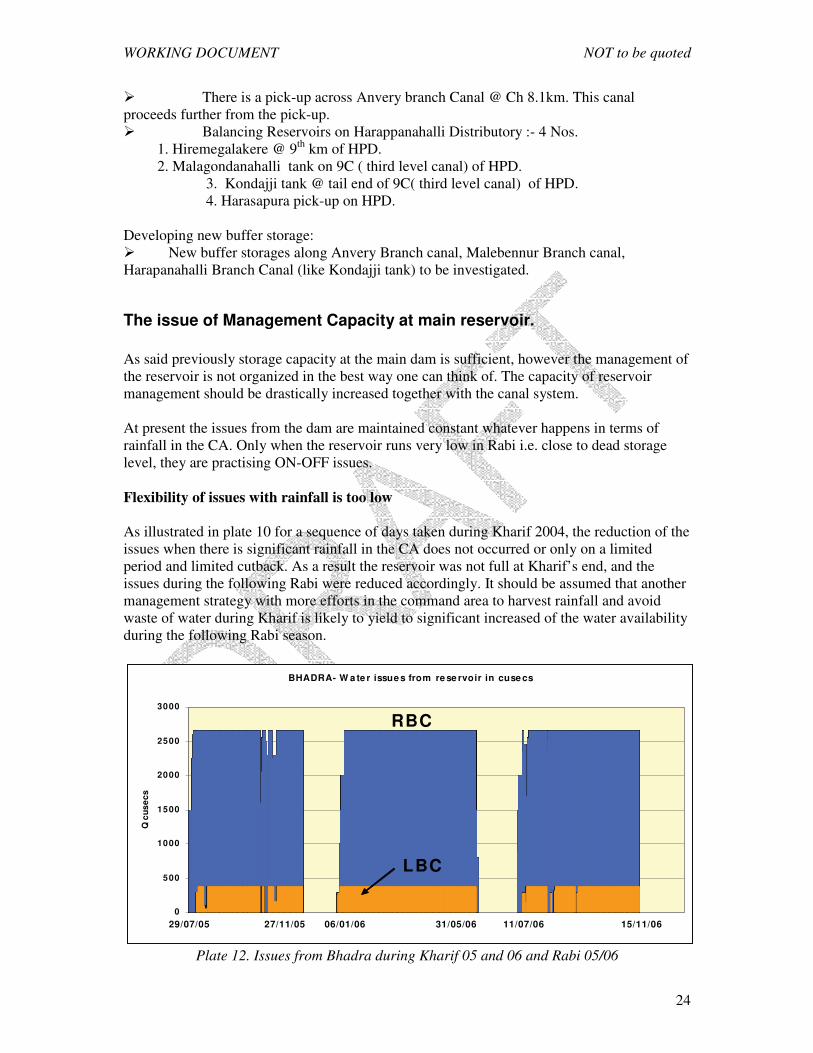
Diversion Capacity of diversion structures at main canal levels is sufficient but needs routine
maintenance. • The offtakes on Main canal are serving their purpose satisfactorily • Most of the Semi modular and gated structures on distributories and minors are damaged. • Gated outlets to be provided along distributories and minors.
Plate 15. A partitioning structure at km 103(Malebennur/Davangere branch) with a repartition rule of 35/ 65.
Distribution • Main canal: No problem of distribution of water at this level. • Second level canal: Medium to serious problems of distribution of water at this level. • Third level canal: serious problems exist at this level. • Final deliveries: Problems exits at this level in proper water distributions. Probably the main reasons for the problems met at secondary level distribution and below are the absence or the weakness of WUA, an ineffective water level control and unauthorized offtakes. The concept of the last modernization NWMP, e.g. the structured system or proportional distribution below the secondary headworks, did not work properly. So from the immediate aftermath of the project (IWMI, 1999) till now the balance between demand management (farmers controlling the flow) and supply management (imposed discharge shared proportionally) has not been solved. One can find:
• proportional structure that are working fine • proportional structure that are tampered temporary (plate ) or permanently by adding
gates (plate ) • gated structures that have been tampered (plate ).
WORKING DOCUMENT NOT to be quoted
27
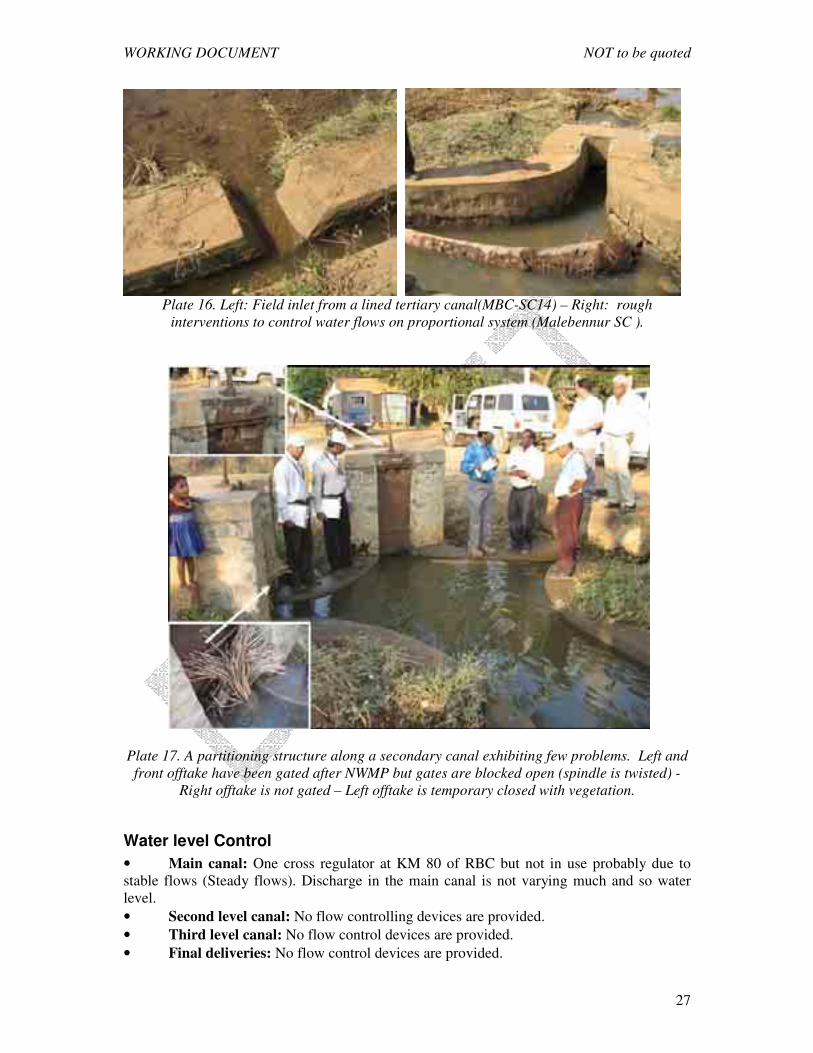
Plate 16. Left: Field inlet from a lined tertiary canal(MBC-SC14) – Right: rough
interventions to control water flows on proportional system (Malebennur SC ).
Plate 17. A partitioning structure along a secondary canal exhibiting few problems. Left and front offtake have been gated after NWMP but gates are blocked open (spindle is twisted) -
Right offtake is not gated – Left offtake is temporary closed with vegetation.
Water level Control • Main canal: One cross regulator at KM 80 of RBC but not in use probably due to stable flows (Steady flows). Discharge in the main canal is not varying much and so water level. • Second level canal: No flow controlling devices are provided. • Third level canal: No flow control devices are provided. • Final deliveries: No flow control devices are provided.

WORKING DOCUMENT NOT to be quoted
28
Exception to the absence of water level controlling devices along the distributories: 2 Duckbill weirs are in the working conditions across DY-22 @ ch 1.6km and Ch 5.4km. More such Duckbill to be installed for water level control. Tail end of MBC & DB kere pick up canals needs adequate cross regulators.
Measurements • Main canal: Flow measuring is carried out at this level using a hydraulic gate formula with very poor calibration (low accuracy). • Second level canal: Some flow measuring devices are provided. • Third level canal: No flow measuring devices are provided. • Final deliveries: No flow measuring devices are provided. Main canal Measuring devices are present only at 1.200km, 26.700, 79.000km of RBC and at 2.400km of LBC, off takes of MBC & DBC.
There is a need for one more measuring device along LBC Calibration was done long back. All measuring devices are to be calibrated. At ch. 33.20 there is a flume to be made functional and used for measurement instead
of measuring the water level at road bridge. Secondaries, Distributories & Minors
Existing measuring devices are to be repaired, calibrated and put back to use. Measurement procedures have to be checked. Some wrong measurements have been
noticed for the downstream condition (downstream gauge is used whereas offtake runs free flow)
Sufficient no. of measuring devices at key points to be installed. Depending on the management strategy that will be adopted for Bhadra a complete revision of the network of measuring devices will have to be carried out. Key points of the infrastructure, to be considered are spill points, change point of management, inlets to the canal, outlets from tanks, etc...
Plate 18. A recently rehabilitated flume at Km 32 Malebennur Branch Canal

WORKING DOCUMENT NOT to be quoted
29
Plate 19. Wrong assessment of discharge using downstream gauge value whereas flow is non submerged (MB. Headworks of SC6).
Safety Main canal
Adequate safety structures are there along the main canal. Few new Canal Escapes may be provided. There is encroachment of FB at some locations. Suitable preventive measures are to be
taken such as raising of banks, removal of silt Distributories • In some sections, water is flowing to the brim. • Turbulent flow is noticed immediately after some of the off-takes. Proper transitions to be provided so that flow is steady. • Also, In HPD @9th Km, one relieving weir is provided which leads to hiremagalagere tank. • In 9thc of HPD a relieving weir is provided which leades to malagondahalli and kondajji tanks.
Transmission and communication: • Service Roads all along the canals needs improvements& routine maintenances. • Communication among operators, supervisors & maintenance staff is good. • Rainfall data acquisition and processing is required. • Communication at all levels is effective from one level to another.
WORKING DOCUMENT NOT to be quoted
30
Main canal The discharge data to be centralized. Frequency of gauge reading to be increased i.e., from the present average 8 hourly
readings to 2 hourly readings along the main canal. Infrastructure facilities such as buildings for stay of gauge readers Manual SCADA to be introduced.
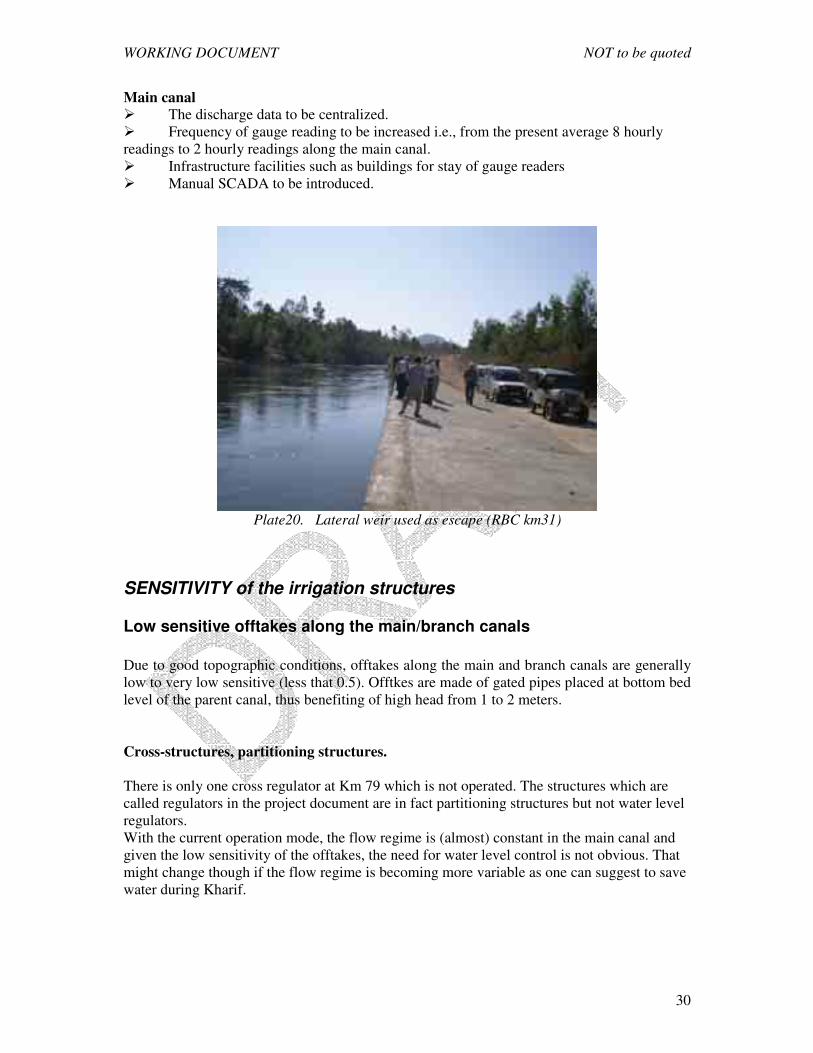
Plate20. Lateral weir used as escape (RBC km31)
SENSITIVITY of the irrigation structures
Low sensitive offtakes along the main/branch canals Due to good topographic conditions, offtakes along the main and branch canals are generally low to very low sensitive (less that 0.5). Offtkes are made of gated pipes placed at bottom bed level of the parent canal, thus benefiting of high head from 1 to 2 meters. Cross-structures, partitioning structures. There is only one cross regulator at Km 79 which is not operated. The structures which are called regulators in the project document are in fact partitioning structures but not water level regulators. With the current operation mode, the flow regime is (almost) constant in the main canal and given the low sensitivity of the offtakes, the need for water level control is not obvious. That might change though if the flow regime is becoming more variable as one can suggest to save water during Kharif.
WORKING DOCUMENT NOT to be quoted
31
Sensitivity of Water level along the secondary canals There is no water control structure along the secondary canals (except 2 DBW in ) therefore the water level is dictated by the discharge. With a water level of 0.5 meter the estimated proxy of sensitivity along SC is 0.3 which is quite low.
High sensitive offtakes along the secondary canals
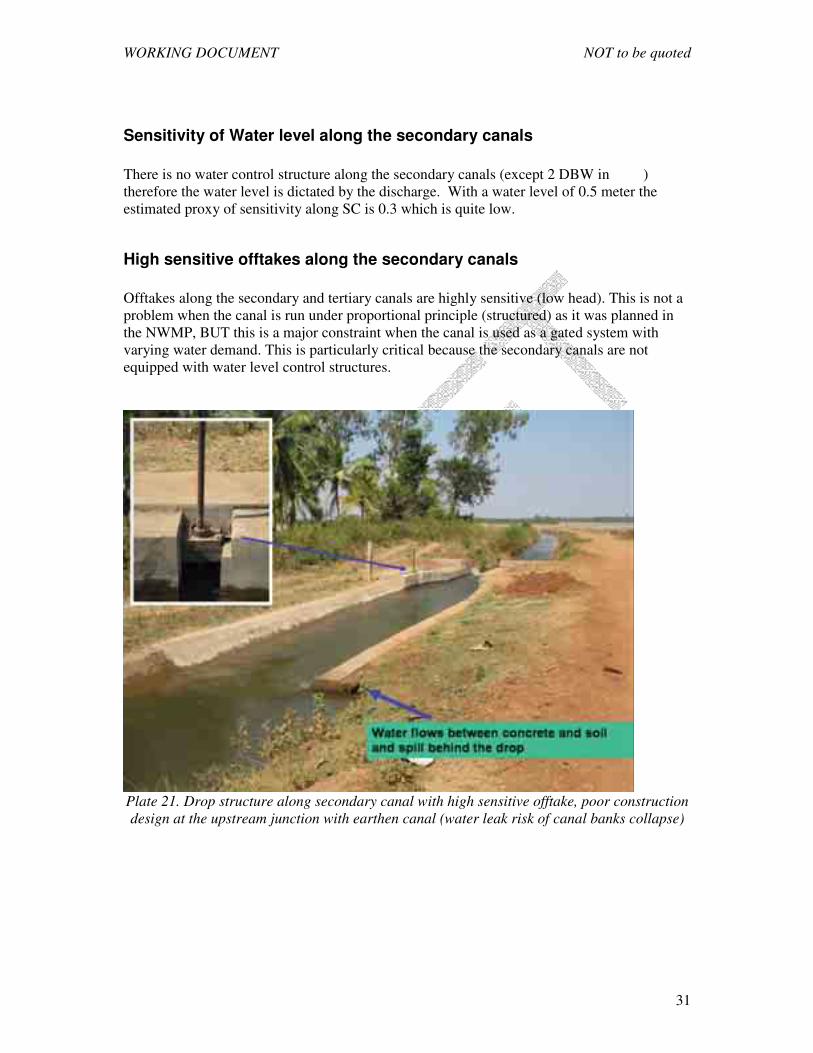
Offtakes along the secondary and tertiary canals are highly sensitive (low head). This is not a problem when the canal is run under proportional principle (structured) as it was planned in the NWMP, BUT this is a major constraint when the canal is used as a gated system with varying water demand. This is particularly critical because the secondary canals are not equipped with water level control structures.
Plate 21. Drop structure along secondary canal with high sensitive offtake, poor construction design at the upstream junction with earthen canal (water leak risk of canal banks collapse)

WORKING DOCUMENT NOT to be quoted
32
STEP 3: THE PERTURBATIONS Perturbations analysis: causes, magnitudes, frequency and options for coping with. Censing the perturbations
Causes
• Rainfall within the CA reducing the demand for canal water • Unauthorized lifting (pumps), illegal withdrawals (pipes). • Runoff entering the main canal. • Rotation system of distribution (usually 10 days ON/OFF) • Perturbations increase downwards along the main canal
Magnitudes
• Unknown: Measurement of quantum of rain water entering the canal will help the management to take corrective measures to control perturbation.
Location
• All along the main and branch canal (single bank) • It increases downwards
Frequency
• During Kharif major perturbation is due to rainfall and runoff • During Rabi major perturbation is due to illegal withdrawals.
Options for Copping with
• Buffer storage: excess flows can be stored in buffer storage tanks and can be utilized later.
• Restriction of illegal withdrawals. Table 7. Perturbations
Single bank canal and runoff The main source of perturbation in the Bhadra project is the results of runoff from the uphill side of the canal. Main and branch canals are most of the time a single bank canal type (contour canal) with many entry points of runoff either equipped as inlets as seen in picture below or directly from the bank uphill side. At present this sort of perturbation is not affecting the main canal regime (discharge) as the canal is equipped with side low weir escapes, which divert immediately any surplus into the drainage system. Silt entrance with runoff With runoff a lot of silt is entering the canal network and is creating problems of conveyance capacity.
Linked perturbation to existing buffer storage There are several storages within the command area that can be used as buffer storage whenever rain occurs in the CA. The modernization plan will target a better use of water surplus generated during rainfall events through buffer storage.

WORKING DOCUMENT NOT to be quoted
33
Plate 22. A runoff entry point in the main canal (Malebennur Branch canal)
Plate23. Kondajji tank in the Davangere main canal CA

WORKING DOCUMENT NOT to be quoted
34
Step 4 MAPPING WATER NETWORKS & WATER BALANCE/ACCOUNTING Objective: The objective here is to map the nature and structure of all the streams and flows that affected and are influenced by the command area. It includes assessing the hierarchical structure and the main features of the Irrigation and drainage networks, natural surface streams and groundwater, and the mapping of the opportunities and constraints including drainage and recycling facilities.
NETWORKS The Tunga river drains the downstream part of the LBC, while Bhadra rivers drains the upper part of LBC and RBC. After the junction, the river renamed Tunga Bhadra drains the ABC, MBC and DBC (see index map)
WATER ACCOUNTING: Water accounting is a fundamental of irrigation water management as well as operation of the canal infrastructure. It is observed that no water accounting has yet being properly done for the two projects.
RAINFALL Highly variable rainfall in the command area Long term annual rainfall in the Command Area (CA) varies significantly from 950 mm in the upper reaches (Bhadravathi) to 650 mm in the tail end of Davangere. Last decade annual rainfall between 1994 and 2003 shows a significant reduction compare to long term value: Bhadravathi amounts to 780 mm while Davangere 610 mm.
STREAM FLOW FROM OUTSIDE THE COMMAND It is estimated that an annual volume of 721 MCM is entering the CA directly through the canal network or through drainage. This estimation has been calculated considering: the catchment areas (see plate above), the spatial variation of rainfall [ 500 to 900 mm], the spatial variation of runoff coefficient mainly due to a variable density of tanks in each sub-catchment.
WORKING DOCUMENT NOT to be quoted
35
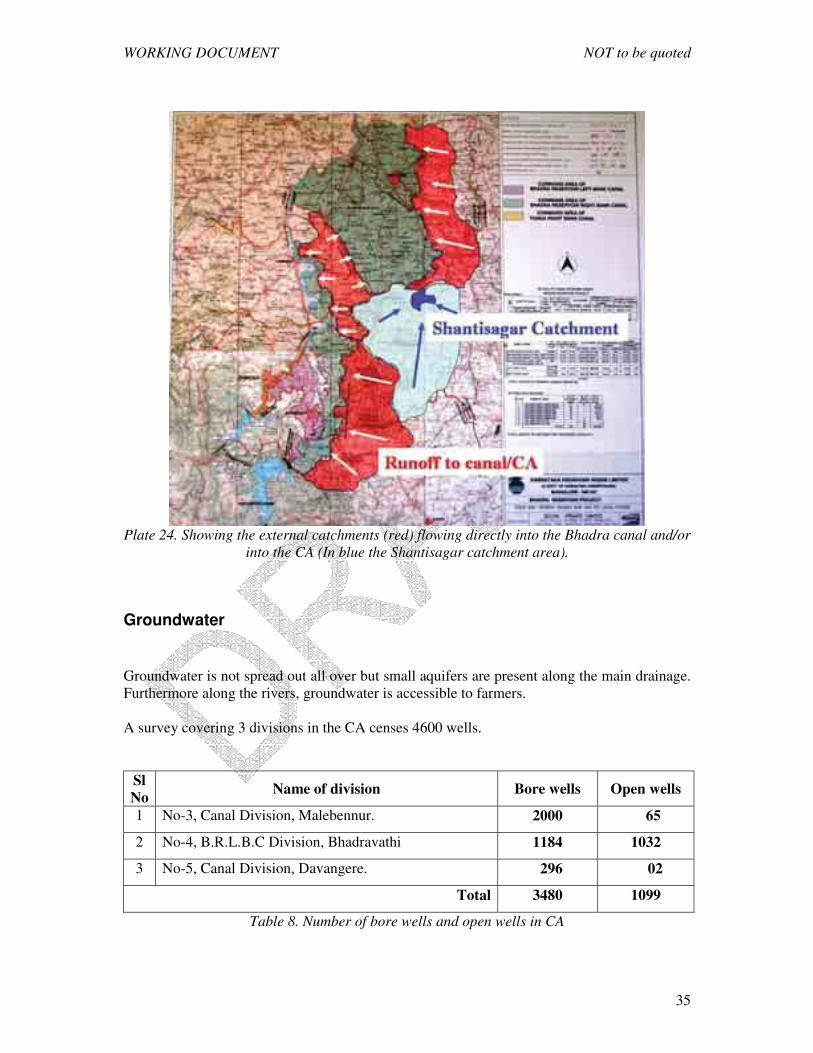
Plate 24. Showing the external catchments (red) flowing directly into the Bhadra canal and/or
into the CA (In blue the Shantisagar catchment area).
Groundwater Groundwater is not spread out all over but small aquifers are present along the main drainage. Furthermore along the rivers, groundwater is accessible to farmers. A survey covering 3 divisions in the CA censes 4600 wells.
Sl No
Name of division Bore wells Open wells
1 No-3, Canal Division, Malebennur. 2000 65
2 No-4, B.R.L.B.C Division, Bhadravathi 1184 1032
3 No-5, Canal Division, Davangere. 296 02
Total 3480 1099
Table 8. Number of bore wells and open wells in CA

WORKING DOCUMENT NOT to be quoted
36
CANAL WATER ISSUES Issues from the Dam are quite constant (see plate 12). Average volume per season [1972-2006] is similar for Rabi and Kharif 935 MCM (appendix IV).
OUTFLOWS
EVAPOTRANSPIRATION: The Evapotranspiraton is the largest and most important component of water balance.
This is estimated as the product of cropped area irrigated and evepotranspiration (Etc) for each crop. Etc is the product of PET which is the potential evapotranspiration based on climatological data and Kc, the crop coefficient, which is specific to each crop. Thus, the quantity of water consumed as Evapotranspiration from the crops in the command can be worked out. Here, it is important to correctly assess the type of crops grown and the correct acreage. The area and crops grown by unauthorized irrigation within the command is to be considered also. If there is any limitation in the optimum use of water for any cropped area and shortage of water, a stress coefficient ranging from 0 to 1 will have to be considered to arrive at the right amount of Evapotranspiration.
From the field observation it is obvious that the official cropping pattern is not followed by farmers and that they are not at all going for dry crops. As far as the crop consumption is concerned the crops grown are very high consuming crops only: arica nut, coconut, sugarcane, bananas and paddy. Crop coefficients for these crops are always about or equal to 1. Therefore a rough proxy of evapotranspiration is given by PET itself. The value estimated for the entire command area of the project is 1400 mm for the annual value and the monthly variation is given in the table below with a peak in April and May at 5.32 mm/day, that correspond to a continuous flow at field level of 0.61 l/s/ha.
Plate25. Monthly evapotranspiration in Bhadra project
Monthly potential evapotranspiration in BHADRA project
0
20
40
60
80
100
120
140
160
180
Januar
y
Febru
ary
March
AprilMay
June
July
August
Septe
mber
October
Novem
ber
Decem
ber
PE
T m
m

WORKING DOCUMENT NOT to be quoted
37
Water recycling facility
Plate 26. The DBK pick up tank is capturing drainages water from large sub command areas of the downstream CA. DBK pick up is draining recycling the entire MBC canal and DBC till regulator 3.
Water Balance: a first proxy Average water balance at dam level from 1972 till 2006 [33 years] is as follows:
• Annual issues = 1870 MCM Kharif = Rabi = 935 MCM • Inflow to the reservoir 2526 MCM • Miscellaneous uses (domestic, river, evaporation) = 412 MCM • Spill from the dam = 244 MCM
Average Annual Water Balance at BHADRA DAM (MCM)
Rabi 37%
Kharif37%
Spill10%
Others (Domestic -river-Evap)
16%
Plate 27. Proxy of inputs from the reservoir to the GCA.

WORKING DOCUMENT NOT to be quoted
38
Seasonal water balance Water issues from
the Dam (mm) Rainfall mm
Runoff mm
Total mm
ETa (needs) mm
Relative water supply RWS
Kharif 720 700 550 1970 560 3 to 3.5 Rabi 850 0 0 850 680 1.25 Table 9. Seasonal water balance in Bhadra. Considering 130000ha and 110000 ha respectively irrigated during Kharif and Rabi. RWS is the ratio of the supply and the needs. While Kharif can be considered as abundant given the extra water generated by direct rainfall at field level and some surplus of water emanating from the runoff along the single bank canal and drained into the CA. Although not all the estimated 550 mm from runoff can be practically mobilised, the relative water supply during Kharif amounts to 3 plus. On the other hand the RWS during Rabi is very much low 1.25 at dam site. Therefore it is of critical importance to reduce issues during Kharif to allow more water during Rabi.

WORKING DOCUMENT NOT to be quoted
39
Step 5 MAPPING THE COST of OPERATION Objective: the objective is to gather as much as possible elements of costs entering into the operation of the system in order to identify where possible gains should be sought for with the current service and operational set up, and what would the cost of implementing improved service. This step thus focus on mapping the cost for current operation techniques and services, disaggregating the elements entering into the cost, costing options for various level of services with current techniques and with improved techniques.
Cost of Management Operation and Maintenance 750 Lakhs Rs is the current total budget of Management Operation and Maintenance for Bhadra (1.7 million $) which represents only a marginal fraction (0.5 %) of the value of the gross product generated (360 million $ per year). The MOM cost represents an average of 715 Rs per ha of the official CA (15 $) and only 310 Rs per crop season (6.5$).
Plate 28. Breakdown of the MOM costs
The analysis of the cost of MOM compare to the generated value shows the disproportion between the two. Although obviously this disproportion is fuelled by cash crops, it also applies to rice where the gross product amounts to 369 $ per hectare while the MOM cost amounts to 6.5 $, i.e. 2%.

WORKING DOCUMENT NOT to be quoted
40
Improving service at an increased cost The main conclusion about cost analysis is that cost of MOM should not be considered as a problem in the Bhadra system. Even if the cost for MOM is increased by 100 % to improve the service, it will remain below 1% of the gross value generated by the irrigated agriculture. Therefore improving the service to individual farmers, increasing the coverage of irrigation by better managing water, and charging the real cost of Operation to users should not be considered as a problem as it stays low compare to the value generated.

WORKING DOCUMENT NOT to be quoted
41
Step 6 SERVICE to USERS Objective: Mapping existing and possible options for services to Users with consideration to Farmers and Crops as well as to Other Users of water.
Bhadra: a multiple-uses system Although the agriculture use is dominant in volume and value generated, the multiple-use of water in Bhadra is an important feature. The censed uses are:
• Agriculture use • Domestic use • Industrial use • Fisheries • Power generation • Environmental use • Recreational use • Health & Sanitation of population • Ground water recharge Actors • WRD, WUAs, CADA, INDUSTRIALISTS are the main actors. • WRD is the service provider and WUAs and others are the receivers. • Mainly, WUAs are also deciders of service.
Mapping some of the multiple uses
Domestic use • Bhadravati ( 4 TMC) • Gondi Anicut – Gondi village. • Gadag – Betageri. • Mylaralingeshwara Jatri ( Huvina
Hadagali) • Lakkuhalli. • Shanthi nagar. • Shanthi sagar(surplus) – 0.5 TMC • From DBC to Kundavada Tank –
Davangare City
POWER production • On BLBC; Bhadra power project. • On BRBC: Bhadra power project. • Gondi Anicut (LBC): Under
Construction • Anevery BC: 750 KW (2 units), 1.5
MW • Saddle 2: Sai Deepti Power Plant
(Under Construction) • D - 22 on BRBC: 0.15 MW (2 units). • Total about 39.2 MW power is
generated.
Industrial services • From BRBC - Mysore Paper Mill,
Sugar factory at Bhadravati. • From DB Kere pick up – Sugar
Factory.

WORKING DOCUMENT NOT to be quoted
42
Plate 29. Multiple use of water in Bhadra CA: top left domestic use for washing – top right Power plant – bottom left recreational use bottom right agricultural use (aricanut and coconut).
A spatially variable service to agriculture/farmers The service to agriculture should be defined for sub command areas and for individual farmers, looking at allocation, scheduling and water deliveries. The definition and the spatial variation of the service should be based on objectives criteria related to the various sources of water supply. Canal services must be designed considering other sources rainfall, runoff during Kharif as well as recycling facilities and in some location access to groundwater. The cropping pattern: rice & non rice The service obviously depends on the type of crops grown in the area. In particular the volume, the schedule of water supply is different whether you grow rice or any other crops such as aricanut. Even the organization of tertiary distribution is very different with rice having a cascading system whereas other crops are based on individual fields. The proportion of rice in a sub-command area should then be considered as a driver of the service definition.

WORKING DOCUMENT NOT to be quoted
43
Rainfall As seen in STEP 3 the spatial variation of the rainfall in the CA is very high, annual average value ranges from 520 to 900 mm. 3 zones are proposed as shown in figure below. The annual variation of rainfall does not necessarily change the nature and type of service but certainly the volume allocated for Kharif. Basically a difference of rainfall of 300 mm per season is noticed between upstream and downstream zones and somehow the allocation should take that into consideration.
Plate 30. Zoning of the CA with respect to the annual average rainfall.
It is premature to indicate at this stage what service and where. One has to go through the followings steps including the partitioning of the CA in sub-command areas for which a specific service can be decided. What can be spelled out though are the general principle of the service in the project and the vision of the project.
The principle of Arranged service is proposed The users should be responsible for their allocation, scheduling and deliveries, and accordingly should be capable to adjust (arrange) the planning to account for alternatives sources of water and variation of the needs. This is all the more important for Kharif when rainfall occurs but also can have significant impact during Rabi. This arranged service must be contained of course within some limits depending on the physical characteristics of the system and the canal operation strategy. Limits are related to maximum allowed variation of discharge, variation of timing, notice to proceed with the adjustment, etc...
WORKING DOCUMENT NOT to be quoted
44
The vision The Service Oriented Management strategy maps out the VISION underlining the future of the system! It conditions to a large extent underlies the further steps of development service and modernization plans, this VISION discussed during the workshop is as follows: “A modern, economically sustainable, multipurpose water resource project, maximizing agricultural outputs and water productivity through adoption of modern irrigation management techniques, stake holders participatory management, greatly enhancing the quality of life of the people and economic outputs while preserving and enhancing the quality of environment”
WORKING DOCUMENT NOT to be quoted
45
Step 7 PARTITIONING IN MANAGEMENT UNITS The irrigation system management should be partitioned into few level of management and the command area should be divided and subunits (subsystems and/or subcommand areas) that are held homogeneous and/or separate from one another by a singular point or a particular borderline.
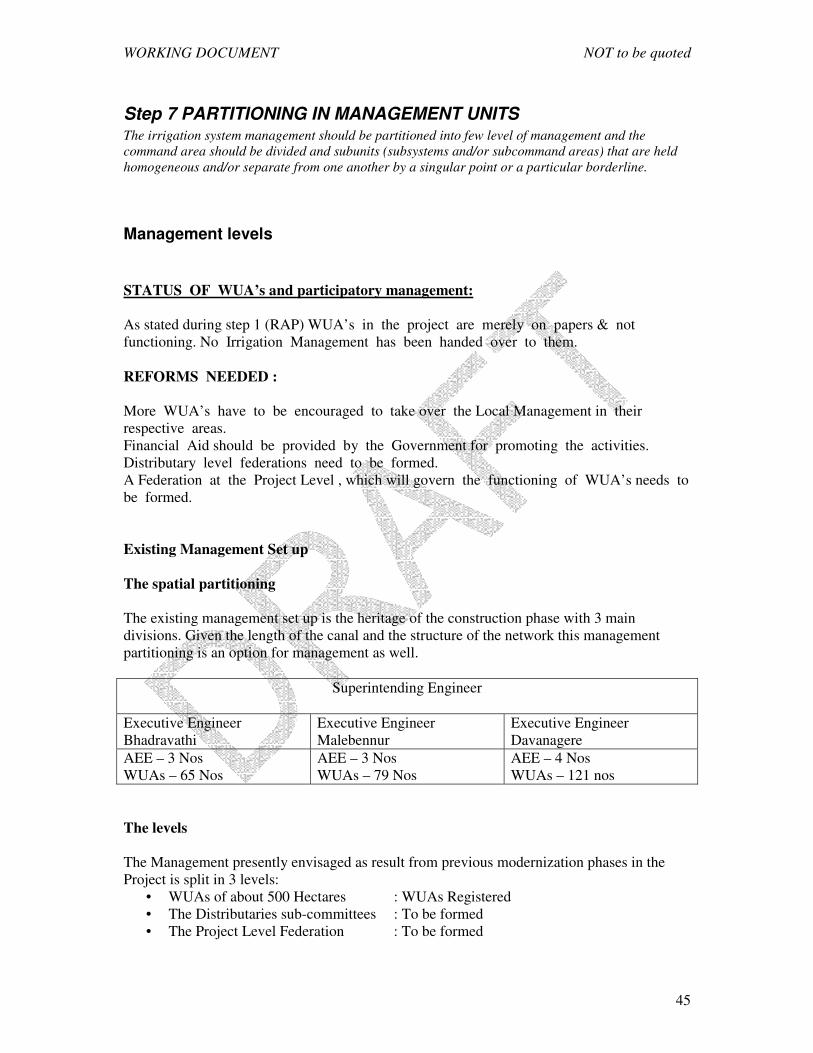
Management levels STATUS OF WUA’s and participatory management: As stated during step 1 (RAP) WUA’s in the project are merely on papers & not functioning. No Irrigation Management has been handed over to them. REFORMS NEEDED : More WUA’s have to be encouraged to take over the Local Management in their respective areas. Financial Aid should be provided by the Government for promoting the activities. Distributary level federations need to be formed. A Federation at the Project Level , which will govern the functioning of WUA’s needs to be formed. Existing Management Set up The spatial partitioning The existing management set up is the heritage of the construction phase with 3 main divisions. Given the length of the canal and the structure of the network this management partitioning is an option for management as well.
Superintending Engineer
Executive Engineer Bhadravathi
Executive Engineer Malebennur
Executive Engineer Davanagere
AEE – 3 Nos WUAs – 65 Nos
AEE – 3 Nos WUAs – 79 Nos
AEE – 4 Nos WUAs – 121 nos
The levels The Management presently envisaged as result from previous modernization phases in the Project is split in 3 levels:
• WUAs of about 500 Hectares : WUAs Registered • The Distributaries sub-committees : To be formed • The Project Level Federation : To be formed

WORKING DOCUMENT NOT to be quoted
46
The Proposed Levels of Management emanating from MASSCOTE is as follows: • WUA • Local Management Agency LMA for local MOM . • WRD for MOM of the main system level and a Federation for the governance of the Project A LMA is a group of WUAs (6 to 20 Nos.) responsible for distribution of water to the WUAs with in it. Various proposals for partitioning were considered during the workshop from 12 to 16 LMAs. Where ever feasible, it is suggested to regroup the WUAs. The range of area of LMA is 3000 ha-10500. Average area of LMA is 7000 hectares. No firm conclusions should be drawn at this preliminary stage, further in depth discussion with users should be carried out to craft an agreement with them on How about to go for partitioning.
Plate 31. An example of possible partitioning of the CA into 15 LMAs.

WORKING DOCUMENT NOT to be quoted
47
Step 8 MAPPING THE DEMAND FOR CANAL OPERATION Objective: Assessing Means, opportunity & demand for Canal Operation A spatial analysis of the entire command areas, with preliminary identification of Sub-Command Areas (Management, service,..) The mapping of the demand for operation is based on 3 main criteria: service, perturbations and sensitivity. Conceptually the demand can be seized through the following formula:
DEMAND for Operation = SERVICE x PERURBATIONS x SENSITIVITY The higher the service the higher the demand; the greater the perturbations, the higher the demand; the higher the structures sensitivity the higher the demand for operation. The demand expresses the requirements to achieve a given targets with due consideration on the constraints it also reflects the efforts needed to operate the system to perform as targeted. In some areas little efforts are sufficient whereas in other more efforts are needed to achieve the same objective.
Main criteria for partitioning the CA for canal operation demand The level of service The demand for operation will depend on the definition of service agreed upon at main system level as well as at LMA levels. The perturbations The main perturbation along the main canal is related to the runoff during Kharif, as this affects the entire system with a quite similar intensity, a priori there is no differentiation of the demand with respect to this criteria. Along the secondary system the intensity of perturbation is related to the number of upstream nodes (partition of flows) given the lack of control which characterizes the secondary network. This is why the length of the secondary networks should be taken as criteria of differentiation of the demand for operation. Length of secondary canals As seen in the initials steps (RAP) problem of distribution are plaguing the secondary system and below. Therefore the longer the secondary canal is the more effort is required to properly manage the water flows and ensure in particular that the tail–enders are receiving a fair share. Recycling Recycling is important in some sub command areas, whereas inexistent elsewhere. This criteria is therefore a critical one in allocating efforts for operating the secondary system. Wherever drainage is recycled, fewer efforts are needed for operation and where there are no recycling facilities high efforts to control water deliveries on the upstream side.

WORKING DOCUMENT NOT to be quoted
48
Step 9 CANAL OPERATION IMPROVEMENTS Objective: Identifying improvement options (service and economic feasibility) for each management unit for (i) water management, (ii) water control, and (iii) canal operation) The logical conclusions of previous steps are that the main thrust of improvements should be based on:
• water management through a more integrated management of reservoir/canal • water distribution improvement along the secondary systems.
1. Integrated management of reservoir & canal system Expectations: reach 200 % irrigation intensity with few exceptions during successive drought years. Current practice: Main canal issues are maintained high even with significant rainfall in the CA. Escapes are evacuating the surplus to the river system and spills at dam occur during Kharif almost every two years. Average water balance at dam level from 1972 till 2006 [33 years] is as follows:
• Annual issues = 1870 MCM Kharif = Rabi = 935 MCM • Inflow to the reservoir 2526 MCM • Miscellaneous uses (domestic, river, evaporation) = 412 MCM • Spill from the dam = 244 MCM
Average Annual Water Balance at BHADRA DAM (MCM)
Rabi 37%
Kharif37%
Spill10%
Others (Domestic -river-Evap)
16%
Plate 32 Water releases from the reservoir.
Main statements:

WORKING DOCUMENT NOT to be quoted
49
Too much water is issued during Kharif (same as in Rabi 935 MCM while runoff and rainfall account for an additional volume estimated at 1300 MCM). Surplus (runoff and rainfall) during Kharif goes directly to the river system instead of being stored in the reservoir.
Too much spill from the Bhadra reservoir (14 out 33 years) which could have been partially prevented by using more water during previous RABI.
More efficient management of the issues from the Dam and of the rainfall within the command area is possible yet with a good service to users!
Decrease issues Kharif and increase them in Rabi should be one of the management objectives.
Main points to be considered:
1. Both Rainfall (CA) and Runoff (Canal) must have real time assessment. 2. Inflow to be anticipated from rainfall in the catchment. 3. The shortest time lag between events and reaction. Managers should obviously rely on
users’ demand to react when additional flow (rain or runoff) is made available, BUT they should also anticipate the user channel by taking real time decision from an automatic SCADA system and thus be more efficient in water savings.
4. Check the capacity of using the maximum potential storage of water at end of Kharif 5. Check the capacity of increasing Rabi deliveries through increased peak discharge,
longer season, or intermediate storage. Suggestions
• Digitize daily data records at Dam + rainfall in CA • Build a model of reservoir management • Test various scenarios of management and suggest some efficient/robust optimal
strategy Objectives:
1. The Main objective is to reduce Kharif deliveries and augment them in Rabi (for instance 700 MCM in Kharif and 1370 in Rabi) while maintaining the annual issues at the same level. 2. A second objective might be to reduce the average spill and gain some additional allocation.
2. Staggered cropping calendar to reduce Rabi peak Due to physical limitation of the canal conveyance capacity, it is not possible to increase the discharge in Rabi to cover the needs of 100 % the area at the peak’s demand (march-may) which is about 30 % higher than average. This can only be achieved by staggering the cropping calendar to avoid 100% cultivation in late March, April and May. It is therefore proposed to stagger the crop calendar: rice cultivation seasons in the downstream parts (Davangere, Malebennur) is advanced therefore rice will be at ripping stages and harvest when Rabi peak starts mid-March. This option is a companion measure to previous improvement in reservoir management.
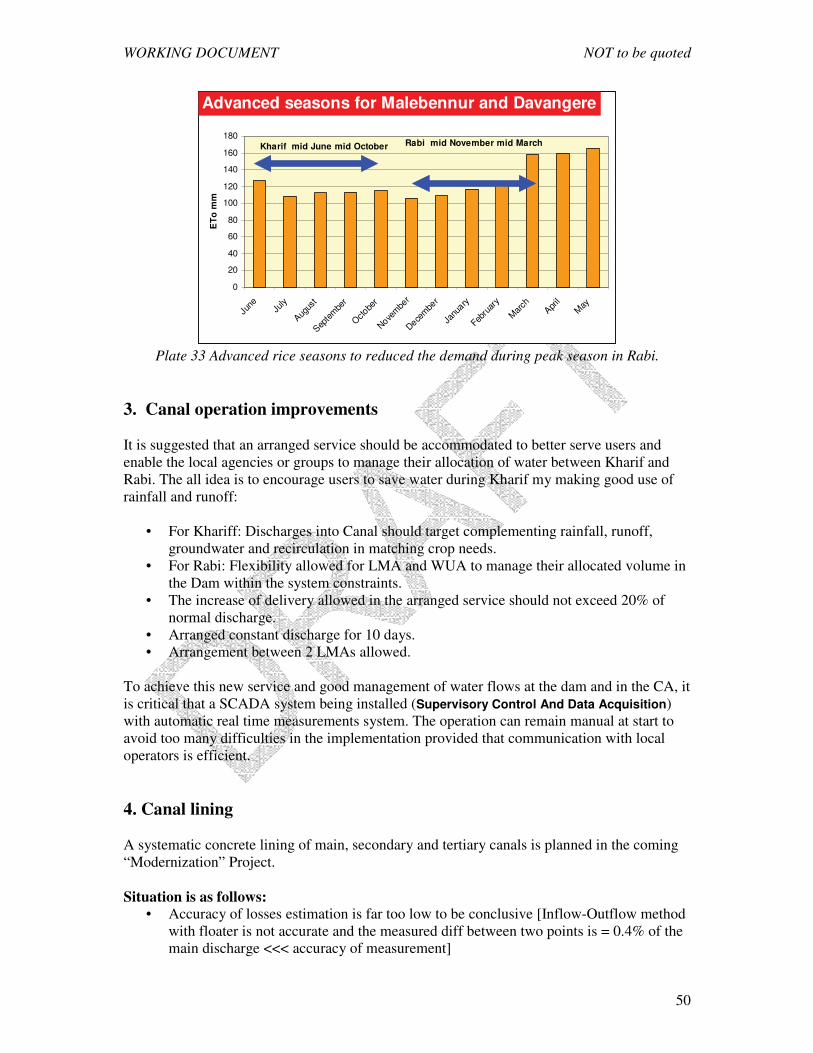
WORKING DOCUMENT NOT to be quoted
50
Plate 33 Advanced rice seasons to reduced the demand during peak season in Rabi.
3. Canal operation improvements It is suggested that an arranged service should be accommodated to better serve users and enable the local agencies or groups to manage their allocation of water between Kharif and Rabi. The all idea is to encourage users to save water during Kharif my making good use of rainfall and runoff:
• For Khariff: Discharges into Canal should target complementing rainfall, runoff, groundwater and recirculation in matching crop needs.
• For Rabi: Flexibility allowed for LMA and WUA to manage their allocated volume in the Dam within the system constraints.
• The increase of delivery allowed in the arranged service should not exceed 20% of normal discharge.
• Arranged constant discharge for 10 days. • Arrangement between 2 LMAs allowed.
To achieve this new service and good management of water flows at the dam and in the CA, it is critical that a SCADA system being installed (Supervisory Control And Data Acquisition) with automatic real time measurements system. The operation can remain manual at start to avoid too many difficulties in the implementation provided that communication with local operators is efficient. 4. Canal lining A systematic concrete lining of main, secondary and tertiary canals is planned in the coming “Modernization” Project. Situation is as follows:
• Accuracy of losses estimation is far too low to be conclusive [Inflow-Outflow method with floater is not accurate and the measured diff between two points is = 0.4% of the main discharge <<< accuracy of measurement]
Potentiel Evapotranspiration
0
20
40
60
80
100
120
140
160
180
June Ju
ly
Augus
t
Septe
mbe
r
Octobe
r
Novem
ber
Decem
ber
Janu
ary
Febru
ary
Mar
chApr
ilM
ay
ET
o m
m
Kharif mid June mid October Rabi mid November mid March
Advanced seasons for Malebennur and Davangere
WORKING DOCUMENT NOT to be quoted
51
• Improved cc lining to prevent cracking of banks under on and off operation [important for secondary canals].
• Introducing plastic + concrete lining (as recommended by the expert panel report) • Better to be selective with a high quality/high cost rather than systematic at lower cost • Proper maintenance of canal lining must be is anticipated to ensure a long lasting
benefits • Management: Avoid too rapid drawdown of the water in the canal under rotation to
prevent cracks from back-pressure. The following is recommended:
• Secondary and tertiary canal lining postponed for the following reasons: – benefits insufficiently documented for the canal itself – reduction of water losses might be at the expenses of recycled water (drainage) – risk of seeing ON-OFF practice ruining rapidly the benefits – uncertainty on the capacity of maintenance – options for rehabilitation & modernization should be discussed with local user
bodies and meet their requirements [probably less canal lining and more on control structures and measurements]
• Main canal lining could be carried out on the basis that :
– it is likely to help conveying water to tail end. – proper maintenance and management is warranted – it is incorporated into a real modernization plan of the main canal management. – High quality cc lining (with membrane) – not systematic but at selected stretches.
5. Repairs of main canal structures
Main canal repairs should be performed as planned in the Modernization project. Benefits from this intervention are clear and measured with precision): 2.8 m3/s.
6. Issues of cropping pattern As elsewhere there are the official cropping pattern and the actual one which by far does not match. It is simply proposed to abandon the concept of official cropping pattern. 7. Issues of illegal/unauthorized withdrawals.
The issue of illegal withdrawals is critical in the project, estimation that some 25 % of the net CA is irrigated without permission. Most of these illegal irrigation are concerning cash crops, therefore remuneration of the facto service should be no problem. 2 options are unrealistic: i) shed blind eyes on this and ignore the problem, ii) remove all unauthorized irrigation The only realistic option is to legalize what is existing and come up with an agreement with users on what service and what tariff and fees they should pay.

WORKING DOCUMENT NOT to be quoted
52
The critical issue of canal lining As part of the current modernization project a systematic approach of canal lining is undertaken with the goal of minimizing seepages losses from canal and.... Large sections of recently lined canals at secondary levels are already showing sign of degradation due to too rapid drawdown of the water when they are put under rotation. A study made by the World Bank shows that even if the cracked area represents 1% of the total area then the seepage losses will be about 70 % of what will experience an unlined canal. The issues related to cc lining are as follows:
• check whether benefits for water savings have been accurately estimated • quality of cc lining should be improved to prevent cracking of banks under on and off
operation this is all important for secondary canals. • quality of cc lining should consider introducing plastic concrete lining which
according to many offers the more reliable and lasting technique. • with a probable increasing of unit cost per ml due to improved quality mentioned
above, the project should seek to treat the most critical stretches and not pursue a systematic approach.
• Proper maintenance of canal lining is critical to ensure a long lasting benefits and should be fully considered in the project before deciding which type of canals should be lined (in particular the secondary and tertiary canals).
• Rotation at secondary level is likely to create rapid drawdown of the water in the canal which will results in cracks due to hydrostatic pressure of soil in the banks.
Plate 34. Example of deterioration of canal lining (NWMP 1994) probably due to rapid
drawdown (Malebennur secondary canal SC 6)

WORKING DOCUMENT NOT to be quoted
53
Step 10 AGGREGATING AND CONSOLIDATING MANAGEMENT Integration of the preferred options at the system level, and functional cohesiveness check. Consolidation and design of an overall information management system for supporting operation This step cannot be addressed at this stage when the previous one and particularly on partitioning have not been sufficiently investigated and agreed upon.
Step 11 PLAN FOR MODERNIZATION Finalizing a modernization strategy and progressive capacity development Select/choose/decide/phasing the options for improvements Plan for M&E of the project inputs and outcomes. This step also needs previous ones to be completed. However some critical and immediate actions should be considered to prepare the plan. Interventions: 1. High level consultancy works to be commissioned for investigating Dam management and the requirements for physical interventions on the main canal structures in view of implementing a SCADA system. The reason for this quick interventions is to take advantage of the canal closure coming Kharif to do whatever will appear to be needed together with the canal lining works (measurements flumes, telemetry, etc..). BEFORE JUNE 2007 2. RS Survey of irrigation in and nearby the CA: mapping of irrigated areas made by remote sensing imagery during Rabi season. Years of interest could be Rabi 2004 [very dry year with low issue from the dam] and Rabi 2006 [Wet year]. Another wet year (10 years back or so) could also bring insight on the recent expansion of irrigated areas. 3. Modernization plans: FAO advise on the propositions from the consultant firm: September 2007.
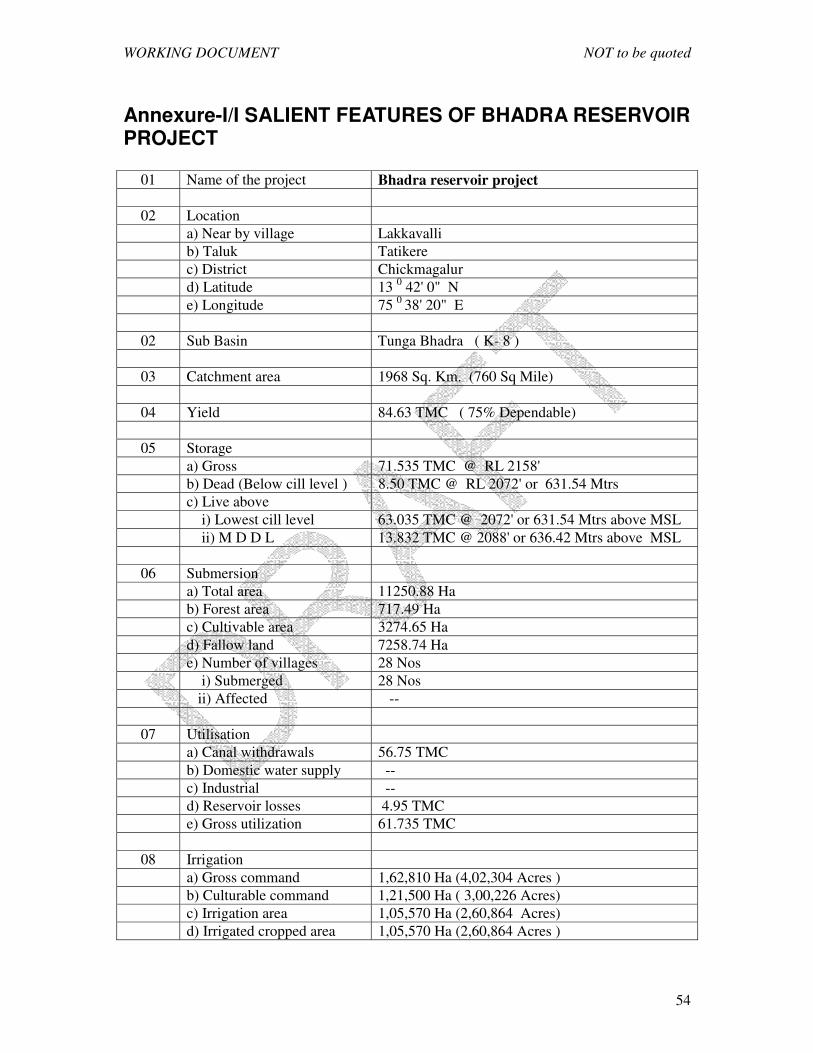
WORKING DOCUMENT NOT to be quoted
54
Annexure-I/I SALIENT FEATURES OF BHADRA RESERVOIR PROJECT
01 Name of the project Bhadra reservoir project
02 Location a) Near by village Lakkavalli b) Taluk Tatikere c) District Chickmagalur d) Latitude 13 0 42' 0" N e) Longitude 75 0 38' 20" E
02 Sub Basin Tunga Bhadra ( K- 8 )
03 Catchment area 1968 Sq. Km. (760 Sq Mile)
04 Yield 84.63 TMC ( 75% Dependable)
05 Storage a) Gross 71.535 TMC @ RL 2158' b) Dead (Below cill level ) 8.50 TMC @ RL 2072' or 631.54 Mtrs c) Live above i) Lowest cill level 63.035 TMC @ 2072' or 631.54 Mtrs above MSL ii) M D D L 13.832 TMC @ 2088' or 636.42 Mtrs above MSL
06 Submersion a) Total area 11250.88 Ha b) Forest area 717.49 Ha c) Cultivable area 3274.65 Ha d) Fallow land 7258.74 Ha e) Number of villages 28 Nos i) Submerged 28 Nos ii) Affected --
07 Utilisation a) Canal withdrawals 56.75 TMC b) Domestic water supply -- c) Industrial -- d) Reservoir losses 4.95 TMC e) Gross utilization 61.735 TMC
08 Irrigation a) Gross command 1,62,810 Ha (4,02,304 Acres ) b) Culturable command 1,21,500 Ha ( 3,00,226 Acres) c) Irrigation area 1,05,570 Ha (2,60,864 Acres) d) Irrigated cropped area 1,05,570 Ha (2,60,864 Acres )

WORKING DOCUMENT NOT to be quoted
55
09 General characteristics of soil in the command:
1) Right Bank Canal Black soil (8.5 %) & Red soil (91.5 %) i) Anvery Branch Canal Black soil (15.3%)& Red soil (84.7 %) ii) Malebennur branch Canal Black soil (30.4 %) & Red soil (69.6 %) iii) Davangere branch Canal Black soil (30.2%) & Red soil (69.8 %) 2) Left Bank Canal Black soil (7.0 %) & Red soil (93.0 %)
10 Dam and appurtenant works: 1)Type of Dam Composite 2)Length 1708 Mtrs 3) Ht. above avg. river bed level 194 Ft or 59.13 Mtrs 4)Maximum water level 186 Ft or 657.75 Mtrs above MSL. 5)Full Reservoir level 186 Ft or 657.75 Mtrs above MSL 6)Minimum Draw Down Level 116 Ft or 636.42 Mtrs above MSL 7)Dead Storage Level 100 Ft or 631.54 Mtrs above MSL 8)Cill levels of Sluices i) Left Bank Canal 36 Ft or 612.03 Mtrs above MSL ii)Right Bank Level 100 Ft or 631.54 Mtrs above MSL
11 Spillway: i) Type Ogee ii) Location Middle iii) Length 82.30 Mtrs iv) Co-efficient of discharge 3.98 v) Discharging Capacity 1,06,700 Cusecs or 3021.38 M.Cumecs.
12 Crest Gates: a) Type Vertical b) Numbers 4 Nos. c) Size (60Ft x 25 Ft) 18.28 Mtrs x 7.62 Mtrs
13 River Sluices: a) Numbers 2 Nos. b) Size (6 Ft x 15 Ft) 1.82 Mtrs x 4.57 Mtrs c) Discharging Capacity 13,300 Cusecs or 376.31 Cumecs
14 Canal Outlets: LBC RBC a) Numbers 1 2 b) Size 1.82 x 3.65 Mtrs 2.43 x 4.57 Mtrs c) Capacity 150 Cumecs (Max) 378 Cumecs (Max)
15 Annual silt charge: i) Designed 10.78 Mcft./Sq Km of Catchment area Per Year ii) Actual 0.0437 % per year (As per investigations vide
KERS Ltr No701-11 Dated 30.4.99
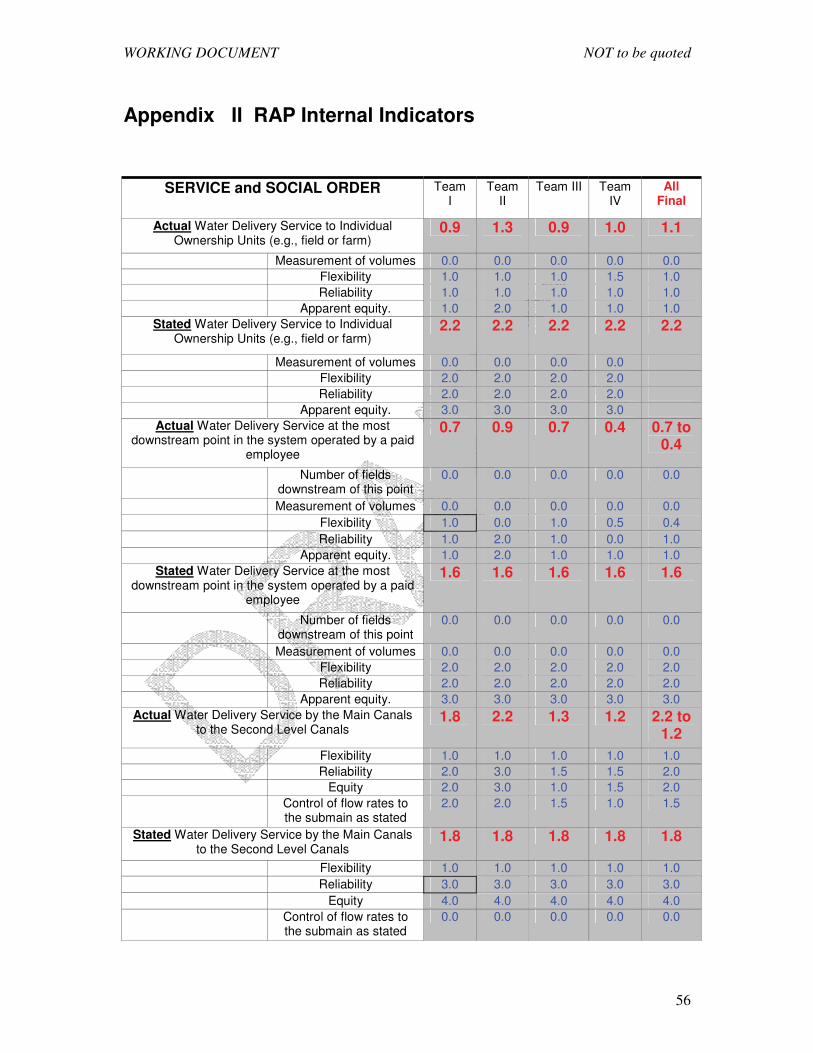
WORKING DOCUMENT NOT to be quoted
56
Appendix II RAP Internal Indicators
SERVICE and SOCIAL ORDER Team I
Team II
Team III Team IV
All Final
Actual Water Delivery Service to Individual Ownership Units (e.g., field or farm)
0.9 1.3 0.9 1.0 1.1
Measurement of volumes 0.0 0.0 0.0 0.0 0.0 Flexibility 1.0 1.0 1.0 1.5 1.0 Reliability 1.0 1.0 1.0 1.0 1.0 Apparent equity. 1.0 2.0 1.0 1.0 1.0
Stated Water Delivery Service to Individual Ownership Units (e.g., field or farm)
2.2 2.2 2.2 2.2 2.2
Measurement of volumes 0.0 0.0 0.0 0.0 Flexibility 2.0 2.0 2.0 2.0 Reliability 2.0 2.0 2.0 2.0 Apparent equity. 3.0 3.0 3.0 3.0
Actual Water Delivery Service at the most downstream point in the system operated by a paid
employee
0.7 0.9 0.7 0.4 0.7 to 0.4
Number of fields downstream of this point
0.0 0.0 0.0 0.0 0.0
Measurement of volumes 0.0 0.0 0.0 0.0 0.0 Flexibility 1.0 0.0 1.0 0.5 0.4 Reliability 1.0 2.0 1.0 0.0 1.0 Apparent equity. 1.0 2.0 1.0 1.0 1.0
Stated Water Delivery Service at the most downstream point in the system operated by a paid
employee
1.6 1.6 1.6 1.6 1.6
Number of fields downstream of this point
0.0 0.0 0.0 0.0 0.0
Measurement of volumes 0.0 0.0 0.0 0.0 0.0 Flexibility 2.0 2.0 2.0 2.0 2.0 Reliability 2.0 2.0 2.0 2.0 2.0 Apparent equity. 3.0 3.0 3.0 3.0 3.0
Actual Water Delivery Service by the Main Canals to the Second Level Canals
1.8 2.2 1.3 1.2 2.2 to 1.2
Flexibility 1.0 1.0 1.0 1.0 1.0 Reliability 2.0 3.0 1.5 1.5 2.0 Equity 2.0 3.0 1.0 1.5 2.0 Control of flow rates to
the submain as stated 2.0 2.0 1.5 1.0 1.5
Stated Water Delivery Service by the Main Canals to the Second Level Canals
1.8 1.8 1.8 1.8 1.8
Flexibility 1.0 1.0 1.0 1.0 1.0 Reliability 3.0 3.0 3.0 3.0 3.0 Equity 4.0 4.0 4.0 4.0 4.0 Control of flow rates to
the submain as stated 0.0 0.0 0.0 0.0 0.0
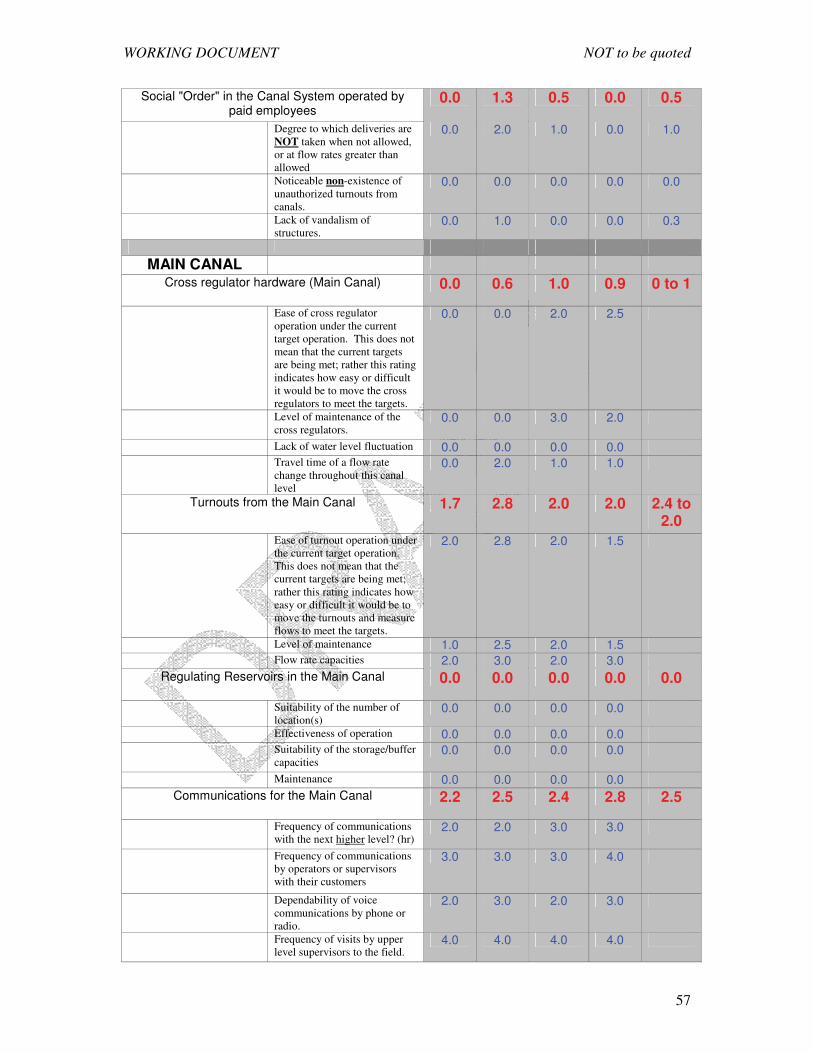
WORKING DOCUMENT NOT to be quoted
57
Social "Order" in the Canal System operated by paid employees
0.0 1.3 0.5 0.0 0.5
Degree to which deliveries are NOT taken when not allowed, or at flow rates greater than allowed
0.0 2.0 1.0 0.0 1.0
Noticeable non-existence of unauthorized turnouts from canals.
0.0 0.0 0.0 0.0 0.0
Lack of vandalism of structures.
0.0 1.0 0.0 0.0 0.3
MAIN CANAL
Cross regulator hardware (Main Canal) 0.0 0.6 1.0 0.9 0 to 1
Ease of cross regulator operation under the current target operation. This does not mean that the current targets are being met; rather this rating indicates how easy or difficult it would be to move the cross regulators to meet the targets.
0.0 0.0 2.0 2.5
Level of maintenance of the cross regulators.
0.0 0.0 3.0 2.0
Lack of water level fluctuation 0.0 0.0 0.0 0.0 Travel time of a flow rate
change throughout this canal level
0.0 2.0 1.0 1.0
Turnouts from the Main Canal 1.7 2.8 2.0 2.0 2.4 to 2.0
Ease of turnout operation under the current target operation. This does not mean that the current targets are being met; rather this rating indicates how easy or difficult it would be to move the turnouts and measure flows to meet the targets.
2.0 2.8 2.0 1.5
Level of maintenance 1.0 2.5 2.0 1.5 Flow rate capacities 2.0 3.0 2.0 3.0
Regulating Reservoirs in the Main Canal 0.0 0.0 0.0 0.0 0.0
Suitability of the number of location(s)
0.0 0.0 0.0 0.0
Effectiveness of operation 0.0 0.0 0.0 0.0 Suitability of the storage/buffer
capacities 0.0 0.0 0.0 0.0
Maintenance 0.0 0.0 0.0 0.0 Communications for the Main Canal 2.2 2.5 2.4 2.8 2.5
Frequency of communications with the next higher level? (hr)
2.0 2.0 3.0 3.0
Frequency of communications by operators or supervisors with their customers
3.0 3.0 3.0 4.0
Dependability of voice communications by phone or radio.
2.0 3.0 2.0 3.0
Frequency of visits by upper level supervisors to the field.
4.0 4.0 4.0 4.0

WORKING DOCUMENT NOT to be quoted
58
Existence and frequency of remote monitoring (either automatic or manual) at key spill points, including the end of the canal
0.0 1.0 0.0 0.0
Availability of roads along the canal
2.0 2.0 2.0 2.0
General Conditions for the Main Canal 1.4 1.5 1.6 1.9 1.5 to 1.9
General level of maintenance of the canal floor and canal banks
0.0 1.0 0.0 1.5
General lack of undesired seepage (note: if deliberate conjunctive use is practiced, some seepage may be desired).
2.0 2.5 4.0 3.0
Availability of proper equipment and staff to adequately maintain this canal
1.0 1.0 1.0 1.0
Travel time from the maintenance yard to the most distant point along this canal (for crews and maintenance equipment)
3.0 2.0 2.0 3.0
Operation of the Main Canal 1.6 1.9 1.6 0.6 1.8 to 0.6
How frequently does the headworks respond to realistic real time feedback from the operators/observers of this canal level? This question deals with a mismatch of orders, and problems associated with wedge storage variations and wave travel times.
1.3 1.3 1.3 0.0
Existence and effectiveness of water ordering/delivery procedures to match actual demands. This is different than the previous question, because the previous question dealt with problems that occur AFTER a change has been made.
1.3 1.3 1.3 0.0
Clarity and correctness of instructions to operators.
2.7 2.7 2.7 2.0
How frequently is the whole length of this canal checked for problems and reported to the office? This means one or more persons physically drive all the sections of the canal.
1.3 2.7 1.3 1.0
Second Level Canals
Cross regulator hardware (Second Level Canals) 1.3 2.0 1.9 0.9 2.0 to 1.0

WORKING DOCUMENT NOT to be quoted
59
Ease of cross regulator operation under the current target operation. This does not mean that the current targets are being met; rather this rating indicates how easy or difficult it would be to move the cross regulators to meet the targets.
0.0 3.0 2.5 0.0
Level of maintenance of the cross regulators.
0.0 3.0 2.0 0.0
Lack of water level fluctuation 1.0 0.0 1.0 0.0 Travel time of a flow rate
change throughout this canal level
3.0 4.0 3.0 3.0
Turnouts from the Second Level Canals 2.0 2.3 1.3 1.0 2.2 to 1.0
Ease of turnout operation under the current target operation. This does not mean that the current targets are being met; rather this rating indicates how easy or difficult it would be to move the turnouts and measure flows to meet the targets.
2.0 3.0 1.0 1.0
Level of maintenance 2.0 2.0 1.0 0.0 Flow rate capacities 2.0 2.0 2.0 2.0
Regulating Reservoirs in the Second Level Canals 0.0 2.3 2.7 0.0 2.5 to 0.0
Suitability of the number of location(s)
0.0 3.0 4.0 0.0
Effectiveness of operation 0.0 2.0 2.0 0.0 Suitability of the storage/buffer
capacities 0.0 2.0 2.0 0.0
Maintenance 0.0 2.0 2.0 0.0 Communications for the Second Level Canals 1.8 1.7 2.1 1.8 1.9
Frequency of communications with the next higher level? (hr)
2.0 1.0 2.0 1.0
Frequency of communications by operators or supervisors with their customers
3.0 1.0 4.0 2.0
Dependability of voice communications by phone or radio.
1.0 2.5 2.0 2.0
Frequency of visits by upper level supervisors to the field.
3.0 3.0 3.0 4.0
Existence and frequency of remote monitoring (either automatic or manual) at key spill points, including the end of the canal
0.0 0.0 0.0 0.0
Availability of roads along the canal
2.0 2.0 1.0 2.0
General Conditions for the Second Level Canals 1.3 1.8 1.4 1.5 1.8 to 1.4
General level of maintenance of the canal floor and canal banks
0.0 2.0 2.0 1.5

WORKING DOCUMENT NOT to be quoted
60
General lack of undesired seepage (note: if deliberate conjunctive use is practiced, some seepage may be desired).
1.5 3.0 4.0 2.0
Availability of proper equipment and staff to adequately maintain this canal
1.0 1.0 0.0 1.0
Travel time from the maintenance yard to the most distant point along this canal (for crews and maintenance equipment)
3.0 2.0 1.0 2.0
Operation of the Second Level Canals 1.9 2.6 2.4 1.7 2.6 to 1.7
How frequently does the headworks respond to realistic real time feedback from the operators/observers of this canal level? This question deals with a mismatch of orders, and problems associated with wedge storage variations and wave travel times.
1.3 2.7 2.7 2.0
Existence and effectiveness of water ordering/delivery procedures to match actual demands. This is different than the previous question, because the previous question dealt with problems that occur AFTER a change has been made.
1.3 2.0 2.7 1.0
Clarity and correctness of instructions to operators.
2.7 2.7 2.7 2.0
How frequently is the whole length of this canal checked for problems and reported to the office? This means one or more persons physically drive all the sections of the canal.
2.7 2.7 1.3 1.3
Third Level Canals
Cross regulator hardware (Third Level Canals) 0.3 1.1 1.1 1.1 0.3 to 1.1
Ease of cross regulator operation under the current target operation. This does not mean that the current targets are being met; rather this rating indicates how easy or difficult it would be to move the cross regulators to meet the targets.
0.0 0.0 0.0 0.0
Level of maintenance of the cross regulators.
0.0 0.0 0.0 0.0
Lack of water level fluctuation 0.0 0.0 0.0 0.0 Travel time of a flow rate
change throughout this canal level
1.0 4.0 4.0 4.0

WORKING DOCUMENT NOT to be quoted
61
Turnouts from the Third Level Canals 1.3 1.3 1.3 0.8 1.3 to 0.8
Ease of turnout operation under the current target operation. This does not mean that the current targets are being met; rather this rating indicates how easy or difficult it would be to move the turnouts and measure flows to meet the targets.
0.0 1.0 1.0 0.5
Level of maintenance 0.0 1.0 1.0 0.0 Flow rate capacities 4.0 2.0 2.0 2.0
Regulating Reservoirs in the Third Level Canals 0.0 0.0 0.0 0.0 0.0
Suitability of the number of location(s)
0.0 0.0 0.0 0.0
Effectiveness of operation 0.0 0.0 0.0 0.0 Suitability of the storage/buffer
capacities 0.0 0.0 0.0 0.0
Maintenance 0.0 0.0 0.0 0.0 Communications for the Third Level Canals 1.6 1.5 1.9 1.6 1.6 to
1.9 Frequency of communications
with the next higher level? (hr) 2.0 1.0 2.0 1.0
Frequency of communications by operators or supervisors with their customers
3.0 2.0 4.0 2.0
Dependability of voice communications by phone or radio.
0.0 2.0 2.0 2.0
Frequency of visits by upper level supervisors to the field.
4.0 3.0 3.0 4.0
Existence and frequency of remote monitoring (either automatic or manual) at key spill points, including the end of the canal
0.0 0.0 0.0 0.0
Availability of roads along the canal
2.0 1.0 0.0 1.0
General Conditions for the Third Level Canals 1.0 1.0 1.8 1.3 1.0 to 1.6
General level of maintenance of the canal floor and canal banks
1.0 0.0 1.0 0.5
General lack of undesired seepage (note: if deliberate conjunctive use is practiced, some seepage may be desired).
2.0 2.0 4.0 2.0
Availability of proper equipment and staff to adequately maintain this canal
0.0 1.0 1.0 1.0
Travel time from the maintenance yard to the most distant point along this canal (for crews and maintenance equipment)
2.0 1.0 2.0 2.0
Operation of the Third Level Canals 0.8 1.9 2.4 1.7 1.0 to 2.4
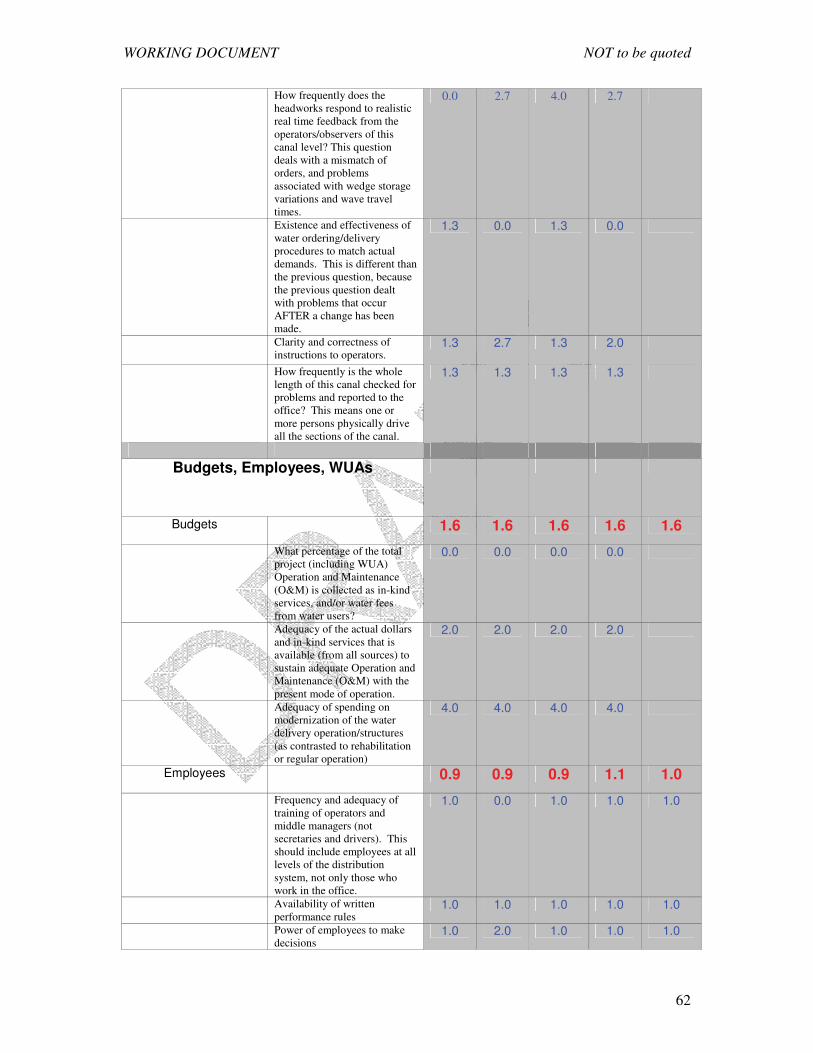
WORKING DOCUMENT NOT to be quoted
62
How frequently does the headworks respond to realistic real time feedback from the operators/observers of this canal level? This question deals with a mismatch of orders, and problems associated with wedge storage variations and wave travel times.
0.0 2.7 4.0 2.7
Existence and effectiveness of water ordering/delivery procedures to match actual demands. This is different than the previous question, because the previous question dealt with problems that occur AFTER a change has been made.
1.3 0.0 1.3 0.0
Clarity and correctness of instructions to operators.
1.3 2.7 1.3 2.0
How frequently is the whole length of this canal checked for problems and reported to the office? This means one or more persons physically drive all the sections of the canal.
1.3 1.3 1.3 1.3
Budgets, Employees, WUAs
Budgets 1.6 1.6 1.6 1.6 1.6
What percentage of the total project (including WUA) Operation and Maintenance (O&M) is collected as in-kind services, and/or water fees from water users?
0.0 0.0 0.0 0.0
Adequacy of the actual dollars and in-kind services that is available (from all sources) to sustain adequate Operation and Maintenance (O&M) with the present mode of operation.
2.0 2.0 2.0 2.0
Adequacy of spending on modernization of the water delivery operation/structures (as contrasted to rehabilitation or regular operation)
4.0 4.0 4.0 4.0
Employees 0.9 0.9 0.9 1.1 1.0
Frequency and adequacy of training of operators and middle managers (not secretaries and drivers). This should include employees at all levels of the distribution system, not only those who work in the office.
1.0 0.0 1.0 1.0 1.0
Availability of written performance rules
1.0 1.0 1.0 1.0 1.0
Power of employees to make decisions
1.0 2.0 1.0 1.0 1.0

WORKING DOCUMENT NOT to be quoted
63
Ability of the project to dismiss employees with cause.
2.0 1.0 2.0 2.0 2.0
Rewards for ememplary service
0.0 1.0 0.0 0.0 0.0
Relative salary of an operator compared to a day laborer
0.0 0.0 0.0 1.0 0.0
Water User Associations
0.5 0.2 0.0 0.5 0.0
Percentage of all project users who have a functional, formal unit that participates in water distribution
0.0 0.0 0.0 0.0 0.0
Actual ability of the strong Water User Associations to influence real-time water deliveries to the WUA.
0.0 0.0 0.0 0.0 0.0
Ability of the WUA to rely on effective outside help for enforcement of its rules
1.0 0.0 0.0 1.0 1.0
Legal basis for the WUAs 2.0 1.0 0.0 2.0 1.0 Financial strength of WUAS 0.0 0.0 0.0 0.0 0.0
Mobility and Size of Operations Staff
Operation staff mobility and efficiency, based on the ratio of operating staff to the number of turnouts.
0.0 0.0 0.0 0.0 0.0
Computers for billing and record
management
The extent to which computers are used for billing and record management
0.0 0.0 0.0 0.0 0.0
Computers for canal control
The extent to which computers (either central or on-site) are used for canal control
0.0 0.0 0.0 0.0 0.0

WORKING DOCUMENT NOT to be quoted
64
Appendix III Step 2 Capacity and Sensitivity Storage: 1.1. Storage at Main Dam • Dam storage capacity designed for 75% dependability. • Gross storage capacity of reservoir is 73 TMC.
Bhadra Reservoir RBC LBC
Season Actual Discharge in cusecs
No of
days
Quantum of water in TMC
Actual Discharge in cusecs
No of
days
Quantum of water in
TMC
Total quantum of water in TMC
Kharif 2650 270 61.82 380 270 8.86 70.68 • Total of 70.88 TMC (Including runoff and rain fall) is required to be fed to the canal for 270 days. • During rainy season surplus water may be utilized for canals • Hence the capacity of the reservoir is adequate 1.2. Storage at other dams. • Gondi anicut: storage sufficient • Dekere Pick up: storage to be increased by raising the spill level. 1.3. Buffer storages - • on initial reaches of main canal (BRRBC & BRLBC) are sufficient but needs improvements and regulating arrangements. For instance there are about 11 tanks attached to LBC which are could certainly be included as buffer storage system. • on DBC is insufficient presently, Harapanahalli, Margondanahalli, Kondajji along DBC needs restoration like desilting to increase storage capacity. • More nos. are required on MBC & DB kere pick up canal. Buffer storages at 3.2 Km of DB kere & 6 th Km of RBC of DB kere needs restoration & improvements for additional storage. Better use of existing facilities as buffer storage:
Possibility of using Shantisagar tank ( at Ch 4.600 km of Davanagere Branch canal) as a Buffer storage can be examined to overcome shortages in tail end command for second crop.
Increasing the capacity of existing tanks in command area like Kondajji tank (Harapanahalli Branch Canal), Hadadi tank (HBC) , Lokikere tank (7th zone of DBC), Bathikere to be used as a buffer storage.
Buffer storage tanks On the Distributory network of MBC. Water from Dy-6 of MBC is let out to the Koolambi tank and in turn serves the atchkat of about 900Acre.
Buffer storage tanks On the Distributory network of RBC.

WORKING DOCUMENT NOT to be quoted
65
Buffer Storage tank for DY-19 of RBC which gets supply from tail end of Dy-18 and out let -14 of D-19 . Which serves irrigation to the some atchkat of Dy-19.
There is a pick-up across Anvery branch Canal @ Ch 8.1km. This Canal proceed further from the pick-up.
Balancing Reservoirs on Harappanahalli Distributory :- 4 Nos. 1. Hiremegalakere @ 9th km of HPD. 2. Malagondanahalli tank on 9C ( third level canal) of HPD. 3. Kondajji tank @ tail end of 9C( third level canal) of HPD. 4. Harasapura pick-up on HPD. Developing new buffer storage:
Buffer storages along Anvery Branch canal, Malebennur Branch canal, Harapanahalli Branch Canal (like Kondajji tank) to be investigated. a) Conveyance: Carrying capacity of Main canals, secondary canals & other canals is sufficient but needs routine maintenance like desilting. Conveyance is affected due to: • encroachment of FB is observed all along the canal • Carrying capacity of some aqueducts in initial reaches are insufficient. • Syphons on DBC are insufficient • Leakages in aqueducts, siphons etc.. • Scouring of canal sides, siltation, vegetation growth • In Distributories & Minors, siltation and vegetation and damage of structures, temporary obstructions by farmers. b) Diversion: Capacity of diversion structures at main canal levels is sufficient but needs routine
maintenance. • The offtakes on Main canal are serving their purpose satisfactorily • Most of the Semi modular and gated structures on distributories and minors are damaged. • Gated outlets to be provided along distributories and minors. c) Distribution: • Main canal: No problem of distribution of water at this level. • Second level canal: Medium to serious problems of distribution of water at this level. • Third level canal: serious problems exist at this level. • Final deliveries: Problems exits at this level in proper water distributions. Probably the main reasons for the problems met at secondary level distribution and below are the absence or the weakness of WUA, an ineffective water level control and unauthorized offtakes.

WORKING DOCUMENT NOT to be quoted
66
d) Water level Control: • Main canal: One cross regulator at KM 80 of RBC but not in use probably due to stable flows (Steady flows). • Second level canal: No flow controlling devices are provided. • Third level canal: No flow control devices are provided. • Final deliveries: No flow control devices are provided. Exception to this There are no water level controlling devices along the distributories. Two Duckbell weirs are in the working conditions across DY-22 @ ch 1.6km and Ch 5.4km. More such Duckbill to be installed for water level control. Tail end of MBC & DB kere pick up canals needs adequate cross regulators. e) Measurements: • Main canal: Flow measuring devices provided at this level with very poor calibration. • Second level canal: No proper flow measuring devices are provided. • Third level canal: No flow measuring devices are provided. • Final deliveries: No flow measuring devices are provided. Main canal Measuring devices are present only at 1.200km, 26.700, 79.000km of RBC and at 2.400km of LBC, off takes of MBC & DBC.
There is a need for one more measuring device along LBC Calibration was done long back. All measuring devices are to be calibrated. At ch. 33.20 there is a flume to be made functional and used for measurement instead
of measuring the water level at road bridge. Distributories & Minors
Existing measuring devices are to repaired, calibrated and put to use. Sufficient no. of measuring devices at key points to be installed.
Depending on the management strategy that will be adopted for Bhadra a complete revision of the network of measuring devices will have to be carried out. Key points of the infrastructure, to be considered are spill points, change point of management, inlets to the canal, outlets from tanks, etc... f) Safety: Main canal
Adequate safety structures are there along the main canal. Few new Canal Escapes may be provided. There is encroachment of FB at some locations. Suitable preventive measures are to be
taken such as raising of banks, removal of silt Distributories • In some sections, water is flowing to the brim. • Turbulent flow is noticed immediately after some of the off-takes. Proper transitions to be provided so that flow is steady.

WORKING DOCUMENT NOT to be quoted
67
• Also, In HPD @9th Km, one relieving weir is provided which leads to hiremagalagere tank. • In 9thc of HPD a relieving weir is provided which leades to malagondahalli and kondajji tanks. g) Transmission and communication:
• Service Roads all along the canals needs improvements& routine maintenances. • Communication among operators, supervisors & maintenance staff is good. • Rainfall data acquisition and processing is required. • Communication at all levels is effective from one level to another.
Main canal
The discharge data to be centralized. Frequency of gauge reading to be increased i.e., from the present average 8 hourly
readings to 2 hourly readings along the main canal. Infrastructure facilities such as buildings for stay of gauge readers Manual SCADA to be introduced.
SENSITIVITY • Main canal: very low to low sensitive off-takes. • Second level canal: Medium sensitive off-takes. • Third level canal: High sensitive off-takes. Sensitivity of off-takes on main canal is generally very low (below 0.5). In case of Branch canals the Sensitivity is from low to medium. 1. At Ch. 32.900km of RBC S = 0.5/5.0 = 0.10 Very Low Sensitive 2. At Ch. 51.900km of ABC S = 0.5 / 0.45 = 1.10 Medium sensitive STEP 3 PERTURBATIONS : Causes
Rainfall. Unauthorized lifting (pumps), illegal withdrawals (pipes). Some indications point that
in U/S and D/S of RBC and LBC more than 1000 pumps are working illegally used for cultivation.
Runoff entering the main canal. Rotation system of distribution. Perturbations increase downwards along the main canal Discharge through relieving weirs
Magnitudes • Measurement of quantum of rain water entering the canal will help the management to take corrective measures to control perturbation.
WORKING DOCUMENT NOT to be quoted
68
Location • All along main canal, it increases downwards. Frequency
Major perturbations will be in second crop season due to illegal withdrawals. Options for Copping with
Buffer storage : excess flows can be stored in buffer storage tanks and can be utilized later.
Restriction of illegal withdrawals.

WO
RK
ING
DO
CU
ME
NT
NO
T to
be
quot
ed
69
Ap
pen
dix
IV
Issu
es f
rom
th
e m
ain
res
ervo
ir
0
200
400
600
800
1000
1200
1400 Kharif
72Rabi 7
3Kharif
73Rabi 7
4Kharif
74Rabi 7
5Kharif
75Rabi 7
6Kharif
76Rabi 7
7Kharif
77Rabi 7
8Kharif
78Rabi 7
9Kharif
79Rabi 8
0Kharif
80Rabi 8
1Kharif
81Rabi 8
2Kharif
82Rabi 8
3Kharif
83Rabi 8
4Kharif
84Rabi 8
5Kharif
85Rabi 8
6Kharif
86Rabi 8
7Kharif
87Rabi 8
8Kharif
88Rabi 8
9Kharif
89Rabi 9
0Kharif
90Rabi 9
1Kharif
91Rabi 9
2Kharif
92Rabi 9
3Kharif
93Rabi 9
4Kharif
94Rabi 9
5Kharif
95Rabi 9
6Kharif
96Rabi 9
7Kharif
97Rabi 9
8Kharif
98Rabi 9
9Kharif
99Rabi 0
0Kharif
00Rabi 0
1Kharif
01Rabi 0
2Kharif
02Rabi 0
3Kharif
03Rabi 0
4Kharif
04Rabi 0
5Kharif
05Rabi 0
6Kharif
06
Seasonal issuesMCM
020406080100
120
140
160
180
200
Water level end of the season
Spill
305
1420
12
8 MCM
1257