modernization of retail payment instruments
TRANSCRIPT
Instrumentos de Pagamento de Varejo: Cartões de Crédito – Questionário
Modernization of Retail Payment Modernization of Retail Payment InstrumentsInstruments
99thth Meeting Meeting –– WGPSWGPS –– LACLAC
Sydney - AU October 4th,2006
• Focus of the Banco Central do Brasil (BC)Promote economic efficiency in currency’s usage
• ObjectivesIncrease relative share of electronic instruments vis-à-vis paper-based instruments
Economic efficiency and a higher social welfare
Retail Payment InstrumentsRetail Payment Instruments
• US’ Payment System annual cost is
approximately 3% of GDP (Wells 1994)
• Electronic payments cost from one-third to one-
half as much as the substitute paper-based
alternative (cash and cheques) for 14 European
countries (Humphrey et al. 1996)
Potential Efficiency GainsPotential Efficiency Gains
• Indirect pricing of payment instruments, Bank-
Customer relationship priced simultaneously
with payment instruments (cross subsidies)
• Market failures in the supply side might impair
innovation and growth of electronic payments
Points that justify further analysesPoints that justify further analyses

• To indicate policies, directives and objectives
• To foster private and cooperative solutions
• To coordinate investment decisions and expectations
• To act as a catalyst for the relationship between
relevant parties and public authorities interested in the
subject
• Regulation, when needed
Banco Central do BrasilBanco Central do Brasil’’s roles role
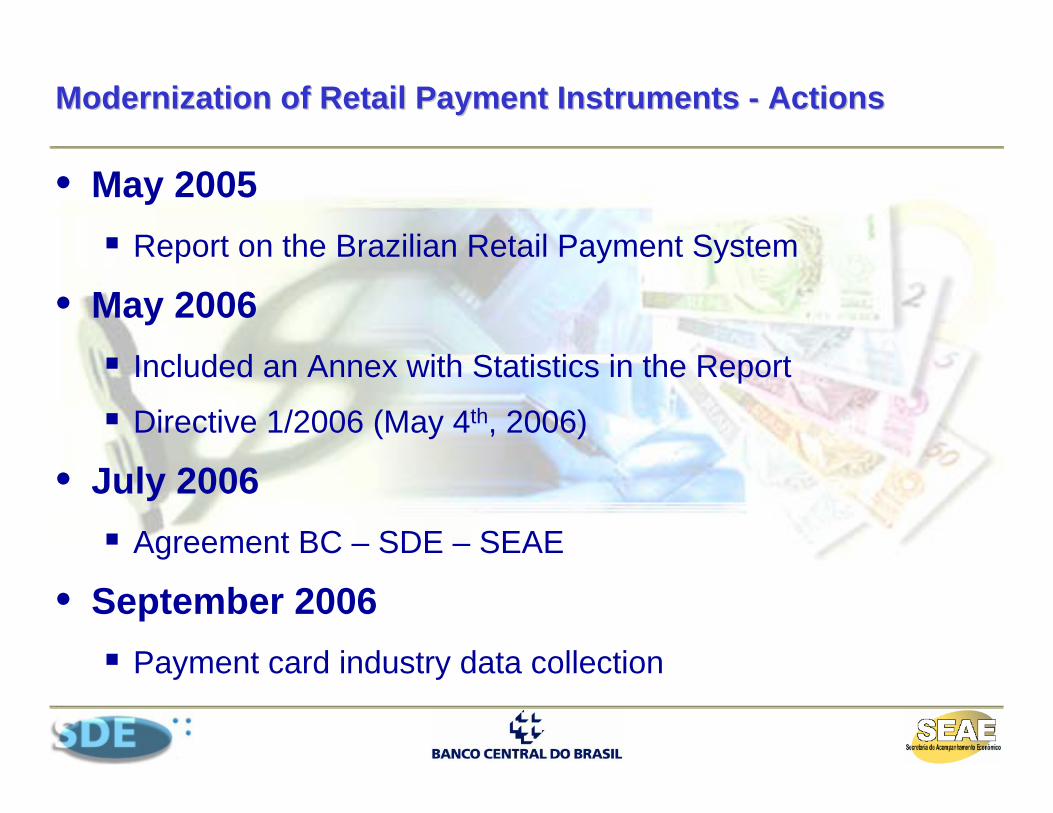
• May 2005Report on the Brazilian Retail Payment System
• May 2006Included an Annex with Statistics in the Report
Directive 1/2006 (May 4th, 2006)
• July 2006Agreement BC – SDE – SEAE
• September 2006Payment card industry data collection
Modernization of Retail Payment Instruments Modernization of Retail Payment Instruments -- ActionsActions
Report on the Brazilian Retail Payment SystemReport on the Brazilian Retail Payment System
• Describes and analyses the Brazilian Retail PaymentSystem aiming at finding the determinants for itsmodernization and serving as a benchmark for policiesand directives
• Main findings:Large-scale usage of paper-based instruments
Infrastructure for clearing and settlement of retail paymentsis fragmented
Low infrastructure interoperability among paymentinstruments distribution channels
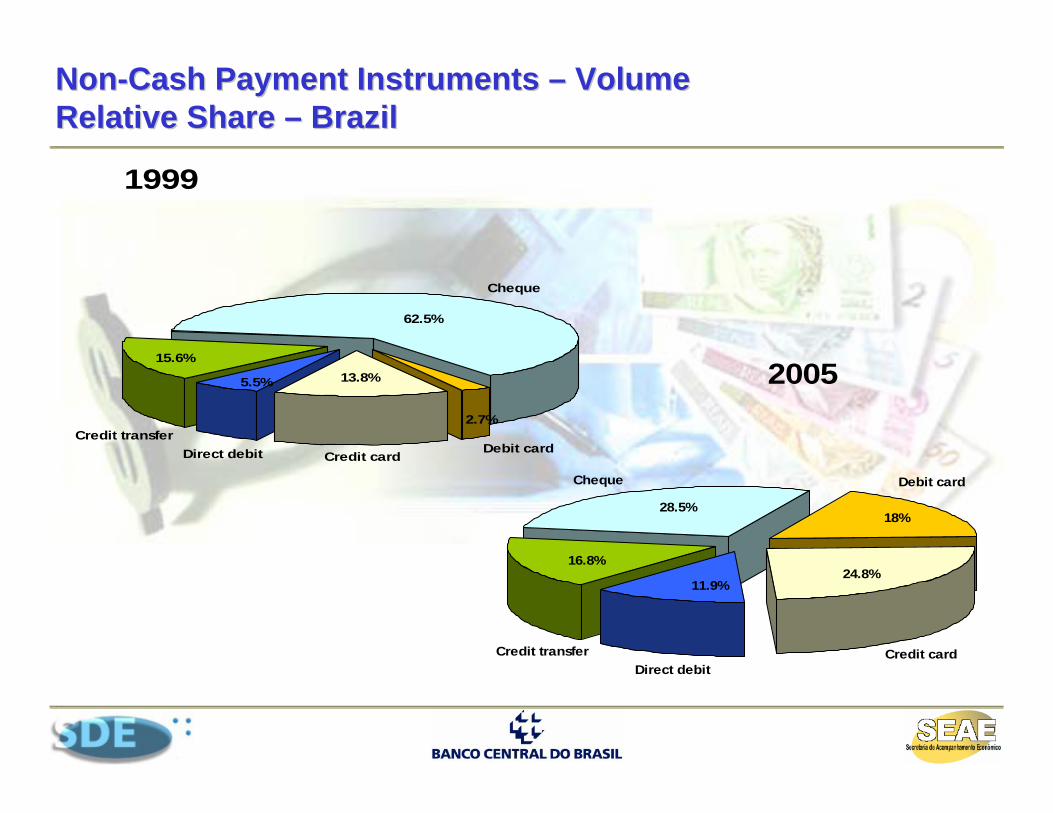
NonNon--Cash Payment Instruments Cash Payment Instruments –– Volume Volume Relative Share Relative Share –– BrazilBrazil
1999
Cheque
Debit cardCredit cardDirect debitCredit transfer
13.8%
62.5%
5.5%
15.6%
2.7%
2005
Cheque Debit card
Credit cardDirect debit
Credit transfer
28.5%
16.8%
11.9%24.8%
18%
2004
0
10
20
30
40
50
60
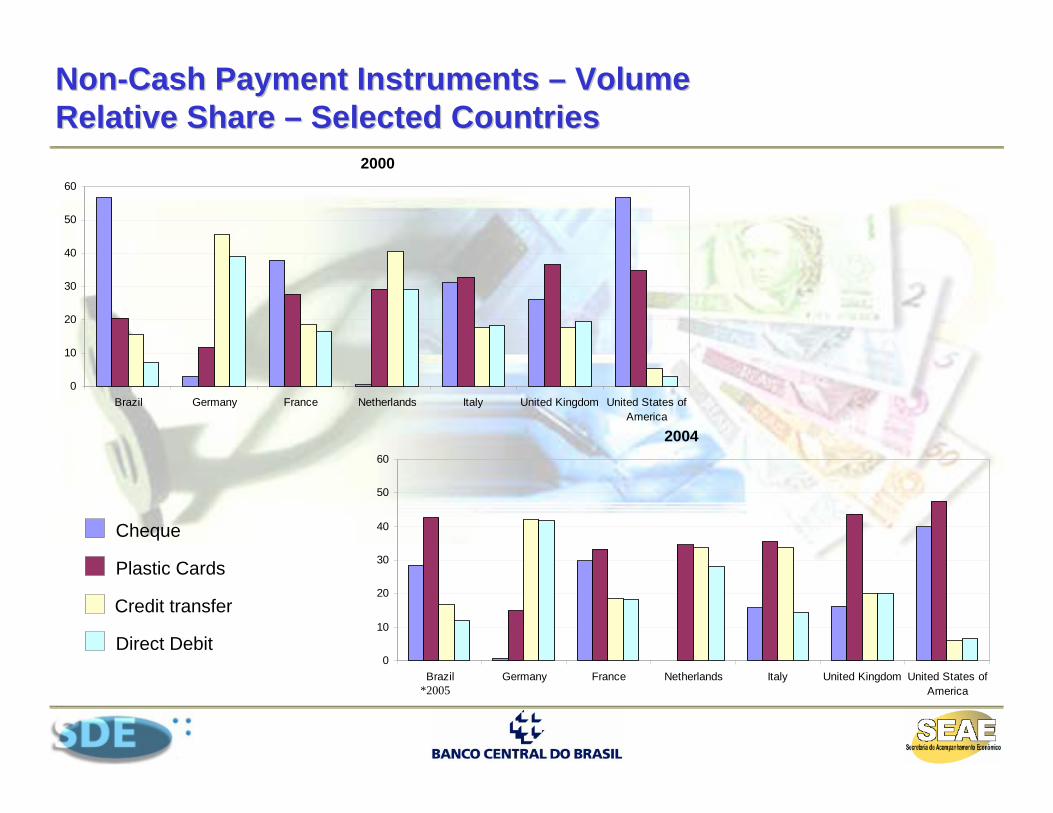
Brazil Germany France Netherlands Italy United Kingdom United States ofAmerica
Cheque
Plastic Cards
Credit transfer
Direct Debit
NonNon--Cash Payment Instruments Cash Payment Instruments –– Volume Volume Relative Share Relative Share –– Selected CountriesSelected Countries
*2005
2000
0
10
20
30
40
50
60
Brazil Germany France Netherlands Italy United Kingdom United States ofAmerica
Directive Directive –– DefinitionDefinition
• Describes certain aspects of a particular sector and expresses BC’s position, in order to guide its future actions
• Does not have the same status as a Norm
Does not establish either obligations or prohibitions
Does not imply any sanctions
• Greater transparency of BC’s policies
• Focus: Payment Cards Industry
• Efficiency Aspectscooperation in Infrastructure
competition in payment services
innovation in product development
• Persuasion of interested partiesgrowth potential
externalities
• Social Welfare Gains
Directive 1/2006, May 4Directive 1/2006, May 4th th , 2006, 2006
• Object Technical Cooperation:
Banco Central do Brasil (BC)Economic Law Office (SDE)Secretariat for Economic Monitoring (SEAE)
• MotivationEconomic efficiency with innovation and social welfare promotion
• Authorities’ rolesBC ⇒ knowledge of banking services and mission of guaranteeing National Financial System’s soundnessBC, SDE e SEAE ⇒ in charge of regulating antitrust issues: anti-competitive conducts and merger actions
BC BC –– SDE SDE –– SEAESEAE’’ss Agreement Agreement –– Main PointsMain Points
• Payment Card Industry Data collection
Elaborate a report
Identify inefficiencies
• Coordinate public policy actions
Propose strategies and measures to authorities, seeking the best public action
Evaluate the efficacy of potential actions by public authorities
BC BC –– SDE SDE –– SEAESEAE’’ss Agreement Agreement –– ObjectivesObjectives
• Price: interchange fees, merchant discount, and customer fee
• Concentration
• Profitability
• Governance
• Qualitative issues
Report on Payment Cards IndustryReport on Payment Cards Industry
• Payment Cards Issuers
Credit Cards
Debit Cards
• Acquirers
• Payment Card Associations
• Merchants
Report Report –– Data Collection Data Collection –– Target PopulationTarget Population
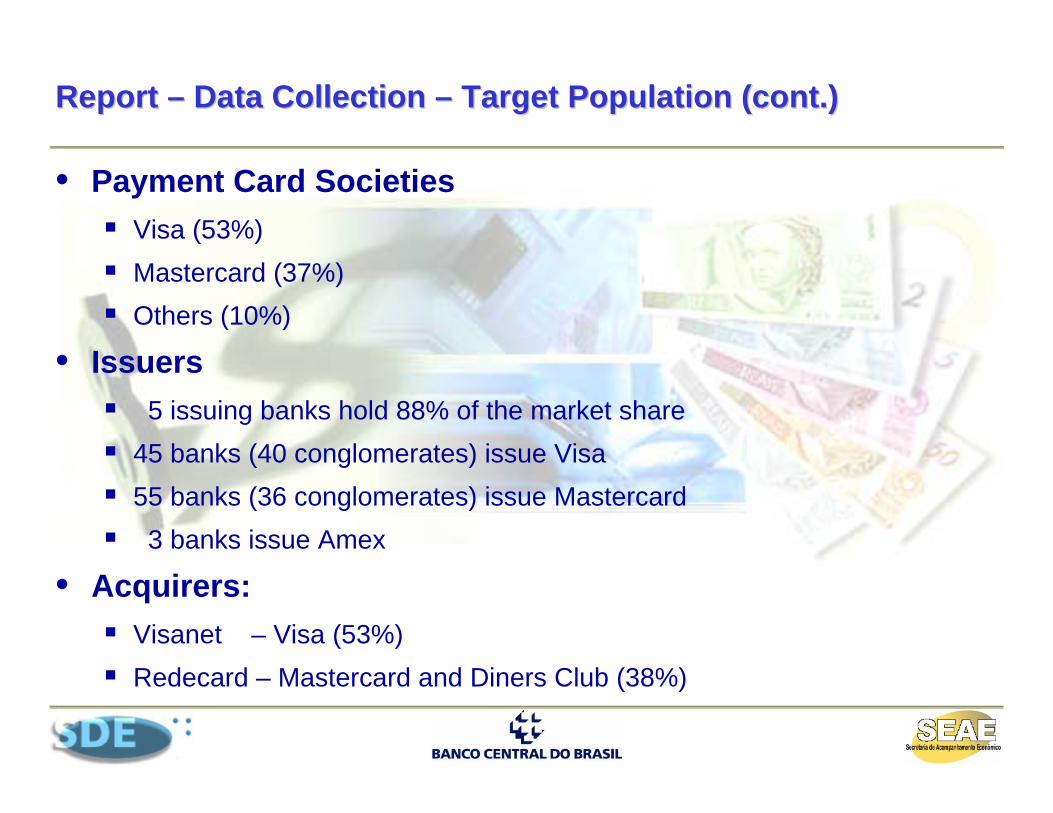
• Payment Card SocietiesVisa (53%)Mastercard (37%)Others (10%)
• Issuers5 issuing banks hold 88% of the market share
45 banks (40 conglomerates) issue Visa55 banks (36 conglomerates) issue Mastercard3 banks issue Amex
• Acquirers:Visanet – Visa (53%)Redecard – Mastercard and Diners Club (38%)
Report Report –– Data Collection Data Collection –– Target Population (cont.)Target Population (cont.)
• Issuing banks (88%):Expressed interest in the reportPresented no impediment to data collectionDifficulty in dividing debit function from credit functionLarge participation of credit revenue on cards total revenue
• Payment Card Societies (100%):Expressed interest in the reportPresented no impediment to data collectionSuggested being the source of information concerning interchange feesShowed huge interest in the results of the Report
Report Report –– Data Collection Data Collection –– Preliminary MeetingsPreliminary Meetings
• Acquirers (100%):Expressed interest in the report Expressed concern about handling data within the time scheduleShowed huge interest in the results of the Report
• Merchant (main commercial associations):Expressed interest in the reportComplimented authorities on the initiativeShowed interest in reducing their final costsComplained about infra-structure, fees etc.
Report Report –– Data Collection Data Collection –– Preliminary Meetings (Cont.)Preliminary Meetings (Cont.)
International ExperiencesInternational Experiences
• Central Banks and Competition Authorities Cooperation– In identifying market failures
• Australia (2000), United Kingdom (2000), The Netherlands (2002)
– In monitoring payment cards market• Spain (1999), US (1986), Chile (2004), Norway(2004)
– In directly regulating payment cards market• Australia(2002), Chile(2004), The Netherlands(2004), Mexico(2004)
• Focus on market structure and rule of reason
• Focus on price structure (interchange fee and merchant discount)
United KingdomUnited Kingdom’’s Cases Case
• HM Treasury, Bank of England and Office of Fair Trading
– Analysis and diagnosis of the market (Cruickshank,2000),(OFT,2003),(BofE,2000)
– Public declaration that industry is taking advantage of its market power (OFT,2003), (OFT,2005)
– Focus on interchange fees and on access rules
– Persuasion as the main instrument of action
– Continuous oversight by the Bank of England
The Netherlands' CaseThe Netherlands' Case
• De Nederlandsche Bank and Competition Authority– Analysis and diagnosis of the market (DNB,2002),
(NMA,2004)
– Focus on market structure and on merchant discount
– Direct intervention in the Interpay (only acquirer) owned by banks in 2004
– After 2004, “non-vertical integration”: • Interpay: management of the network infrastructure
• Banks: affiliation and definition of the commercial relations
– Currently, Central Bank monitors the market and the effects of the measures adopted in the merchant discount
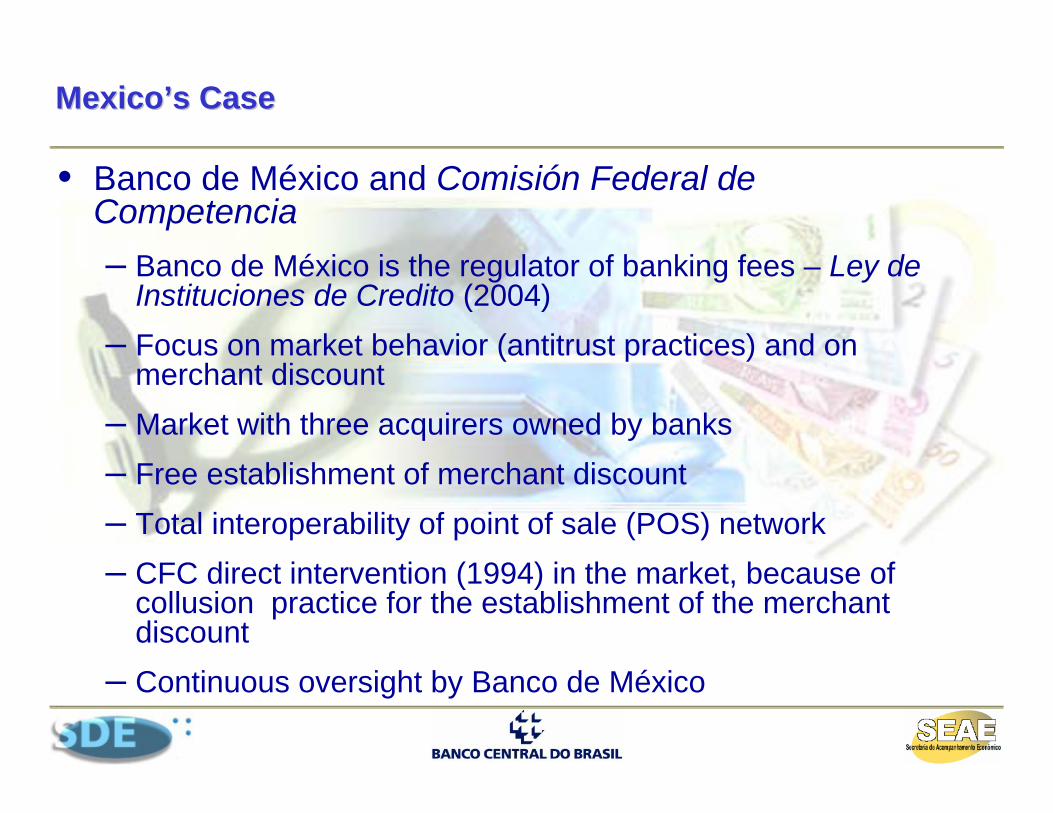
MexicoMexico’’s Cases Case
• Banco de México and Comisión Federal de Competencia– Banco de México is the regulator of banking fees – Ley de
Instituciones de Credito (2004)– Focus on market behavior (antitrust practices) and on
merchant discount– Market with three acquirers owned by banks– Free establishment of merchant discount– Total interoperability of point of sale (POS) network– CFC direct intervention (1994) in the market, because of
collusion practice for the establishment of the merchant discount
– Continuous oversight by Banco de México
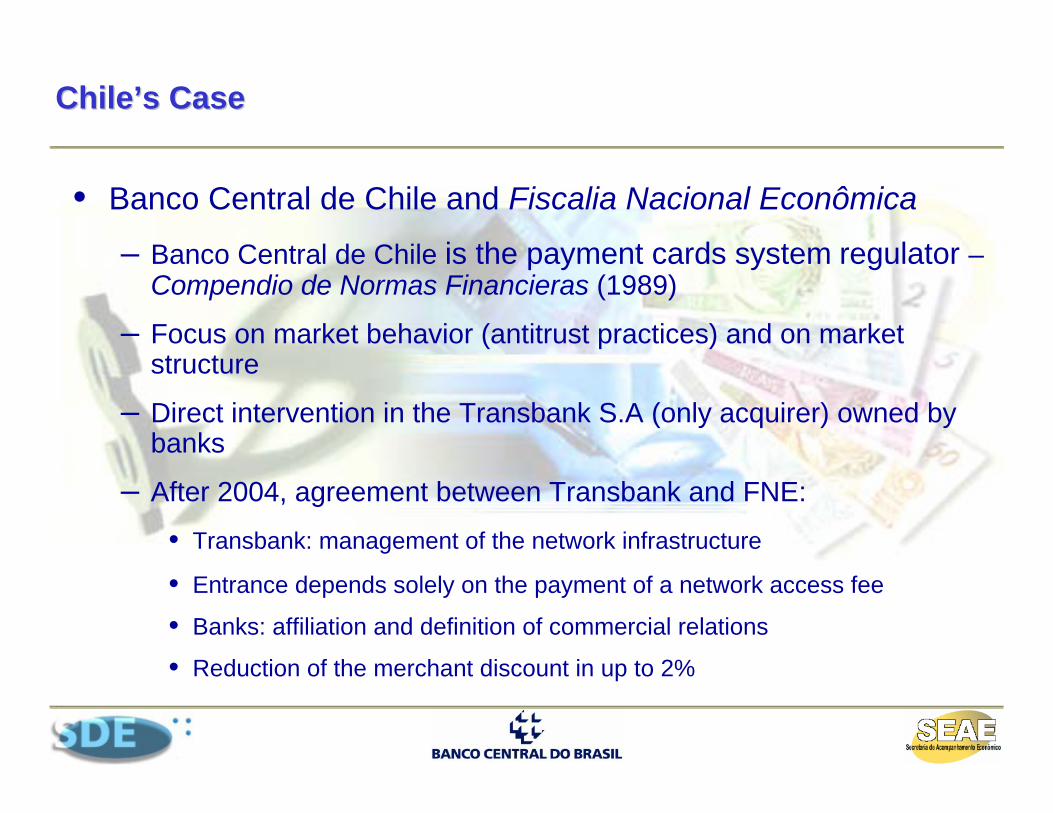
ChileChile’’s Cases Case
• Banco Central de Chile and Fiscalia Nacional Econômica
– Banco Central de Chile is the payment cards system regulator –Compendio de Normas Financieras (1989)
– Focus on market behavior (antitrust practices) and on market structure
– Direct intervention in the Transbank S.A (only acquirer) owned by banks
– After 2004, agreement between Transbank and FNE:
• Transbank: management of the network infrastructure
• Entrance depends solely on the payment of a network access fee
• Banks: affiliation and definition of commercial relations
• Reduction of the merchant discount in up to 2%
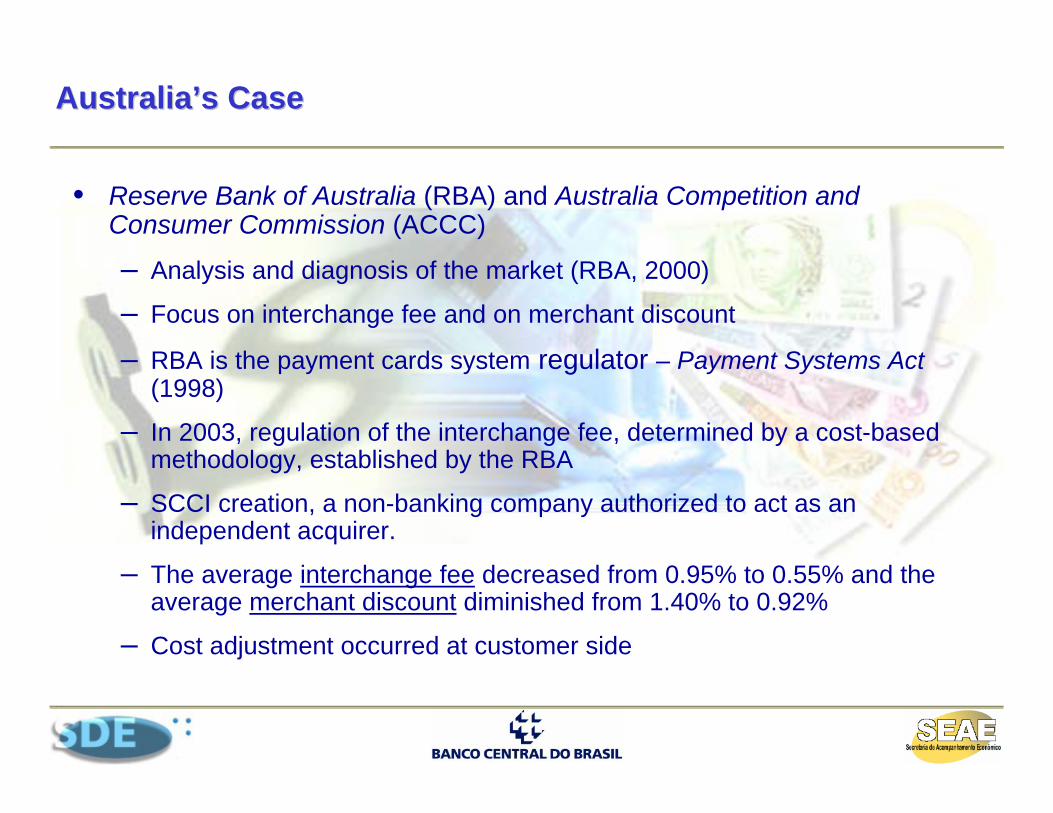
AustraliaAustralia’’s Cases Case
• Reserve Bank of Australia (RBA) and Australia Competition and Consumer Commission (ACCC)
– Analysis and diagnosis of the market (RBA, 2000)
– Focus on interchange fee and on merchant discount
– RBA is the payment cards system regulator – Payment Systems Act(1998)
– In 2003, regulation of the interchange fee, determined by a cost-based methodology, established by the RBA
– SCCI creation, a non-banking company authorized to act as an independent acquirer.
– The average interchange fee decreased from 0.95% to 0.55% and the average merchant discount diminished from 1.40% to 0.92%
– Cost adjustment occurred at customer side
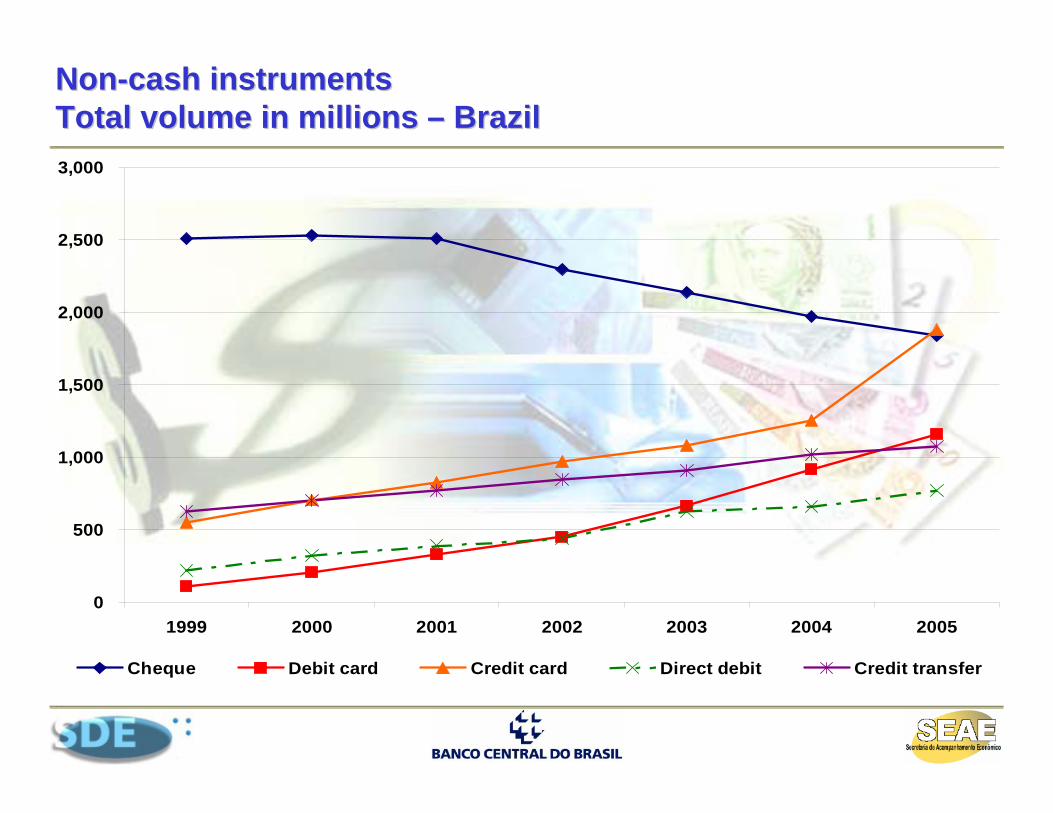
NonNon--cash instrumentscash instrumentsTotal volume in millions Total volume in millions –– BrazilBrazil
0
500
1,000
1,500
2,000
2,500
3,000
1999 2000 2001 2002 2003 2004 2005
Cheque Debit card Credit card Direct debit Credit transfer
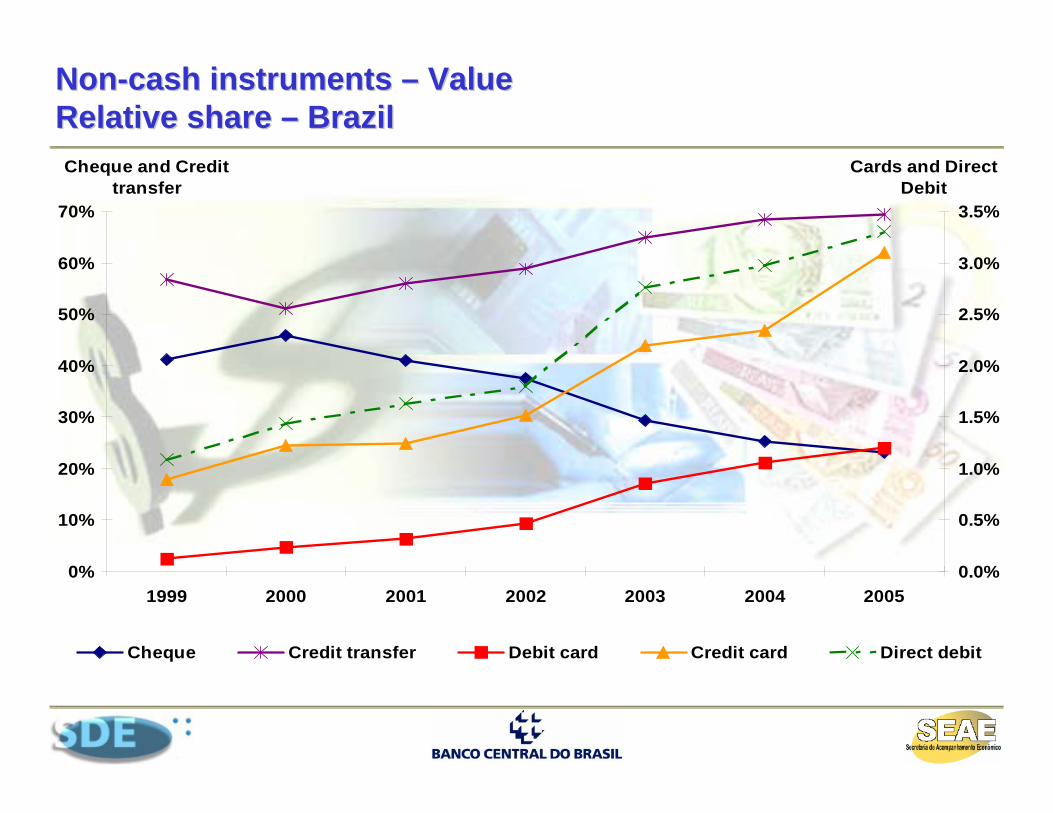
NonNon--cash instruments cash instruments –– Value Value Relative share Relative share –– BrazilBrazil
0%
10%
20%
30%
40%
50%
60%
70%
1999 2000 2001 2002 2003 2004 2005
Cheque and Credit transfer
0.0%
0.5%
1.0%
1.5%
2.0%
2.5%
3.0%
3.5%
Cards and Direct Debit
Cheque Credit transfer Debit card Credit card Direct debit
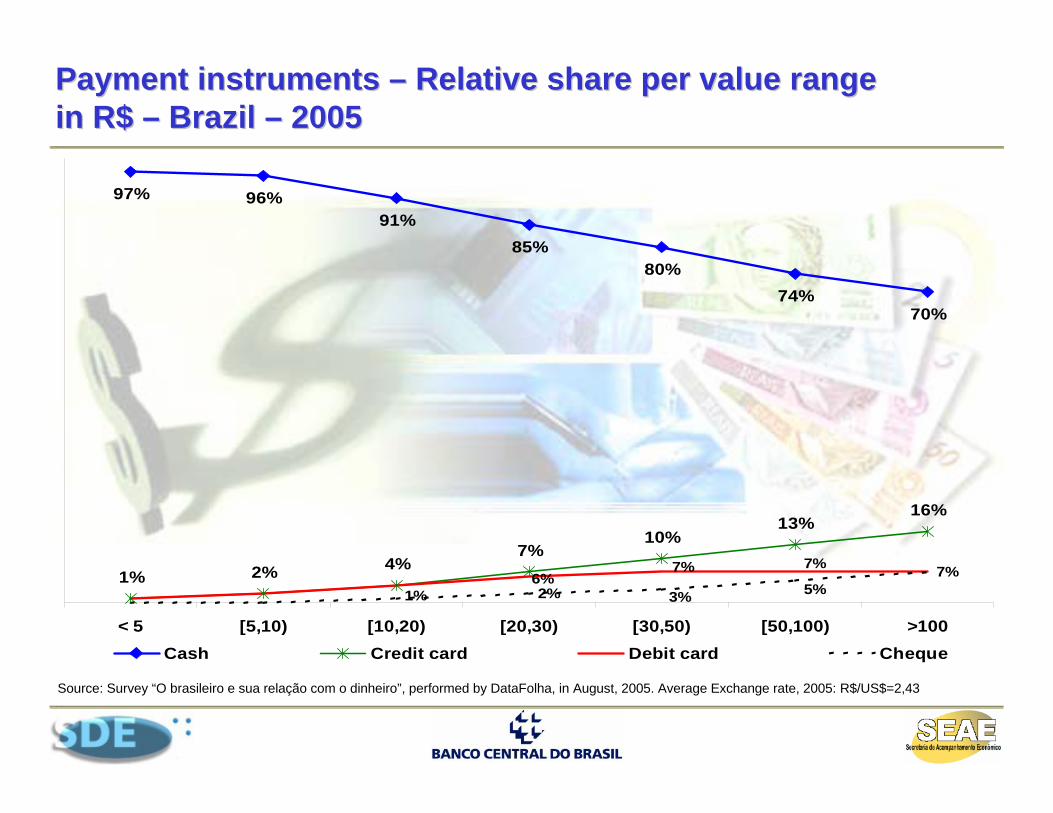
Payment instruments Payment instruments –– Relative share per value range Relative share per value range in R$ in R$ –– Brazil Brazil –– 20052005
97% 96%91%
85%80%
74%70%
1% 2% 4%7%
10%13%
16%
7%2%
6%7% 7%
1% 3% 5%
< 5 [5,10) [10,20) [20,30) [30,50) [50,100) >100Cash Credit card Debit card Cheque
Source: Survey “O brasileiro e sua relação com o dinheiro”, performed by DataFolha, in August, 2005. Average Exchange rate, 2005: R$/US$=2,43
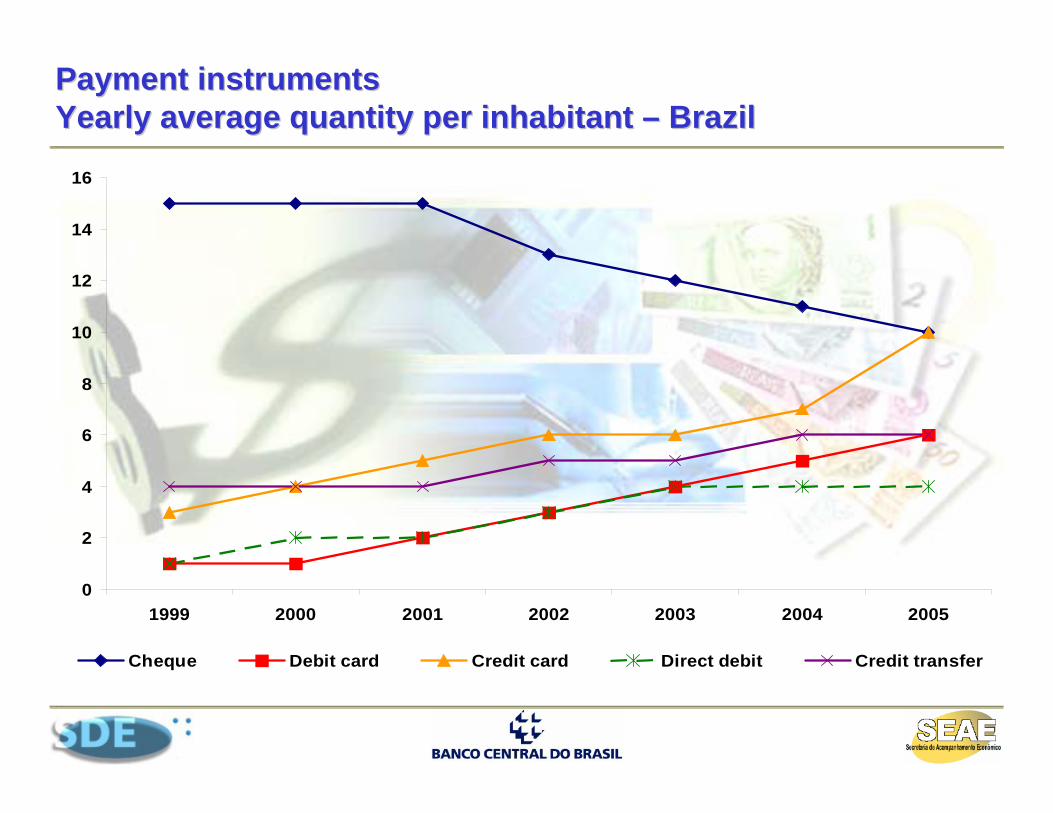
Payment instruments Payment instruments Yearly average quantity per inhabitant Yearly average quantity per inhabitant –– BrazilBrazil
0
2
4
6
8
10
12
14
16
1999 2000 2001 2002 2003 2004 2005
Cheque Debit card Credit card Direct debit Credit transfer
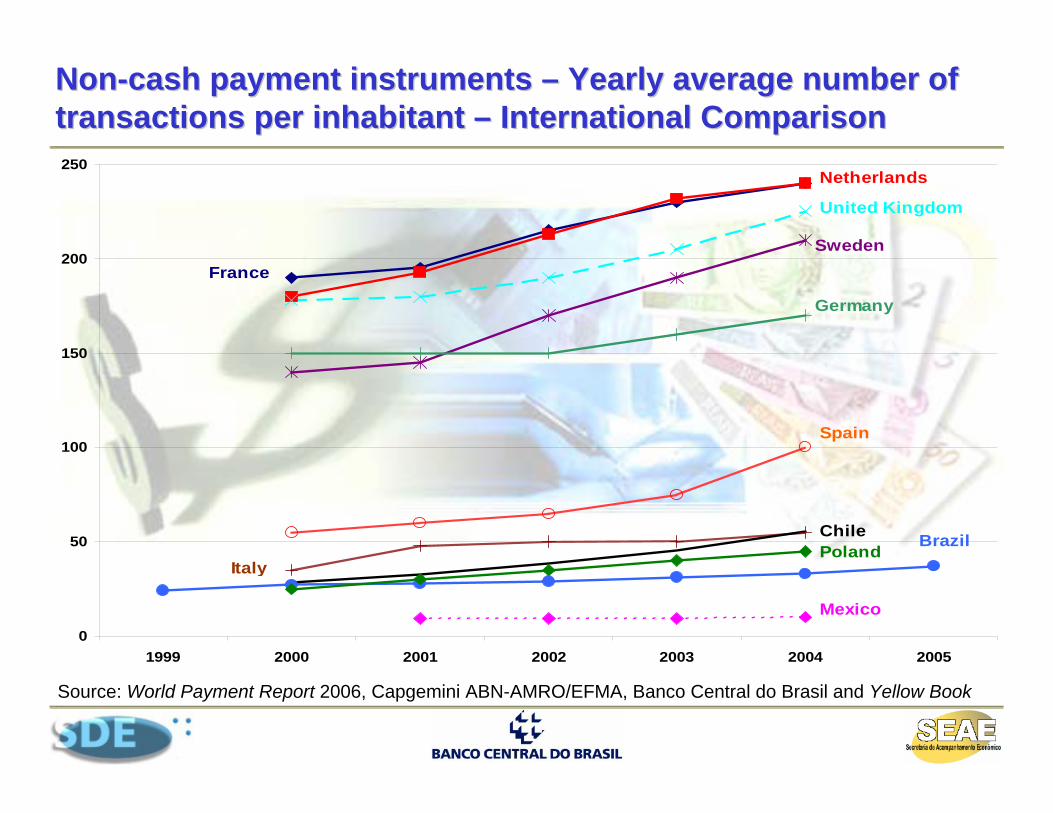
NonNon--cash payment instruments cash payment instruments –– Yearly average number of Yearly average number of transactions per inhabitant transactions per inhabitant –– International ComparisonInternational Comparison
Source: World Payment Report 2006, Capgemini ABN-AMRO/EFMA, Banco Central do Brasil and Yellow Book
0
50
100
150
200
250
1999 2000 2001 2002 2003 2004 2005
Netherlands
United Kingdom
France
Spain
ItalyPoland
Germany
Brazil
Sweden
Mexico
Chile
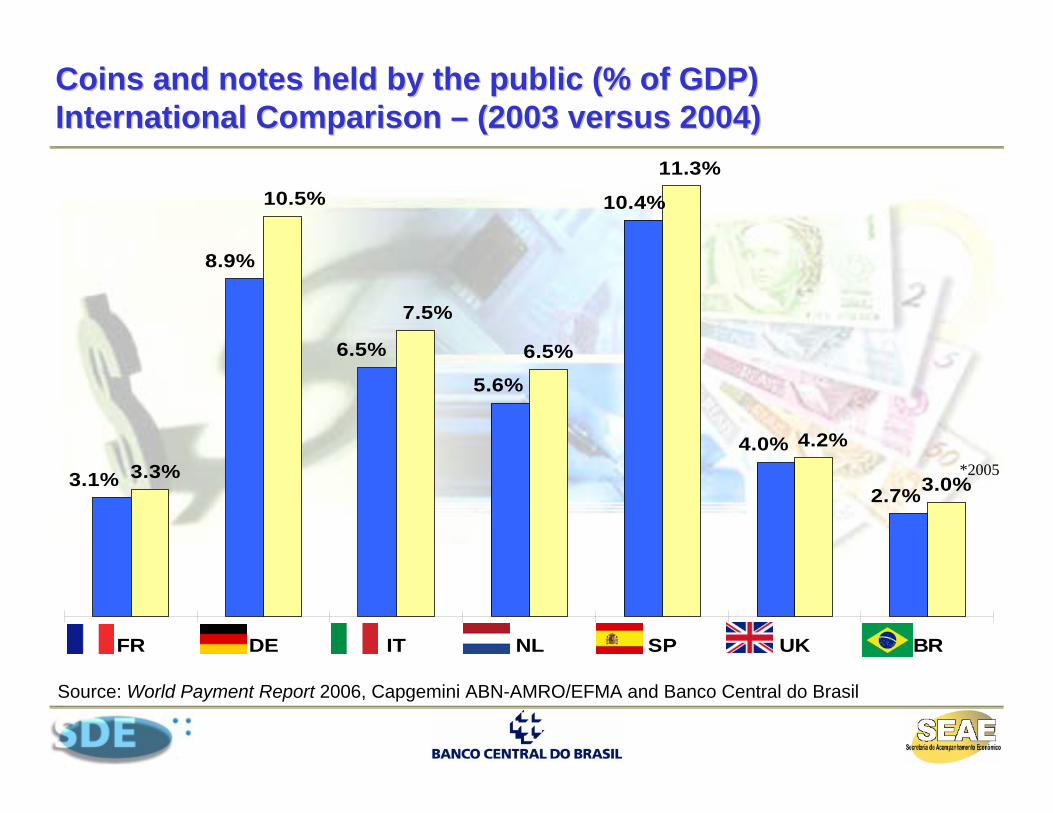
Coins and notes held by the public (% of GDP)Coins and notes held by the public (% of GDP)International Comparison International Comparison –– (2003 versus 2004) (2003 versus 2004)
Source: World Payment Report 2006, Capgemini ABN-AMRO/EFMA and Banco Central do Brasil
*2005
6.5%
3.0%2.7%
4.0%
10.4%
5.6%
6.5%
8.9%
3.1%
4.2%
11.3%
7.5%
10.5%
3.3%
FR DE IT NL SP UK BR
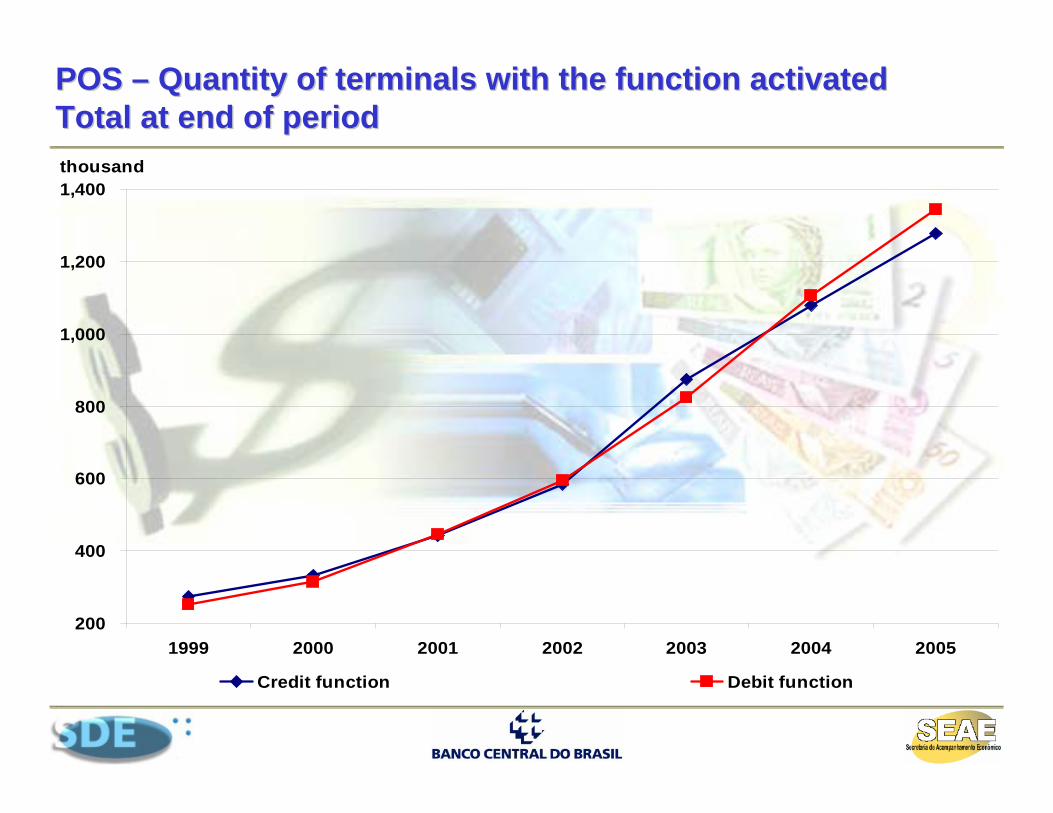
POS POS –– Quantity of terminals with the function activated Quantity of terminals with the function activated Total at end of periodTotal at end of period
200
400
600
800
1,000
1,200
1,400
1999 2000 2001 2002 2003 2004 2005
thousand
Credit function Debit function
ContactContact
JosJoséé Antonio Marciano Antonio Marciano [email protected]@bcb.gov.br
+55 (61) 3414+55 (61) 3414--13401340