modern hydrology and sustainable water development (gupta/modern hydrology and sustainable water...
TRANSCRIPT

P1: SFK/UKS P2: SFK
c09 BLBK276-Gupta August 28, 2010 15:35 Trim: 246mm X 189mm Printer Name: Yet to Come
9 Remote sensing and GIS inhydrology
Remote sensing involves the use of instruments orsensors to ‘capture’ the spectral and spatial char-acteristics of objects and materials observable at adistance – usually from a certain height above theEarth’s surface. In its simplest form, it is a ratherfamiliar activity that we all do in our daily lives.Several of the human sensory organs perceive theexternal world almost entirely through a variety ofsignals, either emitted by or reflected from objectsas electromagnetic waves or pulses. However, inpractice we do not usually think of our sense or-gans as performing remote sensing in the way thatthis term is employed technically. The term ‘re-mote sensing’ is a relatively new addition to thetechnical lexicon. It seems to have been devisedto take into account the view from space obtainedby the early meteorological satellites, which wereobviously more ‘remote’ from their targets than air-planes, which until then had provided aerial photosas a means for recording images of the Earth’s sur-face. In its common or normal usage, remote sens-ing is a technology for sampling electromagneticradiation to acquire and interpret non-contiguousdata in a geographically defined co-ordinate systemfrom which information can be extracted about fea-tures, objects, and classes on the Earth’s land sur-face, oceans, atmosphere and, where applicable,on celestial bodies.
Many different Earth-sensing satellites, with di-verse sensors mounted on sophisticated platforms,are orbiting the Earth and newer ones will continueto be launched. Thus remote sensing, with its abil-
ity to provide a synoptic view, repetitive coverageof a given location with calibrated sensors to detecttemporal changes, and observations at differentresolutions, provides a unique alternative for ap-plications as diverse as monitoring of forest fires,grassland inventory, coastal zones, early cyclonewarning, flood assessment, crop health, and assess-ment of crop yield around the world. Hydrologistshave also realized the potential of satellite remotesensing technology since the 1970s. Remote sens-ing offers a method to avoid the logistic and eco-nomic limitations associated with obtaining contin-uous in-situ measurements of various hydrologicvariables, particularly in view of difficulties encoun-tered in remote regions. Further, microwave instru-ments can potentially provide all-weather, areallyaveraged estimates of certain parameters (e.g.precipitation, soil moisture, and snow water con-tent), something that has not been possible in thepast.
The hydrologic cycle integrates atmospheric, hy-drospheric, cryospheric, and biospheric processesover a wide range of spatial and temporal scalesand thus lies at the heart of the Earth’s climatesystem. Studies of the integrated, global nature ofthe hydrologic cycle are crucial for a proper un-derstanding of natural climate variability and forprediction of climatic response to anthropogenicforcing. Only in recent years, particularly withthe advent of satellite remote sensing, the re-quired data on a global scale seems to be withinreach.
Modern Hydrology and Sustainable Water Development S. K. Gupta
© 2011 S. K. Gupta. ISBN: 978-1-405-17124-3

P1: SFK/UKS P2: SFK
c09 BLBK276-Gupta August 28, 2010 15:35 Trim: 246mm X 189mm Printer Name: Yet to Come
REMOTE SENSING AND GIS IN HYDROLOGY 269
Sig
nal
str
eng
th
0
A
-APeriod
Time
(a)
RadioInfrared
AM
FM
Microwave
Ultraviolet
X-ray
Gamma rays
102 104 106 108 1010 1012 1014 10161018 1020 1022 1024
106 104 102 1 10-2 10-4 10-6 10-8 10-1010-1210-1410-18
Frequency (cycles/sec)
Wavelength (m)
Wavelength (m)70 60 50 40
VioletRed
(b)
Visible spectrum
(x10 )-8
Fig. 9.1 (a) Sinusoidal waveform of electromagnetic radiation (EMR). Frequency (ν) is the number of oscillations per unittime, and wavelength (λ) is the distance travelled in time taken for one oscillation; (b) electromagnetic spectrum withincreasing frequency is shown from left to right. Also included are the terms used for the main spectral regions. Thewavelength scale shown at the bottom in this representation of EM spectrum increases from right to left. Redrawn fromhttp://rst.gsfc.nasa.gov/Intro/Part2 2a.html accessed on 18th Nov., 2008. See also Plate 9.1.
Although most hydrologists believe that re-motely sensed data is valuable for global hydrologicstudies and even for regional hydrologic modellingand field operations, these data are rarely used,possibly due to: (i) lack of necessary technical ex-pertise in processing/interpreting the data; and (ii)the form of emitted and reflected radiances not be-ing the type of data traditionally used to run andcalibrate models. Remotely sensed data also repre-sent averages over finite areas, or pixels, and thusobliterate much of the detail at individual pointsto which most hydrologists are accustomed. In ad-dition, current remotely sensed observations arenot optimized to provide the temporal resolutionneeded to measure certain changes in hydrologicprocesses. Furthermore, algorithms for convertingthese reflectances into physical quantities are oftenempirical in nature and are subject to noise presentin the calibration data.
Nevertheless, remote sensing is beginning toprove useful in providing hydrologic information.Hydrologic remote sensing can reveal complexspatial variations that cannot be readily obtainedthrough traditional in-situ approaches. Develop-ment of such datasets and models in which thesedata can be used requires field experiments thatcombine appropriate remote sensing measure-ments with traditional in-situ measurements in
regions that are hydrologically well understood.Once hydrologic models are developed for use withremote sensing data in well monitored basins, theycan possibly be extended to regions having little orno in-situ measurements.
9.1 Principle of remote sensing
Measurement of the varying energy levels of thefundamental unit in the electromagnetic (EM) field,known as the photon, forms the basis of most re-mote sensing methods and systems. Variations inphoton energies (expressed in joules or ergs) arerelated to the wavelength of the electromagneticradiation or its inverse, frequency. EM radiationdistributed through a continuum of photon ener-gies from high to low energy levels comprises theElectromagnetic Spectrum (EMS). EM waves oscil-late in a harmonic pattern, of which one commonform is the sinusoidal type (Fig. 9.1a;). Radiationfrom specific parts of the EMS contains photonsof different wavelengths whose energy levels fallwithin a discrete range. When any target materialis excited either by internal processes or by inter-action with incoming EM radiation, it either emitsor reflects photons of varying wavelengths whoseproperties differ for different wavelengths that are

P1: SFK/UKS P2: SFK
c09 BLBK276-Gupta August 28, 2010 15:35 Trim: 246mm X 189mm Printer Name: Yet to Come
270 MODERN HYDROLOGY AND SUSTAINABLE WATER DEVELOPMENT
characteristic of the material. Photon energy re-ceived at the detector is commonly expressed inpower units such as watt per square metre per unitwavelength. A plot of variation of power with wave-length gives rise to a specific pattern or curve thatconstitutes the spectral signature of the object orfeature being sensed (see Section 9.1.3).
9.1.1 The photon and the associatedradiometric quantities
EM waves are transverse waves because particleswithin a physical medium are set into vibration nor-mal (at right angles) to the direction of wave prop-agation. EM radiation can propagate even throughempty space (vacuum) completely devoid of parti-cles in the medium. Each photon is associated withan electric field (E) and a magnetic field (H); bothbeing vectors oriented at right angles to each other.The two fields oscillate simultaneously as describedby co-varying sine waves having the same wave-length λ (being the distance between two adjacentcrests [or troughs] on the waveform) and the samefrequency, ν (being the number of oscillations perunit time). The equation relating λ and ν is c =λν, where the constant c is the speed of light andequals 299 792.46 km sec−1 (commonly roundedoff to 300 000 km sec−1). Since the speed of lightis constant, as λ increases ν(= c/λ), therefore, de-creases and vice versa, to maintain its constancy. AnEM spectrum chart is shown in Fig. 9.1b, whereinfrequency is seen to increase from left to right and,therefore, wavelength (shown at the bottom) in-creases from right to left. The terms correspondingto the principal spectral regions are also includedin the diagram. When the electric field is made tobe confined in one direction, the radiation is saidto be plane polarized. The wave amplitudes of thetwo fields are also coincident in time and are ameasure of radiation intensity (brightness). Unitsfor λ are usually specified in the metric system andare dependent on the particular point or region ofthe EM spectrum being considered. Familiar wave-length units include the nanometre; the microm-eter (or micron); the metre; and the Angstrom (=10−10 m). A fixed quantum of energy E (expressedin units of ergs/joules/electron volts) is character-istic of a photon emitted at a discrete frequency,
according to Planck’s quantum equation: E =hν = hc/λ, where h is Planck’s constant(6.6260. . . × 10−34 Joule-sec). From the Planckequation, it is evident that waves representing dif-ferent photon energies oscillate at different fre-quencies. It also follows that photons of higherfrequencies (i.e. shorter wavelengths) have moreenergy and those with lower frequency (i.e. longerwavelength) have less energy.
Example 9.1. Find the wavelength of a quantumof radiation with photon energy of 2.10 × 10⁻¹⁹
Joule.
Using E = hc/λ or λ = hc/E, the wavelength =(6.626 × 10⁻³⁴) (3.00 × 10⁸)/(2.10 × 10−19) =9.4657 × 10⁻⁷m = 946.6 nm; = 9466Angstroms; = 0.9466 µm (which lies in the near-infrared region of the spectrum).
Example 9.2. A radio station broadcasts at 120MHz (megahertz or million cycles sec−1) frequency.Find the corresponding wavelength of radio wavesin metres.
From the equation: wavelength = c/frequency.Thus, wavelength = (3.00 × 10⁸) (120 × 106) =2.5 m.
The interaction of EMR with matter can betreated from two perspectives. The first, the macro-scopic view, is governed by the laws of optics.More fundamental is the microscopic approachthat works at the atomic or molecular level.
In remote sensing, the sensors used employ de-tectors that produce currents (and voltages, V = IR)whose magnitude for any given frequency dependson the photoelectric effect. This means that there isan emission of negative particles (electrons) whena negatively charged plate of an appropriate light-sensitive material is impinged upon by a beam ofphotons. Electrons flowing as a current from theplate, are collected, and counted as a signal. As themagnitude of the electric current produced (givenby the number of photoelectrons flowing per unittime) is directly proportional to the light intensity,its changes can be used to measure changes in thephotons (their numbers and intensity) that strikethe plate (detector) during a given time interval.The kinetic energy of the emitted photoelectrons

P1: SFK/UKS P2: SFK
c09 BLBK276-Gupta August 28, 2010 15:35 Trim: 246mm X 189mm Printer Name: Yet to Come
REMOTE SENSING AND GIS IN HYDROLOGY 271
varies with frequency (or wavelength) of the inci-dent radiation. However, different materials exhibitthe photoelectric effect, releasing electrons overdifferent wavelength regions. Each material has athreshold wavelength at which the photoelectriceffect begins and a longer cut-off wavelength atwhich it ceases.
Furthermore, at a microscopic level a beam ofradiation, such as from the Sun, is usually poly-chromatic, that is, it has photons of different wave-lengths (energies). If an excited atom experiencesa change in energy level from a higher level E2 to alower level E1, Planck’s equation gives:
�E = E2 − E1 = hν (9.1)
where ν has a discrete value given by (v2 – v1; corre-sponding to E1 and E2). In other words, a particularchange in the energy of an atom is characterizedby emission of radiation (photons) at a specificfrequency, ν (and the corresponding wavelengthλ) dependent on the magnitude of change in theenergy.
When energies involved in processes from themolecular to subatomic level are involved (as inthe case of photoelectric effect), these energiesare measured in electron volt units. One electronvolt (eV ) is equal to the amount of energy gainedby a single unbound electron when it acceleratesthrough an electrostatic potential difference of onevolt. In SI units, electron volt is expressed in Joule;1 eV = 1.602 × 10⁻¹⁹ Joule. There are about 6.24× 10¹⁸ electrons in one Coulomb of change.
9.1.2 Solar radiation: transmittance,absorptance, and reflectance
The primary source of energy that illuminates allnatural objects on the Earth is the Sun. The wave-length region of the solar radiation emitted by theSun is determined by the temperature of the Sun’sphotosphere (peaking around 5600◦C). The mainwavelength region of the solar radiation reachingthe Earth (called the solar insolation) is between200 and 3400 nm (0.2 and 3.4 µm), with the maxi-mum power around 480 nm (0.48 µm), which is inthe visible (green) region. As solar radiation reachesthe Earth, the atmosphere absorbs or backscatters afraction of it and transmits the remainder to the sur-
face. Upon striking the land and ocean surface (andthe objects present there) and the atmosphericconstituents such as air, moisture, and clouds, theincoming radiation (irradiance) is partitioned intothree components:
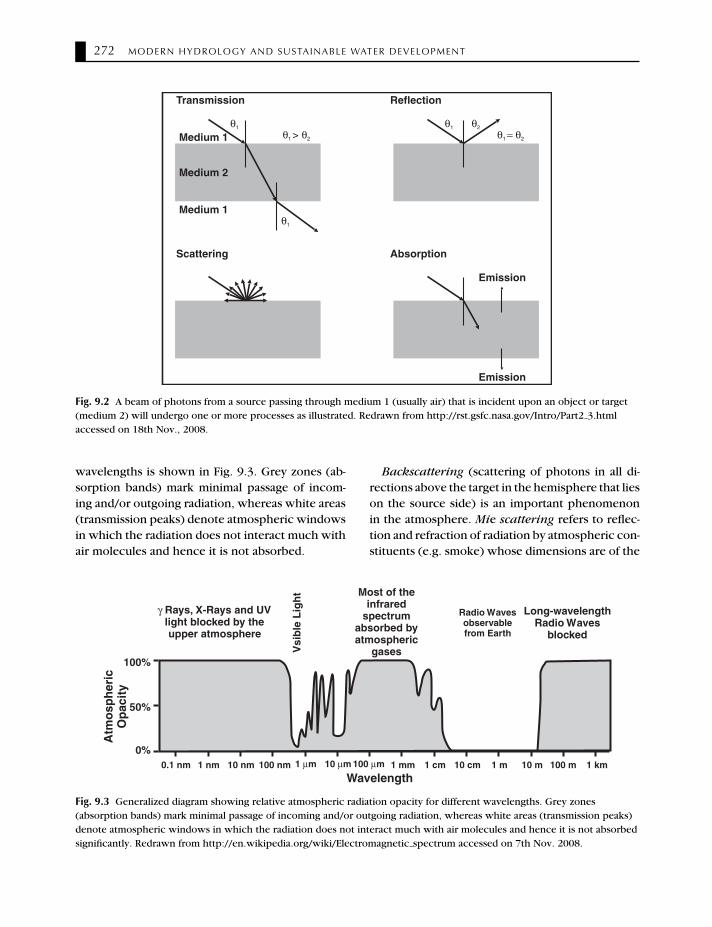
1. Transmittance (τ ) – Some fraction (up to 100%)of the incoming radiation penetrates certain sur-face materials such as water and if the material istransparent and thin, it normally passes through,generally with some attenuation in intensity(Fig. 9.2).
2. Absorptance (α) – Some radiation is absorbedthrough reaction with electrons or moleculeswithin the medium. A part of this energy is thenre-emitted, usually at longer wavelengths, andsome of it remains in the medium, which heatsit up (Fig. 9.2).
3. Reflectance (ρ) – some radiation (commonly100%) gets reflected (moves away from the tar-get) at specific angles and/or is scattered awayfrom the target at various angles, depending onthe surface roughness and the angle of incidenceof the rays (Fig. 9.2).
As these partitions involve ratios (with respect toirradiance), these three parameters are dimension-less numbers (between 0 and 1), but are commonlyexpressed as percentages. In accordance with theLaw of Conservation of Energy, τ + α + ρ = 1.
A fourth situation, when the emitted radiationarises from internal atomic/molecular excitation,usually related to the temperature state of a body,is a thermal process.
When a remote sensing instrument is in the line-of-sight with an object that is reflecting solar ra-diation, the instrument collects the reflected en-ergy and records it. Most remote sensing systemsare designed to collect the reflected radiation fromvarious objects.
Generally the remote sensing survey is con-ducted above the Earth’s surface, either within orabove the atmosphere. The gases present in theEarth’s atmosphere interact with solar radiationand also with radiation emitted by the Earth’s sur-face. The atmospheric constituents in turn get ex-cited by these EM radiations and become anothersource of photons. A generalized diagram showingrelative atmospheric radiation opacity for different
P1: SFK/UKS P2: SFK
c09 BLBK276-Gupta August 28, 2010 15:35 Trim: 246mm X 189mm Printer Name: Yet to Come
272 MODERN HYDROLOGY AND SUSTAINABLE WATER DEVELOPMENT
Medium 1
Medium 1
Medium 2
θ1
θ1
θ1 2> θ
Transmission
θ1
θ = θ1 2
θ2
Reflection
Absorption
Emission
Emission
Scattering
Fig. 9.2 A beam of photons from a source passing through medium 1 (usually air) that is incident upon an object or target(medium 2) will undergo one or more processes as illustrated. Redrawn from http://rst.gsfc.nasa.gov/Intro/Part2 3.htmlaccessed on 18th Nov., 2008.
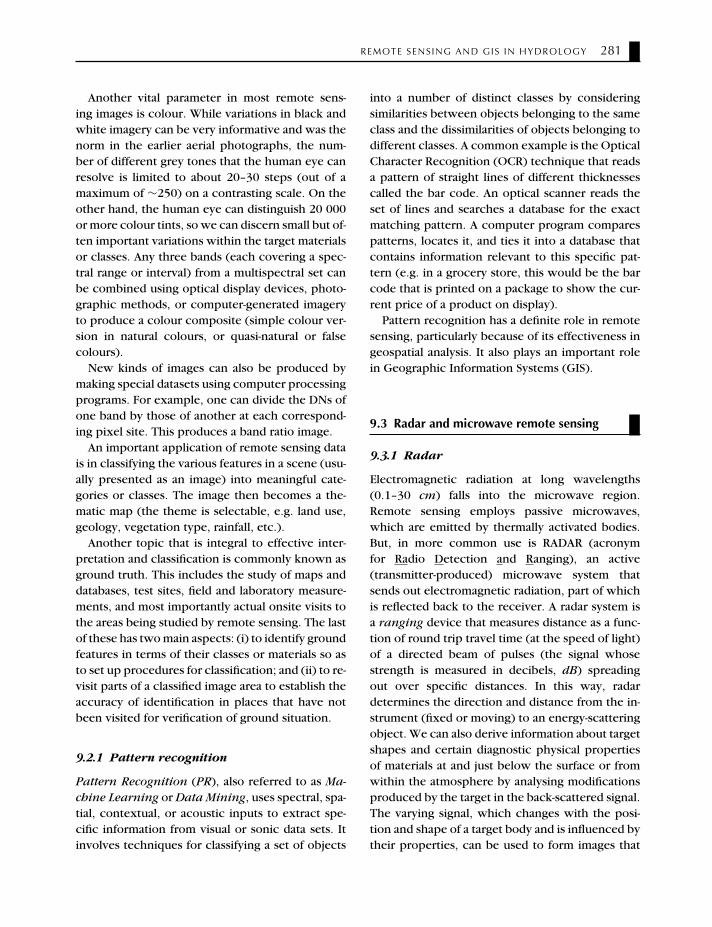
wavelengths is shown in Fig. 9.3. Grey zones (ab-sorption bands) mark minimal passage of incom-ing and/or outgoing radiation, whereas white areas(transmission peaks) denote atmospheric windowsin which the radiation does not interact much withair molecules and hence it is not absorbed.
Backscattering (scattering of photons in all di-rections above the target in the hemisphere that lieson the source side) is an important phenomenonin the atmosphere. Mie scattering refers to reflec-tion and refraction of radiation by atmospheric con-stituents (e.g. smoke) whose dimensions are of the
0.1 nm 1 nm 10 nm 100 nm 1 mµ 10 mµ 100 mµ 1 mm 1 cm 10 cm 1 m 10 m 100 m 1 km
Wavelength
γ Rays, X-Rays and UVlight blocked by theupper atmosphere
Vsi
ble
Lig
ht Most of the
infraredspectrum
absorbed byatmospheric
gases
Radio Wavesobservablefrom Earth
Long-wavelengthRadio Waves
blocked
Atm
osp
her
icO
pac
ity
0%
100%
50%
Fig. 9.3 Generalized diagram showing relative atmospheric radiation opacity for different wavelengths. Grey zones(absorption bands) mark minimal passage of incoming and/or outgoing radiation, whereas white areas (transmission peaks)denote atmospheric windows in which the radiation does not interact much with air molecules and hence it is not absorbedsignificantly. Redrawn from http://en.wikipedia.org/wiki/Electromagnetic spectrum accessed on 7th Nov. 2008.

P1: SFK/UKS P2: SFK
c09 BLBK276-Gupta August 28, 2010 15:35 Trim: 246mm X 189mm Printer Name: Yet to Come
REMOTE SENSING AND GIS IN HYDROLOGY 273
order of the wavelengths of the incident radiation.Rayleigh scattering results from constituents (e.g.molecular gases: O2, N2 and other nitrogen com-pounds, CO2 and water vapour) such that the sizesof their molecules are much smaller than the wave-lengths of radiation. Rayleigh scattering increaseswith decreasing wavelength, causing preferentialscattering of blue light (the “blue sky effect”). How-ever, the crimson red colour of the sky at sunset andsunrise results from significant absorption of thevisible light (shorter wavelengths) owing to greater‘optical depth’ of the atmospheric path when theSun is near the horizon. Particles much larger thanthe wavelength of the radiation give rise to non-selective (wavelength-independent) scattering. At-mospheric backscattering can, under certain con-ditions, account for 80 to 90% of the radiant fluxobserved by a spacecraft sensor.
Remote sensing of the Earth traditionally involvesreflected energy in the visible and infrared and emit-ted energy in the thermal infrared and microwaveregions to gather radiation. The collected radia-tion can be analysed numerically or alternativelyused to generate images whose tonal variations rep-resent different intensities of photons associatedwith a range of wavelengths that are received bythe sensor. Sampling of a (continuous or discon-tinuous) range(s) of wavelengths is the essenceof what is usually termed multispectral remotesensing.
Images formed by varying wavelength/intensitysignals coming from different parts of an objectshow variations in grey tones in black and whiteversions or in colours (in terms of hue, saturation,and intensity in coloured versions). Pictorial (im-age) representation of target objects and featuresin different spectral regions, usually employ differ-ent sensors (commonly in band pass filters) eachtuned to accept and process the wavelengths thatcharacterize a given region. The images normallyshow significant differences in the distribution (pat-terns) of colour or grey tones. It is this variationwhich produces an image or picture. Each spectralband produces an image that has a range of tonesor colours characteristic of the spectral responsesof the various objects in the scene. Images madefrom different spectral bands show different tonesor colours.
Thus from a quantum phenomenological ap-proach, remote sensing involves detection of pho-tons of varying energies coming from the targetafter they are generated by selective reflectanceor emitted from the target material(s) by passingthem through frequency (wavelength)-dependentdispersion devices (filters, prisms) onto metals ormetallic compounds/alloys, which through pho-toelectric effect produce electric currents. Thesecurrents are analysed and interpreted in terms ofenergy-dependent parameters (frequency, inten-sity, etc.) whose variations are controlled by theatomic composition of the targets. The spectral(wavelength) dependence of each material is char-acteristic of its unique nature. When the photoncharacteristics are plotted as an x-y plot, the shapesof the varied distributions of photon levels producepatterns that further aid in identifying each mate-rial (with possibility of regrouping into a class orsome other distinct physical feature).
9.1.3 Spectral signatures
For a given material, the amount of solar radiationthat it reflects, absorbs, transmits, or emits varieswith wavelength. When the amount (usually inten-sity, as a percent of its maximum value) comingfrom the material is plotted over a range of wave-lengths, the values lie on a curve called the spec-tral signature or spectral response curve of thematerial. An example of the reflectance plot forsome unspecified vegetation type, with the domi-nating factor influencing each interval of the curve,is shown in Fig. 9.4. Individual spectral signaturesof different surface materials enable their identi-fication (or of classes of materials), as shown inFig. 9.5a. For example, for some wavelengths, sandreflects more energy than green vegetation coverbut for other wavelengths it absorbs more (reflectsless). Using differences in reflectance values, it ispossible to distinguish four common surface ma-terials from the above signatures (GL: grasslands;PW: pinewoods; RS: red sand; SW: silty water) sim-ply by plotting the reflectance of each material attwo wavelengths, as shown in Fig. 9.5b. In thiscase, the data points are sufficiently separated fromeach other to validate that just these two properlyselected wavelengths permit markedly different

P1: SFK/UKS P2: SFK
c09 BLBK276-Gupta August 28, 2010 15:35 Trim: 246mm X 189mm Printer Name: Yet to Come
274 MODERN HYDROLOGY AND SUSTAINABLE WATER DEVELOPMENT
Fig. 9.4 An example of a reflectance plot for an unspecified vegetation type with the dominating factor influencing theentire reflectance curve. Redrawn from http://rst.gsfc.nasa.gov/Intro/Part2 5.html accessed on 18th Nov., 2008.
materials to be distinguished by their spectral prop-erties. When we use more than two wavelengths,the plots in multi-dimensional space (up to threecan be visualized; more than three are best han-dled mathematically) tend to produce more sepa-ration amongst different materials. This improved
distinction amongst materials, due to use of extrawavelengths, forms the basis of multispectral re-mote sensing.
Spectral signatures for individual materials orclasses can be determined best under laboratoryconditions, where the sensor is placed very close
Red Sand (RS) Grasslands(GL)
Pinewoods (PW)
Silty Water (SW)
100
80
60
40
20
0
Ref
lect
ance
(%
)
0.4 0.6 0.8 1.0 1.2Wavelength ( m)µ
(a)
Ref
lect
ance
(%
) at
0.8
5mµ
100
80
60
40
20
080 1006040200
Reflectance (%) at 0.55 mµ
GS
PWRS
SW
(b)
Fig. 9.5 (a) Spectral signatures, as variation of percent reflectance with wavelength, of some typical surface materials.Different materials reflect varying proportions of incident EMR at different wavelengths, which forms the basis of identifyingmaterials through these signatures. (b) using differences in reflectance, it may be possible to distinguish the four commonsurface materials through the above signatures by plotting reflectances of each material at two wavelengths. Redrawn fromhttp://rst.gsfc.nasa.gov/Intro/Part2 5.html accessed on 18th Nov., 2008.

P1: SFK/UKS P2: SFK
c09 BLBK276-Gupta August 28, 2010 15:35 Trim: 246mm X 189mm Printer Name: Yet to Come
REMOTE SENSING AND GIS IN HYDROLOGY 275
SpatialInformation
ImagersAltimetersSounders
Spectrometers
PolarimetersScatterometers
RadiometersSpectro-Radiometers
Imag
ing
Spec
trom
eter
s Imaging
Radiometers
SpectralInformation
IntensityInformation
Fig. 9.6 A classification of remote sensing sensors based on the type of information provided by them, namely spatial,spectral, or intensity. Redrawn from http://rst.gsfc.nasa.gov/Intro/Part2 5a.html accessed on 18th Nov., 2008.
to the target. This results in a ‘pure’ spectral signa-ture. But when the sensor is located well above thetarget, which is the case when a satellite remotesensing device looks down at the Earth, the tele-scope that examines the scene may cover a largersurface area than just the target at any given mo-ment. Individual objects smaller than the field ofview are not resolved and each object contributesits own spectral signature. In other words, for lowresolution conditions, each one of the several differ-ent materials/classes sends (unresolved) radiationback to the sensor. The resulting spectral signatureis a composite of all components in the sampledarea. Analytical techniques (e.g. Fourier series anal-ysis) can extract individual signatures under somespecial circumstances. But the sampled area is usu-ally assigned a label equivalent to its dominant class.
9.1.4 Sensors
Most remote sensing measuring instruments (sen-sors) are designed to count the number of photons.As mentioned earlier, the basic principle underly-ing a sensor operation is based on the photoelectriceffect. In this section, some of the main ideas on
the sensors that are used for this purpose are sum-marized. Three types of information are obtainedusing different kinds of sensors. Based on this cri-terion sensors may be classified, as shown in Fig.9.6. An alternative and more elaborate classificationof sensors based on the EM radiation measured isshown in Fig. 9.7.
Common types of a sensor system are:
� Optical systems – employing lenses, mirrors,apertures, modulators, and dispersion devices;
� Detectors – providing electrical signals propor-tional to irradiance on their active surface, gen-erally being some type of semiconductor;
� Signal processors – performing specified func-tions on the electrical signal to provide outputdata in the desired format.
With reference to Fig. 9.7, two broad classes ofsensors are: (i) passive, in which the energy giv-ing rise to the radiation received comes from anexternal source, for example, the Sun; the MSSis an example, and (ii) active, in which energygenerated from within the sensor system is beamed

P1: SFK/UKS P2: SFK
c09 BLBK276-Gupta August 28, 2010 15:35 Trim: 246mm X 189mm Printer Name: Yet to Come
276 MODERN HYDROLOGY AND SUSTAINABLE WATER DEVELOPMENT
Fig. 9.7 Classification of remote sensing sensors based on the manner in which EM radiation is measured. Redrawn fromhttp://rst.gsfc.nasa.gov/Intro/Part2 5a.html accessed on 18th Nov., 2008.
outwards and the fraction returned is measured;radar is an example. Sensors can be non-imagingor imaging. Non-imaging sensors measure the ra-diation received from all points in the sensed target,integrate it, and convert the result into an electri-cal signal or some other quantitative attribute, suchas radiance. In the imaging sensors, electrons re-leased are used to excite or ionize a substance suchas silver (Ag) deposited on a film or drive an image-producing device such as a TV, computer monitor,cathode ray tube, oscilloscope, or an array of elec-tronic detectors. As the radiation is related to spe-cific points in the target, the end result is an image(picture) or a raster display (e.g. parallel horizontallines on a TV screen).
Radiometer is a general term for any instrumentthat quantitatively measures the EM radiation insome interval of the EM spectrum. When the ra-diation is in the narrow spectral band including thevisible light, the term photometer is used. If thesensor includes a component, such as a prism or
diffraction grating, that can break radiation extend-ing over a part of the spectrum into discrete wave-lengths and disperse (or separate) them at differentangles to be detected by an array of detectors, itis called a spectrometer. One type of spectrometer(used in the laboratory for chemical analysis) em-ploys multi-wavelength radiation passing through aslit onto a dispersing medium, which reproducesthe image of the slit as lines at various fixed spac-ings onto a film plate. The term spectro-radiometeris reserved for sensors that collect the dispersedradiation in bands rather than in discrete wave-lengths. Most air/space-borne sensors are spectro-radiometers.
Sensors that measure radiations coming from theentire scene instantaneously are called framing sys-tems. The human eye, photo camera, and TV pic-ture tube belong to this category. The size of thescene that is framed is determined by the apertureand optics employed in the system that defines thefield of view (FOV ). If the scene is sensed point by

P1: SFK/UKS P2: SFK
c09 BLBK276-Gupta August 28, 2010 15:35 Trim: 246mm X 189mm Printer Name: Yet to Come
REMOTE SENSING AND GIS IN HYDROLOGY 277
point (equivalent to small areas within the scene)along successive lines over a finite time, this modeof measurement makes up a scanning system. Mostnon-camera-based sensors operating from movingplatforms image the scene by scanning.
Further, in the classification scheme the opticalset-up for imaging sensors involves setting up ei-ther an image plane or an object plane, dependingon whether the lens is before the point where thephoton beam is made to converge at the focus orbeyond it. For the image plane arrangement, thelens receives parallel light rays after these are de-flected onto it by the scanner by the focusing deviceplaced at its end. For the object plane set-up, therays are focused at the front end (and have a virtualfocal point behind the initial optical system) andare intercepted by the scanner before being finallyfocused at the detector.
Another attribute of this classification scheme iswhether the sensor operates in a scanning modeor a non-scanning mode. A film camera held firmlyin hand is a non-scanning device that captureslight almost instantaneously when the shutter isopened for a short time and then closed. How-ever, when the camera and/or the target move (asis the case with a movie camera), scanning is be-ing performed in some sense. Conversely, the tar-get can be static but the sensor sweeps across thesensed object/scene. This can be called scanningin that the sensor is designed for its detector(s) tomove systematically in a progressive sweep, evenas they move across the target. This is how a scan-ner operates in a computer; its flatbed platform(the casing and glass surface on which a pictureis placed) also stays put. Scanning can also be car-ried out by putting a picture or paper documenton a rotating drum (having two motions: circularand progressive shift in the direction of the drum’saxis), in which the illumination is done by a fixedbeam.
The sensors generally monitor the ground traceof the satellite over an area out to the sides of thetrace. This is known as the swath width. The widthis determined by part of the scene that encom-passes full angular field of view of the telescope,which is actually sensed by a detector array. This isnormally narrower than the total width of the ob-ject/scene from which light is made to pass throughan external aperture (usually a telescope). With ref-
erence to the flight path, two principal modes ofdata gathering are shown in Fig. 9.8.
In the cross-track mode the data is gatheredacross the flight path by sweeping the object/scenealong a line, or more commonly a series of adjacentlines, traversing the ground that is long (a fewkm) but very narrow (a few m). This is sometimesreferred to as the ‘whiskbroom mode’ from theconceptual picture of sweeping a table from sideto side with a small hand-held broom. Each lineis subdivided into a sequence of individual spatialelements that represent a corresponding square,rectangular, or circular area (ground resolutioncell) on the surface of the scene being imaged(or within, if the target to be sensed is the three-dimensional atmosphere). Thus, along any linethere is an array of contiguous cells from each ofwhich radiation emanates. The cells are sensed oneafter another along a line. In the sensor, each cellis associated with a pixel (picture element) thatis coupled with/connected to a microelectronicdetector. Each pixel is characterized for a brieftime interval by some definite value of radiation(e.g. reflectance) that is converted into current(i.e. number of electrons flowing per unit time)using the photoelectric effect.
The areal coverage of the pixel (i.e., the groundcell area it corresponds to) is determined by theinstantaneous field of view (IFOV) of the sensorsystem. The IFOV is defined as the solid angle ex-tending from a detector to the area on the ground itmeasures at any instant (Fig. 9.8a). IFOV is a func-tion of optical characteristics of the sensor, sam-pling rate of the signal, dimensions of any opticalguides (such as optical fibres), size of the detector,and altitude above the target or scene at which thesensor is located.
The along-track mode of scanning has a linear ar-ray of detectors oriented normal to the flight path.The IFOV of each detector sweeps a path paral-lel to the flight direction. This type of scanning isalso referred to as ‘pushbroom’ scanning (from themental image of cleaning a floor with a wide broomthrough successive forward sweeps). The scannerconsists of a line of small sensitive detectors stackedside by side, each being of very small dimension, onits plate surface. These detectors may number sev-eral thousands. Each detector is a charge-coupleddevice (CCD).

P1: SFK/UKS P2: SFK
c09 BLBK276-Gupta August 28, 2010 15:35 Trim: 246mm X 189mm Printer Name: Yet to Come
278 MODERN HYDROLOGY AND SUSTAINABLE WATER DEVELOPMENT
MotorRotating
scanmirror
DetectorInstantaneousfield of view
Scan
directio
n
Groundresolution
cell
Angularfield ofview
CROSS-TRACK SCANNER
(a)
Groundresolution
cells
Scan
direct
ion
Detectorarray
Focalplane
Lens
ALONG-TRACK SCANNER
(b)
Fig. 9.8 Two modes of remote sensing data acquisition with reference to flight path (orbit) of the satellite. (a) Theinstantaneous field of view (FOV) of each detector in ‘cross-track scanner’ sweeps the scene across the flight path along a lineor more commonly a series of adjacent lines traversing the ground that is very long (∼ km) but very narrow (∼ m). (b)Instantaneous FOV of each detector in ‘along-track scanner’ sweeps a path parallel to the flight direction. Redrawn fromhttp://rst.gsfc.nasa.gov/Intro/Part2 5a.html accessed on 18th Nov., 2008.
9.1.5 Resolution
The obvious definition of spatial resolution can sim-ply be stated as the smallest size of an object thatcan be picked out from its surrounding objectsor features. This demarcation from neighbours orbackground may or may not be sufficient to identifythe object, but high spectral resolution definitelyaids material and class identification. Similar to spa-tial resolution, a price has to be paid to get betterspectral resolution in terms of the number of de-tectors that must be appropriately increased. Thesemust be physically placed suitably to capture thewavelength-dependent radiation spread over thedesired part of the spectrum. This affects the pro-cess of signal handling onboard and data handlingon the ground.
Field of view controls the swath width of a satel-lite image. The width, in turn, depends on: (i) opticsof the observing telescope; (ii) inherent samplinglimitations of the electronic sensor; and (iii) alti-tude of the sensor. Normally, the higher the orbitof the satellite, the wider is the swath width andconsequently the lower will be the spatial resolu-
tion. Both altitude and swath width determine the‘footprint’ of the sensed scene, such that it is acrossthe track dimensions and frequency of repeat cov-erage. It may be noted that present-day populardigital cameras have much in common with someof the sensors described above. Light is recordedon CCDs after passing through a lens system anda device for splitting light into its primary colours.The light levels in each spectral region are digi-tized, processed by a computer chip, and stored(some cameras use removable disks) for immedi-ate display on the camera screen or for download-ing to a computer for processing to yield an imagethat can be reproduced on a printer connected to acomputer. Alternatively, commercial processing fa-cilities can produce high-quality pictures from theimages recorded by the camera that are saved onits disk.
A summary description of some current ma-jor imaging Earth observation satellites available isgiven in Table 9.1. Major specifications of IRS se-ries of Indian remote sensing satellites are given inTable 9.2.

P1: SFK/UKS P2: SFK
c09 BLBK276-Gupta August 28, 2010 15:35 Trim: 246mm X 189mm Printer Name: Yet to Come
REMOTE SENSING AND GIS IN HYDROLOGY 279
Table 9.1 Salient features of currently available major imaging Earth observation satellites∗. After Navalgund et al. (2007).
Country/organization Satellite Major sensors Description (Spatial resolution, spectral bands)
USA/NASA Terra ASTER 15 m (VNIR), 30 m (SWIR), 90 m (TIR)’ 14 XS (VNIR,SWIR, TIR)
Terra/AquaNMP EO-1
MODISALI
250–1000 m, 36 bands (VIS–TIR)10 m (Pan), 30 m (VNIR/SWIR)’ Pan and 9 XS(VNIR/SWIR)
Hyperion 30 m, 220 band, hyper spectral
USA/USGS Landsat-7 ETM+ 15 m (Pan), 30 m (Vis-SWIR), 60 m (TIR), Pan and 8 XS(VIS-TIR)
EU/ESA Envisat ASARMERIS
C Band, multi-polarization, multi-imaging mode SAR260–1200 m, 15 bands (VNIR)
Canada/CSA Radarsat-1 SAR C-Band SAR, HH polarization and multi-imagingmodes
France/CNES SPOT-5 HRGHRSVEGETATION
2, 5 m (Pan), 10 m (MS)’ Pan + 4 XS (VNIR/SWIR)High resolution (10 m, Pan) stereo 1.15 km,3 XS(VNIR/SWIR)
China/CAST CBERS-2 CCDIR-MSSWFI
20 m, Pan + 4 XS (VNIR)78 m (VNIR/SWIR), 156 m (TIR), 4 XS (Vis-TIR)258 m, 2 XS (VNIR)
Japan/JAXA ALOS AVNIR-2PALSARPRISM
10 m, 4 XS (VNIR)Multi-imaging mode L band radar2.5 m panchromatic
∗ For detailed list, reference is made to CEOS (2005).VNIR – visible and near infrared; SWIR – short-wave length infrared; TIR – thermal infrared; XS – multispectral bands.
9.2 Approaches to data/image interpretation
The ability to extract information from the data andinterpret it depends not only on the capability ofthe sensor used but on how the data are processedto convert the raw data into images improving itfor further analysis and applications.
As already mentioned, individual spectral signa-tures of different surface materials (or of classesof materials) enable their identification, as shownin Fig. 9.5a. Most sensors mounted on spacecraftdivide the spectral response of ground scene intointervals or bands. Each band contains wavelength-dependent input that varies in intensity. The spec-tral measurements in each band characterise the in-teractions between the incident radiation and theatomic and molecular structures of the materialspresent on the ground. The measurements also re-flect on the nature of the response of the detector
system employed in the sensor. Two additional fea-tures, namely shape (geometric patterns) and useor context (sometimes including geographical lo-cations), aid in distinguishing the various classes,even when the same material is being observed.Thus, one may assign a feature composed of con-crete to the class ‘street’ or ‘parking lot’, depend-ing on whether its shape is long and narrow orsquare/rectangular. Two features that have nearlyidentical spectral signatures for vegetation, couldbe assigned to the class ‘forest’ and ‘crop’, depend-ing on whether the area in the images has irregularor straight (often rectangular, which is the casefor most agricultural farms) boundaries. The taskof any remote sensing system is to detect radiationsignals, determine their spectral character, deriveappropriate signatures, and compare the spatialpositions of the classes they represent. This ulti-mately leads to some type of interpretable display

P1: SFK/UKS P2: SFK
c09 BLBK276-Gupta August 28, 2010 15:35 Trim: 246mm X 189mm Printer Name: Yet to Come
280 MODERN HYDROLOGY AND SUSTAINABLE WATER DEVELOPMENT
Table 9.2 Salient features of IRS series of Indian remote sensing satellites. After Navalgund et al. (2007).
Satellites(year) Sensor Spectral bands (µm)
Spatial res.(m)
Swath(km)
Radio-metricRes. (bits)
RepeatCycle(days)
IRS-1A/1B(1988, 1991)
LISS I 0.45–0.52 (B) 0.52–0.59 (G)0.62–0.68 (R) 0.77–0.86 (NIR)
72.5 148 7 22
LISS-II Same as LISS-I 36.25 74 7 22IRS-P2 (1994) LISS-II Same as LISS-I 36.25 74 7 24IRS-1C/1D(1995, 1997)
LISS-III 0.52–0.59 (G) 0.62–0.68 (R)0.77–0.86 (NIR)
23.5 141 7 24
1.55–1.70 (SWIR) 70.5 (SWIR) 148 7 24
WiFS 0.62–0.68 (R) 0.77–0.86 (NIR) 188 810 7 24(5)PAN 0.50–0.75 5.8 70 6 24 (5)
IRS-P3 (1996) MOS-A 0.755–0.768 (4 bands) 1570 × 1400 195 16 24MOS-B 0.408–1.010 (13 bands) 520 × 520 200 16 24MOS-C 1.6 (1 band) 520 × 640 192 16 24WiFS 0.62–0.68 (R) 0.77–0.86 (NIR)
1.55–1.70 (SWIR)188 810 7 5
IRS-P4 (1999) OCM 0.402–0.885 (8 bands) 360 × 236 1420 12 2MSMR 6.6, 10.65, 18, 21 GHz (V & H) 150, 75, 50
and 50 km1360 – 2
IRS-P6 (2003) LISS-IV 0.52–0.59(G) 0.62–0.68(R)0.77–0.86 (NIR)
5.8 70 10(7) 24(5)
LISS-III 0.52–0.59 (G) 0.62–0.68 (R)0.77–0.86 (NIR) 0.77–0.86(NIR)
23.5 141 7 24
AWiFS 0.52–0.59 (G) 0.62–0.68 (R)0.77–0.86 (NIR) 0.77–0.86(NIR)
56 737 10 24(5)
IRS-P5(Cartosat-1)(2007)
PAN Fore(+26◦) &Aft (−5◦)
0.50–0.85 2.5 30 10 5
Cartosat-2(2007)
PAN 0.50–0.85 0.8 9.6 10 5
product, be it an image, map, or a numericaldataset, that reflects the reality of the surface interms of nature and distribution of features presentin the field of view.
Radiances (from the ground and interveningatmosphere) measured by various sensors, fromhand-held digital cameras to distant orbiting satel-lites, vary in intensity. Thus reflected light at somewavelength or span of wavelengths (spectral re-gion) can range in its intensity from very low value(dark portions in an image) to very bright (lighttoned). Each level of radiance can be assigned a
quantitative value (commonly as a fraction of unityor as a percentage of the total radiance that canbe handled by the range of the sensor employed).The values are converted to digital numbers (DNs)that consist of equal increments over the range. Togenerate an image, a DN is assigned some level of‘grey’ (from all black to all white and shades of greyin between). When the pixel array acquired by thesensor is processed to show each pixel in its properrelative position and then the DN for the pixel isgiven a grey tone, a standard black and white imageresults.
P1: SFK/UKS P2: SFK
c09 BLBK276-Gupta August 28, 2010 15:35 Trim: 246mm X 189mm Printer Name: Yet to Come
REMOTE SENSING AND GIS IN HYDROLOGY 281
Another vital parameter in most remote sens-ing images is colour. While variations in black andwhite imagery can be very informative and was thenorm in the earlier aerial photographs, the num-ber of different grey tones that the human eye canresolve is limited to about 20–30 steps (out of amaximum of ∼250) on a contrasting scale. On theother hand, the human eye can distinguish 20 000or more colour tints, so we can discern small but of-ten important variations within the target materialsor classes. Any three bands (each covering a spec-tral range or interval) from a multispectral set canbe combined using optical display devices, photo-graphic methods, or computer-generated imageryto produce a colour composite (simple colour ver-sion in natural colours, or quasi-natural or falsecolours).
New kinds of images can also be produced bymaking special datasets using computer processingprograms. For example, one can divide the DNs ofone band by those of another at each correspond-ing pixel site. This produces a band ratio image.
An important application of remote sensing datais in classifying the various features in a scene (usu-ally presented as an image) into meaningful cate-gories or classes. The image then becomes a the-matic map (the theme is selectable, e.g. land use,geology, vegetation type, rainfall, etc.).
Another topic that is integral to effective inter-pretation and classification is commonly known asground truth. This includes the study of maps anddatabases, test sites, field and laboratory measure-ments, and most importantly actual onsite visits tothe areas being studied by remote sensing. The lastof these has two main aspects: (i) to identify groundfeatures in terms of their classes or materials so asto set up procedures for classification; and (ii) to re-visit parts of a classified image area to establish theaccuracy of identification in places that have notbeen visited for verification of ground situation.
9.2.1 Pattern recognition
Pattern Recognition (PR), also referred to as Ma-chine Learning or Data Mining, uses spectral, spa-tial, contextual, or acoustic inputs to extract spe-cific information from visual or sonic data sets. Itinvolves techniques for classifying a set of objects
into a number of distinct classes by consideringsimilarities between objects belonging to the sameclass and the dissimilarities of objects belonging todifferent classes. A common example is the OpticalCharacter Recognition (OCR) technique that readsa pattern of straight lines of different thicknessescalled the bar code. An optical scanner reads theset of lines and searches a database for the exactmatching pattern. A computer program comparespatterns, locates it, and ties it into a database thatcontains information relevant to this specific pat-tern (e.g. in a grocery store, this would be the barcode that is printed on a package to show the cur-rent price of a product on display).
Pattern recognition has a definite role in remotesensing, particularly because of its effectiveness ingeospatial analysis. It also plays an important rolein Geographic Information Systems (GIS).
9.3 Radar and microwave remote sensing
9.3.1 Radar
Electromagnetic radiation at long wavelengths(0.1–30 cm) falls into the microwave region.Remote sensing employs passive microwaves,which are emitted by thermally activated bodies.But, in more common use is RADAR (acronymfor Radio Detection and Ranging), an active(transmitter-produced) microwave system thatsends out electromagnetic radiation, part of whichis reflected back to the receiver. A radar system isa ranging device that measures distance as a func-tion of round trip travel time (at the speed of light)of a directed beam of pulses (the signal whosestrength is measured in decibels, dB) spreadingout over specific distances. In this way, radardetermines the direction and distance from the in-strument (fixed or moving) to an energy-scatteringobject. We can also derive information about targetshapes and certain diagnostic physical propertiesof materials at and just below the surface or fromwithin the atmosphere by analysing modificationsproduced by the target in the back-scattered signal.The varying signal, which changes with the posi-tion and shape of a target body and is influenced bytheir properties, can be used to form images that

P1: SFK/UKS P2: SFK
c09 BLBK276-Gupta August 28, 2010 15:35 Trim: 246mm X 189mm Printer Name: Yet to Come
282 MODERN HYDROLOGY AND SUSTAINABLE WATER DEVELOPMENT
Table 9.3 Bands in the microwave region of the EMSpectrum.
Band Frequency (MHz) Wavelength (cm)
Ka 40 000–26 000 0.8–1.1K 26 500–18 500 1.1–1.7X 12 500–8000 2.4–3.8C 8000–4000 3.8–7.5L 2000–1000 15.0–30.0P 1000– 300 30.0–100.0
Source: http://rst.gsfc.nasa.gov/Sect8/Sect8 1.htmlaccessed on 18th Nov. 2008.
superficially resemble those recorded by imagingsensors. Commonly used frequencies and theircorresponding wavelengths are specified by thenomenclature, as given in Table 9.3.
Radar has become increasingly important invarious applications of remote sensing. Several op-erational satellites have radar as the principal sen-sor. By providing its own signal, a radar can func-tion round the clock and, for some wavelengths,without significant interference from adverse at-mospheric conditions (e.g. clouds). The most famil-iar civilian application of radar is in meteorology,mainly for tracking of storms, rainfall, and advanc-ing weather fronts.
The ability of radar to mirror ground surfaces fordisplaying topography is its prime use for a varietyof remote sensing applications. Some radars oper-ate on moving platforms, others are fixed on theground.
Each pulse emanating from a radar transmitterlasts only for a few microseconds (typically thereare ∼1500 pulses per second). The spatial resolu-tion of a radar system is proportional to the lengthof its antenna, which for a Side Looking AirborneRadar (SLAR) is 5–6 m long and usually shaped asa section of a cylinder wall. To increase its effectivelength, and hence resolution, an electronic ‘trick’of integrating the pulse echoes into a composite sig-nal is performed in the Synthetic Aperture Radar(SAR) systems. These systems are associated withmoving platforms. SAR utilizes both recording andprocessing techniques to generate a signal that actsas though it has an ‘apparent’ length greater thanthe antenna itself.
Another type of radar system is exclusive toconditions under which there is relative motionbetween the platform and the target. This sys-tem depends on the Doppler effect (apparentfrequency shift due to relative motion betweenthe target and the vehicle on which radar ismounted) that determines its azimuthal resolu-tion. The Doppler shift occurs when a target ismoving towards the observer and emits a signalsuch as sound; the frequency of the signal con-tinues to increase as the target moves closer –the pitch of sound increases, whereas movementof the target away from the observer lowers itsfrequency.
Radar image tones may also vary in yet an-other systematic way that can be manipulated/controlled. When a pulse of photon energy leavesthe transmitter, its electrical field vector can bemade to vibrate in either a horizontal (H) or a verti-cal (V) direction, depending on its antenna design.There is no change of polarization in the reflectedpulses, that is, they have the same direction of elec-tric field vibration as in the transmitted pulse. Thus,we get either an HH or VV polarization pairingof the transmitted and returned signals. However,upon striking the target, the pulses can undergodepolarization to some extent so that reflectionsoccur with different directions of vibration. A sec-ond antenna picks up the cross-polarization thatis orthogonal to the transmitted direction, leadingto either a VH or HV mode (the first letter refersto the transmitted signal and the second to the re-flected signal). Some ground features appear nearlythe same in either parallel or cross-polarized im-ages. But vegetation, in particular, tends to showdifferent degrees of image brightness in HV or VHmodes, because of depolarization by multiple re-flecting surfaces, such as branches and leaf coverof vegetation.
There are some other factors that contribute tothe brightness or intensity of the returned signal.Two material properties provide clues about com-position and surface condition from the manner inwhich these attributes interact with the incomingpulses. One of these properties is the dielectric con-stant. Radar waves penetrate deeper into materialswith low dielectric constant and reflect more ef-ficiently from those with high dielectric constant.

P1: SFK/UKS P2: SFK
c09 BLBK276-Gupta August 28, 2010 15:35 Trim: 246mm X 189mm Printer Name: Yet to Come
REMOTE SENSING AND GIS IN HYDROLOGY 283
Values of dielectric constant range from 3 to 16for most dry rocks and soils and up to 80 for waterwith impurities. Moist soils have values typically be-tween 30 and 60. Thus, variation in reflected pulseintensities may indicate differences in soil moisturecontent, other factors being constant. Variations ofthe dielectric constant amongst rocks are generallytoo small to distinguish most types by this propertyalone.
The second property of materials is their sur-face roughness. Materials differ from one anotherin their natural or artificially altered state of sur-face roughness. Roughness, in this sense, refers tominute irregularities that relate either to texturesof the surfaces or due to the presence of objectson them (such as closely-spaced vegetation thatmay have a variety of shapes). Examples includethe surface character of pitted materials, granularsoils, gravel, grass blades, and other covering ob-jects whose surfaces have dimensional variabilityof the order of a couple of millimetres to a fewcentimetres. The vertical extent of an irregularity,together with radar wavelength and grazing angleat the point of contact, determines the behaviour ofa surface as smooth (causing specular reflection),or intermediate or rough (diffuse reflection). Toquantify the effect of different wave bands, a sur-face with a given small irregularity height (in cm)reflects Ka band (λ = 0.85 cm), X band (λ = 3 cm),and L band (λ = 25 cm) radar waves as if it werea smooth, intermediate, and rough surface, respec-tively. This situation means that radar, broadcastingthree bands simultaneously in a quasi-multispectralmode, can produce colour composites if a colouris assigned to each band. Patterns of relative inten-sities (grey levels) for images made from differentbands may serve as diagnostic tonal signatures fordiverse materials whose surfaces show contrast intheir roughness.
Radar wavelengths also influence penetrabilitybelow target tops to ground surfaces. Depth ofpenetration increases with wavelength, λ. L andP band radar penetrate deeper than K or X bands.In forests, shorter wavelengths, such as the C band,reflect mainly from the leaves on the canopy topsthat are encountered first. At longer wavelengths,most tree leaves are too small to have significantinfluence on backscatter, although branches do in-
teract so that canopies can be penetrated to varyingdegrees.
Another active sensor system, similar in somerespects to radar, is LIDAR (light detection andranging). A Lidar transmits coherent laser light, atvarious visible or NIR (Near-IR) wavelengths, as aseries of pulses (at the rate of a few hundreds persecond) to the surface, from which some of thelight is reflected. In this sense it is similar to radar.Round-trip travel times are measured. Lidars canbe operated around the clock as profilers and asscanners. Lidar serves either as a ranging device todetermine altitudes (topographic mapping), depths(in water bodies), or as a particle analyser (in the at-mosphere). Light penetrates certain targets so thatone of its prime uses is to assess condition of treecanopies.
9.3.2 Microwaves
Although active microwave systems, for exampleradar, are the more commonly used sensors, pas-sive microwave sensors, both air- and space-borne,are also used. These directly measure the radiationemitted by thermal states of the Earth’s surface,oceans, and atmosphere and hence are representa-tive of natural phenomena innate to the materials(hence called passive).
The underlying principle is that emission of radi-ation from bodies depends on their temperatureand at longer wavelengths extends into the mi-crowave region. Though much weaker in intensitycompared to shorter wavelengths, microwave radi-ation is still detectable by sensitive instruments andis not significantly attenuated by the Earth’s atmo-sphere. The temperature measured by these instru-ments is brightness temperature, which is differentfor land areas, water, air, and ice, thus enablingtheir identification.
The wavelength region employed in passive mi-crowave detectors is generally between 0.15 and30 cm, equivalent to the frequency range between1 and 200 GHz. Commonly used frequencies arecentred on 1, 4, 6, 10, 18, 21, 37, 55, 90, 157, and183 GHz (thus the multispectral mode is feasible)but the signal beam width is usually kept large inorder to gather a sufficient amount of the weakradiation. The spatial resolution of the instrument

P1: SFK/UKS P2: SFK
c09 BLBK276-Gupta August 28, 2010 15:35 Trim: 246mm X 189mm Printer Name: Yet to Come
284 MODERN HYDROLOGY AND SUSTAINABLE WATER DEVELOPMENT
also tends to be low (commonly in kilometres fromspace-borne and in metres from aircraft-mountedsensors), enabling the sensor to cover large sam-pling areas that provide enough radiation for readydetection. The sensors are typically radiometersthat require large collection antennas (fixed or mov-able). On moving platforms, the fixed antenna op-erates along a single linear track so that it generatesintensity profiles rather than images. Scanning ra-diometers differ by having the antenna move later-ally to produce multiple tracking lines. The resultcan be a swath in which variations in intensity,when converted to photographic grey levels, yieldimages that resemble those formed in visible, near-IR, and thermal-IR regions.
On land, passive microwave surveys are partic-ularly effective for detecting soil moisture, andtemperature, because of sensitivity to the pres-ence of water. Microwave radiation from thin soilcover (overburden) is contributed by near-surfacebedrock geology. Assessing snowmelt conditions isanother use of microwaves. Tracking distributionand conditions of sea ice is a prime oceanographicapplication. Yet another use is for assessing sea sur-face temperature. Passive microwave sensors areone of the important instruments on some meteo-rological satellites, being well suited to obtain wa-ter vapour and temperature profiles through theatmosphere, as well as ozone distribution, and pre-cipitation conditions.
9.3.3 Gravity monitoring from space
Large regional scale changes in the Earth’s gravita-tional field due to movement of water on or underthe surface are being monitored from space using acoupled satellite system GRACE (Gravity Recoveryand Climate Experiment). The two satellites of theGRACE mission were launched in 2002 and orbitthe Earth 220 km apart and measure subtle varia-tions in the gravitational pull by using microwavesto precisely gauge the changing distance betweenthe two spacecrafts. As the lead spacecraft passesover a patch of anomalously strong/weak gravityfield, it accelerates/decelerates ahead of the trailingspacecraft. Once past the anomaly, the lead satel-lite slows down/recovers speed. Then the trailingspacecraft accelerates/decelerates and again closes
on/trails the lead spacecraft. The changing distancebetween the two spacecrafts is a measure of thegravity anomaly. By making repeated passes overthe same spot, GRACE measures changes in theEarth’s gravity, which are mainly due to the chang-ing load of water moving on or under the surface.GRACE has recorded shrinking of ice sheets, shift-ing ocean currents, desiccation of land surface dueto droughts, and draining of large lakes.
9.4 Geographic Information Systems (GIS)
Modern-day computers, with their enhanced datahandling capacity and powerful software, havegreatly changed the manner in which multiplemaps and other datasets can be merged, com-pared, and manipulated. This capability has led toemergence of a powerful new tool known as theGeographic Information System (GIS). Since its in-ception, GIS has blossomed into mainstream tech-nology for using maps that are novel and practicalin most applications focusing and relying on severalkinds of geographic data. As remote sensing hasroutinely provided new images of the Earth’s sur-face, it has become intertwined with GIS as a meansto constantly update some of the GIS data (i.e. landuse and land cover) in a cost-effective manner.
The objective in any GIS operation is to assemblea database that contains all the parameters to ma-nipulate data through models and other decision-making procedures to yield a series of outputs tosolve the given problem (Fig. 9.9). As an example,if one could relate information on the rainfall ofa particular region to its aerial imagery, it mightbe possible to identify which wetlands dry up at acertain time of the year.
GIS uses information from multiple sources indifferent ways that can help in such analysis. Theprimary requirement for the source data consistsof knowing the locations corresponding to thevariables. Location may be denoted by x, y, andz coordinates of longitude, latitude, and eleva-tion, or by other geo-coding systems such as ZIPor PIN codes or by highway milestone markers(mile or km). Any variable that can be locatedspatially can be fed into a GIS. Several computerdatabases that are compatible with the format

P1: SFK/UKS P2: SFK
c09 BLBK276-Gupta August 28, 2010 15:35 Trim: 246mm X 189mm Printer Name: Yet to Come
REMOTE SENSING AND GIS IN HYDROLOGY 285
Fig. 9.9 Various aspects of data management through a typical Geographical Information System (GIS). Based onhttp://rst.gsfc.nasa.gov/Sect15/Sect15 4.html#anchor5681002 accessed on 18th Nov., 2008.
of GIS can be directly entered into it. Suchdatabases are being routinely produced by vari-ous governmental – as well as non-governmental –organizations. Different kinds of data in the formof maps can be entered into a GIS as input. Someinput data may already exist in digital form but onemust digitize data, which are mostly given in theform of maps and tables or other sources. Thiscan be done by scanning some of the maps orsatellite/aerial imagery, thus obtaining the result-ing products as digital inputs to individual pixelsthat are data cell equivalents. However, these val-ues must be recoded (called geocoding) if they areto be associated with any specific attributes. Al-though recent technology has automated this con-version process, in many instances maps are stillbeing digitized manually using a digitizing board ortablet. A GIS can also convert existing digital infor-mation, which may not be available in the form ofmaps or in a form it can recognize and use. Forexample, digital satellite images generated throughremote sensing can be analysed to produce a map-like layer of digital information about vegetativecover. Likewise, census hydrologic tabular data canbe converted to map-like form, serving as layers ofthematic information in a GIS.
9.4.1 Data representation
GIS data represents real-world objects (roads, landuse, elevation, etc.) in a digital form. Real-worldobjects/data can be divided into two abstractions:discrete objects (e.g. a house) and continuous fields(e.g. rainfall amount or elevation of a landform).There are two general methods, Raster and Vector,used for storing data in a GIS for abstractions.
9.4.1.1 Raster
A raster data type is, in essence, any type of digitalimage represented in grids (Fig. 9.10a), consistingof rows and columns of cells, with each cell storinga single value. Raster data can be images (raster im-ages) with each pixel (or cell) containing a colourvalue. Additional values recorded for each cell maybe a discrete value, such as land use; a continu-ous value, such as temperature; or a null value,if no data is available. While a raster cell storesa single value, it can be extended by using rasterbands to represent RGB (red, green, blue) colours,colour maps (mapping between a thematic codeand RGB value), or an extended attribute table witha given row having a unique value for each cell. The

P1: SFK/UKS P2: SFK
c09 BLBK276-Gupta August 28, 2010 15:35 Trim: 246mm X 189mm Printer Name: Yet to Come
286 MODERN HYDROLOGY AND SUSTAINABLE WATER DEVELOPMENT
Fig. 9.10 Two methods of representing data in GIS: (a) Raster representation; (b) Vector representation. The table alongsidecompares the two methods of data representation and also lists some salient features of each method. Based onhttp://www.vcrlter.virginia.edu/∼jhp7e/advgis/local/lectures/rastervsvector08.pdf?meid=51 accessed on 7th Nov. 2008.
resolution of the raster dataset is its cell width inunits of the area represented by each cell on theground.
Raster data is stored in various formats: from astandard file-based structure of TIF, JPEG, etc. tobinary large object (BLOB) data stored directly in arelational database management system (RDBMS)similar to other vector-based feature classes.Database storage, when properly indexed, typicallyallows for quick retrieval of the raster data but mayrequire storage of millions of large-sized records.
9.4.1.2 Vector
In a GIS, geographical features are often expressedas vectors, by considering those features as geo-metrical shapes (Fig. 9.10b). Different geographicalfeatures are expressed by different types of geom-etry:
� Points: Zero-dimensional points are used for geo-graphical features that can best be expressed by asingle point reference, for example, location of aplace/feature. These could be locations of wells,peak elevations, features of interest or trailheads,
etc. Points can also be used to represent areaswhen displayed on a smaller scale. For exam-ple, cities on a world map would be representedby points rather than polygons. However, pointsconvey least amount of information and no mea-surements are possible with point features.
� Lines or polylines: One-dimensional lines orpolylines are used for linear features such asrivers, roads, railroads, trails, and topographiclines. As in the case of point features, linear fea-tures displayed on a smaller scale are representedas line features rather than as a polygon. Line fea-tures can measure distance.
� Polygons: Two-dimensional polygons are usedto represent geographical features that cover aparticular area on the Earth’s surface. Such fea-tures include lakes, park boundaries, buildings,city boundaries, or land uses. Polygons conveythe maximum amount of information on the filetypes. For example, by means of polygons, onecan measure perimeter and area.
Each of these geometries is linked to a row ina database that describes their attributes. For ex-ample, a database that describes lakes may contain

P1: SFK/UKS P2: SFK
c09 BLBK276-Gupta August 28, 2010 15:35 Trim: 246mm X 189mm Printer Name: Yet to Come
REMOTE SENSING AND GIS IN HYDROLOGY 287
its depth, water quality, and pollution level. Thisinformation can be used to make a map to describea particular attribute of the dataset. For example,lake waters could become coloured depending onthe level of pollution. Different geometries can alsobe compared. For example, GIS could be used toidentify the wells (point geometry) that are locatedwithin a given distance (say 1 km) of a lake (poly-gon geometry) that has a high level of pollution.
Vector features can be made to conform to spatialintegrity through application of topological rules,such as ‘polygons must not overlap with eachother’. Vector data can also be used to representcontinuously varying phenomena. Contour linesand triangulated irregular networks (TIN) are usedto represent elevation or other continuously chang-ing values. TINs record values at point locations,which are connected by lines to form an irregularmesh of triangles. The faces of triangles representthe terrain boundaries.
9.4.1.3 Non-spatial data
Additional non-spatial data can also be stored alongwith the spatial data represented by co-ordinates ofvector geometry or position of a raster cell. In vec-tor data, additional data contains attributes of thefeature. For example, a forest inventory polygonmay also have an identifier value and informationabout tree species. In raster data, the cell value canstore attribute information and can also be used asan identifier that can relate to records presented inanother table.
9.4.1.4 Raster-to-vector translation
Data restructuring can be performed by a GIS toconvert data into different formats. For example, aGIS may be used to convert a satellite image mapinto a vector structure by generating lines aroundall cells with the same classification, while deter-mining the spatial relationships between differentcells, such as adjacency or inclusion.
9.4.1.5 Map overlay
A combination of several spatial data sets (points,lines, or polygons) creates a new output vectordataset, similar in appearance to stacking togetherseveral maps of the same region. A union overlay
combines the geographic features and attribute ta-bles of both the inputs into a single new output.An intersect overlay defines the area where bothinputs overlap and retains a set of attribute fieldsfor each input. A symmetric difference overlay de-fines an output area that includes the total area ofboth inputs except for the overlapping area.
Data extraction is a GIS process similar to vec-tor overlay, though it can be used in either vectoror raster data analysis. Rather than combining theproperties and features of both datasets, data ex-traction involves using a ‘clip’ or ‘mask’ to extractthe features of one dataset that falls within the spa-tial domain of another dataset.
9.4.1.6 Graphical display techniques
Traditional maps are abstractions of the real world,a sampling of important elements displayed on asheet of paper with symbols to represent physicalobjects. The symbols must be interpreted appro-priately by the user of the map. Topographic mapsshow the shape of land surface with contour linesor with shaded relief.
Today, graphical display techniques, such asshading based on altitude in a GIS, can make rela-tionships amongst map elements visible, enhancingone’s ability to extract and analyse information.
9.4.1.7 GIS software
Geographic information can be accessed, trans-ferred, transformed, overlaid, processed, and dis-played using numerous software applications. In-dustry leaders in this field are companies suchas Smallworld, Manifold System, ESRI, Intergraph,Mapinfo, and Autodesk, offering an entire suite oftools for GIS applications. Although free tools existto view GIS datasets, public access to geographicinformation is limited by availability of online re-sources such as Google Earth and interactive webmapping.
9.4.1.8 Global Positioning System
The Global Positioning System (GPS) is a relativelyrecent technology, which provides unmatchedaccuracy and flexibility of positioning for naviga-tion, surveying, and GIS data capture. The GPS
P1: SFK/UKS P2: SFK
c09 BLBK276-Gupta August 28, 2010 15:35 Trim: 246mm X 189mm Printer Name: Yet to Come
288 MODERN HYDROLOGY AND SUSTAINABLE WATER DEVELOPMENT
provides continuous three-dimensional positioninground the clock throughout the world. The tech-nology seems to benefit the GPS user communityin terms of obtaining accurate data up to spa-tial resolution of about 100 metres for navigation,metre-level for mapping, and up to millimetre levelfor geodetic positioning. The GPS technology hastremendous applications in GIS data collection, sur-veying, and mapping.
The GPS uses satellites and computers to com-pute positions anywhere on the Earth’s surface. Itis based on satellite ranging, which means that theposition on the Earth is determined by measuringthe distance from a group of satellites in space.The basic principle underlying GPS is simple, eventhough the system employs some of the most high-tech equipment ever developed.
To compute positions in three dimensions, oneneeds to have four satellite measurements. The GPSuses a trigonometric approach to calculate posi-tions of objects/features on the Earth. The GPSsatellites are positioned quite high up, as a result ofwhich their orbits are quite predictable and each ofthe satellites is equipped with an accurate atomicclock.
9.5 Applications in hydrology
Both remote sensing and GIS are routinely usedin areas such as applied hydrology, forestry, land-use dynamics, etc. Capabilities of remote sensingtechnology in hydrology include measurement ofspatial, spectral, and temporal information and pro-viding data on the state of the Earth’s surface. Itprovides observations on changes in the hydrologicstate of various reservoirs, varying over both timeand space, that can be used to monitor prevailinghydrologic conditions and changes taking place inthem over time. Sensors used for hydrologic appli-cations cover a broad range of the electromagneticspectrum. Both active and passive sensors are used.Active sensors (i.e. radar, lidar, etc.) send a pulseand measure time taken by the return pulse. Pas-sive sensors measure emissions or reflectance fromnatural sources/surfaces, such as the Sun, thermalenergy emitted by the human body, etc. Sensorscan provide data on reflective, thermal, and dielec-tric properties of the Earth’s surface.
Since remote sensing techniques indirectly mea-sure hydrologic conditions using electromagneticwaves, these have to be related to hydrologic vari-ables either empirically or by employing transferfunctions.
Remote sensing applications in hydrology aremainly for:
� Estimation of precipitation� Runoff computation� Snow hydrology applications� Estimation of evapotranspiration over land sur-
face� Evaluation of soil moisture content� Water quality modelling� Groundwater source identification and estima-
tion� Hydrologic modelling
GIS can play a crucial role in the application ofspatially distributed data to hydrological models.In conventional applications, results either fromremote sensing or from GIS analyses serve as in-put to hydrologic models. Land use and snowcover are the most commonly used input variablesfor modelling. The integration of GIS, databasemanagement systems and hydrologic models facili-tates the use of remote sensing data in hydrologicapplications.
9.5.1 Precipitation estimation
For a field hydrologist, satellite rainfall estimationmethods are valuable when either few or no sur-face gauges are available for measuring rainfall(see also Section 2.5.1.3). However, direct mea-surement of rainfall from satellites for operationalpurposes has not been feasible as presence ofclouds prevents direct observation of precipitationby visible, near infrared, and thermal infrared sen-sors. However, improved analysis of rainfall canbe achieved by combining satellite and conven-tional rain gauge data. Useful data can be obtainedfrom satellites employed primarily for meteorolog-ical purposes, including polar orbiters such as theNational Oceanographic and Atmospheric Admin-istration (NOAA) series, the Defense Meteorolog-ical Satellite Program (DMSP), and geostationarysatellites such as Global Operational Environmental
P1: SFK/UKS P2: SFK
c09 BLBK276-Gupta August 28, 2010 15:35 Trim: 246mm X 189mm Printer Name: Yet to Come
REMOTE SENSING AND GIS IN HYDROLOGY 289
Satellite (GOES), Geosynchronous MeteorologicalSatellite (GMS), and Meteosat, but their images inthe visible and infrared bands can provide informa-tion only about the cloud top rather than cloud baseor interiors. However, since these satellites providefrequent observations (even at night with thermalsensors), the characteristics of potentially precip-itable clouds and rate of change in cloud area andshape can be observed. From these observations,estimates of rainfall can be made that relate cloudcharacteristics to instantaneous rainfall rates andcumulative rainfall over time.
Whereas the visible/infrared techniques pro-vide only indirect estimates of rainfall, microwavetechniques have great potential for measuringprecipitation because the measured microwaveradiation is directly related to the properties of rain-drops themselves. Microwave techniques estimaterainfall in two ways: by their emission/absorptionand scattering from the falling raindrops. Throughthe emission/absorption approach, rainfall is ob-served by the emission of thermal energy by rain-drops against a cold, uniform background. A num-ber of algorithms have been developed to estimateprecipitation over the ocean by this method (Kum-merow et al. 1989; Wilheit et al. 1977).
Using the scattering approach, the rainfall isobserved through enhanced scattering primarilycaused by frozen ice in clouds and not directly bythe rain. Thus rainfall rates must be established em-pirically or with cloud models, but this method isnot restricted to ocean background and may be theonly feasible approach for estimating rainfall overland employing microwave radiometry. Spenceret al. (1988) have shown that the DMSP SpecialSensor Microwave/Imager (SSM/I) data can iden-tify rainfall areas. Adler et al. (1993) have useda cloud-based model with 85 and 37 GHz SSM/Idata to estimate rainfall rates. It should be notedthat these approaches provide instantaneous rain-fall rates that are subsequently aggregated to yieldmonthly values.
9.5.2 Snow hydrology
Almost all regions of the electromagnetic spectrumprovide useful information about snow packs. De-pending on the need, one may like to know theareal extent of the snow, its water equivalent, its
‘condition’ or grain size, density, and presence ofliquid water. Although no single region of the elec-tromagnetic spectrum yields all these properties,techniques have been developed to estimate theseto a certain degree (Rango 1993).
The water equivalent of snow can be measuredfrom a low elevation aircraft carrying sensitivegamma radiation detectors (Carroll and Vadnais1980). This approach is limited to low flying air-crafts (altitudes ∼150 m), because the atmosphereattenuates a significant fraction of the gammaradiation.
Snow can be identified and mapped with the vis-ible bands of satellite imagery, because of its highreflectance in comparison to non-snow covered ar-eas. But at longer wavelengths, that is, in the nearinfrared region, the contrast between snow cov-ered and non-snow covered areas is considerablyreduced. However, the contrast between cloudsand snow is higher in the infrared imagery, whichserves as a useful discriminator between clouds andsnow (Dozier 1984). Thermal data can also be use-ful in identifying snow/no-snow boundaries and dis-criminating between cloud and snow.
Use of satellite data for snow cover mapping hasbecome operational in several regions of the world.Currently, NOAA has developed snow cover mapsfor about 3000 river basins in North America, ofwhich approximately 300 are mapped according toelevation for use in stream flow forecasting (Carroll1990). NOAA has also produced regional and globalmaps of mean monthly snow cover (Dewey andHeim 1981).
Microwave remote sensing data can provide in-formation on snow pack properties that are of ut-most interest to hydrologists, for example, area un-der snow cover, snow water equivalent (or depth),and presence of liquid water in a snow pack that sig-nals the onset of its melting (Kunzi et al. 1982). Analgorithm for estimating snow water equivalent fordry snow using satellite microwave data (ScanningMultichannel Microwave Radiometer (SMMR andSSM/I) has been developed by Chang et al. (1982).The depth and global extent of snow cover wasmapped by Chang et al. (1987). Passive microwavesystems are limited by their interaction with othermedia, such as forest areas, although a method tocorrect for the absorption of the snow signal byforest cover has also been developed (Chang et al.

P1: SFK/UKS P2: SFK
c09 BLBK276-Gupta August 28, 2010 15:35 Trim: 246mm X 189mm Printer Name: Yet to Come
290 MODERN HYDROLOGY AND SUSTAINABLE WATER DEVELOPMENT
1990). The spatial resolution achievable by the pas-sive satellite systems is also a limitation, but Rangoet al. (1989) have shown that reasonable snow wa-ter equivalent estimates can be made on basins withan area smaller than 10 000 km2.
Aircraft SAR measurements have shown that SARcan discriminate between snow and glaciers fromother targets and also discriminate between wetand dry snow (Shi and Dozier 1992; Shi et al. 1994).
A number of models have been developed touse remote sensing data for predicting snowmeltrunoff (Dillard and Orwig 1979; Hannaford andHall 1980). NASA specifically developed (Martinecet al. 1983) the Snowmelt Runoff Model (SRM) foruse in remote sensing of snow cover by taking theelevation zone as the primary input variable. SRMhas been extensively tested on basins of differentsizes in various regions of the world (Rango 1992;WMO 1992).
9.5.3 Soil moisture
Knowledge of soil moisture has many applicationsin hydrology, primarily in evaporation and runoffmodelling. Studies have shown that soil moisturecan be measured by a variety of remote sens-ing techniques. However, only microwave tech-nology has demonstrated a quantitative ability tomeasure soil moisture under a variety of topo-graphic and vegetation cover conditions (Engman1990). Available passive systems do not have theoptimum wavelengths for soil moisture research.But it seems that in areas with sparse vegetationcover, a reasonable estimate of soil moisture canbe obtained (Owe et al. 1988). Experimental pas-sive microwave systems using aperture synthesissuch as the Electronically Steered Thinned ArrayRadiometer (ESTAR) hold promise for high resolu-tion satellite systems. The airborne ESTAR has beendemonstrated in the Walnut Gulch watershed inArizona (Jackson 1993). The SAR systems offer per-haps the best opportunity to measure soil moistureroutinely. Change detection techniques have beenused to detect changes in soil moisture in a basinin Alaska (Villasenor et al. 1993). However, Merotet al. (1994) have shown that radar data becomesambiguous when ponding of water occurs in vari-able source areas.
9.5.4 Evapotranspiration
In general, remote sensing techniques cannot mea-sure evaporation or evapotranspiration (ET) di-rectly. However, two potentially important rolesof remote sensing in estimating evapotranspirationare: (i) extending point measurements or empiri-cal relationships, such as the Thornthwaite (1948),Penman (1948), and Jensen and Haise (1963) meth-ods, to much larger areas, including the areas whereexperimental meteorological data may be sparse;and (ii) measurement of variables in the energyand moisture balance models of ET. Some progresshas also been made in direct remote sensing of theatmospheric parameters that affect evapotranspira-tion using Light Detection and Ranging (LIDAR) –which essentially is a ground-based technique.
Extrapolation of point ET measurements to aregional scale can be achieved by using thermalmapping data. Gash (1987) proposed an analyticalframework for relating location specific changes inevaporation to corresponding changes in surfacetemperature. These concepts were used for an agri-cultural area under clear sky conditions by Kustaset al. (1990). Humes et al. (1994) proposed a sim-ple model using remotely sensed surface temper-atures and reflectances for extrapolating energyfluxes from a point measurement to a regionalscale. However, other than for clear sky conditions,variations in incoming solar radiation, meteorolog-ical conditions, and surface roughness limit the ap-plicability of this approach.
One formulation of potential ET that lends it-self to suitability for remote sensing inputs wasdeveloped by Priestly and Taylor (1972) and wasused for estimating ET with satellite data by Kane-masu et al. (1977). Barton (1978) used airborne mi-crowave radiometers to remotely sense soil mois-ture in his study of evaporation from bare soils andgrasslands. Soares et al. (1988) demonstrated howthermal infrared and C-band radar could be usedto estimate bare soil evaporation. Choudhury etal. (1994) have shown a strong relationship be-tween evaporation coefficients and vegetative in-dices. Another approach is to develop numericalmodels that simulate the heat content and waterbalance in the soil in relation to the energy balanceat the surface (Camillo et al. 1983; Taconet et al.

P1: SFK/UKS P2: SFK
c09 BLBK276-Gupta August 28, 2010 15:35 Trim: 246mm X 189mm Printer Name: Yet to Come
REMOTE SENSING AND GIS IN HYDROLOGY 291
1986). Taconet and Vidal-Madjar (1988) used thisapproach with Advanced Very High Resolution Ra-diometer (AVHRR) and Meteosat data.
9.5.5 Runoff and hydrologic modelling
Runoff cannot be directly measured by remote sens-ing techniques. However, remote sensing can beused in hydrologic and runoff modelling in twogeneral ways: (i) for determining watershed geom-etry, drainage network, and other map-type infor-mation for distributed hydrologic models and forestimation of empirical flood peak, annual runoff,or for formulating low flow equations; and (ii) forproviding input data such as soil moisture or delin-eating land-use classes that are used to define runoffcoefficients.
In many regions of the world, remotely senseddata is the only source of good cartographicinformation. Drainage basin areas and the streamnetwork are easily obtained from good qualitysatellite imagery. There have also been a numberof studies to extract quantitative geomorphicinformation from Landsat imagery (Haralick et al.1985). Remote sensing can also provide quanti-tative topographic information with appropriatespatial resolution, which is extremely valuablefor model inputs. Digital Elevation Model (DEM)with high horizontal and vertical resolution ap-proaching 5 m is possible. A new technology usingSAR interferometer has been used to demonstratesimilar horizontal resolutions with approximately2 m vertical resolution (Zebker et al. 1992).
Quick estimate of peak flow when very little in-formation is available is often made using empiri-cal flood routing formulae. Applicability of theseequations is generally limited to the basin andthe climatic/hydrologic region of the world forwhich these were developed. Most such empiricalflood routing formulae relate peak discharge to thedrainage area of the basin (UN 1955). Landsat datahave been used to improve empirical regressionequations of various runoff characteristics. For ex-ample, Allord and Scarpace (1981) showed how theaddition of Landsat-derived land cover data can im-prove regression equations based on topographicmaps alone.
Most of the work on adapting remote sensingdata to hydrologic modelling has involved the SoilConservation Service (SCS) runoff curve numbermodel (USDA 1972), for which remote sensingdata are used as a substitute for land cover mapsobtained by conventional means (Bondelid et al.1982; Jackson et al. 1977).
The pixel format of digital remote sensing datamakes it ideal for merging with GIS. Remote sens-ing can be incorporated into a system in a va-riety of ways: as a measure of land use andimpervious surfaces, for providing initial condi-tions for flood forecasting, and for monitoringflooded areas (Neumann et al. 1990). Kite andKouwen (1992) showed that Landsat-derived semi-distributed model at a sub-basin scale performs bet-ter than a lumped model. The GIS allows for com-bining of other spatial data forms such as topogra-phy, soils maps, etc. with hydrologic variables suchas rainfall or soil moisture distribution. Fortin andBernier (1991) proposed combining SPOT DEMdata with satellite-derived land use and soil map-ping data to define Homogeneous Hydrologic Units(HHU) in HYDROTEL. Ott et al. (1991) and Schultz(1993) defined Hydrologically Similar Units (HSU)by combining DEM data, soils maps, and satellite-derived land use in a study of the impact of landuse changes on the Mosel River Basin. They alsoused satellite data to determine a Normalized Dif-ference Vegetation Index (NDVI) and a leaf WaterContent Index (WCI), which are combined to de-lineate areas where a subsurface source of water isavailable for growth of vegetation. Mauser (1991)showed how multi-temporal SPOT and TM data canbe used to derive plant parameters for estimatingET in a GIS-based model.
9.5.6 Groundwater hydrology
As groundwater is subterranean, most remote sens-ing techniques, with the exception of airborne geo-physics and radar, are incapable of penetrating be-yond the uppermost layer of the Earth’s surface.But the synergy between satellite imagery and air-borne geophysical data can be advantageous in theearly stages of groundwater exploration and alsofor groundwater modelling.

P1: SFK/UKS P2: SFK
c09 BLBK276-Gupta August 28, 2010 15:35 Trim: 246mm X 189mm Printer Name: Yet to Come
292 MODERN HYDROLOGY AND SUSTAINABLE WATER DEVELOPMENT
Long-wave radar can under suitable conditions(e.g. for coarse-grained deposits, dry vadose zonewithout vegetation, and with some a priori knowl-edge of the geology) detect groundwater at depthsof a few metres and other subsurface features, suchas buried channels (McCauley et al. 1982). Radarimagery has its use in hydrogeology for interpre-tation of geological structures (Drury 1993; Koop-mans 1983). On the other hand, thermal imageryinvolves long-wave radiation emitted from the sur-face and its use largely pertains to detect tempera-ture anomalies in surface water bodies. The surfacefeatures contained in the imagery of the reflectedshorter wavelengths relate to the surface expres-sion of geological and geomorphological featuresand land cover, yielding indirect hydrogeologicalinformation.
Groundwater exploration using photo-geologyhas been a major field of interest in the past andis still being done in areas inadequately coveredby geological maps. Visual interpretation shouldmake use of imagery that optimally displays the ter-rain information. To achieve this, the colour andintensity information of the multispectral data canbe manipulated by image processing techniques.However, its interpretation needs experience andfamiliarity with the terrain. Image interpretation isthe most important aspect of remote sensing stud-ies of groundwater. In certain cases, the imagerycontains features that have a direct link with thegroundwater flow. The appearance of groundwa-ter at or near the surface is caused by either the in-tersection of topographic depressions (blow-outs,silicate, karst depressions, back swamps, etc.) andthe static phreatic groundwater level or the dis-charge zone of a groundwater flow system. In thelatter case, the groundwater table is shallow andthere is a pressure gradient that causes upwellingof groundwater. Such conditions were found in anarea (Fig. 9.11) lying in an alluvial area in northIndia. Fig. 9.11a shows the image in band 7 andFig. 9.11b is the interpretation for this example. Inthis case, the area has low relief and most of thearea was fallow at the time of recording by LandsatMulti-Spectral Scanner (MSS). Often the exfiltrationareas are less obvious on the imagery and have to bediscerned from the vegetation pattern. Such directlinks are, however, exceptional. Generally the in-
terpreted information from satellite imagery givesmore of circumstantial evidence or proxy hydroge-ological information.
The synergy between various types of imageries,such as multi-temporal short wave reflection, activemicrowave, and thermal imagery, can increase thediscriminating capability for mapping of differentvegetation types and wet soils in exfiltration areas.In addition, the classification may be superimposedon a digital elevation model (DEM) of the ground-water level, since the flow systems are driven bythe groundwater potentiometric surface or by aDEM of the ground surface with detailed drainageincluded, because the water table generally fol-lows the surface topography of the area. There is aclose relationship between groundwater depth andstream network characteristics in permeable low-lands where the stream system can be consideredan outcrop of groundwater flow systems. Hydroge-ological image interpretation can be a cost-effectiveaid to prepare hydrogeological maps.
If upward flow of deep groundwater occurs, itwill emerge in valleys or rivers and may be detectedon a large scale (1:1000 or 1:2000) thermal imagerybecause of the thermal inertia of relatively warmgroundwater emerging in cold rivers in mountain-ous terrain. Large head differences of the ground-water surface and the presence of fracture conduitscontribute to the ease of its detection. Burger et al.(1984) presented examples in mountainous terrain,using enlargements of airborne thermal imagery ona scale of 1:2000.
Using imagery in the visual and thermal rangestogether with some ground meteorological mea-surements, the evaporation in the central zone ofthe sebkhas (playas) that are important evapora-tive sinks of the partially leaking-out fossil ground-water in parts of northern Africa, was estimated as2 mm/day (Menenti 1984).
Another field of application of thermal imageryis the detection of submarine groundwater dis-charge in the oceans. This is based on the tem-perature difference between the fresh and sea wa-ter, provided a sufficient amount of groundwateroutflow exists to offset the effect of mixing in thedepth interval between the sea bottom and the seasurface. Several winter time NOAA images of theTunisian coast near Djerba show a strong anomaly

P1: SFK/UKS P2: SFK
c09 BLBK276-Gupta August 28, 2010 15:35 Trim: 246mm X 189mm Printer Name: Yet to Come
REMOTE SENSING AND GIS IN HYDROLOGY 293
(a)
Canal
(b)
Fig. 9.11 An example of data extraction by visual interpretation aided by some field observations: (a) MSS image, band 7,after image sharpening, of a mainly alluvial area in north India with deposits of different ages and characteristics; and (b)interpreted exfiltration zones, partly influenced by faults and tilting. Reproduced from Meijerink (1996). Reproduced bypermission of IAHS Press.
where there is significant temperature differencebetween the Mediterranean surface (with temper-ature ∼14◦C) and the groundwater (with temper-ature >18◦C) and other suitable conditions exist(Meijerink 1996).
Vast areas of the world consist of hard rocks(basement complexes) or limestone terrain wheregroundwater flow occurs only through secondarypermeability and is thus limited to fractures andweathered zones. Normally when the success ratioof drilling in hard rock terrain is low and the useof geophysical tools is too expensive, the study onimagery of lineaments and other structural and geo-metric controls favouring occurrence of groundwa-ter is an attractive proposition. Photo-lineamentscan be described as linear structural elements,which are thought to have developed over fracturezones. Interpreted lineaments can pertain to frac-tures of a different tectonic nature, with or with-out intrusive or secondary clay fillings. Reasonablystraight low topographic corridors, formed by de-nudation initiated by open fracturing, have beenidentified as lineaments as well as sharp linear fea-tures in outcrop areas. Because of their varied na-ture, the hydrogeological significance of a linea-ment needs to be established by drilling and welltesting. In some studies, high groundwater yieldshave been found to be associated with proximity tolineaments; in others this was, however, not foundto be so.
In specific areas, valuable information on ground-water quality can be derived from imagery by mak-ing use of the relationship between water qualityand vegetation. Kruck (1990) presented well-illustrated examples of the adjustment of vegeta-tion to the salinity of the shallow, phreatic watersof the inland Okavango delta in Botswana and thepampas in Argentina. The local effects of hydro-carbon contamination on the vegetation have beendescribed by Svoma (1990).
Imagery provides valuable information forgroundwater resource evaluation as well as man-agement. In certain cases, not only the likelihoodof groundwater occurrence, risk of contamination,and saltwater intrusion, but also of the characteris-tics of the terrain for groundwater use, such as suit-ability for small-scale irrigation, location, and sizeof settlements and so on, are reflected in the im-agery. Fig. 9.12 shows a typical scheme of prepar-ing a groundwater distribution map using remotesensing data and GIS in conjunction with relevantground truth information on geology, geomorphol-ogy, structural pattern, and recharge conditionsthat ultimately define a given groundwater regime.Such work has facilitated identification of sourcesof drinking water for water-scarce villages (NRSA2003).
GRACE satellite mission has recorded the world’slargest decline of gravity (other than that causedby post-glacial melting of ice sheets during the first

P1: SFK/UKS P2: SFK
c09 BLBK276-Gupta August 28, 2010 15:35 Trim: 246mm X 189mm Printer Name: Yet to Come
294 MODERN HYDROLOGY AND SUSTAINABLE WATER DEVELOPMENT
Satellite
Hydrology
Geomorphology
Lithology
Structural Map
Base Map
Groundwater Potential
Fig. 9.12 Schematic showing a typical sequence of remote sensing and GIS application to groundwater. Starting with thesatellite images and various derived geo-spatial inputs, a groundwater prospecting map is generated in the GIS environment.Redrawn from Navalgund et al. (2007) with permission from Current Science. See also plate 9.12.
6 years (2002−2008) of its operation across Indiain a 2.7 × 10⁶ km2 east-west swath extending fromeastern Pakistan across northern India and Nepalupto Bangladesh, which has important implica-tions for sustainability of groundwater resources.This decline in gravity is due to an estimated lossat the rate of 54 ± 9 km3 a−1 of groundwaterfrom this region. GRACE has also estimated thatan adjacent area comprising states of Rajasthan,Haryana, Delhi, and Punjab in northwest India haslost groundwater to the extent of 17.7 ± 4.5 km3
a−1 during the same period corresponding to amean decline of the water table by 4 ± 1 cm a−1.These losses of groundwater correspond to morethan the total surface reservoir capacity createdin India and point to unsustainable consumptionof groundwater for irrigation and other humanuses.
9.5.7 Urban issues
With the advent of remote sensing and GIS,city planners have begun to assess the resourcesthrough a multi-disciplinary approach for achievingquick results in a cost-effective manner and with
minimal manpower support. Driven by technologi-cal advances and societal needs, remote sensing ofurban areas is increasingly becoming a new appli-cation of geospatial technology, with additional ap-plications in various socioeconomic sectors (Wengand Quattrochi 2006).
Urban landscapes are typically a complex combi-nation of buildings, roads, parking lots, sidewalks,gardens, cemeteries, open lands with soil cover,surface and groundwater, and so on. Each of theurban component surfaces exhibits unique radia-tive, thermal, moisture, and aerodynamic regimesrelated to their respective surrounding environ-ment that creates spatial complexity of ecologicalsystems (Oke 1982). To understand the dynamicsof patterns and processes and their interactions inheterogeneous landscapes that characterize urbanareas, one must be able to precisely quantify thespatial pattern of the landscape and its temporalchanges (Wu et al. 2000).
Remote sensing technology has been widely ap-plied to urban land-use planning, land cover classi-fication, and change detection. However, becauseseveral types of land use/land cover (LU/LC) arecontained in one pixel, referred to as the mixed

P1: SFK/UKS P2: SFK
c09 BLBK276-Gupta August 28, 2010 15:35 Trim: 246mm X 189mm Printer Name: Yet to Come
REMOTE SENSING AND GIS IN HYDROLOGY 295
pixel problem, it is rare that a classification accu-racy of more than 80% can be achieved by usingpixel-wise classification (the so-called ‘hard clas-sification’) algorithms (Mather 1999). The mixedpixel problem results from the fact that the scaleof observation (i.e. pixel resolution) fails to repre-sent the spatial characteristics of the area (Mather1999). Alternative approaches have been suggestedto overcome this problem, but analysis of urbanlandscapes is still based on ‘pixels’ or ‘pixel groups’(Melesse et al. 2007).
Impervious surfaces such as roads, driveways,sidewalks, parking lots, rooftops, etc. are urban an-thropogenic features through which water cannotinfiltrate into the ground. In recent years, impervi-ous surface cover has emerged, not only as an indi-cator of the degree of urbanization but also a majorindicator of urban environmental quality (Arnoldand Gibbons 1996). Various digital remote sensingapproaches have been developed to estimate andmap impervious surfaces (Weng 2007).
Since the launch of the first Earth ResourcesTechnology Satellite, ERTS-1, in 1972, remotely-sensed data from different sensors have been usedto characterize, map, analyse, and model the stateof the land surface and sub-surface processes. Thisnew information, together with better estimationof hydrological parameters, has increased our un-derstanding of different hydrologic processes as anaid to quantification of rate and amount of waterand energy fluxes in the environment. The abilityof these sensors in providing data on various spatio-temporal scales has also increased our capability tograpple with one of the challenges of environmen-tal modelling, such as mismatch between scale ofenvironmental processes and the available data.
Remote sensing data is being widely used, par-ticularly in developing countries for preparationof perspective development plans. Remote sens-ing and GIS are typically used to provide maps ofexisting land use, infrastructure network (roads,railways and human settlements), hydrologic fea-tures (river/stream, lakes) etc. that are useful forpreparation of regional level landscape, updatingof base maps, urban sprawl, land-use changes, pop-ulation growth, and master plans for equitable de-velopment of environmental resources of the area.The data are being extensively used for infrastruc-
ture planning, ring road alignment, utility planning(e.g. site selection for locating garbage dump, waterworks, etc.), road network and connectivity plan-ning, growth centre locations, etc. Several impor-tant applications of remote sensing and GIS canbe found in the literature for almost every city indeveloped countries. Even in India, use of thesetechnologies is growing rapidly for urban sprawlmapping, preparation of a master plans, pipelinesurveys, planning of ring roads, port trusts, etc.
9.5.8 Monitoring of global change
In recent years, the term ‘climate change’ has foundits way into the top agenda of scientific discus-sions. Muddled up with this is another term ‘globalchange’ that has evolved with its starting point ofthe concept for treating the Earth as an integratedsystem. The Earth system encompasses the cli-mate system in addition to biophysical and anthro-pogenic processes that are important for its func-tioning. Some of the changes in the Earth system,natural as well as human-induced, could have signif-icant consequences without involving any concur-rent changes in the climate system. Global changeshould, therefore, not be confused with just cli-mate change; it is considerably more comprehen-sive (Steffen et al. 2004). Much of global changestudy focuses on the vertical links between the at-mosphere and the Earth’s surface and its compo-nents, such as ecosystems on land and in the sea,which are also connected to each other laterallythrough dynamics of the Earth System – involvinghorizontal movement of water and other Earth ma-terials, atmospheric transport of water vapour andpollutants, and deposition and migration of plantsand animals. Moreover, they are connected throughenergy transfers and also through chemical and bio-logical signatures that persist over time. It is essen-tial to note that global changes in social, cultural,economic, and environmental systems converge insmall localities. On the other hand, changes on thelocal scale contribute to global change with variouslinkages between systems and their spatial scales.Examples of global driving forces include the worldpopulation that has doubled since the decade of1960s; the global economy has improved since the1950s by more than a factor of 15 but the regional

P1: SFK/UKS P2: SFK
c09 BLBK276-Gupta August 28, 2010 15:35 Trim: 246mm X 189mm Printer Name: Yet to Come
296 MODERN HYDROLOGY AND SUSTAINABLE WATER DEVELOPMENT
inequality is increasing and so on. It is a dauntingtask to identify, monitor, and predict the variouseffects and linkages between processes involved inglobal change.
On a global scale, the response of the Earth sys-tem to contemporary anthropogenic forcing canclearly be seen in biogeochemical cycles, in the hy-drologic cycle, and recently in climate. The Earth’sclimate system responds to various direct and in-direct human forcing in many ways, in addition tomodification of the hydrologic cycle.
From space, the whole world unfolds every day.Orbiting the planet, the Earth Observing Satellite(EOS) sensors are uniquely able to make the kind ofmeasurements that experts need to understand thesystemic changes that are taking place on the Earth.Satellite remote sensing is an evolving technologywith the potential for contributing to studies of thehuman dimensions of global environmental changeby making comprehensive evaluations of varioushuman activities from multispectral satellite imagesobtained from sensors deployed on satellites, suchas Landsat and ASTER, both offering spatial resolu-tion of 15 m.
Satellite images are expected to contribute toa wide array of global change-related applicationareas for studying vegetation and ecosystem dy-namics, hazard monitoring, geology and soil analy-sis, land surface climatology, hydrology, land-coverchanges, and generation of digital elevation models(DEMs).
For climatologists and meteorologists studyingatmospheric and climatic variability on a globalscale, monitoring of the snow cover componentis a major challenge. Snow cover significantly in-fluences the evolution of weather on a daily basis,as well as climate variability on longer time scales.For example, glaciers on the Himalaya and TibetanPlateau, and ice caps and ice sheets in Antarctica,Greenland, and in the Arctic Circle, play an im-portant role in the Earth’s climate. This is becausethe snow cover modifies the radiative balance andenergy exchanges between the land surface andthe atmosphere significantly, thus indirectly affect-ing the atmospheric dynamics. Snow cover is alsoextremely sensitive to climatic fluctuations. Con-sequently, accurate observations of the spatial and
temporal variability of snow cover could aid moni-toring of global change. Presently, because of somelimitations inherent in various data types employedin monitoring snow cover from space, the mostfavourable solution probably consists of jointly us-ing multi-sensor satellite data (in the visible, near-infrared, thermal infrared, and microwave bands).
Remote sensing, particularly use of radar altime-ters and imaging radiometers, offers a global per-spective for some hydrologic parameters. Satelliteradar altimetry, with its all-weather operation, canbe used to derive water levels in lakes, rivers, andwetlands and infrared imagery can be used to de-marcate lake and wetland areas. Remote sensingtechniques can be applied to several problems, in-cluding determination of regional scale hydrologicvariability and proxy monitoring of precipitationchanges.
The Earth Sciences community has made ex-tensive use of satellite imagery data for mappingland cover, estimating geophysical and biophysicalcharacterization of terrain features, and monitor-ing changes in land cover with time. For exam-ple, Ehrlich et al. (1994) reviewed many of the re-ported findings associated with the capabilities ofNOAA Advanced Very High Resolution Radiometer(AVHRR) 1-km resolution data to provide globalland-cover information. Tucker et al. (1991) usedcoarse-resolution satellite image data for monitor-ing continental-scale climate-related phenomena in‘Expansion and Contraction of the Sahara Desertfrom 1980 to 1990’. Colwell and Sadowski (1993)used high-resolution satellite data for monitoringregional patterns and rates of forest resource uti-lization. Freeman and Fox (1994) discussed thesemi-operational use of satellite imagery for severalforest assessment programmes.
It is thus clear that evaluation of static attributes(type, amount, and arrangement) and the dynamicattributes (type and rate of change) on satellite im-ages enable the types of change to be regionalizedand the proximate sources of change to be identi-fied or inferred. This information, combined withresults of case studies or surveys, can provide help-ful inputs for an informed evaluation of interac-tions amongst the various driving forces for globalchange.