modelling to support a future covid-19 strategy for
TRANSCRIPT

This paper has not yet undergone formal peer review
A Centre of Research Excellence hosted by the University of Auckland 1
Modelling to support a future COVID-19 strategy for Aotearoa New Zealand
Nicholas Steyn1,3, Michael Plank2,3, and Shaun Hendy1,3
1. Department of Physics, University of Auckland, New Zealand. 2. School of Mathematics and Statistics, University of Canterbury, New Zealand. 3. Te Pūnaha Matatini, Centre of Research Excellence in Complex Systems, New Zealand.
23 September 2021
Executive Summary • Aotearoa New Zealand is on track to vaccinate upwards of 80% of those aged over 12 against
COVID-19 with the Pfizer/BioNTech mRNA vaccine. Recent announcements by Pfizer and BioNTech suggest that the vaccine may soon be approved for use in children aged 5-11 years. This means it is possible that Aotearoa could achieve vaccine coverage across the total population of more than 90%.
• We consider how these high rates of coverage might reduce the health burden from COVID-19 if combined with moderate public health measures to reduce transmission of the virus. Scenarios are evaluated using the Te Pūnaha Matatini vaccine model, using current data about vaccine effectiveness with respect to the Delta variant. As the effects of the vaccine on transmission remain uncertain, we consider three levels of vaccine effectiveness: high, central, and low to illustrate a range of possibilities.
• Attaining population immunity would significantly reduce health impacts, but this a function of the particular characteristics of the virus, the structure of the population, the distribution of immunity in that population, and other measures that can be put in place, all of which can change over time. Nonetheless, it is not thought to be possible to achieve widespread population immunity to the Delta variant by vaccination alone, which means that moderate public health measures will be needed to augment the vaccine programme.
• Here we assume a suite of moderate and sustainable public health measures are maintained, such as some combination of mask use, ventilation, some density/capacity restrictions for indoor venues, support for people to isolate, and/or vaccine certificates. We also assume that a test-trace-isolate-quarantine system is operating either at levels that are high (most likely at low case-loads) or reduced (most likely at high case-loads). We do not consider the use of stay-at-home orders here (i.e. Alert Level 3 or 4).
• We find that there are scenarios where, through a combination of high vaccine coverage (including amongst those aged 5-11) and moderate public health measures, population immunity is achieved, resulting in very low mortality burden. For example, with 90 per cent vaccine coverage of the population over the age of 5, a suite of moderate public health measures and an effective test, trace and isolate system, the modelling suggests there would be around 500 hospitalisations and 50 fatalities from COVID-19 over a one year period.
• There are scenarios where, despite a high vaccination coverage, population immunity is not achieved, resulting in a disease mortality burden that is an order of magnitude greater. For example, with 80 per cent vaccine coverage of the population over the age of five and moderate public health measures, the modelling suggests there would be around 60,000 hospitalisations and 7,000 fatalities per year from COVID-19. Such outcomes could be mitigated if more restrictive control measures, akin to current Alert Levels 3 or 4, were utilised.
This paper has not yet undergone formal peer review
A Centre of Research Excellence hosted by the University of Auckland 2
• Nonetheless, the results suggest that a combination of high levels of vaccination within the community, a strong test-trace-isolate-quarantine system (assuming case numbers are kept sufficiently low) and moderate public health measures may be enough to attain population immunity, greatly reducing the need for strong public health measures, such as stay-at-home orders and workplace closures.
Introduction As of 21 September 2021, 79% of Aotearoa New Zealand’s eligible population have either had at least one dose of the Pfizer-BioNTech vaccine against COVID-19 or are booked to have a dose [1]. Currently this vaccine is approved in Aotearoa for people over 12 years of age. On 20 September 2021, Pfizer and BioNTech announced that trials for this vaccine for 5-11 year olds had proved successful, in that the vaccine had been found to be safe and effective, and that they intended to apply for approval around the world [2]. This raises the possibility that Aotearoa may be able to achieve very high levels of vaccine coverage, something that would greatly reduce the mortality burden from COVID-19 if combined with moderate public health interventions.
In order to keep annual mortality from COVID-19 at levels similar to or below those experienced from seasonal influenza, for instance, the effective reproduction number,𝑅!"", of the virus must be kept close to or below 1 by a combination of vaccination, targeted measures such as case isolation, and other control measures. Results from both Te Pūnaha Matatini’s SEIR vaccination model [3] and the ESR model [4] suggest that if the reproduction number is even slightly greater than 1, fatalities would be measured in thousands, despite high vaccine coverage. As the Delta variant is thought to have a reproductive number of 𝑅#~5.5 − 6.5, population immunity (𝑅!"" < 1) is likely to be extremely difficult to achieve by vaccination alone. Thus it is probable that other control measures will be needed on top of vaccination to deal with COVID-19 outbreaks for the foreseeable future. In this short note we consider scenarios with different combinations of vaccine effectiveness, vaccine coverage, and additional public health and social measures.
The work here is based on Te Pūnaha Matatini’s vaccination model [3]. This model is age-structured, but otherwise does not capture population heterogeneity in vaccination or contact rates. This means that while 𝑅!"" could be less than one, on average, across the population, there may still exist communities with 𝑅!"" >1 in which a significant outbreak could occur. It is also likely that 𝑅!"" would vary seasonally and is likely to be higher during school and university terms and higher in winter than in summer months. Thus, estimates of fatalities made here may be optimistic. Furthermore, we have used baseline assumptions about the effectiveness of the vaccine [5,7] that do not consider immune escape or waning immunity.
Nonetheless the results here demonstrate the considerable benefits of achieving high vaccination coverage in the coming months. It suggests that a combination of high levels of vaccination within the community, a strong test-trace-isolate-quarantine (TTIQ) system and moderate public health measures may be enough to attain population immunity, which would greatly reduce the need for stay-at-home orders and tight border restrictions in 2022.
Key model assumptions and inputs • We assume 𝑅# = 6.0 to model the Delta variant, which remains dominant globally and is the variant
responsible for the Auckland 2021 outbreak. • We assume that a baseline suite of moderate public health measures and mitigations are in place
than provide a 17% reduction in transmission. • A TTIQ system provides an additional reduction in transmission of either 10% (limited TTIQ –
assuming that only limited contact tracing is possible) or 20% (full TTIQ – assuming effective contact tracing).
This paper has not yet undergone formal peer review
A Centre of Research Excellence hosted by the University of Auckland 3
• Vaccine coverage is assumed to be uniform across eligible age groups and it is assumed that everyone who is vaccinated has had both doses of the Pfizer/BioNTech mRNA vaccine.
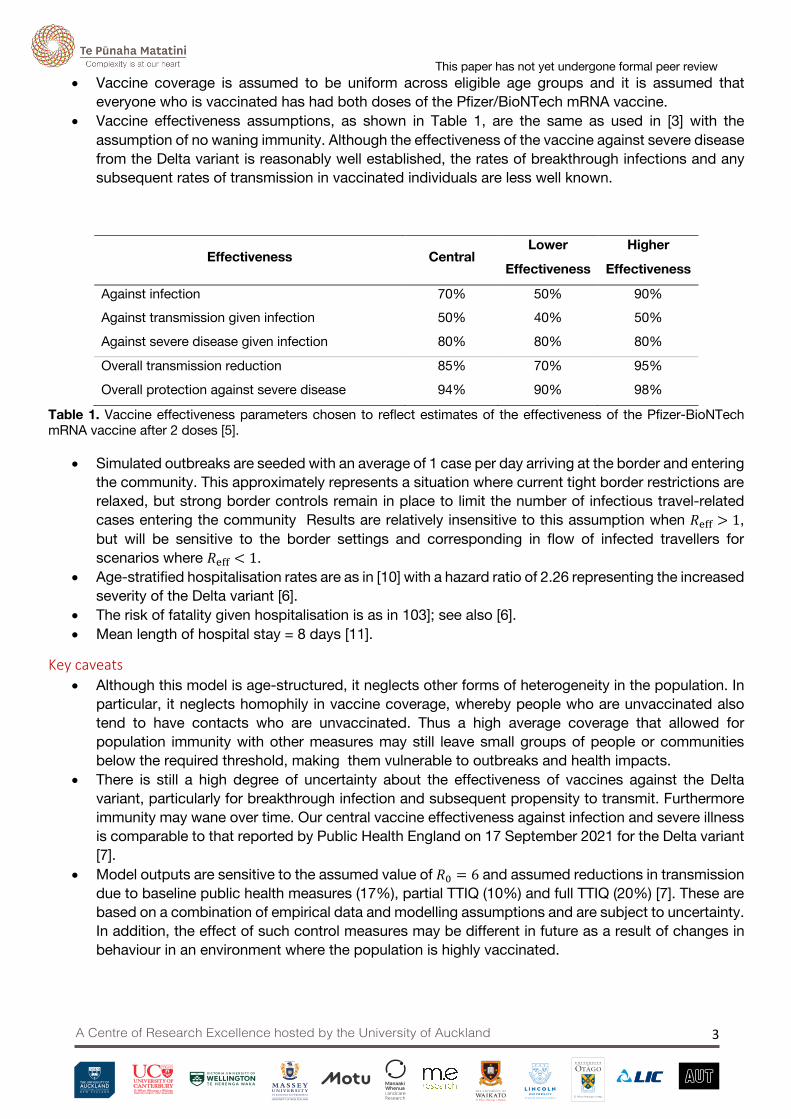
• Vaccine effectiveness assumptions, as shown in Table 1, are the same as used in [3] with the assumption of no waning immunity. Although the effectiveness of the vaccine against severe disease from the Delta variant is reasonably well established, the rates of breakthrough infections and any subsequent rates of transmission in vaccinated individuals are less well known.
Effectiveness Central Lower
Effectiveness
Higher
Effectiveness
Against infection 70% 50% 90% Against transmission given infection 50% 40% 50%
Against severe disease given infection 80% 80% 80%
Overall transmission reduction 85% 70% 95%
Overall protection against severe disease 94% 90% 98%
Table 1. Vaccine effectiveness parameters chosen to reflect estimates of the effectiveness of the Pfizer-BioNTech mRNA vaccine after 2 doses [5].
• Simulated outbreaks are seeded with an average of 1 case per day arriving at the border and entering the community. This approximately represents a situation where current tight border restrictions are relaxed, but strong border controls remain in place to limit the number of infectious travel-related cases entering the community Results are relatively insensitive to this assumption when 𝑅!"" > 1, but will be sensitive to the border settings and corresponding in flow of infected travellers for scenarios where 𝑅!"" < 1.
• Age-stratified hospitalisation rates are as in [10] with a hazard ratio of 2.26 representing the increased severity of the Delta variant [6].
• The risk of fatality given hospitalisation is as in 103]; see also [6]. • Mean length of hospital stay = 8 days [11].
Key caveats • Although this model is age-structured, it neglects other forms of heterogeneity in the population. In
particular, it neglects homophily in vaccine coverage, whereby people who are unvaccinated also tend to have contacts who are unvaccinated. Thus a high average coverage that allowed for population immunity with other measures may still leave small groups of people or communities below the required threshold, making them vulnerable to outbreaks and health impacts.
• There is still a high degree of uncertainty about the effectiveness of vaccines against the Delta variant, particularly for breakthrough infection and subsequent propensity to transmit. Furthermore immunity may wane over time. Our central vaccine effectiveness against infection and severe illness is comparable to that reported by Public Health England on 17 September 2021 for the Delta variant [7].
• Model outputs are sensitive to the assumed value of 𝑅# = 6 and assumed reductions in transmission due to baseline public health measures (17%), partial TTIQ (10%) and full TTIQ (20%) [7]. These are based on a combination of empirical data and modelling assumptions and are subject to uncertainty. In addition, the effect of such control measures may be different in future as a result of changes in behaviour in an environment where the population is highly vaccinated.

This paper has not yet undergone formal peer review
A Centre of Research Excellence hosted by the University of Auckland 4
• Model results are intended as a guide to the relative benefits of different levels of vaccine coverage in the population rather than exact predictions or a detailed roadmap.
• Model simulations are run for a one year period. Additional health impacts are possible subsequent to this one year period, although the scale of these will depend more heavily on unknown variables including the rates of waning immunity to infection and to severe disease.
Results for an epidemic with baseline public health measures and TTIQ The results presented here are for a 12-month period following the start of an outbreak. We have not included the effects of individual public health measures in this study. Instead we assume that a moderate suite of measures are in place and that these can be sustained for a long period of time. Such measures may include a combination of interventions such as:
• Improved air filtration and ventilation requirements, or where these cannot be met, mandatory mask use or some density or capacity restrictions for indoor venues
• Vaccine passports • Support for people to isolate • Rapid-testing at workplaces and schools
Two scenarios for TTIQ performance are considered:
1. Baseline public health measures (17% reduction in transmission) and limited TTIQ (10% reduction in transmission), giving a combined 25% reduction in 𝑅!"".
2. Baseline public health measures (17% reduction in transmission) and full TTIQ (20% reduction in transmission), giving a combined 33% reduction in 𝑅!"".
The first of these could be interpreted as a scenario where measures to contain outbreaks are relaxed or fail and a mitigated epidemic wave spreads through the population. High case numbers would mean that TTIQ is less effective and may rely primarily on widespread testing and isolation of symptomatic individuals and confirmed cases. In the second case, we assume that a fully effective TTIQ system can be maintained when case numbers are sufficiently low. Here, effective performance is set to be similar to that observed early in the Auckland August 2021 outbreak, based on the time cases were isolated or quarantined relative to the time of symptom onset. Future work will explicitly model the performance of the TTIQ system under different caseloads, but it is important to note that in general it will be easier to keep 𝑅!"" supressed when overall case numbers are low.
We consider a range of scenarios that combine a mix of vaccine effectiveness assumptions, vaccine coverage levels, and the two TTIQ performance tiers described above. This model does not attempt to capture in detail the effect of border controls. In scenarios where 𝑅!"" > 1, border controls have less of an effect on outcomes (unless very stringent), but they become important for determining cases when 𝑅!"" < 1. The scenarios here best represent situations with moderate border controls in place. In scenarios where 𝑅!"" < 1, real outcomes will be highly variable depending on the nature of each chain of infection and will be sensitive the number of border-related cases, which are not modelled here. Nonetheless, provided outbreaks are only seeded into communities where 𝑅!"" < 1, the mortality burden is expected to be lower than or comparable to seasonal influenza. Note that these scenarios ignore the effects of waning immunity, which may well be significant over the timescales considered here, but which could be mitigated with vaccine boosters.

This paper has not yet undergone formal peer review
A Centre of Research Excellence hosted by the University of Auckland 5
Effective reproductive number
pVaxElig 𝑹𝐞𝐟𝐟with no mitigation
𝑹𝐞𝐟𝐟with baseline PH measures and limited TTIQ
𝑹𝐞𝐟𝐟with baseline PH measures and full TTIQ
Over 12s High VE
Cent VE
Low VE
High VE
Cent VE
Low VE
High VE
Cent VE
Low VE
70% 1.78 2.22 2.95 1.34 1.66 2.22 1.19 1.48 1.97 75% 1.63 2.04 2.79 1.22 1.53 2.09 1.09 1.36 1.86 80% 1.52 1.88 2.62 1.14 1.41 1.97 1.01 1.26 1.75 85% 1.44 1.75 2.47 1.08 1.31 1.85 0.96 1.16 1.65 90% 1.38 1.63 2.32 1.03 1.22 1.74 0.92 1.09 1.55 95% 1.33 1.54 2.18 1.00 1.15 1.64 0.89 1.03 1.46 Over 5s 70% 1.53 2.05 2.85 1.15 1.54 2.14 1.02 1.37 1.90 75% 1.33 1.85 2.67 1.00 1.39 2.00 0.89 1.23 1.78 80% 1.15 1.66 2.50 0.87 1.25 1.87 0.77 1.11 1.67 85% 1.02 1.49 2.33 0.76 1.12 1.75 0.68 0.99 1.55 90% 0.93 1.33 2.17 0.70 1.00 1.63 0.62 0.89 1.45 95% 0.87 1.19 2.02 0.66 0.89 1.51 0.58 0.79 1.34
Table 2. The effective reproductive number Reff for differing levels of vaccine coverage across the eligible population (5+ or 12+), different assumptions about vaccine effectiveness (high, central, and low), and different level of public health mitigation (no mitigation, baseline PH measures with limited TTE, baseline PH measures with full TTIQ).
Baseline public health measures and limited TTIQ
pVaxElig Infections Hospitalisations Deaths Peak beds occupied
Over 12s High VE Cent VE Low VE
High VE
Cent VE
Low VE
High VE
Cent VE
Low VE
High VE
Cent VE
Low VE
70% 1440522 2082185 2823390 94769 120339 149276 11844 15542 20102 13092 21113 33069 75% 1145338 1835476 2653898 68092 95426 126310 8307 12088 16792 7486 14642 26183 80% 835601 1570757 2475533 43224 71628 104065 5148 8886 13645 3491 9272 19990 85% 460831 1284468 2286397 19133 49483 82723 2218 6008 10688 1172 5136 14514 90% 78630 972073 2084118 2270 29768 62529 260 3539 7953 195 2316 9846 95% 12809 569508 1865801 218 12275 43815 26 1425 5481 13 752 6053
Over 5s 70% 1051653 1747955 2577609 79738 109892 143037 9447 13669 18824 9371 17889 30732 75% 705384 1459872 2381811 49923 83670 119659 5681 10117 15482 4022 11423 23832 80% 193310 1143129 2174033 12203 58410 97075 1299 6838 12327 799 6215 17656 85% 5546 779614 1951199 311 34324 75511 33 3868 9392 10 2487 12292 90% 1454 171773 1709070 67 6030 55277 7 637 6719 2 438 7818 95% 708 7486 1441633 23 199 36822 3 21 4362 1 6 4328
Table 3. Total infections, hospitalisations, deaths, and peak hospital occupancy over a one year period for differing levels of vaccine coverage across the eligible population (5+ or 12+), different assumptions about vaccine effectiveness (high, central, and low), and with baseline PH measures and limited TTIQ.
Baseline public health measures and full TTIQ
pVaxElig Infections Hospitalisations Deaths Peak beds occupied
This paper has not yet undergone formal peer review
A Centre of Research Excellence hosted by the University of Auckland 6
Over 12s High VE Cent VE Low VE
High VE
Cent VE
Low VE
High VE
Cent VE
Low VE
High VE
Cent VE
Low VE
70% 1202590 1848646 2619610 78877 106172 137348 9523 13271 17947 8490 15549 26732 75% 881494 1579662 2435510 52272 81674 114983 6151 10001 14820 4128 10089 20680 80% 444142 1288249 2240443 22573 58464 93456 2560 7004 11870 1394 5770 15310 85% 42338 962392 2032049 1720 36868 72984 191 4314 9126 130 2695 10688 90% 6210 461893 1807389 189 13796 53855 21 1557 6623 7 878 6877 95% 2415 52423 1562854 46 1103 36466 5 123 4407 1 83 3925
Over 5s 70% 826378 1518616 2372654 62392 94809 130543 7129 11399 16653 5419 12657 24533 75% 387597 1209014 2162504 27032 68865 107743 2930 8039 13501 1603 7323 18483 80% 14122 861391 1938250 899 43757 85857 94 4936 10549 44 3319 13179 85% 2176 308699 1696232 124 13249 65146 13 1411 7832 3 848 8697 90% 954 13398 1431361 45 476 45968 5 50 5395 1 20 5120 95% 532 2948 1135485 18 79 28812 2 8 3292 0 2 2503
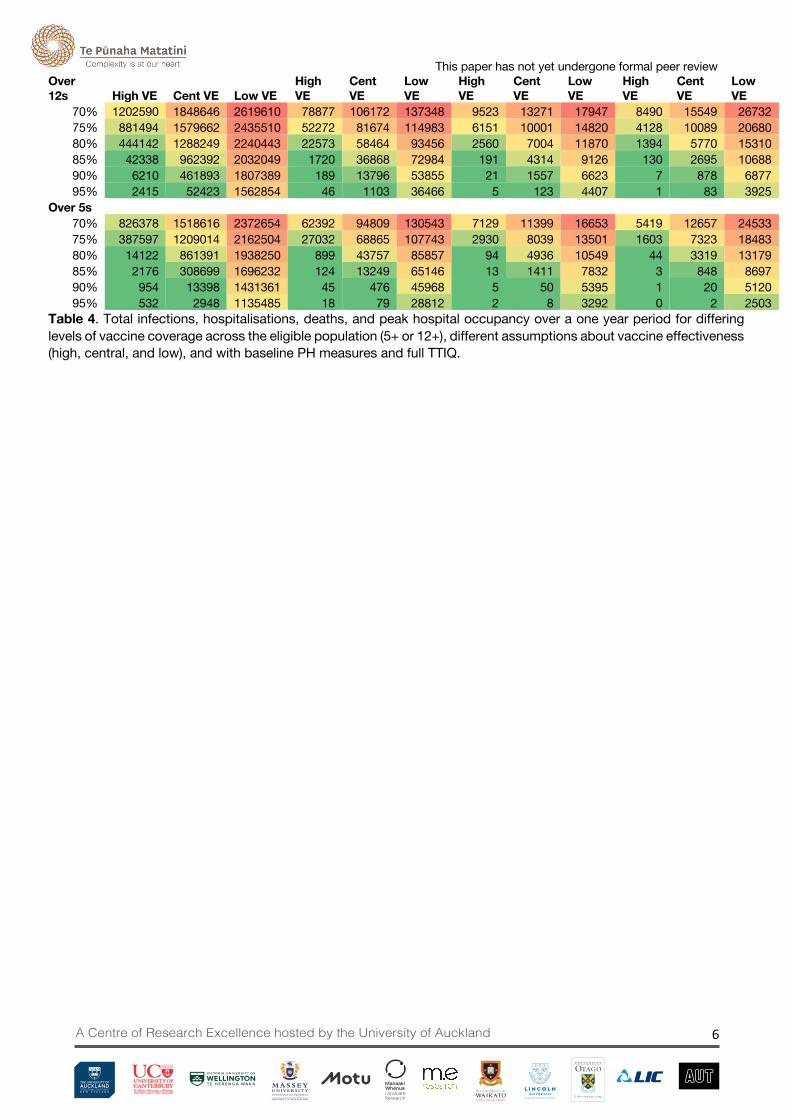
Table 4. Total infections, hospitalisations, deaths, and peak hospital occupancy over a one year period for differing levels of vaccine coverage across the eligible population (5+ or 12+), different assumptions about vaccine effectiveness (high, central, and low), and with baseline PH measures and full TTIQ.
This paper has not yet undergone formal peer review
A Centre of Research Excellence hosted by the University of Auckland 7
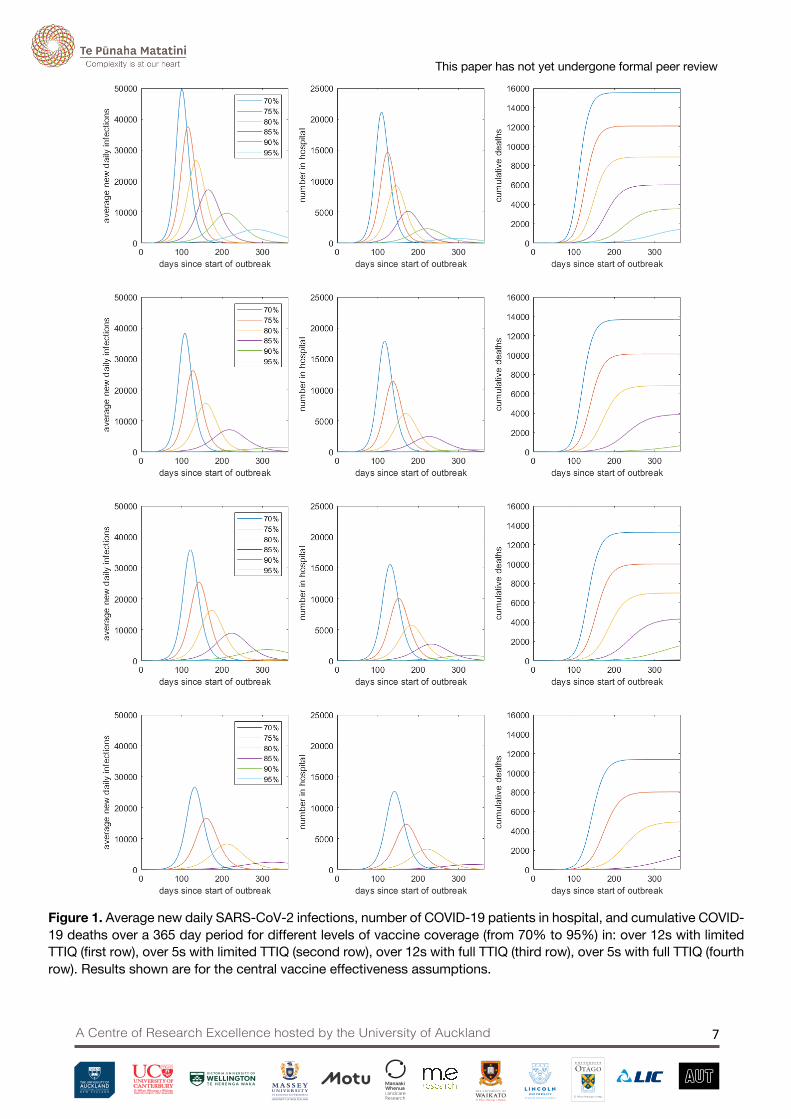
Figure 1. Average new daily SARS-CoV-2 infections, number of COVID-19 patients in hospital, and cumulative COVID-19 deaths over a 365 day period for different levels of vaccine coverage (from 70% to 95%) in: over 12s with limited TTIQ (first row), over 5s with limited TTIQ (second row), over 12s with full TTIQ (third row), over 5s with full TTIQ (fourth row). Results shown are for the central vaccine effectiveness assumptions.

This paper has not yet undergone formal peer review
A Centre of Research Excellence hosted by the University of Auckland 8
Discussion The results here illustrate the benefits of achieving levels of vaccination coverage higher than 90% of the eligible population. Even at 90% coverage of those aged over 12 and with moderate public health measures, there could still be high levels of population morbidity and mortality under conditions of low or waning vaccine effectiveness. These sorts of outcomes would generally be outside the capacity of the health system to cope, so they would likely require the imposition of more stringent measures including local school, business and university closures as well as targeted stay-at-home orders. There would also be significant infection rates in children. For example, with 90% of over 12s vaccinated with central vaccine effectiveness, baseline public health measures and fully effective TTIQ, the model estimates there would still be approximately 150,000 infections in children under 15. Although the risk of severe disease in these age groups is relatively low, the broader health impacts [9] and disruption to schools from such high infection rates would still be significant.
However if vaccination coverage is increased to 95% and/or into the 5-11 age group then the results suggest that moderate public health measures can result in 𝑅!"" < 1, leading to considerably better outcomes. A combination of high levels of vaccination within the community, a strong test-trace-isolate-quarantine system, and moderate public health measures would greatly reduce the need for stay-at-home orders and workplace closures.
The results suggest that it would be valuable to develop a suite of moderate public health interventions that can be sustained for a long period of time if required. Interventions such as mandated mask use, ventilation requirements and some density or capacity restrictions for indoor venues, rapid-testing at workplaces and schools, and support for symptomatic people, confirmed cases and close contacts to isolate should be investigated. Effort should also be given to strengthening the test-trace-isolate-quarantine system, which would be expected to operate for extended periods with low to moderate levels of cases in the community, possibly punctuated by larger outbreaks in parts of the community where vaccine coverage is lower due to reduced uptake or waning immunity. Such outbreaks may require significant surge capacity and may need to be accompanied by more stringent public health measures. However, the higher the vaccine coverage achieved, the less such measures will be needed.
The purpose of this report is to provide a broad guide to the relative benefits of different levels of vaccine coverage in terms of reducing potential health impacts of COVID-19 and therefore lessening the need for stringent restrictions to reduce transmission of SARS-CoV-2. Decisions about the nature and timing of changes in public health measures and border controls should be informed both by more detailed modelling based on up-to-date national and international data and by specific public health considerations. These include: current case numbers and transmission rates; vaccine coverage in specific communities and regions, including Māori and Pasifika vaccination rates; regional and national health system capacity and demands and contact tracing system capacity; seasonal factors including, for example, school/university terms and faster transmission in winter months; epidemiological characteristics of recent and current outbreaks.
Future modelling work will focus on specific public health interventions in more detail, including how these interventions interact with health system and contact tracing system capacity, border controls, and the frequency at which more stringent interventions may be needed. When 𝑅!"" < 1, the health outcomes are more moderate, but do become sensitive to the particular choice of border restrictions. Future work will investigate the relationship between outcomes and border restrictions.
This paper has not yet undergone formal peer review
A Centre of Research Excellence hosted by the University of Auckland 9
Acknowledgements This work was funded by the New Zealand Ministry of Business, Innovation and Employment and Te Pūnaha Matatini, Centre of Research Excellence in Complex Systems.
References [1] Ministry of Health, COVID-19: Vaccine data. Retrieved 22 September 2021. https://www.health.govt.nz/our-work/diseases-and-conditions/covid-19-novel-coronavirus/covid-19-data-and-statistics/covid-19-vaccine-data
[2] Pfizer Media Release, “Pfizer And BioNTech Announce Positive Topline Results From Pivotal Trial Of Covid-19 Vaccine In Children 5 To 11 Years”. 20 September 2021. https://www.pfizer.com/news/press-release/press-release-detail/pfizer-and-biontech-announce-positive-topline-results
[3] N. Steyn, M. Plank, R. Binny, S. C. Hendy, A. Lustig, and K. Ridings, “A COVID-19 Vaccination Model for Aotearoa New Zealand” Te Pūnaha Matatini Technical Report June 2021. https://www.tepunahamatatini.ac.nz/2021/06/30/a-covid-19-vaccination-model-for-aotearoa-new-zealand/
[4] T. Nguyen et al, “COVID-19 vaccine strategies for Aotearoa New Zealand: a mathematical modelling study” Lancet Regional Health - Western Pacific 15, 100256 (2021).
[5] Scientific Pandemic Influenza Group on Modelling, SPI-M-O: Summary of further modelling of easing restrictions – Roadmap Step 4. 2021. Retrieved 21 Sept 2021. https://assets.publishing.service.gov.uk/government/uploads/system/uploads/attachment_data/file/993510/S1287_SPI-M-O_Summary_Roadmap_step_4.pdf
[6] K. A. Twohig et al, “Hospital admission and emergency care attendance risk for SARS-CoV-2 delta (B.1.617.2) compared with alpha (B.1.1.7) variants of concern: a cohort study” Lancet Infectious Diseases. Published Online August 27, 2021.
[7] Public Health England. COVID-19 vaccine surveillance report: Week 37. Retrieved 21 Sept 2021. https://assets.publishing.service.gov.uk/government/uploads/system/uploads/attachment_data/file/1018416/Vaccine_surveillance_report_-_week_37_v2.pdf
[8] Doherty Institute. “Doherty Institute Modelling Report for National Cabinet”. Retrieved 21 Sept 2021. https://www.doherty.edu.au/uploads/content_doc/DohertyModelling_NationalPlan_and_Addendum_20210810.pdf
[9] Office for National Statistics. Technical article: Updated estimates of the prevalence of post-acute symptoms among people with coronavirus (COVID-19) in the UK, 26 April 2020 to 1 August 2021. Retrieved 21 Sept 2021. https://www.ons.gov.uk/releases/technicalarticleupdatedestimatesoftheprevalenceofpostacutesymptomsamongpeoplewithcoronaviruscovid19intheuk26april2020to1august2021
[10] R. Verity et al, “Estimates of the severity of coronavirus disease 2019: a model-based analysis”. The Lancet Infectious Diseases, 2020. 20(6): p. 669-677.
[11] N. Steyn et al, “Māori and Pacific people in New Zealand have a higher risk of hospitalisation for COVID-19”. New Zealand Medical Journal 134(1538): 28-43.