modelling of elevator traffic systems using queuing theory
TRANSCRIPT

Modelling of Elevator Traffic Systems Using Queuing Theory
Lutfi Al-Sharif*, Ahmad M. Abu Alqumsan, Weam Ghanem,
Islam Tayeh, Areej Jarrar
Mechatronics Engineering Department, The University of Jordan, Amman 11942, Jordan *Corresponding author: [email protected]
Keywords: elevator; lift; inter-arrival time; inter-service time; discrete event simulation; number of servers; system loading.
Abstract. It has been long known that the elevator traffic system can be modelled as a multi-server
queuing system. Each elevator can be represented as a server. The aim of this paper is to analyse
the queue lengths and the average waiting times for elevator traffic systems using queuing theory.
A discrete event simulation queuing theory model for an elevator traffic system was built
using the SimEvents blocks within Simulink. A large number of simulations were carried out on
the SimEvents software to find the average passenger waiting time and the average passenger queue
length for a simulation period length of 900 seconds.
It has been assumed that the passenger arrival process follows a Poisson distribution, and
that the server inter-service time follows an exponential distribution (the average time taken to
‘process’ each passenger). A plot has been made of the average passenger waiting time and average
passenger queue length against the system loading. The system loading is defined as the ratio of the
actual arrival rate to the design arrival rate (λ divided by µ).
In order to verify the results from the queuing modelling, the average passenger waiting time
and the average passenger queue length were also extracted from a MATLAB simulation model.
Good agreement has been found between the two methods.
1 INTRODUCTION
Elevator traffic systems provide an ideal arena for the application of queuing theory. An elevator
traffic system is a typical example of a queue-server system, whereby the passengers represent
customers arriving for service, the lobby is a first in first out queue and the elevators represent a
multi-server system. Applying queuing theory to elevator traffic system can be very insightful [2],
and provides the designer with a ‘macroscopic’ view of the operation of the system and the inter-
relationship between different performance parameters such as the queue length, the waiting time in
the queue and the service time.
Queuing theory has been applied to elevators in order to assess the values of the waiting
time and the queue length in the lobby. The most important piece of work that has been carried out
in this area is that done by Alexandris et al. ([1], [4], [5], [6]). The work in [1] derives a set of
equations that model the elevator system under up peak traffic conditions, in order to evaluate four
parameters that are considered representative of the system performance. The four parameters are:
average passenger waiting time in the main terminal (i.e. lobby); the average queue length of
passengers waiting in the lobby; the percentage of busy elevator cars in the group; and the
passengers delay time. In [4] formulae for the highest reversal floor in a round trip (H) and the
average number of stops in a round trip (S) are presented, based on an assumed Poisson arrival
process. The work assumes steady state operation, and thus assumes that the system manifests this
performance continuously, once subjected to the specified level of passenger arrivals. There are
two consequences to this critical assumption:
10 4th
Symposium on Lift & Escalator Technologies
1. The elevator traffic system must be designed for an assumed infinitely continuous arrival
rate, and must be able to infinitely sustain such an arrival rate without excessive queues
forming and without excessive passenger waiting times.
2. The equation cannot deal with the case where the system is subjected to a passenger arrival
rate that is sustained for a finite period of time (e.g., 5 minutes, 10 minutes; 15 minutes)
whereby the arrival rate is equal to 100% of the design capacity (i.e., system loading is
100%) or even exceeds the system design capacity for short periods of time.
We, the authors of this paper, will attempt to use queuing theory and openly available software to
explore the ‘macroscopic’ view of the performance of an elevator traffic system under finite
workspaces (e.g., 5 minutes, 10 minutes, and 15 minutes) at system loading rates equal to or
exceeding 100%. The motivation is that most elevator traffic simulation studies that are carried out
today are usually run for finite period of time at system loading conditions of 100%. Moreover, it is
useful in some case to assess the performance of a system when it is overloaded and subjected to
system loading in excess of 100% (e.g., understanding the effect of the increase in a building
population due to change of function; assessing an under-designed elevator traffic system).
As mentioned in [7], queuing theory modelling of elevator traffic systems allows a
macroscopic view of the performance to be formed. It can be used to provide insights into the
operation of the system and to allow general conclusions to be drawn. The elevator system details
are ignored and the whole elevator system is treated as a black box that processes passengers.
Discrete event simulation software, SimEvents, which is part of Simulink/Matlab will be
used in order to evaluate the passenger average waiting time and the average queue length in
elevators. It is used to illustrate the effect of the workspace (i.e., simulation time) under the
combined effect of the following two conditions:
1. Finite workspace (i.e., transient conditions as opposed to steady state conditions).
2. System loading values equal to or more than 100%.
Section 2 introduces the new concept of workspace that becomes indispensable once the assumption
of steady state conditions has been abandoned. Section 3 introduces the equally critical concept of
system loading, which becomes necessary once we assume the possibility of overloading the system
above 100% of its capacity (as the term system utilisation becomes inappropriate). Section 4
introduces the SimEvents model used to run the simulations. Section 5 presents results from
SimEvents and results from the Matlab code. Conclusions are drawn in section 6.
2 THE CONCEPT OF A WORKSPACE
A new term will be introduced in this paper, that of the workspace. A workspace is the period of
time over which a variable is calculated (e.g., the round trip time) or the period of time over which a
simulation is run. In classical design of elevator systems, it is customary to calculate the value of
the round trip time over one round trip. In such cases, it can be assumed that the workspace is one
round trip. In cases where the elevator system is simulated for finite periods of time, then the
simulation will be equivalent to the workspace. It is for example customary to simulate the elevator
system for a period of 5, 10 or 15 minutes (300, 600 or 900 seconds respectively). Passengers are
generated for the duration of the simulation time, but the simulation continues until the last
passenger has been processed (i.e., has arrived at his/her target floor and alighted). In queuing
theory equation are derived that assume steady state conditions are achieved (e.g., Little’s formula),
which is equivalent to setting the workspace (i.e., simulation time) to infinity. As discussed earlier,
work in [1], 4], [5] and [6] make such an assumption and derive steady state probabilities of the
variables of interest. Three cases of workspace values are listed in Table 1 below.

Modelling of Elevator Traffic Systems Using Queuing Theory 11
Table 1: Various values of the workspace.
Case The value of the workspace
Calculation of the round trip time One round trip
Simulation (transient conditions) The simulation time which is expected to be larger than the
round trip time (e.g., 300 s, 600 s, 900 s)
Steady state conditions Infinity
It is unusual in elevator traffic simulation to use long simulation workspaces that lead to steady state
conditions, as this would lead to excessive queue lengths and excessive waiting, unless the system
has been overdesigned in order to cope.
Once the concept of an infinite workspace has been abandoned, it is important to note that
using different workspace values will lead to different results. For example using a workspace of
15 minutes would result in a longer passenger waiting time and a larger value for the average queue
length compared to using a workspace of 5 minutes. It is thus meaningless to enquire about the
average passenger waiting time or the average queue length without specifying the workspace (i.e.,
the simulation time).
3 SYSTEM LOADING
As discussed earlier, the system loading is an important concept in the design process. By varying
the system loading, the designer can test the system performance. In cases where the design is
using a finite workspace, the system loading can be set to exceed the capacity of the system for
finite periods in time.
The corresponding term usually used in queuing theory is system utilisation. However, by
definition, the system utilisation cannot exceed 100%, as it is meaningless to say that a server is
occupied for more than 100% of the time. For these reasons, when attempting to subject the system
to loading in excess of 100%, it is more appropriate to use the term system loading.
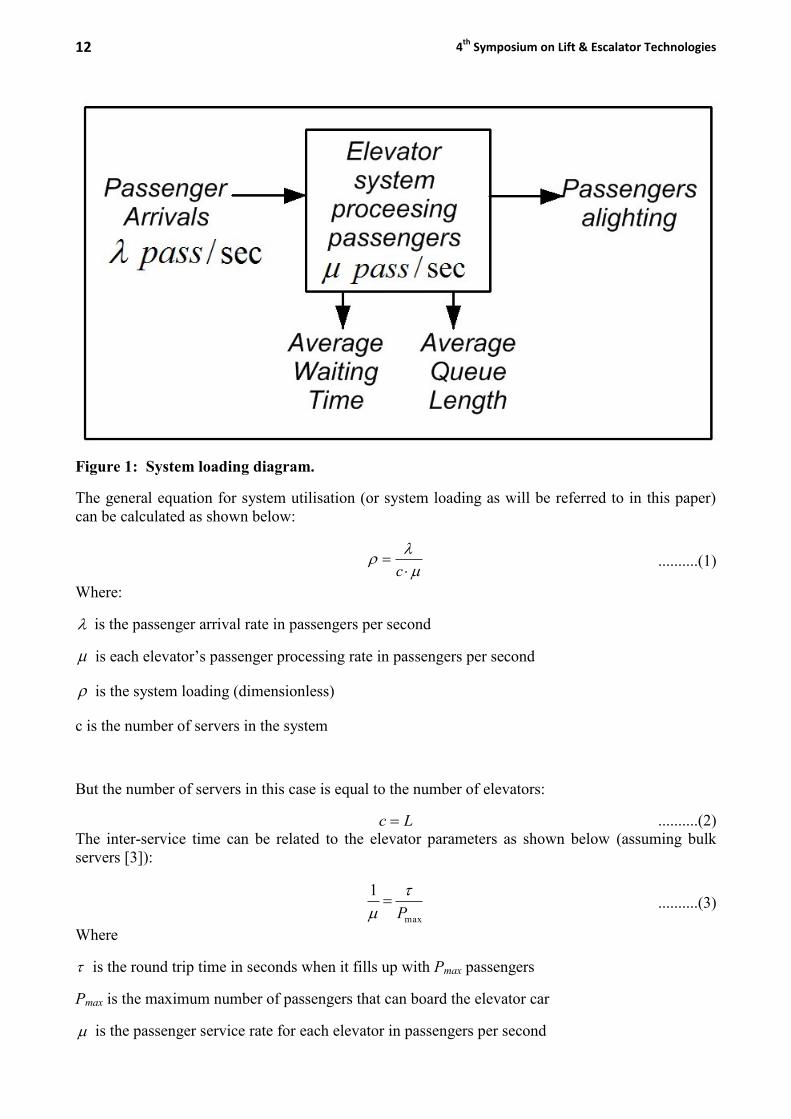
The emphasis on the arrival rate as an input to the system (in order to vary the system
loading) is shown diagrammatically in Figure 1. The system has been designed for a passenger
processing rate of passengers per second (or c in the case of multiple servers). The system is
subjected to a passenger arrival rate of passengers per second. Once the system has been
simulated for a period of time equal to the workspace (WS), the performance figures of average
queue length and average waiting time can be extracted. By varying the value of above and
below the value of , the system loading car set to value below and above 100%, respectively.
12 4th
Symposium on Lift & Escalator Technologies
Figure 1: System loading diagram.
The general equation for system utilisation (or system loading as will be referred to in this paper)
can be calculated as shown below:
c ..........(1)
Where:
is the passenger arrival rate in passengers per second
is each elevator’s passenger processing rate in passengers per second
is the system loading (dimensionless)
c is the number of servers in the system
But the number of servers in this case is equal to the number of elevators:
Lc ..........(2)
The inter-service time can be related to the elevator parameters as shown below (assuming bulk
servers [3]):
max
1
P
..........(3)
Where
is the round trip time in seconds when it fills up with Pmax passengers
Pmax is the maximum number of passengers that can board the elevator car
is the passenger service rate for each elevator in passengers per second
Modelling of Elevator Traffic Systems Using Queuing Theory 13
Substituting (2) and (3) in (1) gives:
maxPL
..........(4)
Noting that:
L
P
..........(5)
Where
P is the average number of passengers boarding the elevator car
Then substituting (5) in (4) gives:
maxP
P ..........(6)
...which is only valid for system loading values smaller than or equal to 100%.
This shows that the average car loading will in fact to equal to system loading. The work in [8] was
based on a system loading evaluated as the ratio of the car loading. This was valid as the scope of
the graph did not cover system loadings exceeding 100%. However, in cases where the system
loading exceeds 100% loading, this measure becomes inadequate. It is then better to use the ratio of
the arrival rate divided by effective service rate, shown in equation (7) below.
L ..........(7)
4 THE USE OF SIMEVENTS
SimEvents is a graphical and modular discrete event simulation tool that is part of Matlab
(specifically it is a toolbox within Simulink). It allows the user to build and simulate discrete event
systems, and extract meaningful data about the performance of the system such as queue lengths,
waiting times and system utilisation.
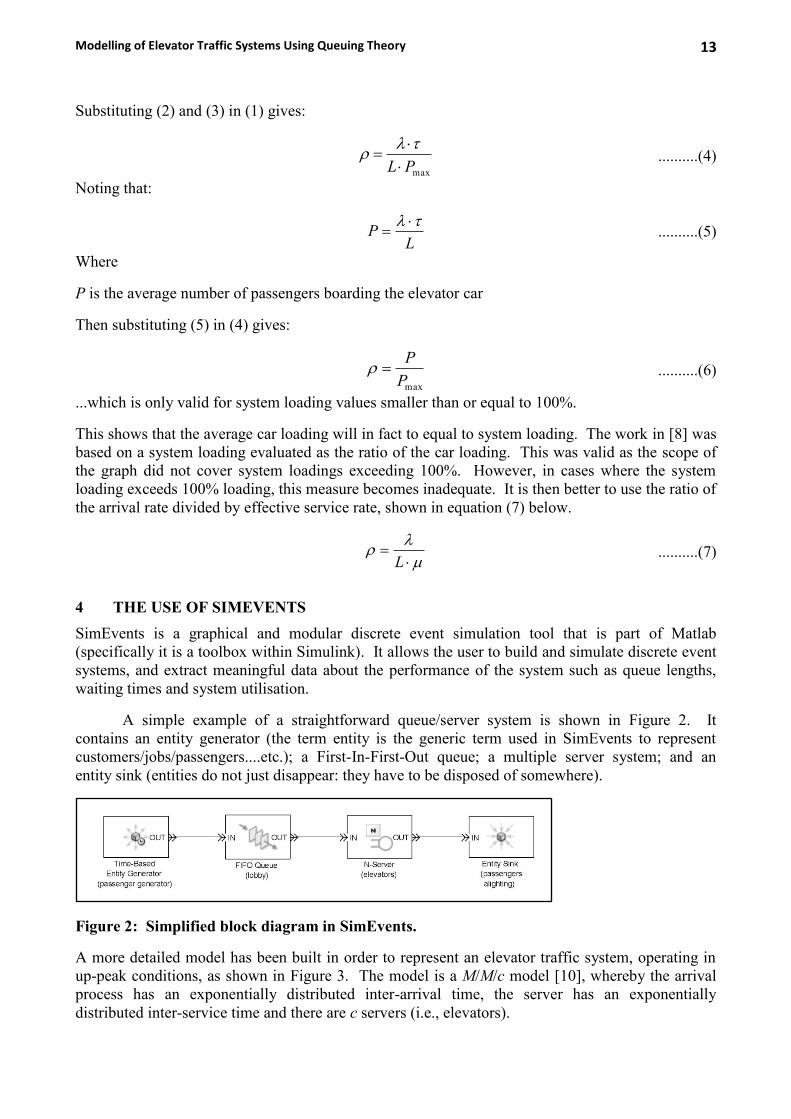
A simple example of a straightforward queue/server system is shown in Figure 2. It
contains an entity generator (the term entity is the generic term used in SimEvents to represent
customers/jobs/passengers....etc.); a First-In-First-Out queue; a multiple server system; and an
entity sink (entities do not just disappear: they have to be disposed of somewhere).
Figure 2: Simplified block diagram in SimEvents.
A more detailed model has been built in order to represent an elevator traffic system, operating in
up-peak conditions, as shown in Figure 3. The model is a M/M/c model [10], whereby the arrival
process has an exponentially distributed inter-arrival time, the server has an exponentially
distributed inter-service time and there are c servers (i.e., elevators).

14 4th
Symposium on Lift & Escalator Technologies
The model allows the workspace time to be varied whereby passengers will be generated for
the duration of the workspace, and the servers are then allowed to continue processing any
passengers remaining in the system.
Figure 3: Detailed block diagram used in SimEvents in order to simulate the elevator system.
It is important to remember that nominal simulation time (the workspace) will be usually different
from the actual simulation time. To illustrate such a difference, a queuing system has been
simulated in SimEvents. The simulation time was set to 900 seconds. However, at the 900 second
point, passengers were still present in the queue, as shown in Figure 4. The system continues
processing the passengers until all have been processed through the server (i.e., elevators) and
discharged, which takes place at the point in time of 985.6 s. Although the nominal simulation time
is 900 seconds, the actual full simulation time is 985.6 s in order to allow the system to clear all the
passengers waiting in the queue.
Figure 4: Number of passengers in the queue during the simulation.

Modelling of Elevator Traffic Systems Using Queuing Theory 15
5 RESULTS
In order to verify the results obtained from SimEvents, a Matlab code was written that also
generated the average queue length and the average waiting time for passengers.
5.1 Effect of system loading on the AWT and the AQL
In the analysis below, system loading values have been varied from 0.1 to 2 (i.e., 10% to 200%).
As the workspace in this case is finite (i.e., not steady state condition), the queue lengths and
waiting times at system loading values of 100% will not be infinite, but will depend on the
workspace duration. The results from the SimEvents package were compared to the results from
the Matlab code and are shown in Figure 5 extracted from [8]. Good agreement can be seen in
general.
Figure 5: Comparison of the results from the SimEvents software and the Matlab code.
5.2 The effect of the workspace on the AWT and the AQL
The Matlab code was used in order to understand the effect of the workspace duration on the
average waiting time and average queue length. Workspace values ranging from 300 seconds to
2700 seconds in steps of 300 seconds were used at a system loading of 100% (i.e., 1 ). In each
case the average waiting time and the average queue length were recorded. As can be seen in
Figure 6 the added trend-lines show that there is a near linear relationship between the system
loading and the average waiting time and the average queue length, at a system loading of 100%.

16 4th
Symposium on Lift & Escalator Technologies
Figure 6: The effect of the workspace on the average waiting time and the average queue
length at 100% system loading ( 1 ).
6 CONCLUSIONS
The concept of a workspace as used in elevator traffic simulation has been introduced. It is the
length of time over which a variable is calculated or over which a simulation is run. The concept of
a workspace is closely linked to elevator traffic simulation. Traditional queuing theory analysis
assumes steady state conditions when deriving the equations for the average waiting time and the
average queue length. The concept of a workspace however assumes finite running time and thus
transient conditions. Such an assumption allows the designer to subject the elevator traffic system
to system loading values in excess of 100%. This could represent real life conditions such as an
increase in the population of a building, or an under-designed elevator traffic design.
A model in SimEvents has been developed that can be used to provide a macroscopic view
of the operation of an elevator traffic system. It has been used to show the effect of system loading
values in excess of 100% on the average waiting time of passengers and the average queue lengths.
The results have also been compared to results from a Matlab code, and good agreement has been
found.
The effect of the duration of the workspace was also investigated at system loading values of
100%. At 100% loading a conventional queue-server system under steady state conditions would
be overloaded and waiting time and queue length would approach infinity. However, at finite
values of the workspace, finite values of the waiting time and queue length will be attained. It was
shown that there is a near linear relationship between the workspace duration, the average waiting
time and the average queue length.

Modelling of Elevator Traffic Systems Using Queuing Theory 17
REFERENCES
[1] N. A. Alexandris, G. C. Barney, C. J. Harris, “Multi-car lift system analysis and design”,
Applied Mathematical Modelling, 1979, Volume 3 August, pp. 269-274.
[2] R. Braun, “Need a Lift? An Elevator Queueing Problem”, United Technologies Research
Centre, 14/8/2003, pp 1-28.
[3] Norman T. J. Bailey, “On Queueing Processes with Bulk Service”, Journal of the Royal
Statistical Society, Series B (Methodological), Vol. 16, No. 1 (1954), pp. 80-87.
[4] N. A. Alexandris, G. C. Barney, C. J. Harris, “Derivation of the mean highest reversal floor
and expected number of stops in lift systems”, Applied Mathematical Modelling, Volume 3,
August 1979, pp. 275-279.
[5] N. A. Alexandris, C. J. Harris, G. C. Barney, “Evaluation of the handling capacity of multi-
car lift systems”, Applied Mathematical Modelling, 1981, Volume 5, February, pp. 49- 52.
[6] N. A. Alexandris, “Mean highest reversal floor and expected number of stops in lift-stairs
service systems of multi-level buildings”, Applied Mathematical Modelling, Volume 10,
April 1986, pp. 139-143.
[7] S. Markon, H. Kita, H. Kise, T. Bartz-Beielstein, “Control of Traffic Systems in Buildings”,
Springer, 2006.
[8] Areej Jarrar, Islam Tayeh, Weam Ghanem, “The use of Queuing Theory to Assess
Passenger Waiting Time and Queue Length”, Final Year Graduation Project Report,
Mechatronics Engineering Department, The University of Jordan, Supervisor: Lutfi Al-
Sharif, April 2013.
[9] G.C.Barney, “Elevator Traffic Handbook”, Taylor & Francis, 2003.
[10] Hamdy A. Taha, “Operations Research: An Introduction”, ninth edition (international
edition), 2011, Pearson.
BIOGRAPHICAL DETAILS
Lutfi Al-Sharif received his Ph.D. in lift traffic analysis in 1992 from the University of
Manchester. He worked for 9 years for London Underground, London, United Kingdom in the area
of lifts and escalators. In 2002, he formed Al-Sharif VTC Ltd, a vertical transportation consultancy
based in London, United Kingdom. He has 17 published papers in peer reviewed journals the area
of vertical transportation systems and is co-inventor of four patents. He is currently Associate
Professor in the Department of Mechatronic Engineering at The University of Jordan, Amman,
Jordan.
Ahmad M. Abu Alqumsan graduated from The University of Jordan with a degree in
Mechatronics Engineering in 2011. His research interests include elevator traffic analysis, robotics,
and coordinate measuring machine (CMM). He is currently a post-graduate student at the Jordan
University of Science & Technology (JUST).
Weam Ghanem, Islam Tayeh and Areej Jarrar graduated from The University of Jordan with a
degree in Mechatronics Engineering in 2013.

18 4th
Symposium on Lift & Escalator Technologies