modelling future trends in urban no2 to 2020: and some questions arising tim oxley helen apsimon...
TRANSCRIPT
MODELLING FUTURE TRENDS IN URBAN NO2 TO 2020:
and some questions arising
Tim OxleyHelen ApSimonAyman Elshkaki
Tessa Lennartz -WalkerUK National Focal Centre for
Integrated Assessment Modelling
Imperial College London
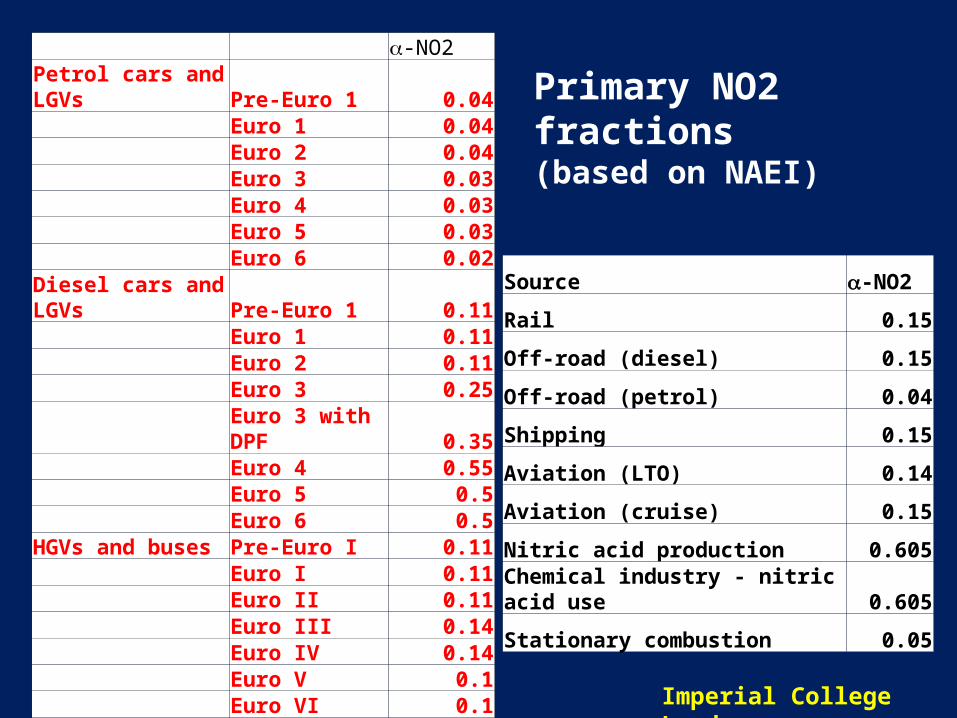
-NO2Petrol cars and LGVs Pre-Euro 1 0.04 Euro 1 0.04 Euro 2 0.04 Euro 3 0.03 Euro 4 0.03 Euro 5 0.03 Euro 6 0.02Diesel cars and LGVs Pre-Euro 1 0.11 Euro 1 0.11 Euro 2 0.11 Euro 3 0.25 Euro 3 with DPF 0.35 Euro 4 0.55 Euro 5 0.5 Euro 6 0.5HGVs and buses Pre-Euro I 0.11 Euro I 0.11 Euro II 0.11 Euro III 0.14 Euro IV 0.14 Euro V 0.1 Euro VI 0.1Motorcycles All 0.04
Source -NO2
Rail 0.15
Off-road (diesel) 0.15
Off-road (petrol) 0.04
Shipping 0.15
Aviation (LTO) 0.14
Aviation (cruise) 0.15
Nitric acid production 0.605
Chemical industry - nitric acid use 0.605
Stationary combustion 0.05
Primary NO2 fractions(based on NAEI)
Imperial College London
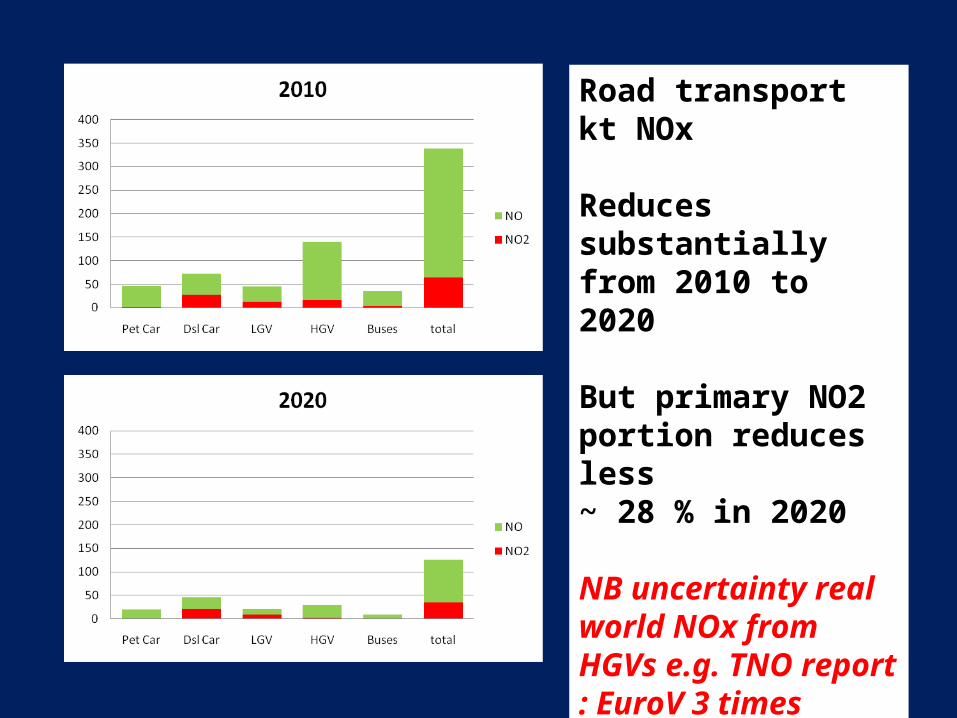
Road transport kt NOx
Reduces substantially from 2010 to 2020
But primary NO2 portion reduces less~ 28 % in 2020
NB uncertainty real world NOx from HGVs e.g. TNO report : EuroV 3 times higher than projected in city driving conditions. (? Euro VI test cycle)

shallow canyons
suburbs
deep street canyons dense pop. city centreOpen roads
rural
Road-side increment NOx, primary NO2
Emissions each UK road link NOx,NO2,PM,CO2 etc (iMOVE)
Traffic flow, ave speed, vehicle mix+ data base emission factors
Superimpose on background concentration NOx, primary NO2 from UK sources
Grid 1x1 km emissions road transport
Other UK emissions PPM model
Add contributions imported from non-UK sources including shipping
Calculate NO2 concentrations from total NOx allowing for primary (frac
BRUTAL (UKIAM)-> modelling of urban air quality
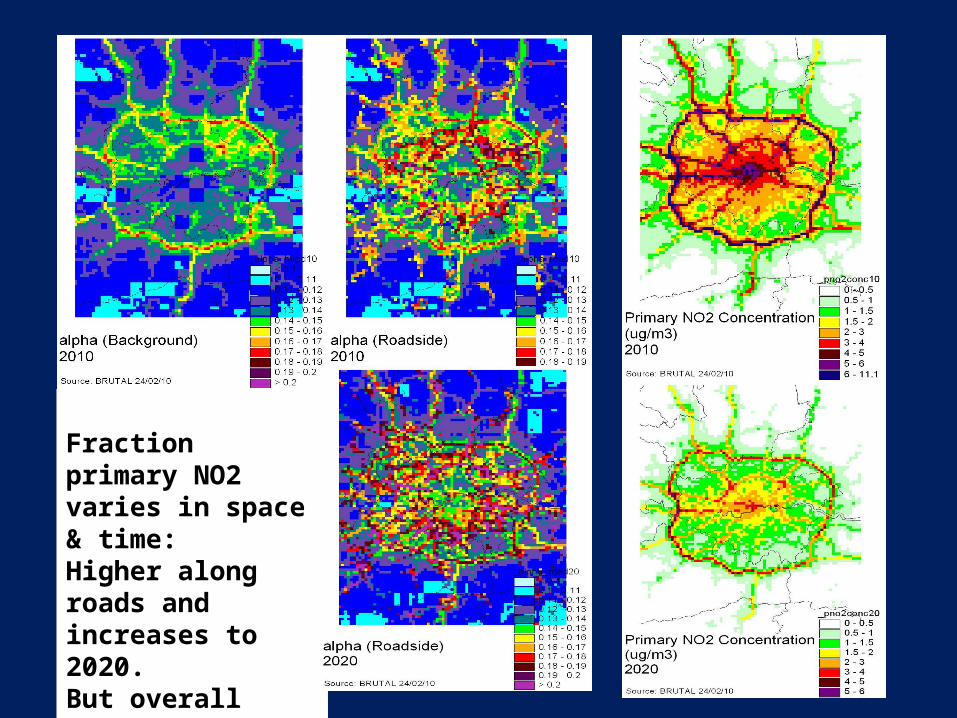
Fraction primary NO2 varies in space & time:Higher along roads and increases to 2020.But overall reductions in NOx still lead to lower overall primary NO2 in 2020
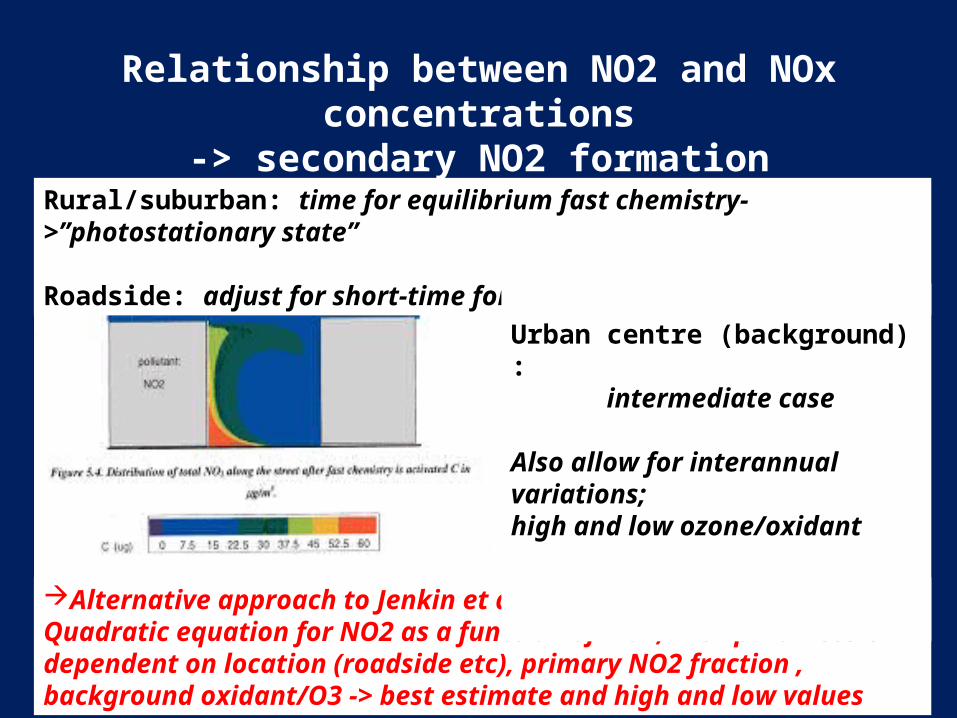
Relationship between NO2 and NOx concentrations-> secondary NO2 formation
Alternative approach to Jenkin et al empirical relationship.Quadratic equation for NO2 as a function of NOx, with parameters dependent on location (roadside etc), primary NO2 fraction , background oxidant/O3 -> best estimate and high and low values
Rural/suburban: time for equilibrium fast chemistry->”photostationary state”
Roadside: adjust for short-time for chemistry to increase NO2
Urban centre (background) : intermediate case
Also allow for interannual variations;high and low ozone/oxidant

Compared against data 2005, 2009,2010
Generally represents measured data well (i.e.within min-max range) except for occasional sites where pessimistic
Sensitivity of NO2 v NOx to primary fraction
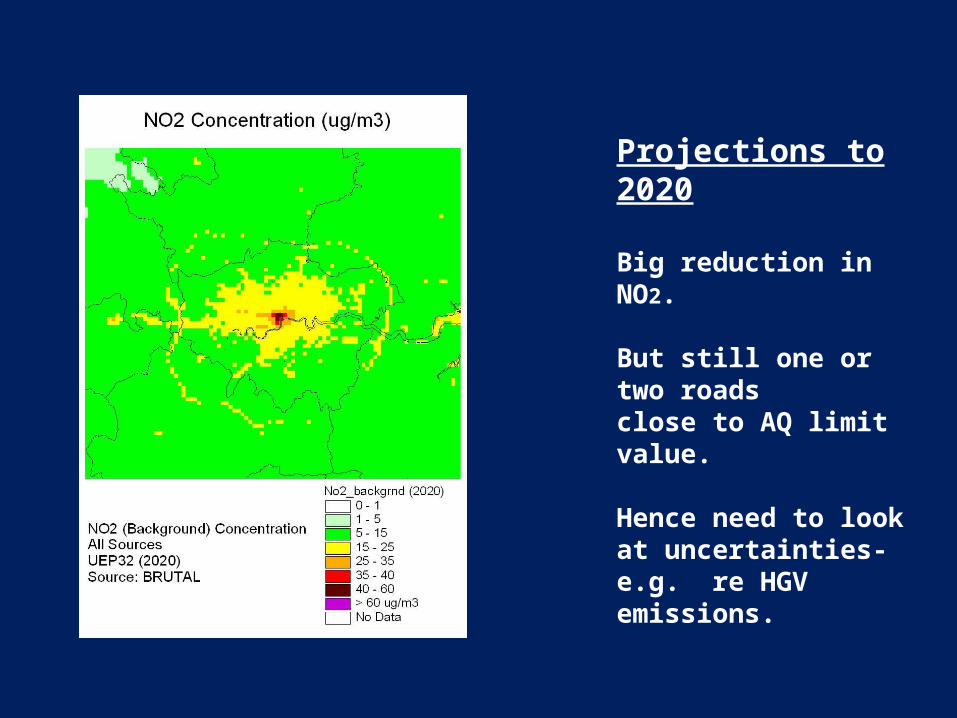
Projections to 2020
Big reduction in NO2.
But still one or two roadsclose to AQ limit value.
Hence need to look at uncertainties- e.g. re HGV emissions.
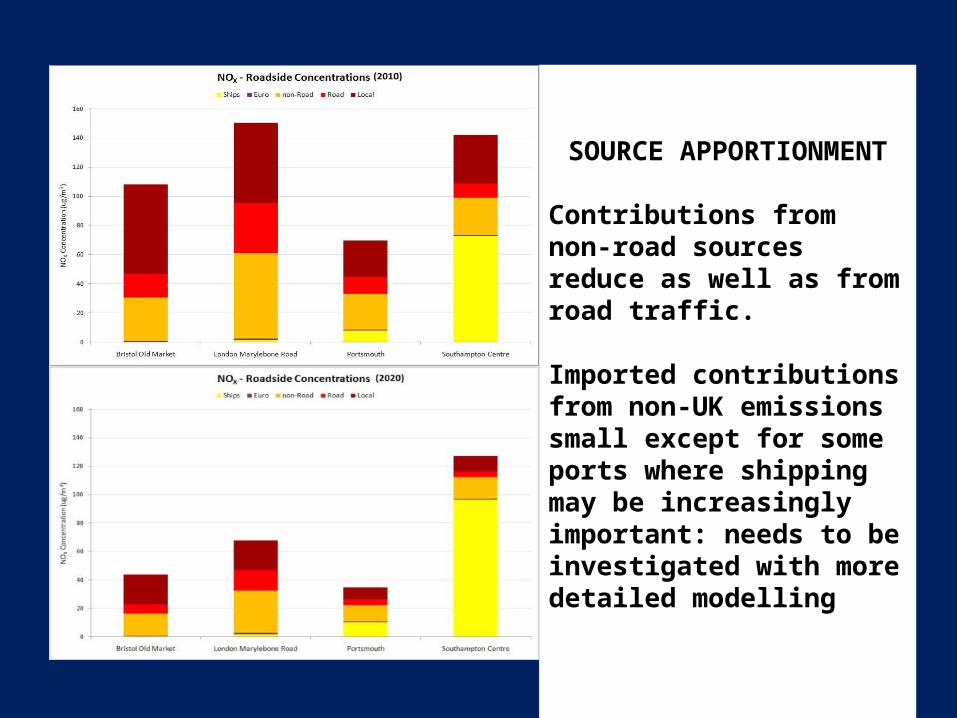
SOURCE APPORTIONMENT
Contributions from non-road sources reduce as well as from road traffic.
Imported contributions from non-UK emissions small except for some ports where shipping may be increasingly important: needs to be investigated with more detailed modelling

CONCLUSIONS RE FUTURE NO2
Projections imply large reduction in NOx and hence reduction in NO2 despite increasing proportion primary NO2 from traffic
Real-world measurements (e.g. TNO) imply higher NOx emissions Euro V HGVs (? and buses) in urban conditions than in current emission projections
For some ports shipping may be increasingly important
Model evaluation-> more uncertainty road-side concentrations where traffic mix crucial