modelling aquaculture impacts. mom (modelling - ongrowing fish farms - monitoring) this model...
TRANSCRIPT

Modelling aquaculture impacts

MOM (Modelling - Ongrowing fish farms - Monitoring)This model developed in Norway is a three component model for
modelling organic impacts.The fish sub-model simulates the release of particulate material from
the farm based on information on the feeding rate and composition of food. Uptake, retention and excretion are all calculated in relation to the temperature and size of the fish.
The output from this sub-model provides the initial conditions for the dispersion sub-model which simulates dispersion and sedimentation rates of excess feed and faecal pellets.
The sediment sub-model calculates the maximum decomposition at the seabed for a particular scenario and oxygen concentration in the benthic boundary layer is also calculated.
The combination of these sub-models allows the calculation of maximum fish production that a site can sustain without adverse benthic effects.

AWATS - Aquaculture Waste Transport SimulatorThe AWATS model is a mathematical model to simulate
tidal and wind-driven currents, waves, and the resulting dispersion of fish food and faecal matter in coastal areas.
This model was one of the first aquaculture organic impact models to include complex models of the descriptions of spatially varying current around the study area.
In addition, wind driven flow and waves are also included as processes having an effect on the subsequent dispersal of discharged particulate material.
This model originally lacked resuspension which causes deposited particles to be re-entrained into near bed flows and advected away from the initial footprint area.

DEPOMOD
This model is a lagrangian particle tracking model which predicts the dispersion of particulate wastes arising from aquaculture activities and associated benthic impacts.
It was developed from a sewage dispersion model also developed by SAMS, but required extensive modification to data input requirements and validation for the fish farming environment.
There are three main modules: • particle tracking, • resuspension • benthic response. Predictions of solids accumulation (g m-2 yr-1) determine
the benthic response using a relationship between solids accumulation and benthic indices validated for Scottish fish farms.

Current profiles in stratified waters are complex. Particles settling at different rates are subject to current shear and turbulence
0 C u rre n t V e lo c ity
S ou rce
C o a rse M ed iu m
F in e

MERAMOD
• Is a conversion of Depomod from cols water areas to temperate areas
• There is an addition of wild fish component to take into account the utilisation of waste feed by wild fish under the cages
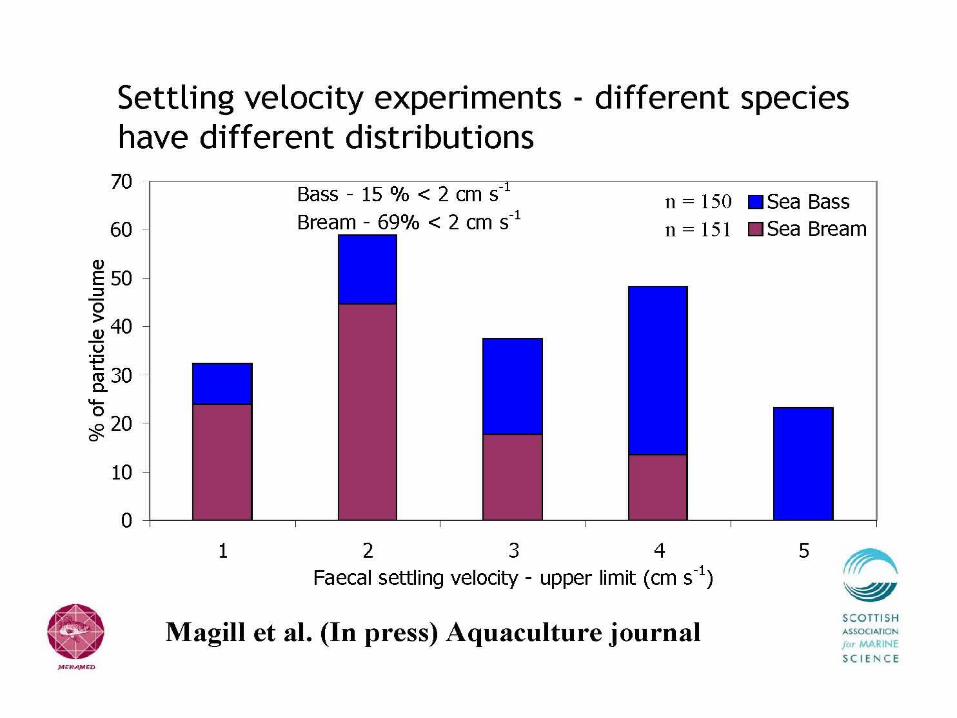
• It also takes into account the different species and behaviour of faecal pellets in the water column.
• It is validated for cage farms in the Mediterranean

FLOW OF IN FORM ATION THROUGH M ERAM OD
MERAMOD MODULES (I)
GRID GENERATION MODULEINPUT• CAGE POSITIONS• STATION POSITIONS• BATHYMETRY
INPUT• CAGE POSITIONS• STATION POSITIONS• BATHYMETRY
INPUT• CAGE POSITIONS• STATION POSITIONS• BATHYMETRY
watercolumn
sea surface
GRID GENERATION MODULEINPUT
•CAGE POSITIONS
•STATION POSITIONS
•BATHYMETRY
PARTICLE TRACKING MODULE
•DIFFERENTIAL SETTLING OF PARTICLES
• ADVECTION OF PARTICLES BY CURRENTS
• REPRESENTATION OF CURRENT SHEAR
• TURBULENCE (RANDOM WALK)
WILD FISH MODULE•Input pelagic/ benthic feeding
effects by wild fish
sea surface
INPUT
•FEED INPUT/ SPECIES CAGE BY
CAGE; HYDROGRAPHIC DATA;
SETTLING VELOCITY DATA
•VARYING LEVELS OF
SCENARIO COMPLEXITY
MERAMOD modules (I)

MERAMOD MODULES (II)
INPUT
• VALIDATED RESUSPENSIONMODEL PARAMETERS
(e.g. critical resuspension, depositionshear stress; erodibility constant)
INPUT
• VALIDATED RESUSPENSIONMODEL PARAMETERS
(e.g. critical resuspension, depositionshear stress; erodibility constant)
INPUT
• VALIDATED RESUSPENSIONMODEL PARAMETERS
(e.g. critical resuspension, depositionshear stress; erodibility constant)
BENTHIC MODULE
• BENTHIC COMMUNITYSUCCESSION LINKED TO QUANTITATIVE INPUTS OFSOLIDS
BENTHIC MODULE
• BENTHIC COMMUNITYSUCCESSION LINKED TO QUANTITATIVE INPUTS OFSOLIDS
carbon/ solidsaccumulationg m-2 yr-1
underlyingsedimentlayer
bed surface
watercolumn
RESUSPENSION & CARBON DEGRADATION
• RESUSPENSION FROM BED
• CARBON DEGRADATION - G MODEL
RESUSPENSION & CARBON DEGRADATION
• RESUSPENSION FROM BED
• CARBON DEGRADATION - G MODEL
BENTHIC MODULE• BENTHIC COMMUNITY SUCCESSION LINKED
TO QUANTITATIVE INPUTS OF SOLIDS carbon/ solidsaccumulationg m-2 yr-1
underlyingsedimentlayer
bed surface
watercolumn
FLUX/DEPOSITION MODULE• FLUX/ DEPOSITION ON BED
• CARBON DEGRADATION - G MODEL
MERAMOD modules (II)

Crucial input data for modelling
There are a number of key input data issues which need to be addressed when developing an existing model for application in a different environment. Although the principal physical processes can be applied to different areas, the input data used to drive these components need to be critically assessed.


Sediment trap experiments (model validation)Sediment trap experiments (model validation)
75 cm
H:D = 5:1 ratio
x6 or x12x6x6
Upper (U) Lower (L)Water column
(WC)
1. Deploy2. Retrieve, filter, dry3. Calculate observed flux(total waste particulate material = g solids m-2 yr-1)4. Check calculation


Typical impact footprints
Dispersive sitesStrong currents
Impact over a larger area (up to 100 m) but less intense
Typical of fish farms in Scotland
Depositional sitesWeaker currents
Impact over a limited area (up to 30 m)
But more intense
Typical of farms in Greece

R2 = 0.82
0
20
40
60
80
100
120
140
160
110100100010000100000
Spe
cies
(no
. m-2
)
020406080100120140160
110100100010000100000
R2 = 0.52
1000
10000
100000
1000000
110100100010000100000A
bund
ance
(In
d. m
-2)
1000
10000
100000
1000000
110100100010000100000
1
10
100
1000
110100100010000100000
Species
Abundance
Modelled flux (g m-2 yr-1)
020004000600080001000012000140001600018000
110100100010000100000
R2 = 0.71
0.0
1.0
2.0
3.0
4.0
5.0
6.0
7.0
110100100010000100000
H'
0.0
1.0
2.0
3.0
4.0
5.0
6.0
7.0
110100100010000100000
Model Model validationvalidation
Shannon Weiner
Use benthic data to establish relationships between benthic indices and flux predictions

Use of models in knowledge transfer
100 150 200 250 300 350 400200
250
300
350
400
450
0 A5 A1 0 A2 5 A
5 0 A
N
a . t i g h t l y c l u s t e r e d ( s q u a r e )b . l a r g e l y s p a c e d o u t ( c i r c u l a r )
S o l i d s f l u x ( g m y r )-2 -1
100 m
0 100 200 300 400 500 600
Easting (m )
0
100
200
300
400
500
600
Nor
thin
g (m
)
0 A5 A1 0 A2 5 A
5 0 A
5 0 0
2 5 0 0
5 0 0 0
1 0 0 0 0
3 0 0 0 0
Closely spaced cages Largely spaced

Sedimentation – 4 cages weak current
200 300 400 500 600 700 800
4 cages C M 10
200
300
400
500
600
700
800
500
1000
2000
3000
4000
5000
6000
8000
10000
14000
18000
Sensitive habitats

Sedimentation – 4 cages strong current
200 300 400 500 600 700 800
4 cages CM 06
200
300
400
500
600
700
800
500
1000
2000
3000
4000
5000
6000
Sensitive habitats