modelling and simulation of a prt network - wit press · modelling and simulation of a prt network...
TRANSCRIPT

Modelling and simulation of a PRT network
M. Castangia & L. Guala Systematica SpA, Milan, Cagliari, Italy
Abstract
This paper describes the model simulation of a Personal Rapid Transit (PRT) network for the project of a “carbon neutral” town. The challenges faced were many: a new, largely unproven technology, a high number of stations, and a very concentrated peak demand. A mixed approach was used for the simulation: a “traditional” static model for the simulation of large scale effects and a dynamic model with new software specifically designed to simulate PRT systems. The final model was a combination of modelling and forecasting techniques. Several scenarios were tested, the results of the modelling runs allowed to define the performance of the system, a metric for the Level of Service (LoS) of the PRT system as well as a Group Rapid Transit (GRT) strategy to cope with peak demand. The first lot of this PRT system is now operational: it is the first PRT system in the world in commercial operation. Keywords: Personal Rapid Transit, PRT, Group Rapid Transit, traffic simulation, transport network, carbon neutral city, transport model, level of service, LOS, dynamic model.
1 Introduction
In December 2006, a call for tender for the master-plan of a carbon-free town in the Middle East was issued. The initiative was daring and the task challenging: a town for 50,000 inhabitants and business activities that would not generate carbon dioxide nor waste. Energy should come entirely from carbon-free, renewable sources, water and waste should be recycled and reused. All the comforts of a modern lifestyle should be guaranteed to residents and workers. Systematica (www.systematica.net) was invited by a major European architecture firm to submit a bid; our role was to define a transport strategy that would respond to the severe and exacting requirements of the tender.
www.witpress.com, ISSN 1743-3509 (on-line) WIT Transactions on The Built Environment, Vol 116, © 2011 WIT Press
Urban Transport XVII 459
doi:10.2495/UT110391
It was immediately clear that combustion-engine vehicles could not be allowed in the town and a bespoke internal transport system was needed. After reviewing several options, Systematica proposed a cutting edge innovative system: the Personal Rapid Transit (PRT), based on “automated taxis” running on-demand on exclusive guide-ways. See Irving et al. [1] for an overview. The PRT system was to be complemented by a high capacity bidirectional light rail line crossing the town from North to South. This proposal wasn’t without its downsides: firstly, no real-world examples of PRT systems were available to draw practical experience and data from, all the PRT systems existing being at experimental or conceptual stage. Nevertheless the PRT promised a far greater quality of transport and comfort than any other system available. Innovation was to be one of the trademarks of the “city of the future”, and no innovation comes without risk. The challenge facing our team was great: design a transport system for “the city of the future” [2].
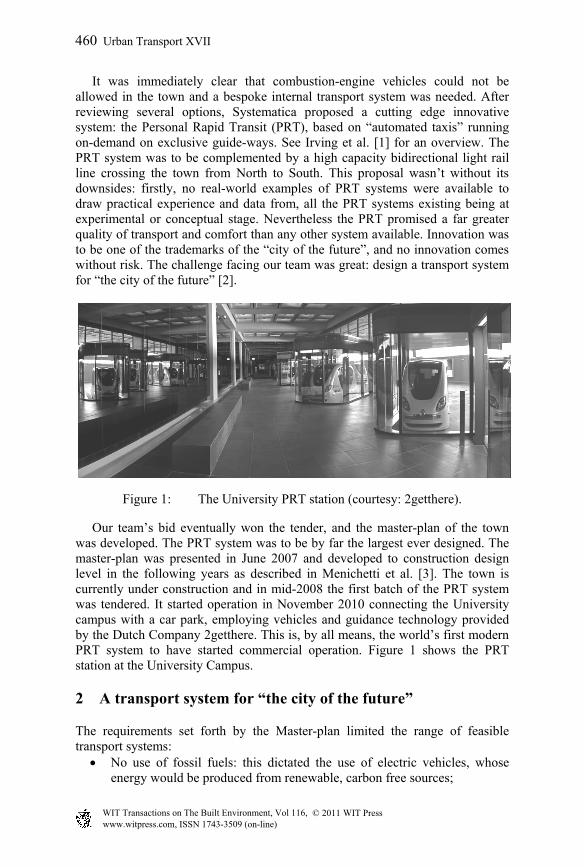
Figure 1: The University PRT station (courtesy: 2getthere).
Our team’s bid eventually won the tender, and the master-plan of the town was developed. The PRT system was to be by far the largest ever designed. The master-plan was presented in June 2007 and developed to construction design level in the following years as described in Menichetti et al. [3]. The town is currently under construction and in mid-2008 the first batch of the PRT system was tendered. It started operation in November 2010 connecting the University campus with a car park, employing vehicles and guidance technology provided by the Dutch Company 2getthere. This is, by all means, the world’s first modern PRT system to have started commercial operation. Figure 1 shows the PRT station at the University Campus.
2 A transport system for “the city of the future”
The requirements set forth by the Master-plan limited the range of feasible transport systems:
No use of fossil fuels: this dictated the use of electric vehicles, whose energy would be produced from renewable, carbon free sources;
www.witpress.com, ISSN 1743-3509 (on-line) WIT Transactions on The Built Environment, Vol 116, © 2011 WIT Press
460 Urban Transport XVII

Low energy consumption: a very efficient energy management and minimizing the impact of the transport system on the overall energy usage were required;
High level of innovation: the ground-breaking image of the enterprise required a high content of innovation and a very novel and futuristic image;
On demand, individual service: the system had to avoid the hassles and discomfort of on-schedule collective transport and vehicle interchanges. Cultural specifications required that anyone should be able to reserve a ride, without sharing it with strangers. Also required were: car-like level of comfort, ease of use; minimal queues, waiting time, distress for the users;
Very high level of accessibility: The harsh local climate imposed that the maximum acceptable walking distance in the open air be less than 150m;
Minimal space occupied by the system: the town was designed as a “walled citadel” with high building density, and space was precious. The climate dictated that the streets should be narrow, for maximum shading and minimum penetration of hot desert winds. They would have short winding sections with tight corners, the transport system had therefore to rely on small, agile vehicles;
Transportation guaranteed at all times: the PRT should be available at any time of any day. In particular, wait time at night hours had to be minimized;
Minimal visual impact, No vehicles in the pedestrian area: the entire “ground floor” of the citadel was reserved to pedestrians and the main transport system had to travel on separated routes. After considering elevated guide-ways, the decision was taken to place the transport system below the pedestrian streets, to minimize its visual impact and exposure to direct sunlight.
The Personal Rapid Transit (PRT) system appeared to fulfil all these requirements better than any alternative: PRT offered a “personal ride” without pre-defined origins and destinations. It guaranteed a high level of safety, no congestion, reduced space occupation, low energy consumption and a greatly innovative image. It was clear that the specificity of this project determined choices that would not be fit for any other application, such as an existing city or district, and that the transport system chosen would not be applicable elsewhere with similar features and to such an extent.
3 Modelling the network
3.1 The modelling tools
Systematica produced a “static” macro-simulation model of the PRT network of the entire citadel; “static” and “dynamic” macro- and micro-simulation models of a part of the network named “Delivery Phase 1” (DP1) and designed and
www.witpress.com, ISSN 1743-3509 (on-line) WIT Transactions on The Built Environment, Vol 116, © 2011 WIT Press
Urban Transport XVII 461

simulated in detail the network for the University campus. This paper describes the development of the network model of DP1. In its activity as traffic planning consultancy, Systematica employs the macro-simulation package “CUBE-Voyager” by Citilabs (www.citilabs.com) and the micro-simulation software “Paramics” by SIAS (www.sias.com). The obvious choice would have been to use these software packages to model a PRT network, but they proved inadequate for several reasons: they are designed to simulate cars and public transport, with specific features such as human drivers and no supervisory control; they cannot simulate the relocation of empty vehicles; no modelling standards exist as yet to simulate PRT networks; no widely recognized PRT performance evaluation methods were available. Further to this, our team was faced with some specific issues: Frequently changing land use data and frequent evolution of the design, being an ongoing project with a fast pace; No calibration and validation survey data available; Need to yield simulation results and performance assessments according to the project schedule. The DP1 scenario was also unfavourable, being part of a larger network, with limited alternative routes and a temporary configuration.
3.2 The transport simulation model
This task required that the traditional modelling tools should be combined with experimental ones, such as PRT dynamic simulators. The resulting “complex” model allowed improvements and optimize the flows in an iterative and heuristic manner. The PRT Transport Model comprised the following suite of sub-models:
SM1 - Internal Population Growth Model SM2a - PRT Services Pre-Dimensioning Model SM2b - Freight and Waste Transport Services Pre-Dimensioning Model SM3 - Internal Trip Generation Model SM4 - Internal Trip Distribution Model SM5 - PRT Static Simulation Model for Passenger Traffic SM6 - PRT Static Assignment for Vehicular Traffic (full and empty vehicles) SM7 - PRT Dynamic Micro-simulation Model SM8 - PRT Vehicle Dynamics and Energetic Behaviour Model
Modules SM6 and SM7 were developed in cooperation with professor Joerg Schweizer and his team at DISTART (now DICAM-Transport: www.dicam.unibo.it) University of Bologna, Italy; Module SM8 was developed in cooperation with Maurizio Paderi, researcher at DIMECA (dimeca.unica.it) University of Cagliari, Italy.
4 The “traditional” modelling stage
4.1 The macro-simulation runs
The macro-simulation model was built using CUBE-Voyager. The trip matrix was obtained from the land use data and commuter mobility estimations. These
www.witpress.com, ISSN 1743-3509 (on-line) WIT Transactions on The Built Environment, Vol 116, © 2011 WIT Press
462 Urban Transport XVII

matrices were used to compute the generation and attraction values by applying appropriate coefficients from literature (Trip Generation Manuals). The generation and attraction values were then inputted in an ad-hoc distribution model within CUBE-Voyager to obtain the O/D matrix for three peak periods (AM, Noon, PM). In order to simulate the system in its entirety and assess the performance of the PRT, given the freedom of choice of path it allows, a multi modal transport system on two separate levels was defined comprising the pedestrian network (the entire surface street network of DP1) and the PRT network at the lower level. The two networks were connected by means of specific links representing the PRT stations. The pedestrian network was modelled with a speed of 3.6 km/h and no capacity constraints (congestion may occur only at a very high flow level). The PRT network had a length of about 20 km and 32 stops; it was modelled with a speed of 22 km/h (average value estimated in different parts of the network); flow curves were derived from BPR types as defined by HCM [4], modified to have a “square” flow-speed relationship that reproduced the behaviour of the computerized supervisory control system (speed is constant at all V/C values and congestion is controlled). Capacity is assumed at 1500 passengers/hour per direction (occupation rate: 1.25 passengers/vehicle) or 4200 (occupation rate: 3.5 pass./veh.) in GRT mode (Group Rapid Transit: a collective, scheduled service on established high-demand routes, as opposed to the individual on-demand service offered by the PRT).
4.2 The macro-simulation results
The simulation allowed to assess the degree of traffic load in the system, locally and for the full network, in order to feedback to previous modelling steps: network model, land use, etc. The main outputs of the simulation were:
1. flows on the PRT links 2. Flows on the pedestrian network links 3. Verification of the trip paths 4. Flows through the stations 5. Station-to-station trip matrix (input for the micro-simulation model) 6. Pedestrian trip matrix
This macro-simulation model is not a proper PRT trip model, but rather a passenger flow model: it cannot simulate the flow of empty vehicles being relocated among the stations and the outputs are in passenger-trips, rather than vehicle-trips. In order to simulate the empty trips and the consequent effect on capacity, additional steps are needed, which the traditional software is unable to perform. These required the use of a specific, dynamic, micro-simulation model.
5 Static assignment of full and empty vehicles
In order to perform a more detailed and precise simulation of the performance of the PRT system, cooperation with DICAM-Transport, University of Bologna, Italy was established. This team provided the methodology for the full (with
www.witpress.com, ISSN 1743-3509 (on-line) WIT Transactions on The Built Environment, Vol 116, © 2011 WIT Press
Urban Transport XVII 463

passengers) and empty (relocating) PRT vehicle assignment [5]. The static assignment of full and empty vehicles is based on integer-linear programming models. Inputs are the network graph (nodes, links and fixed link costs) and the O/D matrix. The flow of full vehicles is computed using an all or nothing assignment method (link flows equal the sum of shortest path flows for each couple of non-zero entry in the O/D matrix). The empty vehicle assignment is also represented in terms of flows. The basic idea is to add constraints that keep the conservation of flow at each station: if full-vehicle demand is in excess at a station, the model creates a flow of empty vehicles toward that station to match the excess of demand. The objective function to minimize is the sum of the total distance travelled by empty and full vehicles. Figure 2 shows examples of CUBE model outputs of passenger traffic flow (left) and full and empty vehicles flow (right).
Figure 2: Examples of CUBE model outputs.
6 Dynamic simulation of the PRT system
6.1 The ITS software
Dynamic simulation is required to assess, with greater precision, the reliability of the system in terms of:
Temporary lack of capacity causing queues at stations; Network bottlenecks and trip time delays; Limitations of capacity due to perturbations such as deceleration and
acceleration of vehicles at turns, mergers or stations;
www.witpress.com, ISSN 1743-3509 (on-line) WIT Transactions on The Built Environment, Vol 116, © 2011 WIT Press
464 Urban Transport XVII

Observed capacity of stations; Overall level of service (LOS) of the PRT system.
The ITS software, developed at DICAM-Transport, University of Bologna, was employed for the micro-simulation [6]. Systematica cooperated to adapt ITS to this specific project. Figure 3 shows a portion of the network simulated with ITS. Main parameters taken as input by the software are: User profiles, including, for each group of users: a) the stop-to-stop matrix (O/D demand sub-matrix) in terms of vehicular trips; b) the time-interval of the O/D sub-matrix; c) the minimum and maximum boarding/unboarding time of each group of users; Vehicle profiles, including for each homogeneous group of vehicles: a) length of the vehicle; b) comfort acceleration/deceleration; c) emergency deceleration; d) failure deceleration (brick-wall-stop requirement is simulated by assuming a very high value of deceleration); e) maximum brake actuation time. Network profile, including: a) nominal speed for each link; b) number of berths and initial number of vehicles at each PRT stop.
Figure 3: A simulation of part of the network with ITS.
6.2 Inputs for the dynamic simulation
The demand input for the Micro-simulation model is represented by a series of O/D vehicular trips matrices, each referring to a specific user profile:
1. Inbound commuters and visitors; 2. Outbound commuters and visitors; 3. Internal home-based trips; 4. Internal non-home based business trips; 5. Internal leisure trips and errands; 6. School-based trips.
www.witpress.com, ISSN 1743-3509 (on-line) WIT Transactions on The Built Environment, Vol 116, © 2011 WIT Press
Urban Transport XVII 465

The values are the result of the trip distribution, trip cost functions and occupancy assumptions. The model was tested with the following set of initial parameters concerning the network and the vehicles: Network and fleet:
- Network length: 20 km; - PRT stops: n. 32 with 4 to 10 berths each; - Simulated fleet: varies between 480 and 560 vehicles.
Passenger vehicles: - Length: 3860 mm; - maximum comfort acceleration: 2.8 m/s^2 ; - maximum emergency brake deceleration: 5 m/s^2; - maximum failure deceleration: brick-wall stop situation; - Brake actuation time: 0.8 seconds.
6.3 Supervisory control strategy
A headway of 3 seconds between the vehicles was assumed as a reference standard, corresponding to a line capacity of 1200 vehicles/h. However, headway is not constant on the network since an asynchronous follower scheme was implemented in the micro-simulator, and line capacity depends on the instant speed of the vehicles (figure 4). Optimal time-headway, optimal speed and line capacity are all derived from the input parameters [7]. This type of asynchronous supervisor control is very good at managing congestion: when vehicle speeds decrease due to a crowded guide-way (e.g. vehicles slow down for merging), the minimum safety distance decreases as well and capacity increases (if above a critical speed which for this application is approx. 5m/s). The resulting capacity increase allows for exploiting the full potential of the lines and helps prevent instability of the system and local congestion events.
Figure 4: Capacity-speed curve.
0
200
400
600
800
1000
1200
1400
1600
1 3 5 7 9 11 13 15 17 19 21 23 25 27 29 31 33 35 37 39
capa
city
(veh
/h)
speed (km/h)
Capacity (constant safety)
Capacity (constant time headway)
www.witpress.com, ISSN 1743-3509 (on-line) WIT Transactions on The Built Environment, Vol 116, © 2011 WIT Press
466 Urban Transport XVII

6.4 Outputs of the dynamic simulation
Main outputs of the dynamic simulation are: 1. Average wait time at stops; 2. Average trip time; 3. Average distance travelled and average path load factor (distance
travelled with passengers over total distance travelled); 4. Average velocity (total) and average velocity with load; 5. Statistical distribution of wait times at each stop; 6. Trip time matrix (stop-to-stop).
The wait time distribution curves (figure 5) show the percentage of parties served within a certain time at each stop for different scenarios defined by fleet sizes and time intervals.
Figure 5: Example of wait time curves.
7 Level of service (LOS) assessment
7.1 Definition of LOS for a PRT service
For the assessment of simulation results and the re-calibration of the model assumptions and parameters, a new LOS measurement scale was defined, based on the statistical distribution of wait times at each PRT stop. A general observation on all simulation results shows that, while trip times vary very little between scenarios, wait times at stops are considerably affected by exogenous parameters such as fleet size, amount and distribution of demand, number of berths at stops, empty vehicles management etc. A new metric of LOS was defined, based on the distribution of wait times, using as reference the average wait time of the 50th, 90th and 95th percentile of passengers at stations (table 1).
0
10
20
30
40
50
60
70
80
90
100
% o
f ser
ved
part
ies
wait times intervals in seconds
Wait times distribution for 12:00 ‐ 14:00 scenario
MIST Stop
MIST HOR
K13 Stop
K13 HOR
www.witpress.com, ISSN 1743-3509 (on-line) WIT Transactions on The Built Environment, Vol 116, © 2011 WIT Press
Urban Transport XVII 467

Table 1: LOS for PRT operation.
LOS wait time at station (seconds) lower than or equal to: 50th percentile 90th percentile 95th percentile
A 30 60 90 B 60 120 180 C 90 180 300 D 150 300 480 E 240 480 600 F worse worse worse
A stop can be attributed a specific LOS if all conditions defining it are met. An empirical observation of wait time curves suggests that conditions defining A to C levels of service describe stops in equilibrium with their demand. LOS D marks the start of unstable conditions between demand and the system. This is revealed by a change of the shape of the wait curve: stable system conditions produce wait times that follow a steep sigmoid curve, lack of stability results in increasingly multi-inflected, quasi-linear curves (figure 6). As far as the authors are aware, at the time when this paper was written no other LOS definitions or metrics for a PRT service were available in literature.
Figure 6: Example of wait times curves.
0
10
20
30
40
50
60
70
80
90
100
% o
f ser
ved
part
ies
wait times intervals in seconds
Capacity test with 220 PRT RIDES from P1 to 1 (peak hour)
12 veh
16 veh
20 veh
www.witpress.com, ISSN 1743-3509 (on-line) WIT Transactions on The Built Environment, Vol 116, © 2011 WIT Press
468 Urban Transport XVII

7.2 Simulation scenarios
Each scenario modelled differed on the basis of the following variables: Daily Peak periods: Three main daily peak periods were considered (TGPRM [8]): AM: 07:00 to 09:00; Noon: 12:00 to 14:00; PM: 17:30 to 20:00. Trip production capacity of workplaces: to evaluate PRT response to different degrees of demand asymmetry, two main profiles were taken into consideration as defined by TGPRM: - High (Inner CBD) production (less realistic); - Medium (Outer CBD) production (more realistic). GRT strategy and Backup system at pedestrian level: In some simulated scenarios, part of the PRT vehicles would run on schedule as GRT to and from major destinations, and a light backup public transport system was introduced at pedestrian level in the static multimodal model, consequently affecting the dynamic simulation inputs. Combinations of external car parks: The external car parks were concentrated generators of traffic at morning peak, and attractors at evening peak. Different car park combinations were considered. School demand distribution: Two types of school-based trip distributions were considered: 1) all school-related trips reach the dedicated school stop; 2) school-related trips are distributed between the school stop and two neighbouring stops. Fleet size: The number of operating vehicles in the network was varied for each simulation scenario in order to define the optimal number of vehicles.
7.3 The results of the dynamic simulation
The AM peak period appeared to be the most critical: observed demand is both highest and most directional. Polarised demand, such as from external car parks to work destinations, means a bigger share of empty vehicle trips and lower path load factors, (see 6.4. point 3). This results in a reduction of network capacity due to the number of empty vehicles in circulation and, hence, poorer LOS and longer wait times at stops as well as lower energy efficiency. If, in addition, demand poles are at a considerable distance from each other, system performance is further hindered by the difficulty in matching requests with arrivals of empty vehicles at distant stops: this is a typical control problem of delay between action and measured effects that destabilises the control loop and causes oscillations in system performance (LOS). This problem can be partially overcome with robust predictive models and self-learning systems that gain the ability to make good guesses about user arrivals and vehicles needed at critical stops. Some examples of the results of model runs with reference to the morning peak hour are shown below: user profile parameters of the simulations (table 2) and percentage of stations that achieve a given LOS (table 3).
www.witpress.com, ISSN 1743-3509 (on-line) WIT Transactions on The Built Environment, Vol 116, © 2011 WIT Press
Urban Transport XVII 469

Table 2: User profiles.
User profile Trips Runs #1 Runs #2
Inbound car commuters (low occupancy) 1238 822 Inb. Car+HOV+bus commuters (GRT users) 381 219 Internal school trip users (inbound) 371 417 Internal school trip users (outbound) 274 290 Internal home-based users 532 626 Internal other activities users 576 437 Internal leisure users 165 158 Outbound commuters 465 274
TOTAL 4003 3243
Table 3: LOS and % of stations.
LOS Vehicles in service - model runs #1 LOS Vehicles in service - model runs #2 500 520 540 550 560 480 500 520 540 550
A 0 0 0 0 0 A 0 0 0 0 0 B 16% 8% 16% 16% 12% B 25% 24% 23% 25% 22% C 9% 17% 9% 15% 13% C 11% 12% 8% 13% 10% D 27% 26% 29% 24% 28% D 14% 17% 22% 15% 31% E 11% 13% 8% 10% 6% E 38% 44% 42% 47% 37% F 36% 36% 38% 35% 41% F 12% 3% 5% 0 0
Note that in the critical scenarios simulated, no station attains LOS A, however in the second series of simulation runs, no station performs at LOS F when 540 and 550 vehicles are put in operation.
8 Final considerations
8.1 Technology and control systems
Current safety standards that can apply to PRT operation are inadequate for this technology [9, 10]. In this application, they would allow for a headway of 6 seconds, corresponding to half as much capacity as was simulated. Respecting this limit, all the analysed scenarios and layouts would result in unacceptably long wait times. However, it is likely that technology advancements and new safety regulations will soon allow a PRT system to reach or exceed the level of capacity simulated, i.e. 3 seconds or less of safe time‐headway, multi‐lane circulation and a theoretical capacity of 4800 pphpd or more in GRT mode. Only an asynchronous control system was simulated in this research. We have no evidence on how well a synchronous control will handle the high level of demand forecasted at peak hours. “Hybrid” control systems also exist and research on their behaviour in critical conditions is ongoing. Further developments of empty vehicle management routines (e.g. demand learning and forecasting), have the potential to reduce wait times and empty vehicle movements [11]. The “shortest path” strategy can be improved by accounting for real-time link saturation levels, to detour some trips and prevent congestion at
www.witpress.com, ISSN 1743-3509 (on-line) WIT Transactions on The Built Environment, Vol 116, © 2011 WIT Press
470 Urban Transport XVII

the expense of longer trip times [12]. However, such methods are only effective if the network is “robust” and alternative paths are available.
8.2 Travel demand management and social aspects
Cultural acceptance of a combination of PRT and GRT service must be proven. Demand for individual PRT services during rush hours in place of collective GRT services, may be greater than simulated. In order to achieve the desired results, the attractiveness of the GRT must be kept high, especially during peaks, e.g. by offering attractive fares for sharing vehicles at peak. The timing of major events and school and office entry/exit hours must be carefully coordinated in order to mitigate demand-peaks. In a “carbon neutral” town, mobility management must have as important a role as energy management [13]. In conclusion, all networks and conditions analysed still have potential for improvement, for example by adopting methods of optimal link orientation, optimization of the size of buffer-stations and berth numbers, control of line speeds at strategic points, etc. The software used and methods employed can be improved and made more flexible to account for different conditions, system and station layout, technologies and supervisory strategies. The approach adopted must be considered experimental, and all its results preliminary. Also the definition of LOS can be extended and made more comprehensive: LOS is an invaluable tool for the assessment and calibration of simulations and to measure the performance of real-world systems. The LOS metric defined in this research can be considered a starting point, however it must be validated by real-life measures. Only two PRT systems are currently operational, or about to be, but others are being designed. See Schneider [14] for an overview. The need for specific planning and simulation tools, safety requirements and design guidelines will soon become imperative.
References
[1] Irving J. et al.: Fundamentals of Personal Rapid Transit, Lexington books, Lexington MA, 1978
[2] Guala L., Lohmann R.: Introducing PRT to the sustainable city of the future, in proceedings of PRT@LHR Symposium, Heathrow UK, 2009
[3] Menichetti D., Van Vuren T.: Masdar City: modelling PRT in a carbon-neutral development, in: proceedings of PRT@LHR Symposium, Heathrow UK, 2010
[4] Transport Research Board: Highway Capacity Manual, TRB Special Report, Washington DC, 1965
[5] Danesi A., Rupi F., Schweizer J., Traversi E., Caprara A., Comparison of static vehicle flow assignment methods and micro-simulations for a Personal Rapid Transit network, in: XIII Euro Working Group on Transportation Meeting, Padova, 2009
www.witpress.com, ISSN 1743-3509 (on-line) WIT Transactions on The Built Environment, Vol 116, © 2011 WIT Press
Urban Transport XVII 471

[6] Schweizer J., Mantecchini L., Performance Analysis of large scale PRT networks: theoretical capacity and micro-simulations, in: APM Conference 2007, Vienna, 2007,
[7] Schweizer J.: Non-linear feedback control for short time headways based on constant-safety vehicle-spacing, in: , IEEE Intelligent Vehicles Symposium, S.N., s.n, 2004
[8] Dubai Road and Transit Authority (RTA): Dubai Municipality’s Trip Generation and Parking Rates Manual (TGPRM), regularly updated.
[9] American Society of Automotive Engineers (ASCE): Automated People Movers Standards, (parts 1 to 4:ASCE 21-05; 21.2-08; 21.3-08; 21.4-08), ASCE publications, 2005-2008
[10] United States Congress Office of Technology Assessment: Automated Guideway Transit, an assessment of PRT and other new systems. US Congress press, Washington DC, 1975
[11] Andreasson I. J.: Reallocation of Empty PRT vehicles en route, TRB annual meeting, Washington DC 2003
[12] Andreasson I. J.: Extending PRT capabilities, in Proceedings of the 12th APM conference ASCE, Atlanta GA, 2009
[13] Anderson J. E.: Evolution of Personal Rapid Transit, 2009 available online from: faculty.washington.edu/jbs/itrans
[14] Schneider J. B.: a vast selection of reference material on PRT studies, technology and projects is available at Jerry B. Schneider’s area on the University of Washington, Seattle WA website: faculty.washington.edu /jbs/itrans
www.witpress.com, ISSN 1743-3509 (on-line) WIT Transactions on The Built Environment, Vol 116, © 2011 WIT Press
472 Urban Transport XVII