modeling the transport of inorganic ions through undisturbed soil columns from two contrasting...
TRANSCRIPT

Modeling the Transport of Inorganic Ions Through Undisturbed Soil Columnsfrom Two Contrasting Watersheds
P. M. JARDINE,* G. V. WILSON, AND R. J. LUXMOORE
ABSTRACTThe transport of several inorganic cations and anions (i.e., Mg2
NHj1. Br , NO,), via saturated flow, through large undisturbed soilcolumns from two contrasting watersheds was investigated. The mo-bility of nonreactive tracers was described well with the convection-dispersion (CD) equation using flux-averaged solute detection in theeffluent. Reactive tracers were also modeled well using various linearand nonlinear, equilibrium and nonequilibrium, transport codes basedon the CD equation. Appropriate independent estimates of modelpredicted chemical retardation were possible only through experi-mental development of "dynamic isotherms" using a steady flowmethod on small undisturbed soil columns. The latter condition canaccurately predict solute retardation on large soil columns, sincetracer movement is largely controlled by the physical aspects of thesoil (e.g., preferential flow zones). Adsorption isotherms generatedon disturbed soils using a batch equilibration method, overestimatedthe amount of solute retardation from displacement experiments onthe large undisturbed soil columns. The use of batch adsorptionmeasurements in curve-fitting transport models to describe data fromsaturated column displacement experiments on undisturbed soils,may result in erroneous transport parameter estimates.
THE OCCURRENCE of preferential water flow in mostnatural soil systems is an undisputable reality
(Elrick and French, 1966; Bouma and Wosten, 1979;Smith et al, 1985). Solute mobility through media ex-hibiting large variations in pore water velocity fre-quently obey convectiye-dispersive transport whencorrect boundary conditions are established (Parkerand van Genuchten, 1984a; van Genuchten and Wier-enga, 1986; Schulin et al., 1987; Southworth, 1987).Transport models of this type which consider the at-tenuation of reactive solutes, commonly rely on thedistribution coefficient (kd) concept (van Genuchtenand Wierenga, 1976a; Valocchi, 1984; Parker and vanGenuchten, 1984b). This method treats kd as a con-stant in both space and time which implies a linearrelationship between the adsorbed and the solutionphase solute concentrations. Constant kd values willin turn provide the quantity of retarded solute on thesolid phase, commonly denoted by R = 1 + (pkd/0)where p and 6 are the bulk density and volumetricwater content of the porous media, respectively.
Often a nonlinear relationship exists between theadsorbed and the solution phase solute concentrations(Gilbert and van Bladel, 1970; Jensen, 1984). Thenonlinear isotherms are either linearized using var-ious techniques which assume an effective kd (vanGenuchten, 1981; Parker and Jardine, 1986) or thevariations in kd with changes in solute concentrationEnvironmental Sciences Div., Oak Ridge Natl. Lab., P.O. Box 2008,Oak Ridge, TN 37831. Joint contribution from Oak Ridge Nat. Lab.and Univ. of Tennessee, Knoxville. This research was funded bythe Ecological Research Div. of the Office of Health and Environ-mental Research, U.S. Dep. of Energy under contract no. DE-AC05-84OR21400 with Martin Marietta Energy Systems, Inc. Received30 Nov. 1987. *Corresponding author.
Published in Soil Sci. Soc. Am. J. 52:1252-1259 (1988).
are handled by more complex transport codes. Thelatter transport models are far less popular than theconstant kd models because of their numerically moretedious form (van Genuchten and Wierenga, 1976b;Fluhler and Jury, 1983; Parker and Jardine, 1986).
Various methods have been used to establish thefunctional relationship between the adsorbed and thesolution phase solute concentrations for reactive sol-ute transport through soil. Direct measurement of thisfunctional relationship from column displacement ex-periments is seldom possible, thus independent pre-dictions are most commonly obtained from batchequilibrium adsorption isotherms. Using the lattertechnique, van Genuchten (1981) found that predictedretardation from linearized batch equilibrium adsorp-tion isotherms agreed well with model-fitted values fordisplacement experiments on disturbed soil columns.Selim et al. (1987) also showed that isotherms deter-mined by the batch method were suitable for describ-ing Ca2+ and Mg2+ transport in a disturbed soil col-umn. Starr et al. (1985), however, found that best-fitretardations of 90Sr from transient effluent data on dis-turbed soil cores were 2 to 3 times less than retarda-tions determined by batch methods. Likewise, the ad-sorption of K+ on disturbed soil columns was notaccurately described by adsorption isotherms pre-pared using batch methods (Jensen, 1984). Kilmer etal. (1987) have further noted that partition coefficientsfor the adsorption of polycyclic aromatic hydrocar-bons onto gasifier ashes, calculated from column tests,were two times lower than those determined usingbatch methods. Using undisturbed soil columns, Sey-fried and Rao (1987) noted significantly less 3H2O re-tardation than was predicted by batch methods.Southworth (1987) and Southworth et al. (1987) alsofound that batch retardation measurements of 22Naand trichlorobenzene on soil were much larger thanmodel fitted retardations for displacement experi-ments on undisturbed cores.
Direct determination of adsorption isotherms fromtransient displacement experiments is rarely reportedin the literature. Lai and Jurinak (1971) directly mea-sured the adsorbed and solution phase concentrationsfor each section of a disturbed soil column after thedisplacement experiment was complete. This methodis adequate for determining solute retardation in dis-turbed columns where solution flow is homogeneousthroughout the porous media. For reactive solutetransport through undisturbed soil columns whichhave preferential flow paths, however, this method willnot suffice. It is evident that adsorption studies shouldbe performed under conditions close to those encoun-tered in the field, using realistic water contents andconserving the physical and chemical properties of thesoil, if these results are to be related to solute transportmodels.
Accordingly, it is the objective of this study to modelthe transport of several inorganic cations and anions(i.e., NH^, Mg2+, NO;r, Br~) through undisturbed soil
1252
JARDINE ET AL.: MODELING THE TRANSPORT OF INORGANIC IONS THROUGH UNDISTURBED SOIL COLUMNS 1253
columns. We will illustrate the limitations of usingbatch adsorption isotherms to describe solute retar-dation in undisturbed column displacement experi-ments and introduce a technique for determining sol-ute adsorption isotherms on undisturbed soil samplesusing a steady flow method.
THEORETICALOne-dimensional transport of a single solute species dur-
ing steady fluid flow in which n types of reactive sites aredistinguished, may be described by the convection-disper-sion equation
dt dt dx2 dxwhere c denotes the solution concentration of solute in molesper volume of solution, 5, is the total adsorbed solute massper unit mass of solid on type / sites, v is the mean steadypore water velocity, D is a dispersion coefficient reflectingcombined effects of diffusion and hydrodynamic dispersionon transport, and x and t are distance and time, respectively.To analyze transient displacement experiments, we will as-sume that sorption sites may be partitioned into two types.Adsorption on type-1 sites is assumed to be instantaneousand reversible, while adsorption on type-2 sites is assumedto follow reversible first-order kinetics. If the functional re-lationship between the equilibrium adsorbed and the solu-tion phase concentrations for a reactive solute is linear, then
[2]= Fkc
s2 = k2c-- (1 - F)kc
[3]
where subscripts 1 and 2 refer to type-1 and type-2 sites, k= k{ + k2 is the net distribution coefficient, and F = kjkis the fraction of type-1 sites present. Parameter k is fre-quently expressed in a reduced form as R = 1 + (pk/9),where -R is a retardation factor, p is the porous medium bulkdensity, and 8 is the volumetric water content.
Because type-1 sites are always in equilibrium, it followsthat,
dSi/dt = Fk(dc/dt) [4]The adsorption rate for type-2 sites is described by
ds2/dt = a [(1 - F) k c - S2] [5]where a is a first-order rate coefficient. An analytical solutionto the above transport model was used as described by Par-ker and van Genuchten (1984b) for flux-averaged solute de-tection in the effluent.
For situations where the functional relationship betweenthe equilibrium adsorbed and solution phase concentrationsof a reactive solute is nonlinear, the model developed byFluhler and Jury (1983) and modified by Parker and Jardine(1986) was utilized. This model also assumes that adsorp-tion sites can be divided into two fractions exhibiting dif-ferent equilibrium and kinetic adsorption behavior. Equilib-rium isotherms for binary monovalent-divalent cationexchange at constant ionic strength are described by_ 4 73, (/ - C+) /2
where E, is the cation exchange capacity (CEC) of the solidphase given on a solution volume basis, 7,., and j2-.i aremean activity coefficients of the 1:1 and 2:1 salts, respec-tively (e.g. NH4C1 and CaCl2), / is the ionic strength of thesystem, and s, + and c+ are the equilibrium solid and solu-
tion molar concentrations of the monovalent cation. Theparameter k,, is the Vanselow selectivity coefficient of type/ sites defined by (Jardine and Sparks, 1984; Parker and Jar-dine, 1986)
= + J2,l
" N,2+ 7?:,[7]
where 7f^+ and ]v"ii2+ are the equilibrium adsorbed mole frac-tion for monovalent and divalent cations, respectively, andc2+ is the equilibrium solution concentration of the divalentcation. Equation [6] defines the adsorption isotherm s,,+(c+)which is incorporated into the convection-dispersion trans-port model and solved numerically as described by Parkerand Jardine (1986). The lower boundary condition definesa zero concentration gradient at x = L, where L is the lengthof the column, thus correctly interpreting effluent concen-trations as representing flux-averaged concentrations (Par-ker and van Genuchten, 1984a; van Genuchten and Wier-enga, 1986).
EXPERIMENTAL METHODSSite Description and Sample Preparation
Large, undisturbed soil columns (Table 1) were isolatedfrom two contrasting forested watersheds located on the OakRidge Reservation in Tennessee. One site, located in theMelton Branch watershed, has a very shallow soil profile of0.5 to 3 m (Montevallo shaly silt loam), with underlyingsaprolite present as weathered limey shale. The soils arecharacterized by pH and CEC values of 5 to 6 and 10 to 20cmolc kg~', respectively. The clay fraction is composed pri-marily of illite with lesser quantities of vermiculite and mica(Turner and Arnseth, 1988). The second site, located in theWalker Branch watershed, has a deep soil profile of 30 m(Minvale cherty silt loam), and is characterized by pH andCEC values of 4 to 5 and 4 to 6 cmolc kg~', respectively.The clay fraction is predominantly kaolinite with lesserquantities of hydroxy-Al interlayered vermiculite and mica.A large quantity of amorphous Fe and Al oxides are presentin this soil as free species and coatings on clay minerals(Turner and Arnseth, 1988).
Large, undisturbed soil columns (14 cm diam by 28-62-cm long) used in the displacement experiments were isolatedfrom excavated pits 1 to 1.5 m in diameter (Table 1). Twocolumns were taken from the Melton soil (2-m apart) andone was taken from the Walker soil. The columns were slowlyshaped into their final form by careful removal of soil andclipping of roots. As the size of the columns neared the de-sired dimensions, paraffin wax was carefully painted on theouter layer of soil which helped maintain the integrity ofthe soil structure. The paraffin wax did not enter the porousstructure of the soil since the wax hardened immediatelyupon contact with the soil. Wax and soil were sculptureduntil the desired dimensions of the columns were attained.The soil columns were cast in a final layer of wax, removedfrom the pits, and placed in large buchner funnels. The latterwere equipped with cheese cloth and a small quantity of finegrain quartz to fill any dead space present at the column
Table 1. Physical parameters for column displacement ex-periments.
Displacementstudies
Column typeMelton 1Melton 2Melton isothermWalkerWalker isotherm
Columnlength
cm28.035.010.862.2
9.5
Columnradius
cm6.357.01.757.01.75
P
g cm"3
1.071.011.151.151.00
ecm3 cm"3
0.500.530.530.420.43
1254 SOIL SCI. SOC. AM. J., VOL. 52, 1988
exit. The bottom of the columns were then sealed into thebuchner funnels with soft, pliable wax, assuring that waxdid not flow beneath the column exit. Precut PVC pipe, withlengths and diameters slightly larger than the soil columns,were placed over the soil and taped in contact with the fun-nels. The dead space between the PVC pipe and the waxcast soil was filled with semimolten paraffin wax, with atemperature slightly above its melting point (328 K). Thisassured paraffin wax did not flow into the porous structureof the soil. The casted undisturbed columns were allowedto harden overnight.
Miscible Displacement ExperimentsTwo displacement experiments were conducted on each
column, first using MgBr2 followed by NH4NO3. Initially,soil columns were made homoionic using 0.2 mol L~' CaQ2.The columns were saturated very slowly from the bottomusing a variable head marriott device, which assured thatmost entrapped air was removed from the soil. Once satu-ration was complete, numerous pore volumes of 0.2 molL~' CaQ2 were passed downward through the columns (=^20L) followed by an equivalent flushing with 0.01 mol L~'CaCl2. The CaQ2 leachings were periodically interrupted sothat the salt solution could "equilibrate" with the soil (=6h), after which leaching was continued. The MgBr2 displace-ment experiments were not initiated by ponding a constant4 to 6-cm head of 0.05 mol L ' MgBr2 (pH = 5.6) at thecolumns inlet until the effluent concentration nearly equalledthat of the influent. Effluent of known volume was collectedas a function of time. Once the MgBr2 displacement exper-iments were complete, the columns, still saturated, were re-generated to the Ca2+ form by extensive, interrupted flush-ings with 0.2 mol L~' CaCl2 followed by equivalent washingswith 0.001 mol L~' CaCl2. The NH4NO3 displacement ex-periments were now initiated with 0.1 mol L~' NH4NO3 (pH= 5.1) using the previously described procedure. The lowerCaCl2 concentration was used so that Cl~ would not inter-fere with NOj detection. All studies were conducted underisothermal conditions of 296 ± 1 K.
When the displacement experiments were complete, 0.5to 0.75 pore volumes of Rhodamine-B dye (2 g Lr1) werepassed through the saturated soil columns. The columns wereallowed to drain, and were sectioned to observe the stainingpatterns at selected depths. The dye patterns confirmed thatpreferential flow channels (e.g. root paths, worm holes,structural fractures) occurred in the undisturbed soil andthat solution channeling between the wax/soil interface andthe wax/pipe interface was insignificant. The Rhodaminedye suggested that the preferred flow paths in the upper soilhorizons of the Walker and Melton soils were predomi-nantly root channels, both dead and alive, and mesoporesadjacent to these macropores (Wilson and Luxmoore, 1988).Approximately 50% of the soil area had visible dye staining,
with many large macropores remaining unstained. The pre-ferred flow paths in the lower horizon of the Melton soilwere primarily structural fractures and cleavage planes alongweathered shale and root channels. Preferential flow in thelower horizons of the Walker soil were root channels andmesopores adjacent to these macropores. Again, a significantportion of this soil area remained unstained.
Effluent obtained during the displacement experiments wasanalyzed for Mg2+ using atomic absorption spectrophoto-metry (AA) and for NOj, Br~, and NH4
f using ion selectiveelectrodes (Keeney and Nelson, 1982). Samples were ana-lyzed immediately to avoid microbial alterations, and in-terference of Cl~ on the detection of NOf and Br~ was neg-ligible based on our experimental design. The total porosities,bulk densities, and lengths of the soil columns were mea-sured by conventional direct methods.
Dynamic Equilibrium Adsorption ExperimentsSmall, undisturbed soil columns were taken from Melton
and Walker Branch watersheds for determining dynamic ad-sorption isotherms from steady flow displacement experi-ments (Table 1). Soil columns were obtained by verticallydriving thin beveled PVC pipes (3.5-cm i.d.), lined with alight coating of vaseline, into soil located close to the areawhere the large columns were isolated (< 2 m). Soil com-paction was minimal resulting in 5% loss of volume mainlyin the surface organic matter. The columns were sealed inbuchner funnels using paraffin wax as described previouslyand saturated by very slow immersion into a 0.2 mol L~'CaCl2 solution. Once saturation was complete, the columnswere flushed with numerous pore volumes of 0.2 mol Lr'CaCl2 followed by 0.01 mol L~' CaCl2 for the Mg2+ dis-placement experiments and 0.001 mol L~' CaCl2 for theNHJ displacement experiments.
Steady flow displacement experiments were conducted at296 K on the Melton column using mixed solutions of MgQ2and CaCl2 of varying molar ratios but at constant ionicstrength (/ = 0.03) and pH = 5.6. Likewise, displacementexperiments were conducted on the Walker column usingmixed solutions of NH4C1 and CaCl2 of varying molar ratiosbut at constant ionic strength (I = 0.03) and pH = 5.3.Displacement experiments using five different solutions foreach of the binary systems (NMj5 = 0.15, 0.30, 0.45, 0.75,1.00; NNH4 = 0.30, 0.45, 0.75, 0.90, 1.00) were performedon the soil columns, where NMg and NNH4 are the mole frac-tions of solution Mg2+ and NHJ, respectively. Continuousleaching of the soils with the solutions was maintained untilthe effluent solution concentration equalled that of the in-fluent solution concentration. After the completion of eachdisplacement experiment with a particular solution, the soilcolumns were regenerated to the Ca2+ form by extensiveflushing with CaCl2 as described previously. Effluent ob-tained during a displacement experiment was analyzed for
Table 2. Physical parameters and model fitted parameters for column displacement experiments.
Statistics of model fit
Column Tracer Modelt q, cm h" R r2 SSQMelton 1
Melton 2
Walker
Br"Mg2+
Br~Mg2+
N03~NH4
+
Br-Mg2+
N03~NH4
+
CD (P fit)CDK (R, F, a fit)CD (P fit)CDK (R, F, a fit)CD (P fit)CDK (F, a fit)CD (P fit)CD (R fit)CD (P fit)CD (R fit)
156.3156.3149.3149.3146.2146.255.755.769.269.2
3.67 ± 0.15§3.67
1.24 ± 0.121.24
1.07 ± 0.111.07
1.65 ± 0.191.65
1.28 ± 0.161.28
1.02.06 ±0.11
1.02.45 ± 0.08
1.02.451.0
1.45 ± 0.021.0
1.38 ± 0.04
0.11
0.20
0.20
t± 0.04t± 0.04t± 0.04tttt
t1.89 ±
t0.63 ±
t0.44 ±
tttt
0.17
0.15
0.15
0.9990.9990.9940.9980.9920.9980.9930.9990.9900.997
0.00420.00130.01580.00680.02450.00610.02220.00270.02560.0094
t CD = one-site, linear, equilibrium model; CDK = two-site, linear, nonequilibrium model.t F and a need not be considered under these equilibrium conditions.§ Confidence interval = 0.95.
JARDINE ET AL.: MODELING THE TRANSPORT OF INORGANIC IONS THROUGH UNDISTURBED SOIL COLUMNS 1255
i.o
E-o:
UJooo
LJoaLJa:
0.8-
0.6-
0.4-
0,2-
0.0
Br" MELTONCOLUMN 1
OBSERVED oMODEL FITTED
0.5 l.S 2PORE VOLUMES
1.0
2.5 3.5
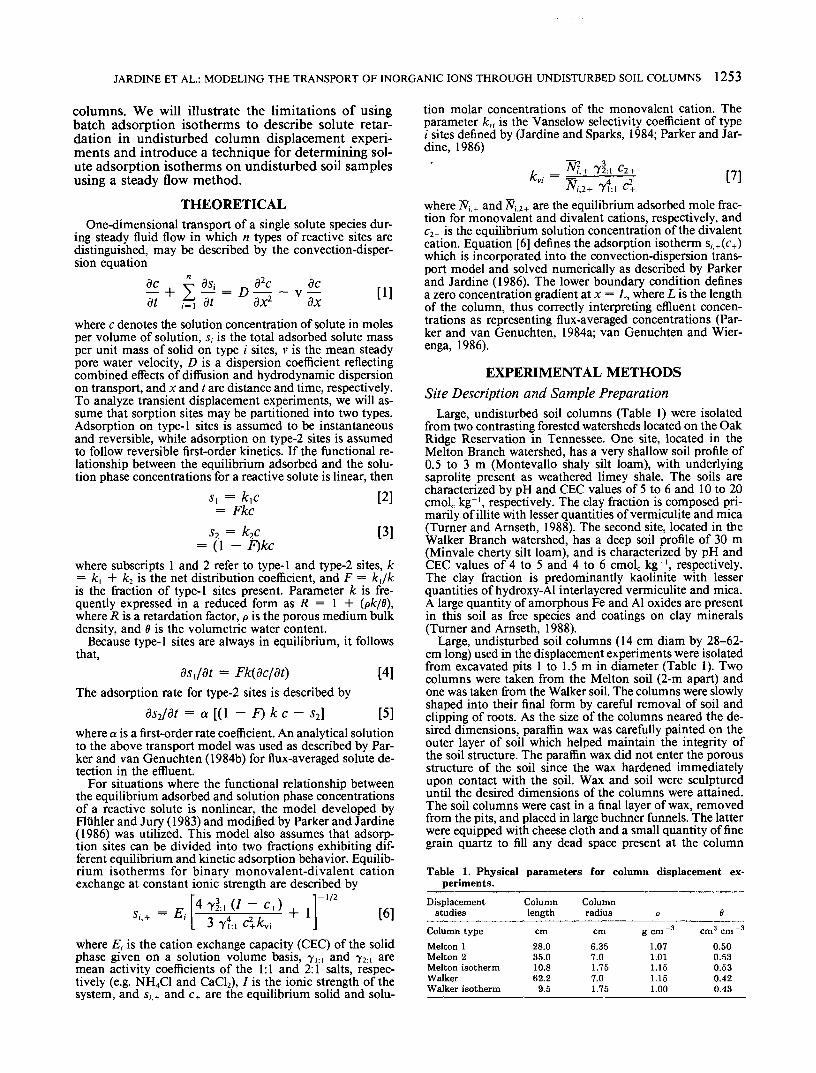
Fig. 1. Observed Br effluent concentrations from the Melton 1 dis-placement experiment with the fitted curve determined from theone-site, linear model.
Mg2+ or NH^ and the resulting equilibrium breakthroughcurve (ETC, represented as reduced concentration vs. re-duced time) was determined. Since the complete break-through of solute was detected (from reduced concentrationof 0.0 to 1.0), the area above the curve is proportional tothe quantity of solute adsorbed on the solid phase. This areamay be calculated gravimetrically or through curve fitting;with the authors of this manuscript choosing the latter. Thisprocedure was performed on all BTCs thus establishing afunctional relationship between the adsorbed and the solu-tion phase solute concentrations at a constant ionic strengthon undisturbed soil columns.
Batch Equilibrium Adsorption ExperimentsSoil from the two small undisturbed columns, used to
determine dynamic adsorption isotherms, were removedfrom the PVC pipes, air-dried, and gently ground to passthrough a 2-mm sieve. Subsamples of the disturbed Meltonsoil were then leached with seven solutions of mixed MgCl2and CaCl2 of varying molar ratios (/ = 0.03, pH = 5.6),and subsamples of the disturbed Walker soil were leachedwith seven solutions of mixed NH4C1 and CaQ2 of varyingmolar ratios (/ = 0.03, pH = 5.3). Once equilibrium wasestablished (Jardine and Sparks, 1984), the samples werewashed with several aliquots of deionized water to removeentrained salts. The adsorbed solid phase cations were thenextracted with known volumes of 0.1 mol L~' SrCl2 withMg2+ and Ca2+ analyzed by A A and NH^ analyzed by ionspecific electrode. All studies were conducted under iso-thermal conditions of 296 ± 1 K.
RESULTS AND DISCUSSIONTransport of nonreactive solutes (Br" and NO^")
through large undisturbed soil columns were de-scribed well by the classical convection-dispersionequation using flux-averaged solute detection in theeffluent (CD model, Table 2, Fig. 1). Flux-averagedconcentrations can adequately describe a major por-tion of heterogeneous solute transport by consideringpreferential flow (Parker and van Genuchten, 1984a;van Genuchten and Wierenga, 1986; Schulin et al.,1987; Barry and Sposito, 1988). Traditionally, vol-ume-averaged effluent concentrations have been usedto describe preferential solute mobility, forcing the useof a two-region parameter optimization model (Nkedi-
_LJO•z.oCJ
aLJoZ3aLJcc
0.8-
0.6-
0.4-
0.2-
0.0
MODEL PRRRMETERSR, F, and a fittedR»2.11 F andafLxedR = 3.53 F andaflxed
4 6PORE VOLUMES 10
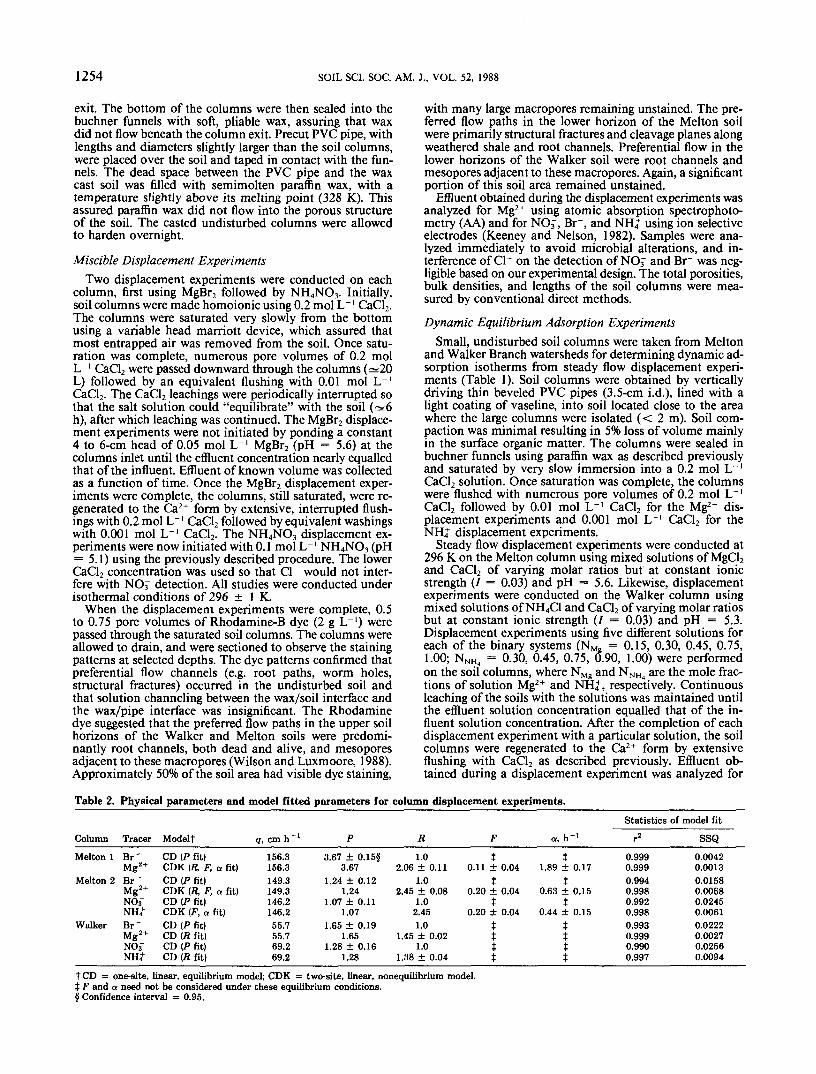
Fig. 2. Observed Mg2+ effluent concentrations from the Melton 1displacement experiment with the best-fit curve determined fromthe two-site, linear model and predicted curves determined for/?»"•«« and R"'"' obtained from dynamic and batch Mg2+/Ca2+ iso-therms, respectively.
Kizza et al., 1983; Smetten, 1984; Hatano et al., 1985).The latter condition fails to account for preferentialflow, thus application of the classical CD equation isfutile. The slight deviation between observed Br~ ef-fluent at longer times and the model fitted curve usingthe classical CD equation (Fig. 1), suggest that themodel cannot account for all of the flow heterogeneityin this system. The two-region model with flux-aver-aged concentrations may further improve the fit, how-ever the use of this latter model seems unnecessarysince the large majority of the observed Br~ effluentis well described by the classical CD equation.
Measured fluxes (q = vO) were similar for the twoMelton columns, but were considerably larger thanthose on the Walker column (Table 2). These valuesare similar to mean saturated infiltration rates estab-lished in situ for soils on the two watersheds (Watsonand Luxmoore, 1986; Wilson and Luxmopre, 1988).Since the solute flux was so rapid in the soil columns,the resident time of N compounds in the soil was shortand pur transport models need not consider NOf re-duction. Model-fitted Peclet numbers (P = vL/D) fornonreactive tracers were low implying significant flowheterogeneity in these soils. Since column lengths areseveral times larger than column diameters, low P val-ues are not the result of column dimension induceddispersion but rather represent a realistic estimate ofsolute dispersivity in the field (Jardine, Wilson, andLuxmopre, 1988, unpublished data).
Reactive solute transport (Mg2+ and NH^) throughthe Melton soil was well described by a two-site, lin-ear, nonequilibrium model (CDK model, Table 2, Fig.2). The classical CD equation did not adequately de-scribe observed Mg2+ or NH| effluent at longer times.This latter model suggests that equilibrium (reducedconcentration = 1) occurs at four pore volumes (Fig.2) indicating the inability of the classical CD equationto describe the observed tailing at longer times. Theobserved breakthrough curves (ETC) for reactive sol-ute transport through the Melton soil exhibit a re-tarded initial concentration increase relative to the

1256 SOIL SCI. SOC. AM. J., VOL. 52, 1988
1600
CD
toen
ene
1400-
1200-
1000-
800-
600-
400-
200-
I1EITON ISOTHERMS
BflTCH (disturbed)o
DYNflMIC (undisturbed) 4
1.0
0 50 100 150 200 250mg Mg2VL SOLUTION
Fig. 3. Magnesium/calcium isotherms (7 = 0.03, pH = 5.6) on un-disturbed and disturbed Melton soil using dynamic and batchmethods, respectively.
nonreactive tracers, followed by extensive tailing whichcontinues to long times. In the context of the two-sitemodel, the initial increase in concentration should re-flect saturation of type-1 sites while the duration oftailing is governed by the rate constant (a) for type-2sites. However, observed tailing may also result in sys-tems with large dispersivities and for conditions wherethe equilibrium adsorption isotherm is nonlinear(Schweich and Sardin, 1981). Solute dispersion hasbeen measured for nonreactive displacement experi-ments (Table 2) and thus becomes a known parameterfor modeling reactive solute transport. These latter re-sults have shown that the physical heterogeneity ofthe system can be described by the classical CD equa-tion, thus the use of the two-site model to describeMg2+ and NH^ transport, and not the two-regionmodel, is justified. The two-site and two-region modelsare mathematically identical, but operationally dis-tinct. Assuming linear adsorption isotherms momen-tarily, model-fitted parameters R (retardation factor),F (fraction of type-1 sites), and a (first-order rate coef-Table 3. Experimentally determined retardation factors from un-
disturbed dynamic methods and disturbed batch methods andtheir ability to describe observed column displacement ex-periments. Model fitted retardations are shown for comparison.
Column Tracer Rundist SSQ
Melton 1Melton 2Walker
Mg2+
NH4+
2.112.031.33
0.9990.9940.996
Rdist
0.00160.02080.0122
SSQ
2.06 ± 0.11§2.45 ± 0.081.38 ± 0.04
Melton 1 Mg2 +
Melton 2 Mg2"1"Walker NH4
+
3.533.352.21T1.73J
0.9370.9750.8580.965
0.30440.08110.40930.1000
2.06 ±0.112.45 ± 0.081.38 ± 0.04
t NH4+/Ca2+ isotherm linearized using endpoint tangent method (Parker
and Jardine, 1986).} NH4
+/Ca2 + isotherm linearized using area normalization method (Parkerand Jardine, 1986|.
§ Confidence interval = 0.95.
E-o:en
QLJO=>CDCxJ
0.8-
0.6-
0.4-
0.2-
0.0
Mg MELTON COLUMN 1R=3.53 F and a fitted
OBSERVED °MODEL FITTED ———
4 BPORE VOLUMES
10
Fig. 4. Observed Mg2' effluent concentrations from the Melton 1displacement experiment with a fictitious best-fit curve deter-mined from the two-site, linear model using Jtdisl obtained fromthe disturbed, batch Mg2+/Ca2+ isotherm.
ficient) were obtained for Mg2+ and NH^ transport inthe Melton soil (Table 2, Fig. 2). Model-fitted R andF values were slightly lower and a values were some-what higher in the Melton 1 soil column relative tothe Melton 2 soil column. The observed time-depen-dent kinetic reactions of Mg2+ and NH^ with this soiltype is related to the predominant illitic mineralogyof the clay fraction (Keay and Wild, 1961). The slowkinetics result from the chemical diffusion of thesesolutes into the interlayers of the 2:1 clays. The modelused here, however, assumes a linear isotherm.
To determine whether this model is suitable for de-scribing Mg2+ transport through the Melton soil, Mg2+/Ca2+ equilibrium adsorption isotherms were deter-mined on undisturbed and disturbed samples of Mel-ton soil as described in the experimental methods (Ta-ble 1, Fig. 3). The isotherms are nearly linear with aslight curvature resulting from the presence of a smallamount of CaCl+ (Sposito et al., 1983). The slope ofthe dynamic Mg2+/Ca2+ isotherm is significantly lessthan observed for the batch isotherm (Fig. 3), showingthat much less Mg2+ is adsorbed on the undisturbedMelton soil at any given solution Mg2+ concentration.This is a result of preferential solute movementthrough the undisturbed soil limiting the solute resi-dent time and decreasing the amount of potentiallyreactive sites which can attenuate the solute. The pres-ence of preferential flow zones in the undisturbed soilwas confirmed using Rhodamine-B dye.
The linear equilibrium adsorption isotherms for theundisturbed and disturbed Melton soil (/ = 0.03) areindependent of ionic strength (Jensen and Babcock,1973); thus retardation factors for dynamic and batchsystems (.Rundist and Rdis\ respectively) can be calcu-lated for / = 0.1 and used as predicted model param-eters for the Mg2+ displacement experiments on thelarge Melton columns (Table 3, Fig. 2). Values of Rund-ist for Melton 1 and 2 are significantly less than Rdtst,with the former values agreeing well with best-fit modelretardations, J?fit (Table 3).
The independent measurements of R for Mg2+/Ca2+
adsorption were fixed in the two-site, linear, none-
JARDINE ET AL.: MODELING THE TRANSPORT OF INORGANIC IONS THROUGH UNDISTURBED SOIL COLUMNS 1257
i.o
01a:
LJooo
o=>aLJ
0.8-
0.6-
0.4-
0.2-
0.0
MODEL PflRflMETERSR fitted •————R=1.33 —————R=2.21 — - —
0 1 2 3 1 5PORE VOLUMES
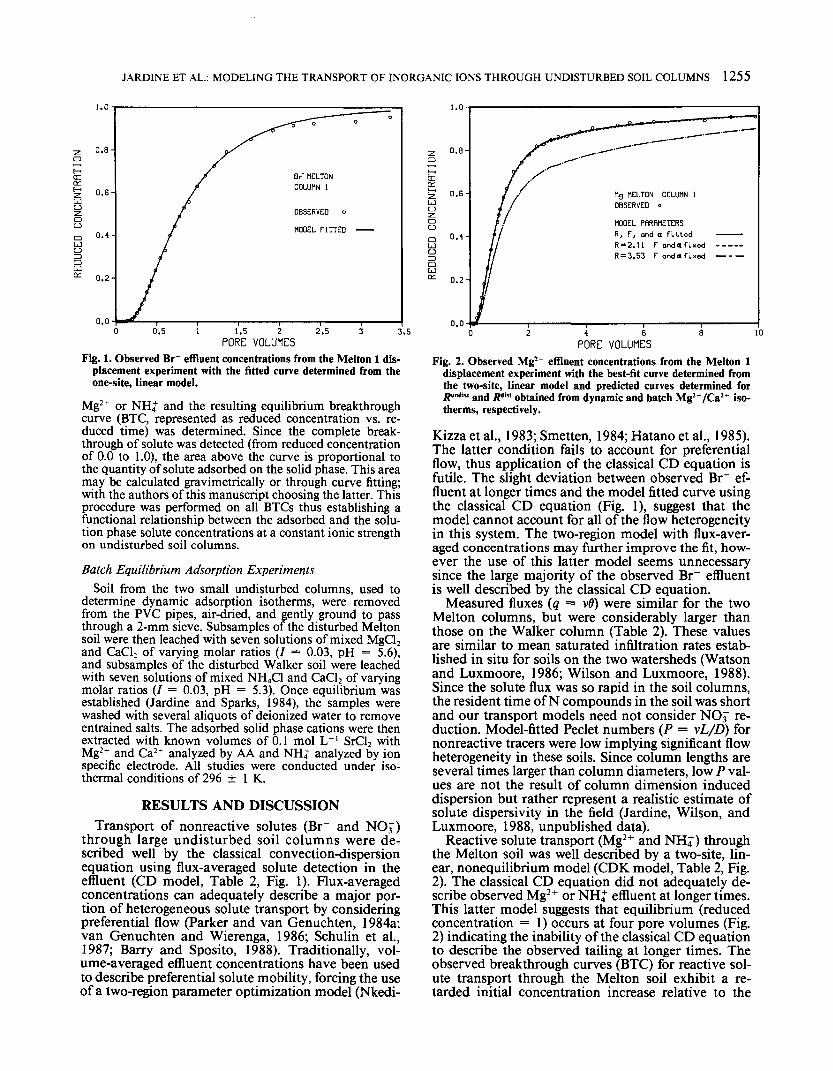
Fig. 5. Observed NH; effluent concentrations from the Walker dis-placement experiment with the best-fit curve determined from theone-site, linear model and predicted curves determined using Rmi-'" and Ra'a obtained from dynamic and linearized batch NHJ /Ca2+ isotherms, respectively.
quilibrium model and parameters F and a were fixedat values determined by the model when R, F, and awere fit (Table 2, Fig. 2). Thus the model contains allknown parameters and the isolated effect of /?undist andRdisl on the model can be observed (Table 3, Fig. 2).Predicted ETC using Rd'st greatly overestimated theobserved amount of adsorbed Mg2+ on the Meltonsoils (Fig. 2), resulting in poor regression coefficients(r2) and sum of square (SSQ) values (Table 3). Using/?undist, predicted BTC were virtually identical to theobserved Mg2+ displacement experiment (Fig. 2) asdepicted by the high r2 and low SSQ values for theMelton 1 and 2 soil (Table 3). It appears that the re-tardation factor determined by the dynamic isothermon the undisturbed Melton soil, more accurately pre-dicts solute attenuation on large undisturbed soil col-umns since tracer movement, via saturated flow, islargely controlled by the physical aspects of the soil.Even though soil variability exists between the largeand small columns, model-fitted Peclet numbers weresimilar for npnreactive tracers, suggesting similar het-erogeneities in solution flow through the small andlarge soil columns. If Peclet numbers differed mark-edly between the small and large soil columns, soluteretardation on the latter may not be adequately de-scribed by small column dynamic isotherms.
Although the batch method overestimated thequantity of adsorbed solute for undisturbed columndisplacement experiments, the unwary modeler mightdecide to optimize parameters F and a using the in-appropriate retardation value, Rdisl, resulting in whatappears to be an excellent model fit to the observeddata (Fig. 4). Parameter estimates of F and a (Melton1, F = 0.06 ± 0.01, a = 0.51 ± 0.05) will be inap-propriate since Raist is inappropriate. With accurateindependent estimates of dispersion and solute retar-dation using the dynamic isotherm, we believe thetwo-site, linear, nonequilibrium model accurately de-scribes the observed Mg2+ BTC tails with parameteroptimization of F and a. This approach may not besuitable for NH^ transport through the Melton soil
800-
700-
600-
COCD
500-
400-
300-
200-
100-
0
WflLKER ISOTHERMSBRTCH (disturbed) o
DYNflMIC (undisturbed) A
100 200NH;/L
500300 400mg INH4/l SOLUTION
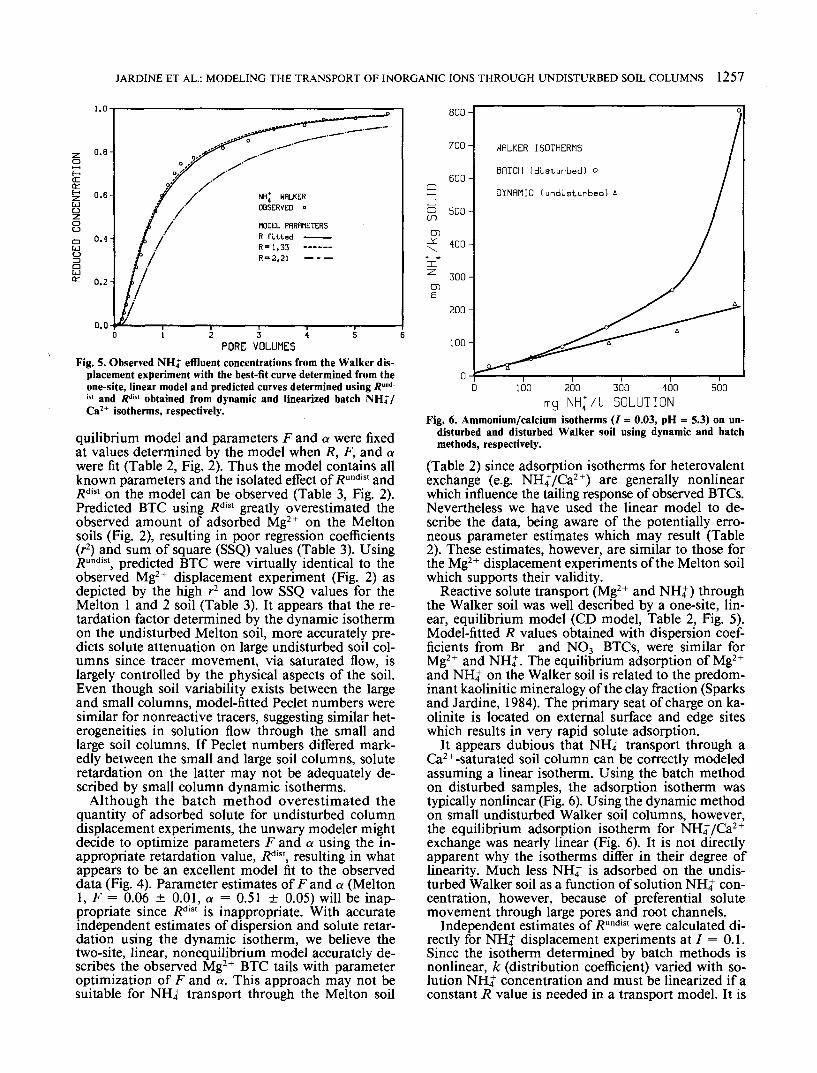
Fig. 6. Ammonium/calcium isotherms (/ = 0.03, pH = 5.3) on un-disturbed and disturbed Walker soil using dynamic and batchmethods, respectively.
(Table 2) since adsorption isotherms for heterovalentexchange (e.g. NH|/Ca2+) are generally nonlinearwhich influence the tailing response of observed BTCs.Nevertheless we have used the linear model to de-scribe the data, being aware of the potentially erro-neous parameter estimates which may result (Table2). These estimates, however, are similar to those forthe Mg2+ displacement experiments of the Melton soilwhich supports their validity.
Reactive solute transport (Mg2+ and NH^) throughthe Walker soil was well described by a one-site, lin-ear, equilibrium model (CD model, Table 2, Fig. 5).Model-fitted R values obtained with dispersion coef-ficients from Br~ and NOf BTCs, were similar forMg2+ and NH^. The equilibrium adsorption of Mg2+
and NH^ on the Walker soil is related to the predom-inant kaolinitic mineralogy of the clay fraction (Sparksand Jardine, 1984). The primary seat of charge on ka-olinite is located on external surface and edge siteswhich results in very rapid solute adsorption.
It appears dubious that NHtf transport through aCa2+-saturated soil column can be correctly modeledassuming a linear isotherm. Using the batch methodon disturbed samples, the adsorption isotherm wastypically nonlinear (Fig. 6). Using the dynamic methodon small undisturbed Walker soil columns, however,the equilibrium adsorption isotherm for NH^/Ca2+
exchange was nearly linear (Fig. 6). It is not directlyapparent why the isotherms differ in their degree oflinearity. Much less NH^ is adsorbed on the undis-turbed Walker soil as a function of solution NH^ con-centration, however, because of preferential solutemovement through large pores and root channels.
Independent estimates of/?undist were calculated di-rectly for NH^ displacement experiments at 7 = 0.1.Since the isotherm determined by batch methods isnonlinear, k (distribution coefficient) varied with so-lution NH^ concentration and must be linearized if aconstant R value is needed in a transport model. It is
1258
i.o
zoE-|<Ea;(-czLJozooaLJogLJcc
0.8-
0.6
0.4-
0.2-
0.0
SOIL SCI. SOC. AM. J., VOL. 52, 1988
i.o
NONLINERR MODELdynamic Isothermbatch isotherm
2 3 4PORE VOLUMES
Fig. 7. Observed NHJ effluent concentrations from the Walker dis-placement experiment with predicted curves determined from themodel of Parker and Jardine (1986) using dynamic and batchNH</Ca2+ isotherm. In this case the model considers equilibrium,linear or nonlinear adsorption on one type of site.
more appropriate to use a transport model, however,which includes nonlinear isotherms. Consideringcommonly used linearization techniques first (Parkerand Jardine, 1986), Rdisl values were obtained for es-timating NH| displacement experiments on large un-disturbed Walker columns at / = 0.1 (Table 3). Whenindependently measured Rdisl were used in the linearmodel (all parameters known), predicted ETC greatlyoverestimated the observed amount of adsorbedNH| on the large Walker column (Fig. 5) resulting inlow r2 and high SSQ values (Table 3). Values of JRundist
for Walker soil were significantly less than Rd'st, withthe former values agreeing well with best-fit modelretardations, .Rfit (Table 3). The use of Rund'si in themodel resulted in predicted ETC which agreed wellwith the observed NH^ displacement experiment onthe large Walker column (Table 3, Fig. 5).
To strictly consider the functional relationship be-tween the equilibrium adsorbed and solution phaseNH^ concentrations, the model developed by Fluhlerand Jury (1983) and modified by Parker and Jardine(1986) was utilized. It is used here to consider equi-librium adsorption of NH^ on one type of site wherek is a function of the solution NH^ concentration. Theadsorption isotherm is defined by Eq. [6] and exten-sive experimental studies by Jensen and Babcock(1973) indicate that the function kvi (sit+/E,) is inde-pendent of ionic strength. Thus, by using £„(£,+/£,)determined via Eq. [7] from an isotherm at one ionicstrength, the isotherm at any other ionic strength maybe calculated (Parker and Jardine, 1986). Dynamic andbatch equilibrium adsorption isotherms determinedon Walker soil at / = 0.03 were used in this modelto predict NH^ mobility through the large Walker col-umn at / = 0.1 (Fig. 7). The dynamic isotherm de-termined on undisturbed samples described the ob-served data well whereas the batch isothermdetermined on disturbed samples overestimated theamount of NH^ adsorbed on the Walker soil. Thismodel is solve numerically with no parameter esti-mation schemes and it rigorously handles nonlinearadsorption isotherms. Therefore, adsorption iso-
E-i<HOLf->ZLJOZOoaLJo:DaLJoc.
0.8-
0.6-
0.4-
0.2-
0.0
WHLKEROBSERVED °TWO-SITE, LINERR MODELR-2.21 F and a fitted
F = 0.23«0.05a-0.05'0.10
0 1 2 3 4 5PORE VOLUMES
Fig. 8. Observed NH4+ effluent concentrations from the Walker dis-
placement experiment with a fictitious best-fit curve determinedfrom the two-site, linear model using Rd{" obtained from the dis-turbed, batch NH^/Ca2+ isotherm.
therms determined by batch methods appear inappro-priate for predicting solute attentuation, via saturatedflow, through large undisturbed soil columns.
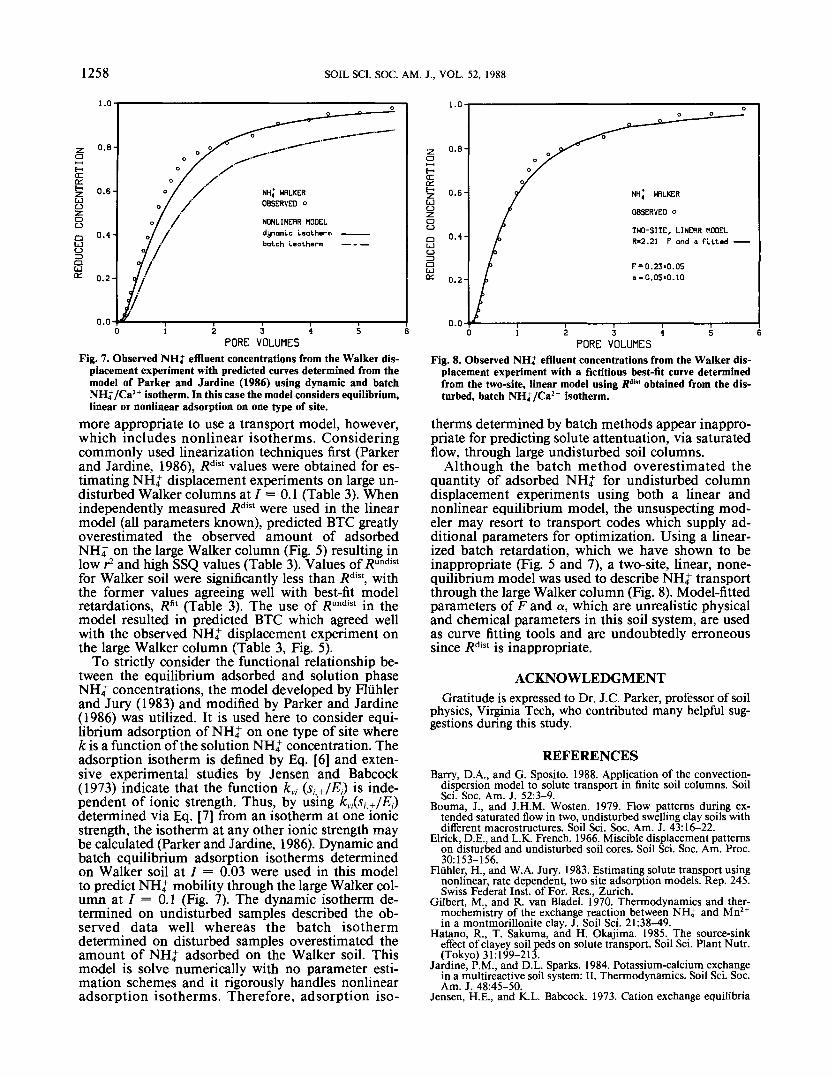
Although the batch method overestimated thequantity of adsorbed NH^ for undisturbed columndisplacement experiments using both a linear andnonlinear equilibrium model, the unsuspecting mod-eler may resort to transport codes which supply ad-ditional parameters for optimization. Using a linear-ized batch retardation, which we have shown to beinappropriate (Fig. 5 and 7), a two-site, linear, none-quilibrium model was used to describe NH^ transportthrough the large Walker column (Fig. 8). Model-fittedparameters of F and a, which are unrealistic physicaland chemical parameters in this soil system, are usedas curve fitting tools and are undoubtedly erroneoussince Rd'sl is inappropriate.
ACKNOWLEDGMENTGratitude is expressed to Dr. J.C. Parker, professor of soil
physics, Virginia Tech, who contributed many helpful sug-gestions during this study.

LEVY ET AL.: POTASSIUM-CALCIUM AND SODIUM-CALCIUM EXCHANGE ON KAOLINITE AND KAOLINITIC SOILS 1259