modeling the fate of toluene in a chamber with alfalfa ... · the plant and associated rhizosphere...
TRANSCRIPT

Journal of Hazardous Substance Research 5b-1Copyright 1998 Kansas State University
MODELING THE FATE OF TOLUENE IN A CHAMBERWITH ALFALFA PLANTS2. NUMERICAL RESULTS AND COMPARISON STUDYM. Narayanan1, J.C. Tracy2, L.C. Davis3, and L.E. Erickson1
Department of Chemical Engineeringl and Biochemistry3, Kansas State University, Manhattan,
KS 66506; Water Resources Center, Desert Research Institute2, Reno, NV 89506
Investigations were conducted in a chamber to study the role of alfalfa plants in bioremediating toluene.Modeling and experimental results indicate that in situ bioremediation of toluene in the presence of plants is feasibleand economical. This is primarily due to evapotranspiration which greatly enhances the vertical transport of dis-solved contaminants from the saturated zone to the rhizosphere, thereby increasing the possibility of aerobicdegradation. The fate of toluene was simulated and monitored for groundwater contaminated with toluene at satu-rated concentrations. FT-IR instrumentation was used to monitor toluene in the headspace gas of the vegetatedchamber. Overall mass balance, based on groundwater and headspace measurements, indicated about 75% loss orbiodegradation of toluene from the chamber during steady state. Evolution of significant amounts of CO
2 accounted
for mineralization of toluene. Simulation results predicted toluene biodegradation in the unsaturated zone where bothoxygen and toluene were present. Dispersion processes in the soil were characterized by bromide tracer analysis.Predictions from simulations were compared with the water content and toluene concentrations measured in thechamber.
Key words: biodegradation, toluene, gas phase diffusion, phytoremediation, soil, alfalfa
INTRODUCTION
Toluene is present in most sites contaminated with gasoline and related mixtures of petroleum
hydrocarbons. Leaking underground storage tanks and transporting pipelines are widespread sources
for toluene, a volatile organic chemical (VOC) which is classified by the U.S. EPA as a hazardous
organic pollutant. In addition to contaminating groundwater, VOCs may also partition into the gas phase
and be released into the atmosphere. Studies have indicated that bioremediation is an effective technol-
ogy in terms of economics, labor, and liability in remediating sites contaminated with toluene (Borden et
al., 1986; Lee et al., 1988). Under aerobic conditions, biodegradation of toluene in soils is usually rapid.
Several reviews on the degradation of toluene under controlled environments describe the
formation of intermediate products (Gibson and Subramanian, 1984). Biodegradation by indigenous soil
microbes of toluene in a BTEX mixture was demonstrated in laboratory experiments under aerobic,
denitrifying, iron-reducing, sulphate-reducing, and methanogenic conditions (Chen et al., 1992). Re-
cently, Jin et al. (1994) investigated the effect of microbial degradation on toluene transport through an
unsaturated soil column under varying soil conditions and toluene feed concentrations. They reported
that acclimatization of indigenous microbes greatly enhances toluene degradation and under such condi-
tions a 30 cm soil cover over a toluene source could prevent the volatilization of toluene to the atmo-
sphere. In their study, they were interested in biodegradation of toluene introduced in the unsaturated
zone. In the laboratory, Alvarez et al. (1994) studied toluene degradation by denitrifying aquifer micro-
organisms in order to extend results to in situ enhanced bioremediation schemes. They observed that
ABSTRACT
Volume 1
Journal of Hazardous Substance Research5b-2
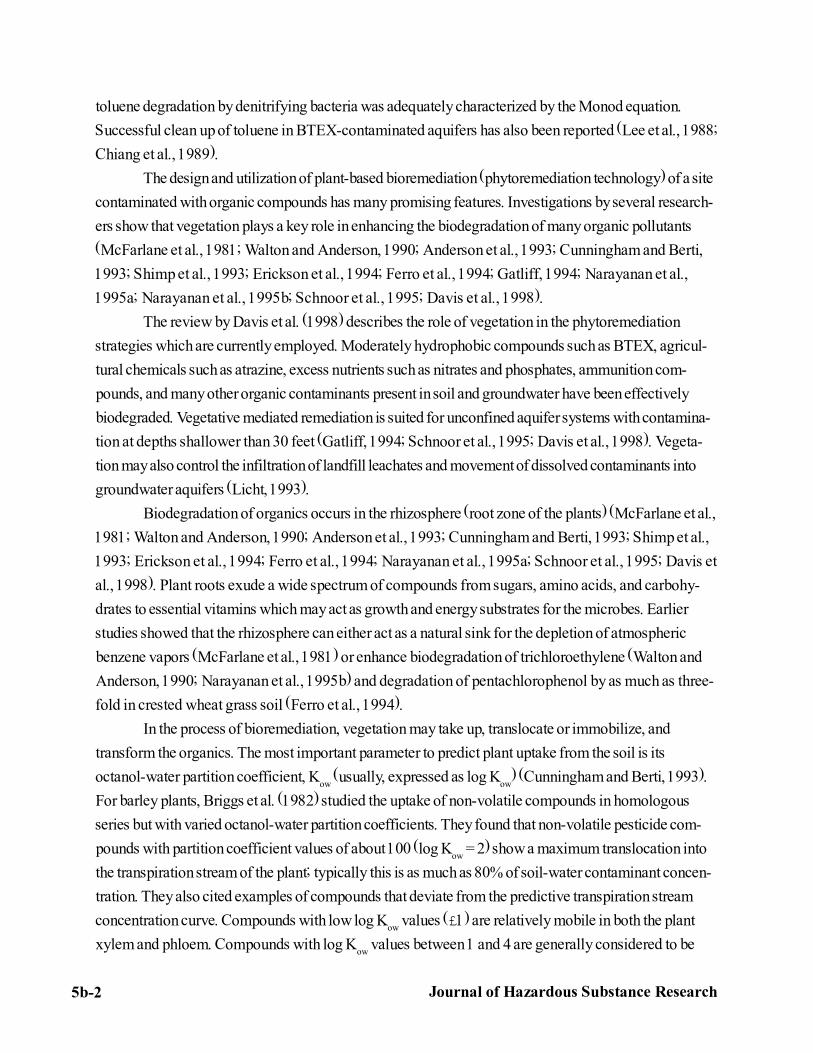
toluene degradation by denitrifying bacteria was adequately characterized by the Monod equation.
Successful clean up of toluene in BTEX-contaminated aquifers has also been reported (Lee et al., 1988;
Chiang et al., 1989).
The design and utilization of plant-based bioremediation (phytoremediation technology) of a site
contaminated with organic compounds has many promising features. Investigations by several research-
ers show that vegetation plays a key role in enhancing the biodegradation of many organic pollutants
(McFarlane et al., 1981; Walton and Anderson, 1990; Anderson et al., 1993; Cunningham and Berti,
1993; Shimp et al., 1993; Erickson et al., 1994; Ferro et al., 1994; Gatliff, 1994; Narayanan et al.,
1995a; Narayanan et al., 1995b; Schnoor et al., 1995; Davis et al., 1998).
The review by Davis et al. (1998) describes the role of vegetation in the phytoremediation
strategies which are currently employed. Moderately hydrophobic compounds such as BTEX, agricul-
tural chemicals such as atrazine, excess nutrients such as nitrates and phosphates, ammunition com-
pounds, and many other organic contaminants present in soil and groundwater have been effectively
biodegraded. Vegetative mediated remediation is suited for unconfined aquifer systems with contamina-
tion at depths shallower than 30 feet (Gatliff, 1994; Schnoor et al., 1995; Davis et al., 1998). Vegeta-
tion may also control the infiltration of landfill leachates and movement of dissolved contaminants into
groundwater aquifers (Licht, 1993).
Biodegradation of organics occurs in the rhizosphere (root zone of the plants) (McFarlane et al.,
1981; Walton and Anderson, 1990; Anderson et al., 1993; Cunningham and Berti, 1993; Shimp et al.,
1993; Erickson et al., 1994; Ferro et al., 1994; Narayanan et al., 1995a; Schnoor et al., 1995; Davis et
al., 1998). Plant roots exude a wide spectrum of compounds from sugars, amino acids, and carbohy-
drates to essential vitamins which may act as growth and energy substrates for the microbes. Earlier
studies showed that the rhizosphere can either act as a natural sink for the depletion of atmospheric
benzene vapors (McFarlane et al., 1981) or enhance biodegradation of trichloroethylene (Walton and
Anderson, 1990; Narayanan et al., 1995b) and degradation of pentachlorophenol by as much as three-
fold in crested wheat grass soil (Ferro et al., 1994).
In the process of bioremediation, vegetation may take up, translocate or immobilize, and
transform the organics. The most important parameter to predict plant uptake from the soil is its
octanol-water partition coefficient, Kow
(usually, expressed as log Kow
) (Cunningham and Berti, 1993).
For barley plants, Briggs et al. (1982) studied the uptake of non-volatile compounds in homologous
series but with varied octanol-water partition coefficients. They found that non-volatile pesticide com-
pounds with partition coefficient values of about 100 (log Kow
= 2) show a maximum translocation into
the transpiration stream of the plant; typically this is as much as 80% of soil-water contaminant concen-
tration. They also cited examples of compounds that deviate from the predictive transpiration stream
concentration curve. Compounds with low log Kow
values (£1) are relatively mobile in both the plant
xylem and phloem. Compounds with log Kow
values between 1 and 4 are generally considered to be

Journal of Hazardous Substance Research 5b-3
xylem mobile and phloem immobile. Compounds with high log Kow
values (³ 4) are generally not sub-
stantially translocated into the plants. Additionally, accumulation of organics, resulting from uptake and
immobilization, could also be phytotoxic. Researchers are extending the degrading capacity of soil
microflora to plants by incorporating microbial genes into the plant genomes to tackle this problem
(Stomp et al., 1994). Trapp and McFarlane (1995) discuss in much greater detail a wide range of
contaminants and their interaction with plants.
Evapotranspiration associated with photosynthesis helps plants to draw water up into the
vadose zone. This solar-driven pumping increases the net upward flux of water through the vadose
zone, thus lowering the groundwater table and decreasing the soil-water content. This results in in-
creased oxygen transfer by gas-phase diffusion in the soil. More importantly, evapotranspiration also
brings dissolved organics to the rhizosphere soil for biodegradation by the microbial consortia which are
supplied with basic nutrients from the plants. The solar-driven pumping may translocate organic pollut-
ants into plants, depending on their volatility and log Kow
.
The plant root system may also act as a pathway for the diffusion of oxygen to the rhizosphere
microflora (Shimp et al., 1993; Davis et al., 1998). Under aerobic conditions, the microbial consortia
may biodegrade the organics before they can be taken up and translocated into the plant. In summary,
the plant and associated rhizosphere act as an active and relatively favorable in situ bioreactor for the
growth of microbes and transformation of contaminants in two essential ways:
(a) Continuously supplying basic nutrients such as C, N, and P for microbial growth because of fixation
and exudation processes; and
(b) Enabling higher diffusivity of atmospheric oxygen into the soil as a result of the removal of water by
the evapotranspiration process.
The objective of this part of the work was to compare the results from laboratory experiments
performed in order to study the fate of toluene in presence of alfalfa plants with that of the modeling
results. Simulation results were obtained by employing a two-dimensional model. The model was
originally developed in three dimensions but was implemented in two dimensions for comparison with
experimental results (Narayanan et al., 1998). The detailed description of the experimental setup and
data collection from the experiments performed are described in Narayanan (1994).
EXPERIMENTAL STUDY
A chamber with two identical U-shaped channels each 10 cm wide, approximately 1.8 m in
axial flow length, and 35 cm in depth was employed (Figs. 1 and 2). The design and construction of this
chamber were described in Narayanan (1994). Silty sand soil (silt < 10%) collected from 3 zones along
the depth from near a landfill were packed in the channels. The description of the soil and packing were
described by Narayanan (1994). Alfalfa plant growth began with feeding toluene contaminated water to
the channel under laboratory conditions. Toluene was fed at saturated concentrations of 550 mg/L at

Journal of Hazardous Substance Research5b-4
26oC for 11 months. Four groundwater monitoring wells, installed along the axial flow length of the
channels, facilitated frequent monitoring of compound concentration in the saturated zone (Narayanan et
al., 1995a). Figure 2 shows the overhead view of the chamber with alfalfa plants, sampling ports, inlets,
and outlets. Figure 1 shows the frontal view of the chamber when it is imagined to be axially extended.
Alfalfa plants received continuous light energy from eight Cool-white fluorescent lamps posi-
tioned 40 cm above the soil surface in the chamber. The luminous intensity measured near the soil
surface indicated a value of 5-7 klx. However, a 24-hour averaged daily luminous intensity received on
a clear summer day is about 30 klx. A glass and aluminum enclosure 26 cm high was constructed above
the ground level to measure the headspace gas concentration. A small fan facilitated air mixing in the
enclosure. Water vapor condensed onto four refrigeration tubes in which coolant was circulating.
Headspace gas of the enclosed chamber was measured using a MIDAC Fourier Transform Infra Red
(FT-IR) instrument to detect toluene that was either evaporated through the soil pathway or transpired
through the plant pathway (Narayanan et al., 1995a). Carbon dioxide evolution into the headspace from
the rhizosphere soils was also measured using the FT-IR spectrophotometer (Narayanan et al., 1995a).
The adsorption characteristics of toluene were analyzed by making a step change in the inflow ground-
water concentration from water saturated with toluene to pure distilled water. The concentration of
toluene in the groundwater was measured regularly until the transient response was completed.
Tracer Experiment
To study the dispersion characteristics and movement of groundwater due to evapotranspiration
associated with vegetation, bromide tracer studies were conducted. Six liters of KBr solution were fed
at a concentration of 150 mg of KBr/L. The bromide tracer was input as a broad pulse for a period of
203 hours. The concentration of bromide in the groundwater samples collected from sampling wells was
measured using an ion chromatograph.
Contaminant degradation
During the steady state operation of the experiment, the concentration of toluene at various port
locations remained approximately uniform along the length of the channel and constant over the steady
state period of operation. In other words, spatial (along the axial length) and temporal variations in
toluene concentration were minimal. Fourier Transform Infra Red (FT-IR) headspace measurements of
the chamber showed that gas phase concentrations of toluene were below the detection limit of the
instrument of about 1 ppm (v/v). The results are already described in Narayanan et al. (1995a).
The indigenous, well-adapted, and mixed microbial consortia in the vadose zone contributed to
the loss of toluene that was transported in the vertical direction. Carbon dioxide evolution into the
headspace of the chamber suggested that about 50% of the inflow carbon was evolved as CO2 due to
aerobic biodegradation. Biodegradation was also reported in another independent study by Jin et al.
(1994). They observed that toluene was completely mineralized in the soil column with indigenous

Journal of Hazardous Substance Research 5b-5
microorganisms previously acclimated to toluene vapors. We have also repeated treatments with toluene
at 100 mL/L input in presence of trichloroethylene (TCE) at 10 mL/L or 100 mL/L and confirmed
complete disappearance of toluene but not TCE at a depth of 10-15 cm below the surface of the soil.
Water Content
During steady state operation, soil samples were collected from different locations and at
different depths from each location along the channel to measure the gravimetric water content. The
measurements indicated that the degree of saturation varied from about 70% near the surface (cor-
responding to a volumetric water content, q = 0.27) to about 99% near the groundwater table (q =
0.35) (Narayanan et al., 1995a) where the value of q approaches the porosity of the soil.
SIMULATING PHYSICAL CONDITIONS
As described in the previous section, the model parameters representing the physical conditions
within the experimental chamber and the influx of toluene are not expected to vary significantly across
the width of the chamber. Thus, the modeling domain can be simulated in two dimensions, these being
the vertical and the longitudinal flow directions. The channel was modeled as a two-dimensional spatial
grid with a network of 400 elements and 441 nodes. One of the dimensions for simulation was the
longitudinal direction, x, while the other dimension was the vertical direction, z. The 1.8 m long and 35
cm deep channel was discretized and subdivided into several regions. A schematic of this network of
partitioned regions is shown in Figure 3. Elements belonging to a particular region had the same size and
area. Region A had elements of size 5.5 cm X 2 cm, region B had elements of size 5.5 cm X 1 cm,
region C had elements of size 11 cm X 1 cm, region D had elements of size 12 cm X 1 cm, region E
had elements of size 11 cm X 2 cm, and region F had elements of size 12 cm X 2 cm (Figure 3). This
kind of partitioning was adopted in order to capture the sharp discontinuities in the concentration
profiles of solutes at the inlet boundary (x = 0 and z = 0-5 cm), soil surface (all x and z = 35 cm), and
outlet boundary (x = 180 cm and z = 0-5 cm). The largest and smallest element of this hypothetical
network of elements had areas of 24 and 5.5 cm2, respectively.
In Narayanan et al. (1998), Eqs. (1), (2), and (34)-(37) were a set of six coupled non-linear
partial differential equations in three dimensions. However, for comparison of numerical results with
experimental study, the three-dimensional model was implemented in only two dimensions. Then, the six
equations have 3 independent variables, t to represent temporal changes, and x, z to represent two
dimensional spatial variations. The six principal dependent variables that are simulated using the Eqs.
(1), (2), and (34)-(37) are Cs, C
b, C
o, C
r, y
s, and y
r (Narayanan et al., 1998). All other dependent
variables such as q, Ks, V
i, D
ij, x, and m are either explicity or implicitly related to the six principal
variables through constitutive mathematical relationships described in Narayanan et al. (1998).

Journal of Hazardous Substance Research5b-6
Initial and Boundary Conditions
The initial conditions (ICs) and boundary conditions (BCs) were developed based on the
physical setup of the laboratory chamber. The ICs at time t = 0 and all x, z for Eqs. (34)-(37) were
assumed for some cases as:C
s = 500 mg/L; C
b = 0.01 mg/L; C
r = 2 mg/L; C
o = 1 mg/L.
However, in some simulations the initial conditions for Eqs. (1), (2), and (34)-(37) were ob-
tained by initially assuming a steady state condition for the first time step of the simulation (Narayanan et
al., 1998). This condition was essentially obtained by setting the left hand side of Eqs. (1), (2), and
(34)-(37) to zero (Narayanan et al., 1998). The unknowns were then computed for all 441 nodes.
These values were then used as initial conditions for the following time steps of the simulation. After the
first time interval, subsequent computations were carried out in an unsteady state manner as given by
Eqs. (1), (2), and (34)-(37) (Narayanan et al., 1998).
For the boundary conditions at the inlet, x = 0 and z = 5 cm (Fig. 2), the inflow conditions were
assumed as distributed influx boundary conditions. The inflow rate was assumed to be distributed on a
boundary represented by x = 0 and z = 0-5 cm in the experimental chamber. This assumption was
made to avoid any complexities introduced into the simulation by imposing a point source to the domain.
Hence, at the inlet boundary while simulating the soil-water flow Eq. (1), the daily recorded water inflow
rate to the channel was assumed as a distributed influx to the system at the inlet boundary (x = 0 and z =
0-5 cm). For simulating species transport Eqs. (34)-(37) (Narayanan et al., 1998) during contaminant
feeding operation, the following boundary conditions were used at the inlet boundary: Cs = 550 mg/L,
Cb = 0, C
o = 8 mg/L, and C
r = 0. However, during pure water feeding operation, in order to study
sorption characteristics, the following boundary conditions were used at the inlet boundary: Cs = 0, C
b =
0, Co = 8 mg/L, and C
r = 0. The inlet oxygen concentration C
o was 8 mg/L during all feeding operations
because the input feed water is always saturated with dissolved oxygen. This may be compared to a
situation where the subsurface groundwater is replenished by recharging with water at saturated concen-
trations of dissolved oxygen (8 mg/L).
A similar distributed outflux assumption was made at the outlet, x = 180 cm and z = 5 cm.
Outflow was assumed to be distributed on a boundary represented by x = 180 cm and z = 0-5 cm of
the chamber. For simulating the water outflow from the outlet boundary, a constant head boundary
condition was used in the model. The total soil-water pressure head was set at 0.05 m at the outlet
boundary (x = 180 and z = 0-5 cm). In transport equations (34)-(37), the gradient in concentration was
assumed to be zero at the outlet boundary (x = 180 cm and z = 0-5 cm).
∂∂
= ∂∂
= ∂∂
= ∂∂
=C
x
C
x
C
x
C
xs r b o 0

Journal of Hazardous Substance Research 5b-7
For soil and root-water flow Eqs. (1) and (2) (Narayanan et al., 1998), boundary conditions at
the surface were the outflux of water from the soil surface based on the total observed evapotrans-
piration (ET). The total observed evapotranspiration rate was used to calculate the potential evap-
oration (Eq. (13) (Narayanan et al., 1998)) and transpiration rates (Eq. (18) (Narayanan et al., 1998))
from the vegetated system. For solute transport according to Eqs. (34)-(37) (Narayanan et al., 1998),
at the soil surface, the following assumptions were made. Oxygen from the atmosphere was assumed to
diffuse into the chamber through the gas and aqueous phases. In other words, the oxygen concentration
of soil-water at the surface was assumed to be saturated with oxygen because of rapid partitioning of
atmospheric O2 into surface soil-water. The contaminant concentration was assumed to be zero at the
soil surface. This was done in order to be consistent with the experimental observations reported by
Narayanan et al. (1995a). Concentrations of microbial biomass and root exudates were assumed to be
a no flux or impermeable boundary condition at the soil surface. In the finite element procedure, the no
flux boundary condition is assumed to occur when no alternate boundary condition is specified. In other
words, an impermeable boundary condition is used at the following boundaries: for all x and z = 0, for
x = 0 and z = 5-35cm, and for x = 180 cm and z = 5-35 cm.
MODEL EXECUTION AND AVAILABILITY
The simulation runs of the model were mostly performed in a SUN SPARCstation-20 or SUN
SPARCstation-10. The execution speed of the model depended on a number of factors other than the
computer resources itself. The execution speed was determined by the number of finite elements used to
represent the domain, the time step of simulation, and the final time of simulation. For the modeling
configuration shown in Figure 3, it was observed that a computer simulation of bromide tracer transport
through the channel for about 40 days at a time step of 4 hours consumed about 10 minutes in the
above mentioned SUN SPARCstations. However, execution of the same simulation on a 486DX2-
66MHz personal computer consumed about 35 minutes of computer time. Similarly, a computer simula-
tion of toluene transport through the channel for about 85 days at a time step of 4 hours consumed
about 50 minutes of computer time in the SUN SPARCstations, while simulation runs on a 486DX2-
66MHz personal computer consumed about 4 hours. It must be emphasized that when time step was
decreased for toluene simulations from 4 hours to 0.1 hours, the time taken on SUN SPARCstations
dramatically increased from 50 minutes to 5 hours. The model named as BIOROOT is currently being
made user friendly and will be available for contaminated site predictions upon written request to
authors when this work is completed.

Journal of Hazardous Substance Research5b-8
RESULTS AND DISCUSSION
Soil and root characteristic parameters
Tables 1 and 2 show the values of the various soil and plant characteristic parameters used for
the simulation study. The silty sand soil was assumed to have a saturated hydraulic conductivity (Ksat
) of
0.38 m/hr and porosity (h) of 0.35. Bulk density of soil was measured to be 1.5 g/cm3. These values
are typically used for sandy soil (Feddes et al., 1975; Tracy and Marino, 1989; Chen et al., 1992). The
soil characteristic parameters, A = 0.5 m, c = 0.9, and d = 3.5, used in Eqs. (4) and (5) (Narayanan et
al., 1998), were based on experimentally obtained water content values in the laboratory chamber
(Narayanan et al., 1995a). Winter (1983) discussed in detail the influence of parameters A, c, and d on
the shapes of the profiles of effective water saturation (Se) versus soil-water pressure head (y
s), and
hydraulic conductivity (Ks) versus effective water saturation (S
e). The plant characteristic parameters,
such as Kr and G used in simulation were obtained from previous results from either field or laboratory
experiments (Marino and Tracy, 1988; Tracy and Marino, 1989).
Bromide tracer simulation study
A bromide tracer was introduced into the toluene-fed channel in order to study its longitudinal
and axial dispersion characteristics and soil-water movement under the influence of evapotranspiration
associated with vegetation. The movement of the tracer was modeled as a conservative solute flowing in
the groundwater of the chamber with transpiring alfalfa plants. The soil components such as biomass,
root exudates, and oxygen transport represented by Eqs. (35)-(37) (Narayanan et al., 1998) were
assumed to remain unaffected during bromide tracer studies. To model the bromide tracer transport in
the channel, Eq. (34) (Narayanan et al., 1998) was modified to account for convective-dispersive
transport of the tracer in presence of transpiring alfalfa plants. Equation (34) may then be written as
shown below with all symbols retaining their same meanings.
∂∂
= ∂∂
∂∂
−LNMM
OQPP
=t
Cx
Dx
C V C i jki
ijj
k i kθ θb g b g , ,1 2 (53)
V1 (or V
x) and V
2 (or V
z) represent the advective fluxes of water in the soil and are determined
using Darcy�s law (Eq. 7 (Narayanan et al., 1998)). The soil-water pressure head distribution in Darcy�s
law is evaluated using Eqs. (1) and (2) (Narayanan et al., 1998). Modeling of the tracer transport was
then performed using the three equations (Eqs. (1), (2), and (53)) simultaneously with initial and bound-
ary conditions described earlier. The measured inlet feed water flow rate and measured inlet concentra-
tion of bromide were used as inlet boundary conditions at x = 0, and z = 0-5 cm.
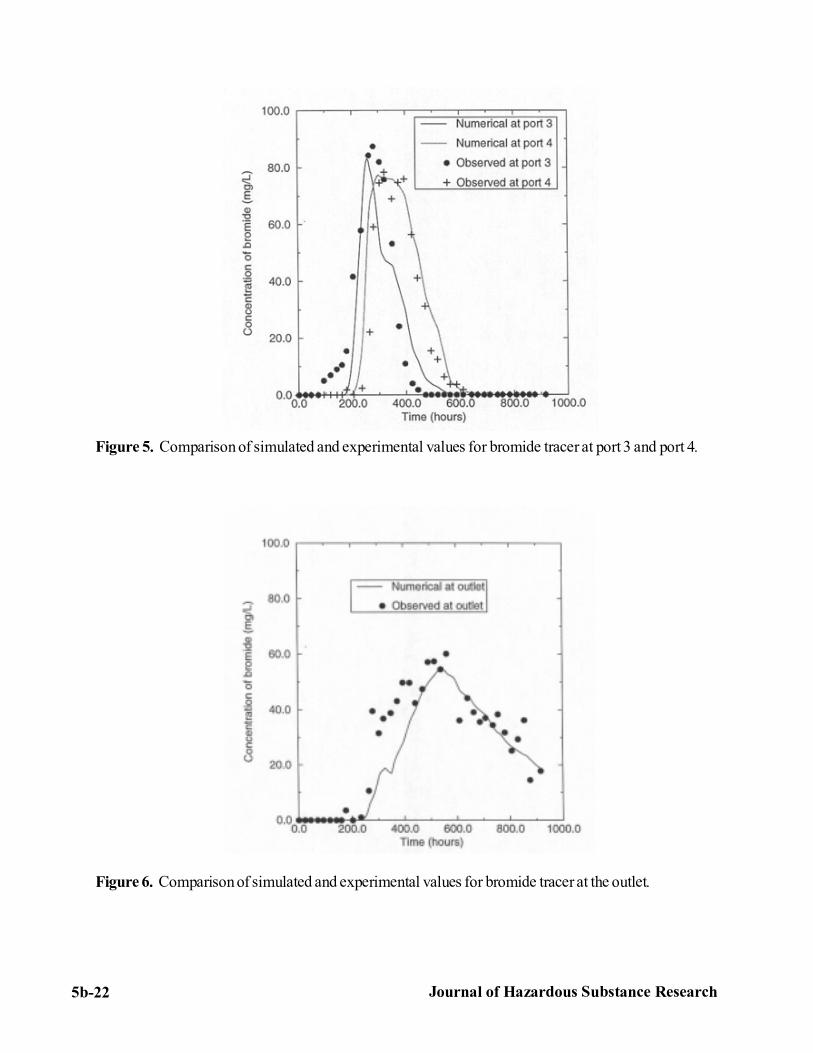
Figures 4-6 show the comparison between the experimental and modeling studies for bromide
tracer at ports 1 and 2, 3 and 4, and outlet, respectively. A good comparison between the experimental
and simulated curves was obtained; however, the predicted bromide concentration is less than the
Journal of Hazardous Substance Research 5b-9
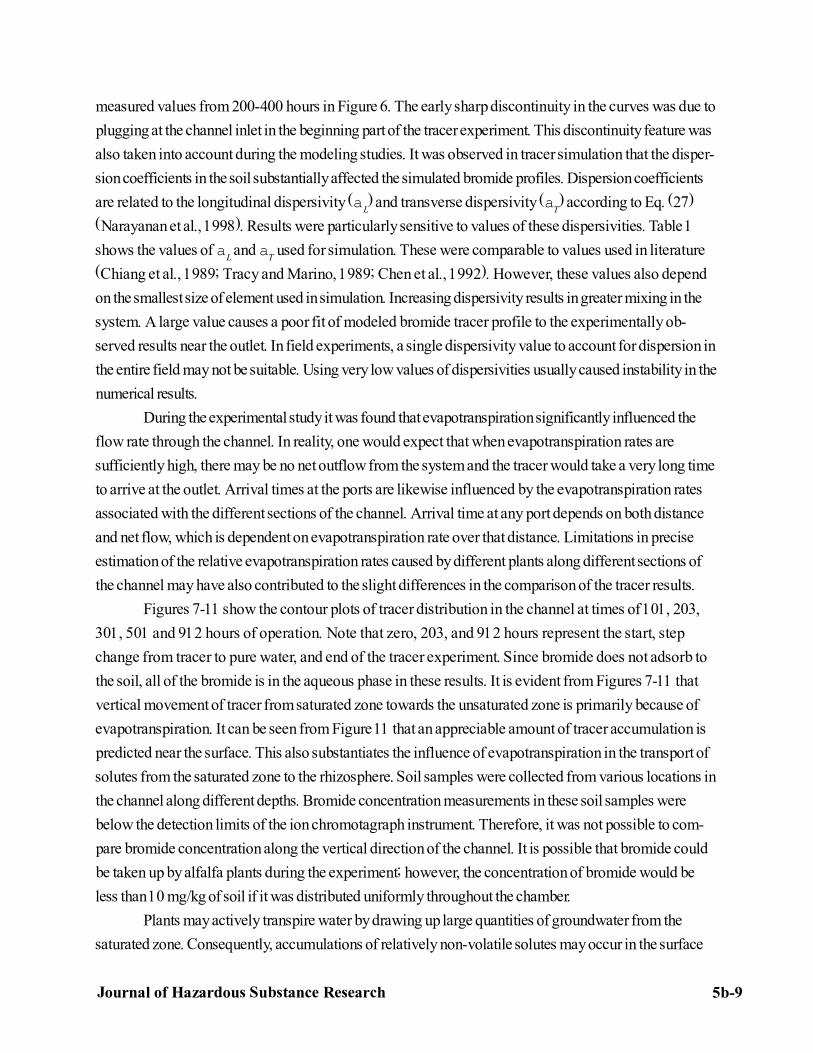
measured values from 200-400 hours in Figure 6. The early sharp discontinuity in the curves was due to
plugging at the channel inlet in the beginning part of the tracer experiment. This discontinuity feature was
also taken into account during the modeling studies. It was observed in tracer simulation that the disper-
sion coefficients in the soil substantially affected the simulated bromide profiles. Dispersion coefficients
are related to the longitudinal dispersivity (aL) and transverse dispersivity (a
T) according to Eq. (27)
(Narayanan et al., 1998). Results were particularly sensitive to values of these dispersivities. Table 1
shows the values of aL and a
T used for simulation. These were comparable to values used in literature
(Chiang et al., 1989; Tracy and Marino, 1989; Chen et al., 1992). However, these values also depend
on the smallest size of element used in simulation. Increasing dispersivity results in greater mixing in the
system. A large value causes a poor fit of modeled bromide tracer profile to the experimentally ob-
served results near the outlet. In field experiments, a single dispersivity value to account for dispersion in
the entire field may not be suitable. Using very low values of dispersivities usually caused instability in the
numerical results.
During the experimental study it was found that evapotranspiration significantly influenced the
flow rate through the channel. In reality, one would expect that when evapotranspiration rates are
sufficiently high, there may be no net outflow from the system and the tracer would take a very long time
to arrive at the outlet. Arrival times at the ports are likewise influenced by the evapotranspiration rates
associated with the different sections of the channel. Arrival time at any port depends on both distance
and net flow, which is dependent on evapotranspiration rate over that distance. Limitations in precise
estimation of the relative evapotranspiration rates caused by different plants along different sections of
the channel may have also contributed to the slight differences in the comparison of the tracer results.
Figures 7-11 show the contour plots of tracer distribution in the channel at times of 101, 203,
301, 501 and 912 hours of operation. Note that zero, 203, and 912 hours represent the start, step
change from tracer to pure water, and end of the tracer experiment. Since bromide does not adsorb to
the soil, all of the bromide is in the aqueous phase in these results. It is evident from Figures 7-11 that
vertical movement of tracer from saturated zone towards the unsaturated zone is primarily because of
evapotranspiration. It can be seen from Figure 11 that an appreciable amount of tracer accumulation is
predicted near the surface. This also substantiates the influence of evapotranspiration in the transport of
solutes from the saturated zone to the rhizosphere. Soil samples were collected from various locations in
the channel along different depths. Bromide concentration measurements in these soil samples were
below the detection limits of the ion chromotagraph instrument. Therefore, it was not possible to com-
pare bromide concentration along the vertical direction of the channel. It is possible that bromide could
be taken up by alfalfa plants during the experiment; however, the concentration of bromide would be
less than 10 mg/kg of soil if it was distributed uniformly throughout the chamber.
Plants may actively transpire water by drawing up large quantities of groundwater from the
saturated zone. Consequently, accumulations of relatively non-volatile solutes may occur in the surface

Journal of Hazardous Substance Research5b-10
soils. This result implies that dissolved contaminants associated with groundwater may also be drawn up
to the rhizosphere as part of the phytoremediation strategy. Therefore, evapotranspiration should
enhance the contaminant availability to the indigenous microbes present in the rhizosphere. This subse-
quently enhances the bioremediation process to a great extent. Moreover, in relatively less humid states,
like Kansas, where evapotranspiration usually exceeds the overall annual precipitation,
phytoremediation strategies could be very effective by efficiently managing a plant ecosystem.
Contaminant fate simulation results
Equations (34)-(37) (Narayanan et al., 1998) were used to model the fate of the contaminants
in the rhizosphere. Parameter values used in modeling toluene degradation in the rhizosphere are shown
in Table 3. The simulation study involved adjusting the kinetic parameters in the model in order to obtain
reasonable comparison between experimental and simulated data. The parameters adjusted were
maximum specific growth rate, endogenous decay rates, and Monod saturation constant for toluene and
oxygen. The values listed in Table 3 for these parameters are quite comparable to values found in
literature (Chiang et al., 1989; Chen et al., 1992). The developed model considers only the aerobic
degradation of contaminants in the rhizosphere (Narayanan et al., 1998). Figures 12-15 show the
contour plots for distribution of water content, toluene, biomass, and oxygen in the channel during
steady state. Figure 12 shows the volumetric water content distribution during this period of operation.
The soil-water content in the vadose zone of the shallow system was observed to be relatively high
(Narayanan et al., l995a). The water content variation along the axial length of the channel was insignifi-
cant as compared to variation in the vertical direction. The volumetric water content varied from 0.35
(100% of effective saturation) at the bottom to 0.27 (73% of effective saturation) at the top. This was in
good agreement with experimentally measured water content values (Narayanan et al., 1995a). These
relatively high saturation values are expected in a shallow system with actively transpiring plants. Usually,
the capillary zone extends to about 10-15 cm above the groundwater table for fine sandy soil.
Figure 13 reveals the steady state simulated concentration profiles for toluene at various depths
of the channel. The simulated toluene concentration remained approximately constant along the axial
length at the bottom of the channel during the simulation. This is consistent with the experimental data
presented earlier (Narayanan et al., 1995a). The simulated toluene concentration progressively de-
creased from the bottom to the top of the channel where it approached a concentration of 0 ppm. This
was again consistent with the FT-IR measurements of the headspace of the enclosed chamber. It is
therefore clear that toluene movement was significantly influenced by evapotranspiration and toluene
disappeared in the vadose zone. This disappearance was primarily attributed to the aerobic microbial
degradation of toluene in the vadose zone. This is supportive of results from studies performed by Jin et
al. (1994).
Figure 14 shows that biomass accumulation was high near the inlet of the channel because of the
Journal of Hazardous Substance Research 5b-11
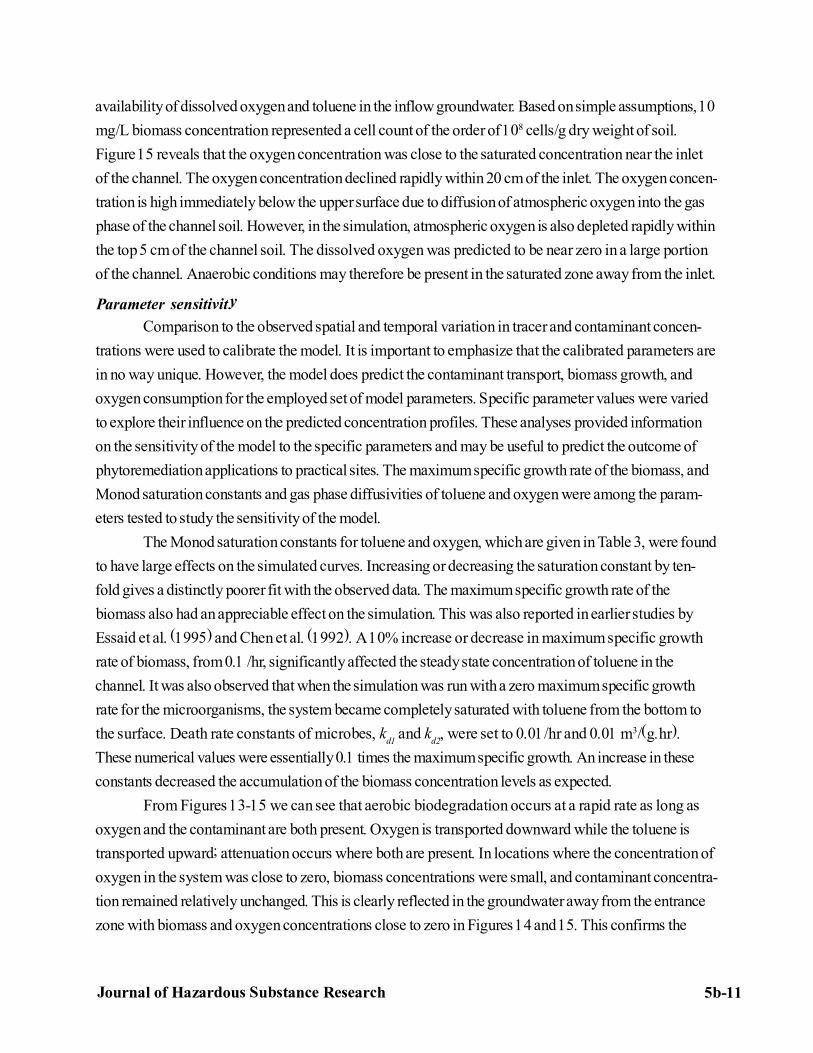
availability of dissolved oxygen and toluene in the inflow groundwater. Based on simple assumptions, 10
mg/L biomass concentration represented a cell count of the order of 108 cells/g dry weight of soil.
Figure 15 reveals that the oxygen concentration was close to the saturated concentration near the inlet
of the channel. The oxygen concentration declined rapidly within 20 cm of the inlet. The oxygen concen-
tration is high immediately below the upper surface due to diffusion of atmospheric oxygen into the gas
phase of the channel soil. However, in the simulation, atmospheric oxygen is also depleted rapidly within
the top 5 cm of the channel soil. The dissolved oxygen was predicted to be near zero in a large portion
of the channel. Anaerobic conditions may therefore be present in the saturated zone away from the inlet.
Parameter sensitivity
Comparison to the observed spatial and temporal variation in tracer and contaminant concen-
trations were used to calibrate the model. It is important to emphasize that the calibrated parameters are
in no way unique. However, the model does predict the contaminant transport, biomass growth, and
oxygen consumption for the employed set of model parameters. Specific parameter values were varied
to explore their influence on the predicted concentration profiles. These analyses provided information
on the sensitivity of the model to the specific parameters and may be useful to predict the outcome of
phytoremediation applications to practical sites. The maximum specific growth rate of the biomass, and
Monod saturation constants and gas phase diffusivities of toluene and oxygen were among the param-
eters tested to study the sensitivity of the model.
The Monod saturation constants for toluene and oxygen, which are given in Table 3, were found
to have large effects on the simulated curves. Increasing or decreasing the saturation constant by ten-
fold gives a distinctly poorer fit with the observed data. The maximum specific growth rate of the
biomass also had an appreciable effect on the simulation. This was also reported in earlier studies by
Essaid et al. (1995) and Chen et al. (1992). A 10% increase or decrease in maximum specific growth
rate of biomass, from 0.1 /hr, significantly affected the steady state concentration of toluene in the
channel. It was also observed that when the simulation was run with a zero maximum specific growth
rate for the microorganisms, the system became completely saturated with toluene from the bottom to
the surface. Death rate constants of microbes, kd1
and kd2
, were set to 0.01/hr and 0.01 m3/(g.hr).
These numerical values were essentially 0.1 times the maximum specific growth. An increase in these
constants decreased the accumulation of the biomass concentration levels as expected.
From Figures 13-15 we can see that aerobic biodegradation occurs at a rapid rate as long as
oxygen and the contaminant are both present. Oxygen is transported downward while the toluene is
transported upward; attenuation occurs where both are present. In locations where the concentration of
oxygen in the system was close to zero, biomass concentrations were small, and contaminant concentra-
tion remained relatively unchanged. This is clearly reflected in the groundwater away from the entrance
zone with biomass and oxygen concentrations close to zero in Figures 14 and 15. This confirms the

Journal of Hazardous Substance Research5b-12
findings of earlier studies that suggest that aerobic degradation will occur rapidly and can often be
treated as occurring instantaneously (Borden et al., 1986; Rifai et al., 1988; Essaid et al., 1995).
Effective gas-phase diffusivity of toluene was simulated using the Millington-Quirk equation, Eq.
(26), based on the gas fraction in the system. It was observed that gas phase diffusivity, Das
of toluene
significantly affected the steady state aqueous phase profiles shown in Figure 13. If Das
was decreased
by two orders of magnitude, then the concentration of toluene increased in the aqueous phase through-
out the system. Similarly, decreasing Dao
for oxygen by two orders of magnitude resulted in decreased
aerobic zones in the soil.
WASHOUT OF TOLUENE
The parameter values used for the washout study are the same as those used to simulate the
steady state performance of the system (Tables 1-3). The soil-adsorption coefficient (Kds
) in Table 3
was calculated from Eq. (23) (Narayanan et al., 1998) with Koc
= 150 and foc
= 0.0025. During the
setup of the experimental system it was determined that the organic matter content was about 0.3% in
the bottom soil of the toluene channel. However, for the simulation, organic carbon content was taken to
be 0.25% at the bottom of the toluene channel. Figures 16-18 show the comparison between the
modeling and experimental results during the washout of toluene following a step change in feed water
from saturated toluene concentrations to pure water using 0.25% organic carbon in the simulation.
Washout simulations indicated that the organic carbon content in soil has a significant impact in modeling
washout of toluene from groundwater. The experimental results show that toluene concentration de-
creases slowly with time. This may be due to preferential flow and regions of the chamber where the
fluid interchanges slowly with the bulk flow. This tailing effect does not appear to be present in the
bromide data; this may be due to the short time available for bromide to enter these relatively stagnant
regions. The difference may also be due to the greater tendency for toluene to adsorb to soil. The time
required to remediate the chamber is somewhat longer than that predicted by the model; however,
tailing is commonly observed at field sites.
Parameter sensitivity
Sensitivity analyses were also performed to study the effect of the adsorption coefficient of
toluene to the soil particle surfaces. It was found that soil-adsorption coefficient appreciably affected the
washout simulation of toluene. The adsorption coefficient values were varied based on the soil organic
carbon content. Running the toluene washout simulation without including adsorption, by assuming the
soil organic carbon content (foc
) as zero, gave a significantly faster washout. When the organic carbon
content was assumed to be 10-fold higher at 2.5% as compared to 0.25%, it was seen that the simula-
tion study took a relatively longer period for washout of toluene from the channel because of more
toluene adsorption onto soil.
By choosing an overall value for organic carbon content in chamber soil (foc
= 0.5% g/100 g of soil), it

Journal of Hazardous Substance Research 5b-13
was observed that relatively reasonable fits were obtained between the experimental and simulated
values for ports 1 and 2. However, the comparison with the data at ports 3, 4, and the outlet were then
relatively poorer. Similarly, when the organic carbon content was changed to fit the washout data at
ports 3, 4, and the outlet, the fit for ports 1 and 2 was relatively poorer. These difficulties may also be
associated with proper modeling of the flow in the channel because of the 180o U-turn and channeling.
A compromised value for organic carbon content (foc
= 0.0025) was used for simulation.
These studies clearly indicate that soil adsorption is an important process during toluene trans-
port through the soil. In an aquifer where soil organic matter is relatively high, significant adsorption of
toluene could occur and hence influence the transport of toluene. This washout experiment was con-
ducted after steady state concentrations of toluene should have been attained in regions of slow flow.
Washout experimental data suggests that there are regions where flow is slower and that these are not
well-represented in the dispersion model.
CONCLUSIONS
The simulation of phytoremediation in the experimental chamber with growing alfalfa plants and
toluene provided valuable results on the effect of vegetation in the bioremediation strategy for toluene
contaminated sites. Numerical and experimental results indicate that evapotranspiration associated with
alfalfa plants significantly influenced the vertical movement of solutes from the saturated zone to the
unsaturated zone of soil. This upward movement of water and dissolved solutes increased the availability
of organic substrates to the indigenous aerobic microorganisms in the root zone of plants. Simulations
indicated complete degradation of toluene in the vadose zone. Microbial growth rate, gas phase
diffusivities of toluene and oxygen, and adsorption of toluene affect the fate of toluene in the chamber.
The observed experimental results were in reasonable agreement with those predicted by a mathemati-
cal model which includes evapotranspiration, plant uptake, biodegradation, adsorption, oxygen transfer,
and microbial growth processes. However, in the toluene washout study, the actual time required to
remediate the site was considerably longer than that predicted by the model. Finally, alfalfa plants are
capable of growing in laboratory conditions even when relatively high concentrations of toluene are fed
continuously for long periods of time.
ACKNOWLEDGMENTS
This research was partially supported by the U.S. EPA under assistance agreements R-815709
and R-819653 to the Great Plains-Rocky Mountain Hazardous Substance Research Center for regions
7 and 8 under projects 94-12 and 94-27, and an EPA EPSCoR grant. It has not been submitted to the
EPA for peer review and, therefore, may not necessarily reflect views of the agency and no official
endorsement should be inferred. The U.S. Department of Energy, Office of Environmental Restoration
and Waste management, Office of Technology Development and the Center for Hazardous Substance
Research also provided partial funding. Students of the Fateley-Hammaker group are thanked for

Journal of Hazardous Substance Research5b-14
assistance in making FT-IR measurements. Ryan Green is thanked for assistance in the KBr study. This
is contribution # 97-436-J of the Kansas Agriculture Experiment Station.
NOMENCLATURE
A soil characteristic parameter (m)
c soil characteristic parameter
Ck
concentration of solute k (tracer in this study) in aqueous phase (g/m3)
d soil characteristic parameter
Dak
gas phase diffusion coefficient of solute k (m2/hr)
Dij
hydrodynamic dispersion coefficient (m2/hr)
Kdk
adsorption coefficient of solute k onto soil particles (m3/g)
Ksat
saturated hydraulic conductivity in soil (m/hr)
Ks, ij; r, ij
hydraulic conductivity of soil and root, respectively (m/hr)
Se
effective saturation (m3/m
3) (dimensionless)
t time (hr)
Vi
convective volumetric flux in the ith direction (m/hr)
x, z Cartesian coordinates (m) (axial and vertical directions, respectively)
Greek
aL
dispersivity factor in the soil in the longitudinal direction (m)
aT
dispersivity factor in the soil in the transverse direction (m)
G lumped parameter describing the permeability of a plant�s root
mm
maximum specific growth rate for biomass (1/hr)
q volumetric soil-water content (m3/m
3) (dimensionless)
ys,r
soil-water and root-water pressure head (m)
Subscripts
i, j ( for i, j = x, z) spatial indexk contaminant (s), biomass (b), oxygen (o), or exudates (r)

Journal of Hazardous Substance Research 5b-15
LITERATURE CITEDAlvarez, P.J.J., P.J. Anid, and T.M. Vogel, 1994. Kinetics of Toluene Degradation by Denitrifying
Aquifer Microorganisms, J. Environ. Engrg., 120 (5), pp. 1327-1336.Anderson, T.A., E.A. Guthrie, and B.T. Walton, 1993. Bioremediation in the Rhizosphere, Environ. Sci.
Technol., 27, pp. 2630-2636.Borden, R.C., P.B. Bedient, M.D. Lee, C.H. Ward, and J.T. Wilson, 1986. Transport of Dissolved
Hydrocarbons Influenced by Oxygen-limited Biodegradation 2. Field Application, WaterResour. Res., 22 (13), pp. 1983-1990.
Briggs, G.G., R.H. Bromilow, and A.A. Evans, 1982. Relationships Between Lipophilicity and RootUptake and Translocation of Non-ionized Chemicals by Barley, Pestic. Sci., 13, pp. 495-504.
Chen, Y.M., L.M. Abriola, P.J.J. Anid, and T.M. Vogel, 1992. Modeling Transport and Biodegradationof Benzene and Toluene in Sandy Aquifer Material: Comparison with Experimental Results,Water Resour. Res., 28 (7), pp. 1833-1847.
Chiang, C.Y., J.P. Salanitro, E.Y. Chai, J.D. Colhart, and C.L. Klein, 1989. Aerobic Biodegradation ofBenzene, Toluene and Xylene in a Sandy Aquifer-Data Analysis and Computer Modeling,Ground water, 27 (6), pp. 823-834.
Cunningham, S.D., and W.R. Berti, 1993. Remediation of Contaminated Soils with Green Plants: AnOverview, In Vitro Cell. Dev. Biol.-Plant, 29P, pp. 207-212.
Davis, L.C., M.K. Banks, A.P. Schwab, M. Narayanan, L.E. Erickson, and J.C. Tracy, 1998. Plant-based Bioremediation, In: S.K. Sikdar and R.L. Irvine (Eds.), Bioremediation: Principles andPractice, vol. 2, Technomic Publ. Co., Lancaster, PA, pp 183-219.
Erickson, L.E., M.K. Banks, L.C. Davis, A.P. Schwab, M. Narayanan, K. Reilley, and J.C. Tracy,1994. Using Vegetation to Enhance In-situ Bioremediation, Environ. Progress, 13, pp. 226-231.
Essaid, H.I., B.A. Bekins, E.M. Godsy, E. Warren, M.J. Baedecker, and I.M. Cozzarelli, 1995.Simulation of Aerobic and Anaerobic Biodegradation Processes at a Crude Oil Spill Site,Water Resour. Res., 31 (12), pp. 3309-3327.
Feddes, R.A., S.P. Neuman, and E. Bresler, 1975. Finite Element Analysis of Two-dimensional Flow inSoils Considering Water Uptake by Roots: II. Field Applications, Soil Sci. Soc. Am. J., 39, pp.231-237.
Ferro, A.M., R.C. Sims, and B. Bugbee, 1994. Hycrest Crested Wheatgrass Accelerates the Degrada-tion of Pentachlorophenol in Soil, J. Environ. Qual., 23, pp. 272-279.
Gatliff, E.G., 1994. Vegetative Remediation Process Offers Advantages Over Traditional Pump-and-treat Technologies, Remediation, 4 (3), pp. 343-352.
Gibson, D.T., and Subramanian, 1984. Microbial Degradation of Aromatic Hydrocarbons, In: D.T.Gibson (Ed.), Microbial Degradation of Organic Compounds, Marcel Dekker, Inc., NY, pp.181-252.
Jin, Y., T. Streck, and W.A. Jury, 1994. Transport and Biodegradation of Toluene in Unsaturated Soil,J. Contam. Hydrol., 17, pp. 111-127.
Lee, M.D., J.M. Thomas, R.C., Borden, and P.B. Bedient, 1988. Biorestoration of Aquifers Contami-nated with Organic Compounds, Crit. Rev. Environ. Control, 18, pp. 29-89.
Licht, L.A., 1993. Ecolotree Cap - Densely Rooted Trees for Water Management on Landfill Covers,Proc. Air and Waste Management Association, 86th Annual Meeting, Paper No. 93-WA-89.07.

Journal of Hazardous Substance Research5b-16
Marino, M.A., and J.C. Tracy, 1988. Flow of Water Through a Root-soil Environment, J. Irrig. andDrain. Engrg., ASCE, 114 (4), pp. 588-604.
McFarlane, J.C., A. Cross, C. Frank, and R.R. Rogers, 1981. Atmospheric Benzene Depletion by SoilMicroorganisms, Env. Monit. Assess., 1, pp. 75-81.
Montgomery, J.H., and L.M. Welkom, 1990. Groundwater Chemicals Desk Reference, Lewis Publish-ers, Boca Raton, FL.
Narayanan, M., 1994. Experimental and Modeling Studies of Bioremediation in Presence of AlfalfaPlants, M.S. Thesis, Kansas State University, KS.
Narayanan, M., L.C. Davis, J.C. Tracy, L.E. Erickson, and R.M. Green, 1995a. Experimental andModeling Studies of the Fate of Organic Contaminants in the Presence of Alfalfa Plants, J.Hazard. Mat., 41, pp. 229-241.
Narayanan, M., L.C. Davis, and L.E. Erickson, 1995b. Fate of Volatile Chlorinated Organic Com-pounds in a Laboratory Chamber with Alfalfa Plants, Environ. Sci. Technol., 29, pp. 2437-2444.
Narayanan, M., J.C. Tracy, L.C. Davis, and L.E. Erickson, 1998. Modeling the Fate of Toluene in aChamber with Alfalfa Plants 1. Theory and Modeling Concepts, J. Hazard. Substance Res., inpress.
Perry, R.H., and C.H. Chilton (Eds.), 1984. Chemical Engineers� Handbook, McGraw-Hill, NewYork, NY, 6th ed.
Rifai, H.S., P.B. Bedient, J.T. Wilson, K.M. Miller, and J.M. Armstrong, 1988. Biodegradation Model-ing at Aviation Fuel Spill Site, J. Irrig. and Drain. Engrg., ASCE, 114 (5), pp. 1007-1029.
Schnoor, J.L., L.A. Licht, S.C. McCutcheon, N.L. Wolfe, and L.H. Carreira, 1995. Phytoremediationof Organic and Nutrient Contaminants, Environ. Sci. Technol., 29, pp. 2905-2914.
Shimp, J.F., J.C. Tracy, L.C. Davis, E. Lee, W. Huang, L.E. Erickson, and J.F. Schnoor, 1993. Benefi-cial Effects of Plants in the Remediation of Soil and Groundwater Contaminated with OrganicMaterials, Crit. Rev. Environ. Sci. Tech., 23 (1), pp. 41-77.
Stomp, A.M., H.H. Han, S. Wilbert, M.P. Gordon, and S.D. Cunningham, 1994. Genetic Strategies forEnhancing Phytoremediation, In: R.K. Bajpai and A. Prokop (eds.), Recombinant DNATechnology II, New York Academy of Science, NY, pp. 481-491.
Tracy, J.C., and M.A. Marino, 1989. Solute Movement Through Root-soil Environment, J. Irrig. andDrain. Engrg., ASCE, 115 (4), pp. 608-625.
Trapp, S., and C. McFarlane (Eds.), 1995. Plant Contamination: Modeling and Simulation of OrganicChemical Processes, Lewis Publishers, Boca Raton, FL.
Walton, B.T., and T.A. Anderson, 1990. Microbial Degradation of Trichloroethylene in the Rhizo-sphere: Potential Application of Biological Remediation of Waste Sites, Appl. Environ.Microbiol., 56, pp.1012-1016.
Winter, T.C., 1983. The Interaction of Lakes with Variably Saturated Porous Media, Water Resour.Res., 19 (5), 1203-1218.
Yaws, C.L., 1992. Thermodynamic and Physical Property Data, Gulf publishing company, Hous-ton. TX.

Journal of Hazardous Substance Research 5b-17
Table 1. Soil related parameters used in the simulation study a.
Soil Characteristic Parameters Value
Bulk density (r ) 1.5 g/cm3
Saturated hydraulic conductivity (Ksat
) 0.38 m/hr
Soil characteristic parameters (A) 0.5 m
(c) 0.9
(d) 3.5
Limiting soil-water pressure head (ys, lim
) -12.0 m
Degree of retention (Sr) 0.15
Porosity (h) 0.35
Specific storativity (Ss) 0.00001 m-1
Specific yield (Sy) 0.20
Organic carbon content in bottom soil (foc
) 0.0025
Longitudinal dispersivity (aL) 0.025 m
Transverse dispersivity (aT) 0.001 m
a (Marino and Tracy, 1988; Tracy and Marino, 1989)

Journal of Hazardous Substance Research5b-18
Table 2. Plant related parameters used in the simulation studya.
Plant Characteristic Parameters Value
Hydraulic conductivity of alfalfa roots (Kr,ij
) 0.051 m/day
Parameter for permeability of roots (G) 0.01 m-1 hr-1
Leaf area index (LAI) 5.00
Leaf area index coefficient (b) 0.875
Limiting root-water pressure head (yr,lim
) -7.0 m
Wilting root-water pressure head (yr,wilt
) -12.0 m
Root exudate loading factor (qr) 0.0
Partition coefficient of exudates to root surfaces (Rr) 5 X 10⁻⁴ m3/m3
Yield of biomass from exudates (Yr) 1.0
Root density at the top (Rd,s
) 0.08 m3/m3
Root index drop rate (dr) 6.0
a(Marino and Tracy, 1988; Tracy and Marino, 1989)

Journal of Hazardous Substance Research 5b-19
Table 3. Modeling parameters used dunng the simulation of toluene (@ 26oC).
Microbial parameters Value
Maximum specific growth rate (mm) 0.1/hr
Endogenous metabolism rate (kd1
; kd2
) 0.01/hr; 0.01 m3/g/hr
Partition coefficient onto root surfaces (Rb) 10.0 m3/m3
Soil adsorption coefficient (Kdb
) 1.0 cm3/g
Toluene Parameters
Monod saturation constant (Krs) 50.0 mg/L
Soil adsorption coefficient (Kds) 0.375 cm3/g
Root concentration factor (Rcf) 4.135
Transpiration stream concentration factor (Tscf
) 0.575
Yield of biomass from toluene (Ys) 0.5 g/g
aDimensionless Henry�s law constant (Hs) 0.274
aGas phase diffusivity in air (Das) 3.25 X 10⁻² m2/hr
Oxygen Parameters
Monod saturation constant (Ko) 0.01 mg/L
bDimensionless Henry�s law constant (Ho) 37.5
bGas phase diffusivity in air (Dao
) 7.42 X 10⁻² m2/hr
a(Montgomery and Wilkom, 1990; Yaws, 1992); b(Perry and Chilton, 1984)

Journal of Hazardous Substance Research5b-20
Figure 1. Schematic view of the axially extended experimental setup; the actual chamber is 0.9 m longas shown in Figure 2.
Figure 2. Overhead view of the actual experimental unit.

Journal of Hazardous Substance Research 5b-21
Figure 3. A schematic diagram showing the subregions with elements of identical size (shown inbrackets). All dimensions are in centimeters.
Figure 4. Comparison of simulated and experimental values for bromide tracer at port 1 and port 2.
Journal of Hazardous Substance Research5b-22
Figure 5. Comparison of simulated and experimental values for bromide tracer at port 3 and port 4.
Figure 6. Comparison of simulated and experimental values for bromide tracer at the outlet.

Journal of Hazardous Substance Research 5b-23
Figure 7. Simulated contour plots for bromide concentration distribution (in mg/L) in the channel after
101 hours from the start of the tracer experiment. Monitoring well concentration (in mg/L) at location A
= 64; B = 17; C = D = E (outlet) = 0.
Figure 8. Simulated contour plots for bromide concentration distribution (in mg/L) in the channel after
203 hours from the start of the tracer experiment. Monitoring well concentration (in mg/L) at location A
= 84;B = 82; C = 41; D = E; (outlet) = 0.
Journal of Hazardous Substance Research5b-24
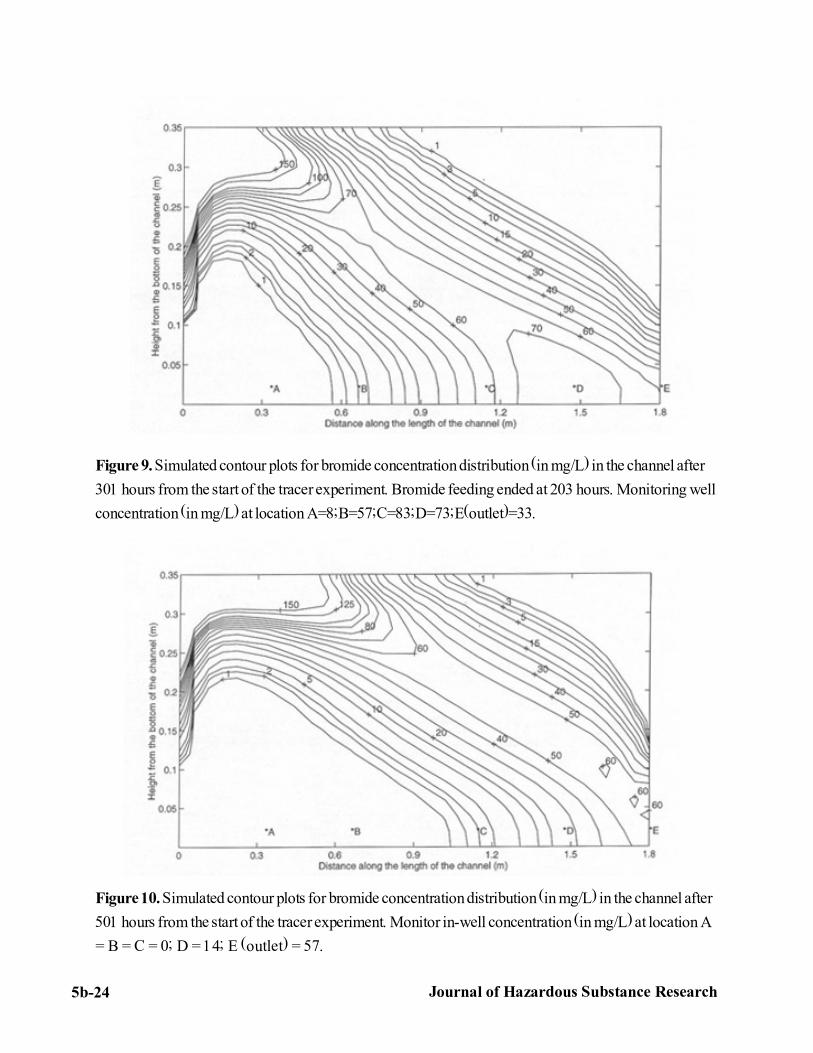
Figure 9. Simulated contour plots for bromide concentration distribution (in mg/L) in the channel after
301 hours from the start of the tracer experiment. Bromide feeding ended at 203 hours. Monitoring well
concentration (in mg/L) at location A=8;B=57;C=83;D=73;E(outlet)=33.
Figure 10. Simulated contour plots for bromide concentration distribution (in mg/L) in the channel after
501 hours from the start of the tracer experiment. Monitor in-well concentration (in mg/L) at location A
= B = C = 0; D = 14; E (outlet) = 57.
Journal of Hazardous Substance Research 5b-25
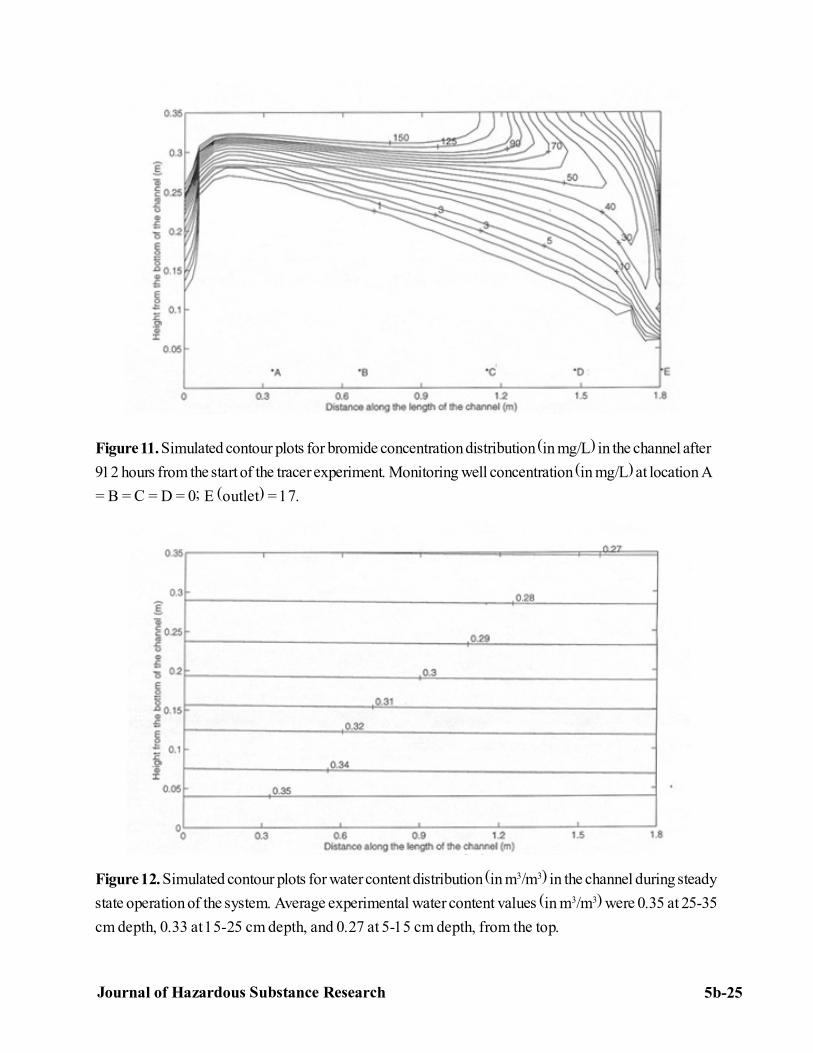
Figure 11. Simulated contour plots for bromide concentration distribution (in mg/L) in the channel after
912 hours from the start of the tracer experiment. Monitoring well concentration (in mg/L) at location A
= B = C = D = 0; E (outlet) = 17.
Figure 12. Simulated contour plots for water content distribution (in m3/m3) in the channel during steady
state operation of the system. Average experimental water content values (in m3/m3) were 0.35 at 25-35
cm depth, 0.33 at 15-25 cm depth, and 0.27 at 5-15 cm depth, from the top.

Journal of Hazardous Substance Research5b-26
Figure 13. Simulated contour plots for toluene concentration distribution (in mg/L) in the channel during
steady state operation of the system. Monitoring well concentration (in mg/L) at location A = 434; B =
418; C = 421; D = 403; E (outlet) = 455.
Figure 14. Simulated contour plots for biomass concentration distribution (in mg/L) in the channel
during steady state operation of the system.

Journal of Hazardous Substance Research 5b-27
Figure 15. Simulated contour plots for oxygen concentration distribution (in mg/L) in the channel during
steady state operation of the system.
Figure 16. Comparison of simulated and experimental values during the washout of toluene at port 1and port 2.

Journal of Hazardous Substance Research5b-28
Figure 17. Comparison of simulated and experimental values during the washout of toluene at port 3
and port 4.
Figure 18. Comparison of simulated and experimental values during the washout of toluene at outlet.