modeling the economics of grassland degradation in...
TRANSCRIPT
1 | P a g e
Modeling the Economics of Grassland Degradation in Banni, India, using System Dynamics
Mihir Mathur, Kabir Sharma
The Energy and Resources Institute
Darbari Seth Block, IHC Complex, Lodhi Road, New Delhi - 110 003, INDIA
Tel. (+91 11) 2468 2100 and 41504900 Fax (+91 11) 2468 2144 and 2468 2145
Email: [email protected], [email protected]
Research Funded by Ministry of Environment, Forest and Climate Change, Government of India
Abstract
This is a study on the interactions between the grassland, livestock, the invasive species Prosopis
juliflora and the economy of the Banni grasslands, located in the district of Kachchh, Gujarat,
India. The study focuses on modeling grassland degradation of Banni from 1992-2015 and
simulates future scenarios up to 2030 using system dynamics modeling. An economic valuation
of Banni’s economy is done by discounting the future earnings of the pastoral economy (milk,
livestock sale, dung manure) and charcoal economy under two scenarios 1) Base case (Business
as Usual), i.e. keeping things as they stand today and 2) Prosopis Removal Policy (PRP) i.e.
where a decision is implemented to remove Prosopis from Banni. Under the BAU scenario,
modeling results indicate that the Banni grassland is headed for severe fodder scarcity due to
shrinking area under grassland. If PRP is implemented then Banni would be able to revive its
grasslands and more than double the Present Value of future earnings, up to 2030. If the policy
decision to remove Prosopis is delayed by 5 years then it results into a 30% reduction in
earnings indicating the policy’s time sensitivity. The model serves as a test bed to evaluate
management policies of Banni grasslands.
Key Words: Grasslands, Livestock, System Dynamics, Economics, Land Degradation
Introduction An area of approx. 2500 sq. km located in the district of Kachchh (Koladiya et al., 2016),
Gujarat, the Banni grassland was once known as Asia‟s finest tropical grassland
(Bharwada&Mahajan, 2012). However, the grassland has been degrading over the years. The
grassland productivity has come down from 4000 kg/hectare in the 1960s to 620 kg/hectare in
1999 (Bharwada&Mahajan, 2012). The area under grassland has reduced from 142,000 hectares

2 | P a g e
in 1989 to 63,000 hectares in 2009 while the area invaded by Prosopis juliflora has increased to
82,000 hectares (Koladiya et al., 2016). While many reasons are attributed to the degradation of
the Banni grassland, the evidence is still inconclusive on whether the dominant cause is
increasing salinity or spread of the invasive species Prosopis juliflora. However, the most cited
reason by the pastoralists of Banni (Maldharis) is the spread of Prosopis juliflora. With livestock
rearing being the primary occupation of the people of Banni, grassland degradation poses a
serious problem for sustaining their pastoral economy.
This study is an investigation into the dynamics of Banni grasslands and an exploration into
possible futures under different scenarios. It highlights the interdependencies existing between
different sectors and between variables of each sector using system dynamics modeling. The
model helps in developing a deeper understanding of the complexities of Banni and serves as a
tool for policy testing and evaluation. The study highlights the need for further research on the
ecological and economic parameters of Banni, and presents a case for the development of a
decision support tool to manage the Banni grasslands.
Banni Grasslands The Banni grassland is located on the northern border of Bhuj taluka (23° 19‟ 23° 52‟ N latitude
and 68° 56‟ to 70° 32‟ E longitude) of Kachchh district in Gujarat State (ref. fig 1) (Mehta et. al,
2014). The mainstay of Banni‟s economy is livestock rearing.
The Banni grassland is divided into three areas, 1) Ugamani Banni - East Banni, 2) Vachali
Banni - Central Banni, 3) Aathamani Banni or Jat Patti - West Banni (Bharwada&Mahajan,
2012). There exist 13 different estimates of its geographic area ranging from 1800 sq km to 3800
sq km (Bharwada&Mahajan, 2012). But the recent estimates have converged to the figure of
2500 sq km (Koladiya et al., 2016). For this study total Banni area is taken as 2500 sq km
(250,000 hectares).
The livestock breeders of Banni are called Maldharis. There are many pastoral communities in
Banni like Raysipotra, Halepotra, Pirpotra, Hingorja, Sumra, Mutva, Node etc. who migrated
several generations ago from Sindh, Marwar and Baluchistan (Bharwada&Mahajan, 2012). The
other community in Banni is the Meghwals. Their main occupation has been leather tanning and
shoe making including making artifacts from leather (Bharwada&Mahajan, 2012).
Brief History of Banni Grassland The Banni grassland was once known as Asia‟s finest tropical grassland. Before independence its
geographic area spread beyond Indian borders into the geographic areas of Pakistan.
3 | P a g e
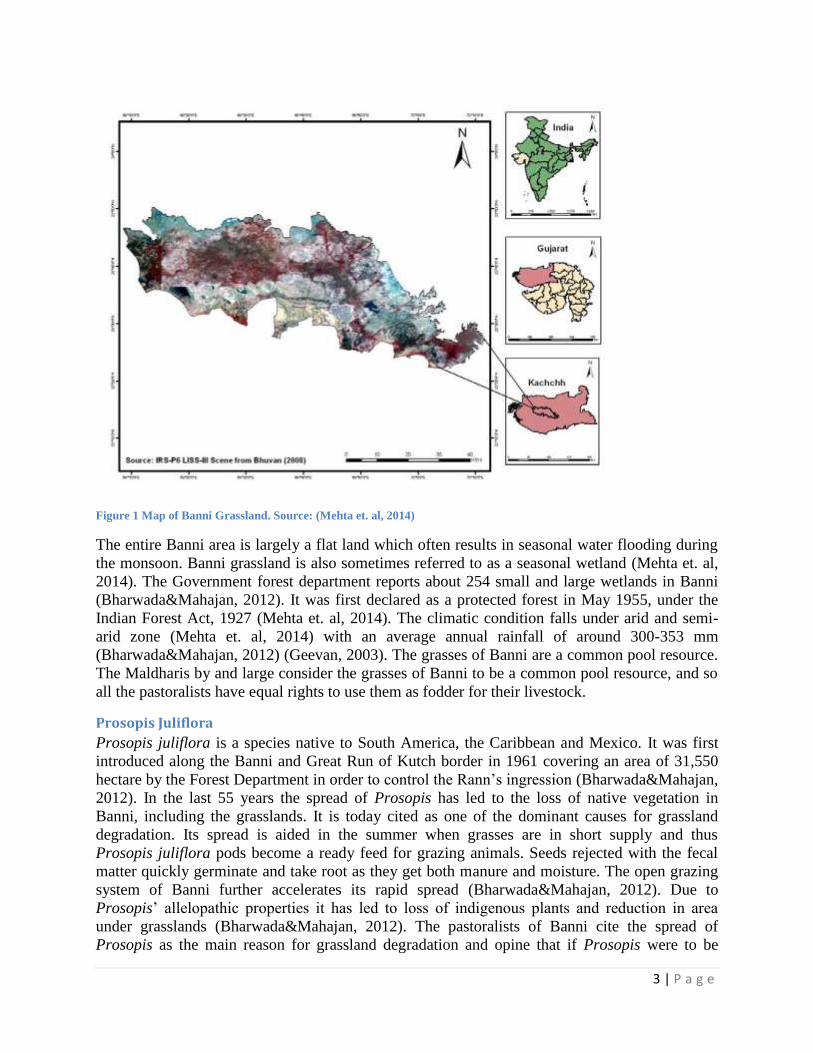
Figure 1 Map of Banni Grassland. Source: (Mehta et. al, 2014)
The entire Banni area is largely a flat land which often results in seasonal water flooding during
the monsoon. Banni grassland is also sometimes referred to as a seasonal wetland (Mehta et. al,
2014). The Government forest department reports about 254 small and large wetlands in Banni
(Bharwada&Mahajan, 2012). It was first declared as a protected forest in May 1955, under the
Indian Forest Act, 1927 (Mehta et. al, 2014). The climatic condition falls under arid and semi-
arid zone (Mehta et. al, 2014) with an average annual rainfall of around 300-353 mm
(Bharwada&Mahajan, 2012) (Geevan, 2003). The grasses of Banni are a common pool resource.
The Maldharis by and large consider the grasses of Banni to be a common pool resource, and so
all the pastoralists have equal rights to use them as fodder for their livestock.
Prosopis Juliflora
Prosopis juliflora is a species native to South America, the Caribbean and Mexico. It was first
introduced along the Banni and Great Run of Kutch border in 1961 covering an area of 31,550
hectare by the Forest Department in order to control the Rann‟s ingression (Bharwada&Mahajan,
2012). In the last 55 years the spread of Prosopis has led to the loss of native vegetation in
Banni, including the grasslands. It is today cited as one of the dominant causes for grassland
degradation. Its spread is aided in the summer when grasses are in short supply and thus
Prosopis juliflora pods become a ready feed for grazing animals. Seeds rejected with the fecal
matter quickly germinate and take root as they get both manure and moisture. The open grazing
system of Banni further accelerates its rapid spread (Bharwada&Mahajan, 2012). Due to
Prosopis‟ allelopathic properties it has led to loss of indigenous plants and reduction in area
under grasslands (Bharwada&Mahajan, 2012). The pastoralists of Banni cite the spread of
Prosopis as the main reason for grassland degradation and opine that if Prosopis were to be
4 | P a g e
removed the grasslands would recover. In Banni it is locally called Gando Baval, which means
„mad‟ Ácacia.
Dairy
Banni buffalo and Kankrej cattle are the dominant livestock of Banni. Traditionally the Banni
pastoralists were breeders of livestock and were involved in the trade of the Banni Buffalo and
Kankrej cattle and bullocks, and Banni was not traditionally a dairy-farming economy. Only
recently, after the introduction of dairy in 2009-2010 for milk collection, have the pastoralists of
Banni started selling milk in large quantities. The introduction of dairy has led to a revival of
buffalo breeding in Banni, and the population has been increasing over the last few years. Also
registration of Banni buffalo as the 11th
buffalo breed in India in 2011 motivated the Maldharis,
especially the young generation, to continue and strengthen their pastoral occupation
(Bharwada&Mahajan, 2012). The population of the Kankrej cattle on the other hand has been
reducing as consuming the pods of Prosopis leads to their death (Bharwada&Mahajan, 2012).
Thus, the population of Kankrej cattle has been falling due to spread of Prosopis. This has had a
negative impact on the bullock trade. However, in recent years it has been observed by the
Maldharis that Kankrej has adapted to survive in dense Prosopis areas. The loss in grassland
productivity also means that the Maldharis have to purchase more fodder from outside Banni,
having a negative impact on the economy of Banni. Discussions with Maldharis revealed that
this also spurred them to migrate out more, in order to save costs.
Charcoal Making
Charcoal making is practiced by Maldharis to earn income in addition to the livestock income.
Prosopis wood is harvested for making charcoal, without uprooting the tree. Since the Banni
Grassland is classified as a Protected Reserve Forest, it is illegal to cut Prosopis and there has
been a ban in place. However, in 2004 this ban was lifted, leading to a huge increase in charcoal
production. It led to reduction in area under Prosopis as Maldharis resorted to removing
Prosopis trees from the roots for making charcoal. Maldharis recollect that the grasslands had
come back as a result of its removal, as uprooting the tree frees up the land allowing grasses to
grow in that area. It is hard to estimate the exact amount by which the production went up but
estimates of the increase in number of charcoal-laden vehicles leaving Banni suggest that it could
have been as high as ten times (Bharwada&Mahajan, 2012). In 2008, this ban was again
imposed. The reasons for this vary. Some suggest that the ban was again imposed because
indigenous trees were also being harvested for charcoal. Others suggest that the charcoal trader‟s
cartel influenced the re-imposition of the ban since they were unable to exercise control over
production and supply of charcoal which resulted in a loss for them (Bharwada&Mahajan, 2012).
The ban persists, but charcoal making still continues in Banni, though in limited quantities.
Research Objective Banni‟s ecological and economic system is highly dynamic. The research methodology relies on
use of system dynamics modeling for developing a base case and policy scenarios on the future
of Banni. This study focuses on the issue of grassland degradation of Banni, its key drivers,
factors that could lead to collapse of livestock economy, what impact the removal of Prosopis
would have as a solution for halting grassland degradation, etc. The model runs from 1992-2014
and simulates future scenarios up to 2030 under 1) Base Case, 2) Policy implementation of
Prosopis Removal and 3) 5 year Delay in Prosopis removal policy implementation.
5 | P a g e
Research Methodology: System Dynamics Ecological-economic systems are complex and composed of various interconnected, interrelated,
interdependent sectors that are closely related by multiple cause and effect relationships and
feedback. Such complex systems are well understood using dynamic simulation techniques
(Casti, 1997). System Dynamics (SD) is one such approach, suited to understand the non-linear
behaviour of complex systems over time using stocks and flows, internal feedback loops, and
time delays (MIT, 1997). Pioneered by Jay W. Forrester at MIT (Forrester, 1958), SD is able to
unveil the counterintuitive nature of complex systems and uncover relationships between
variables that are responsible for the behaviour of the system. Further, being transparent, it
provides the reader with the opportunity to go through the model structure and study the linkages
(Gallati, 2011).
This SD model of the Banni grassland is comprised of three sectors: livestock (Buffalo and
Kankrej Cattle), grassland & Prosopis juliflora and the economy. Impacts of drivers of livestock
growth and Prosopis growth, their impact on the local environment, and the consequent multiple
feedback that could impact the future of these sectors, have been modelled. The model runs are
from 1992 to 2030. The dynamic hypothesis, key assumptions, model description, simulation
results, and insights generated from them are presented below. Equations and model structure are
given in the supplementary material.
Dynamic Hypothesis

6 | P a g e
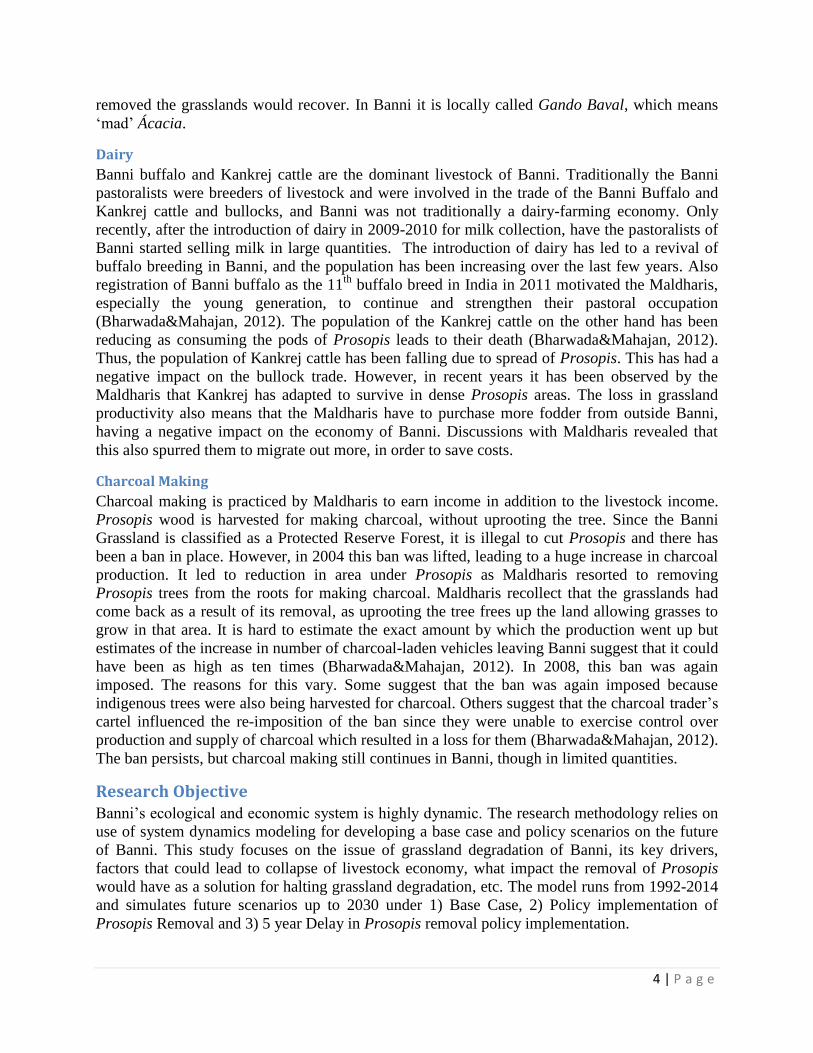
Figure 2 Dynamic Hypothesis
The above dynamic hypothesis shows higher order linkages of our system dynamics model.
There are two Balancing Loops (Livestock-Fodder-Livestock, Livestock-Prosopis-Grassland-
Livestock) and one Reinforcing Loop (Milk income-Livestock).
As the livestock increases it results into higher fodder requirement. With limited grassland, the
fodder availability falls. As fodder availability falls it results into Maldharis purchasing feed and
fodder from outside Banni. This results into higher input costs thereby reducing the profitability
per livestock. As profitability falls below zero it leads to stress sale of livestock for recovering
losses, balancing out the livestock numbers. Consequently, as the livestock numbers go down the
fodder requirement comes down leading to an increase in the livestock profitability (Balancing
Loop B2). This is a balancing process, however currently the reinforcing loop R1 is dominant as
Maldharis are earning enough from milk sales to sustain their livestock, even with the grassland
degradation and consequent fodder deficit. Dairy income is an economic incentive for Maldharis
to retain and grow their livestock numbers. Higher livestock would yield higher milk thereby
increasing their milk income. Higher milk prices for Banni buffalo milk is a key driver for
growth of Banni buffalo.
The other balancing process concerns the spread of Prosopis dominated area. The growth in area
under Prosopis is aided by presence of Livestock which carry the seeds and help it germinate fast
and wide. As area under Prosopis goes up the area under grassland comes down, again leading to
negative impact on livestock due to falling fodder availability. (Balancing Loop B1)
The policy testing is done for a case of Prosopis removal. If Prosopis is removed then it could
potentially reverse the current trend of grassland degradation in Banni, increasing the grassland
area and fodder availability, as shown in the above diagram.
Key Assumptions 1. Prices for milk, livestock, feed, charcoal, and dung manure are kept constant at
2015 levels. Forecasting future prices, at local level, has lot of uncertainty which would
add to the complexity of carrying out an economic valuation of Banni grasslands. Hence,
here it is assumed to be constant at 2015 prices.
2. No limit on external supply of feed, fodder and water.
Today, an external supply of feed and fodder is an integral part of Banni and is assumed
to be available for purchase at a cost. Water is available in Banni through pipelines
coming in from outside the Banni boundary, and is assumed to remain sufficient for the
duration of model runs.
3. Exclusion of small ruminants (eg. sheep, goat etc.)
Buffalo and cattle constitute most of the Banni livestock. In 2011 their share was around
92% of the total livestock (Bharwada&Mahajan, 2012). Hence, considering the small
proportion of small ruminants they are excluded from the study.
4. Rainfall for 2015-2030 is assumed to be same as 1999-2014
Rainfall is highly erratic and drought is a recurring phenomenon in Banni. However,
rainfall follows a cyclical pattern, with sub-normal rainfall and heavy rainfall patterns
repeating every five years (Bharwada&Mahajan, 2012). Hence this assumption is made
to include the cyclical pattern of Banni rainfall variation.

7 | P a g e
Model Sector Description
The model consists of three interconnected sectors1: Livestock Dynamics (Buffalo and Kankrej
Cattle), Prosopis and Grassland Dynamics and the Economy (Pastoral - milk, livestock sale,
dung manure and charcoal made from Prosopis) (Figure 3). These sectors are explained below.
Important parameter values are provided in Table 1 in the next section.
Figure 3 Sectorial Linkages
Grassland and Prosopis juliflora
The total area of Banni is taken as 2500 sq. km i.e. 250,000 hectares(Koladiya et al., 2016). Of
this, 90% is taken to be total possible productive land area (includes grassland, Prosopis
dominated area and other vegetation) while 10% is taken to be waste land (wasteland includes
saline land, water bodies). In 1992 (the base year), the area of land dominated by Prosopis is
taken to be 41,180 ha (Koladiya et al., 2016) while grassland area equals total productive area
less area under Prosopis.
The dynamics between grassland area and area under Prosopis are the key factors influencing
most of the changes in Banni. Prosopis juliflora is the main driver of land use change. It is
highly invasive and literature suggests that Prosopis cover has been increasing at an average rate
of 26.73 sq. km. per year in Banni (Bharwada&Mahajan, 2012). As the area under Prosopis
expands it invades the area under grassland. The normal spread rate of Prosopis is taken to be
8.5% per year of the total area under Prosopis (Vaibhav et al., 2012). However, this spread rate
is enhanced by the presence of livestock, as the seeds are carried by livestock and the passage
through the digestive tract facilitates quick germination. (Geevan et al., 2003)
(Bharwada&Mahajan, 2012). This has been modelled as a multiplier through a graphical
1 Model sector diagrams are provided in the supplementary material
8 | P a g e
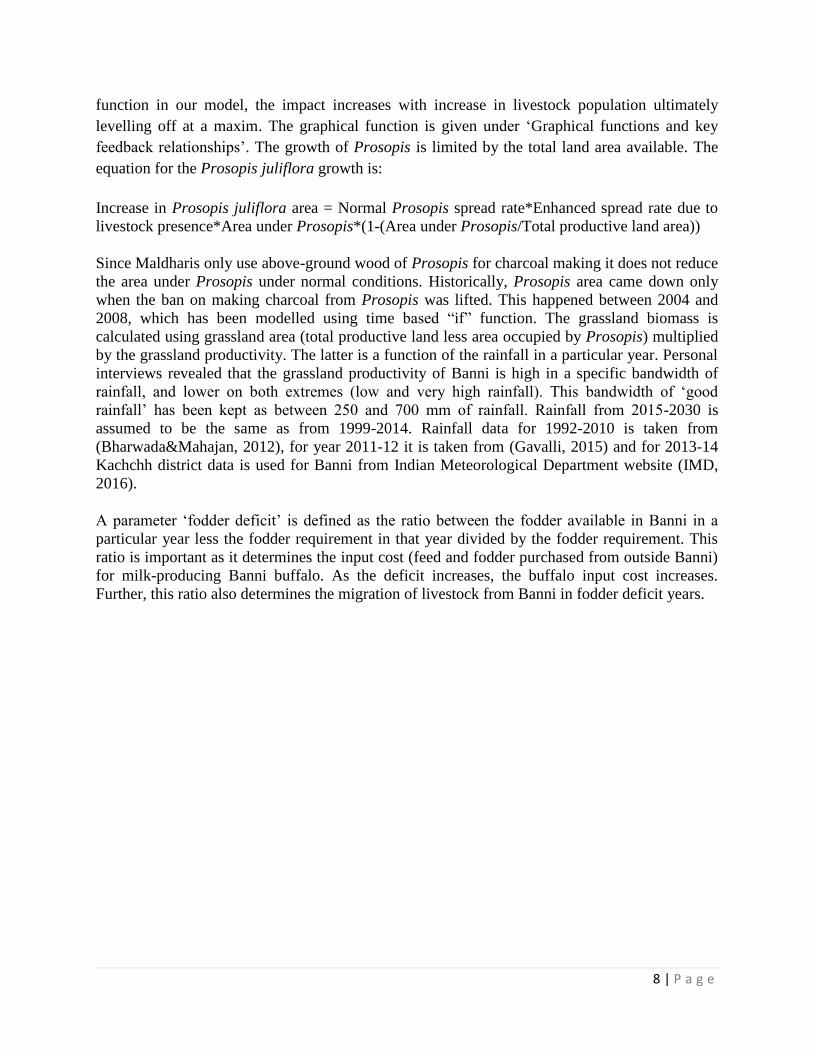
function in our model, the impact increases with increase in livestock population ultimately
levelling off at a maxim. The graphical function is given under „Graphical functions and key
feedback relationships‟. The growth of Prosopis is limited by the total land area available. The
equation for the Prosopis juliflora growth is:
Increase in Prosopis juliflora area = Normal Prosopis spread rate*Enhanced spread rate due to
livestock presence*Area under Prosopis*(1-(Area under Prosopis/Total productive land area))
Since Maldharis only use above-ground wood of Prosopis for charcoal making it does not reduce
the area under Prosopis under normal conditions. Historically, Prosopis area came down only
when the ban on making charcoal from Prosopis was lifted. This happened between 2004 and
2008, which has been modelled using time based “if” function. The grassland biomass is
calculated using grassland area (total productive land less area occupied by Prosopis) multiplied
by the grassland productivity. The latter is a function of the rainfall in a particular year. Personal
interviews revealed that the grassland productivity of Banni is high in a specific bandwidth of
rainfall, and lower on both extremes (low and very high rainfall). This bandwidth of „good
rainfall‟ has been kept as between 250 and 700 mm of rainfall. Rainfall from 2015-2030 is
assumed to be the same as from 1999-2014. Rainfall data for 1992-2010 is taken from
(Bharwada&Mahajan, 2012), for year 2011-12 it is taken from (Gavalli, 2015) and for 2013-14
Kachchh district data is used for Banni from Indian Meteorological Department website (IMD,
2016).
A parameter „fodder deficit‟ is defined as the ratio between the fodder available in Banni in a
particular year less the fodder requirement in that year divided by the fodder requirement. This
ratio is important as it determines the input cost (feed and fodder purchased from outside Banni)
for milk-producing Banni buffalo. As the deficit increases, the buffalo input cost increases.
Further, this ratio also determines the migration of livestock from Banni in fodder deficit years.

9 | P a g e
Figure 4 Model Diagram of Prosopis and Grassland Sector
10 | P a g e
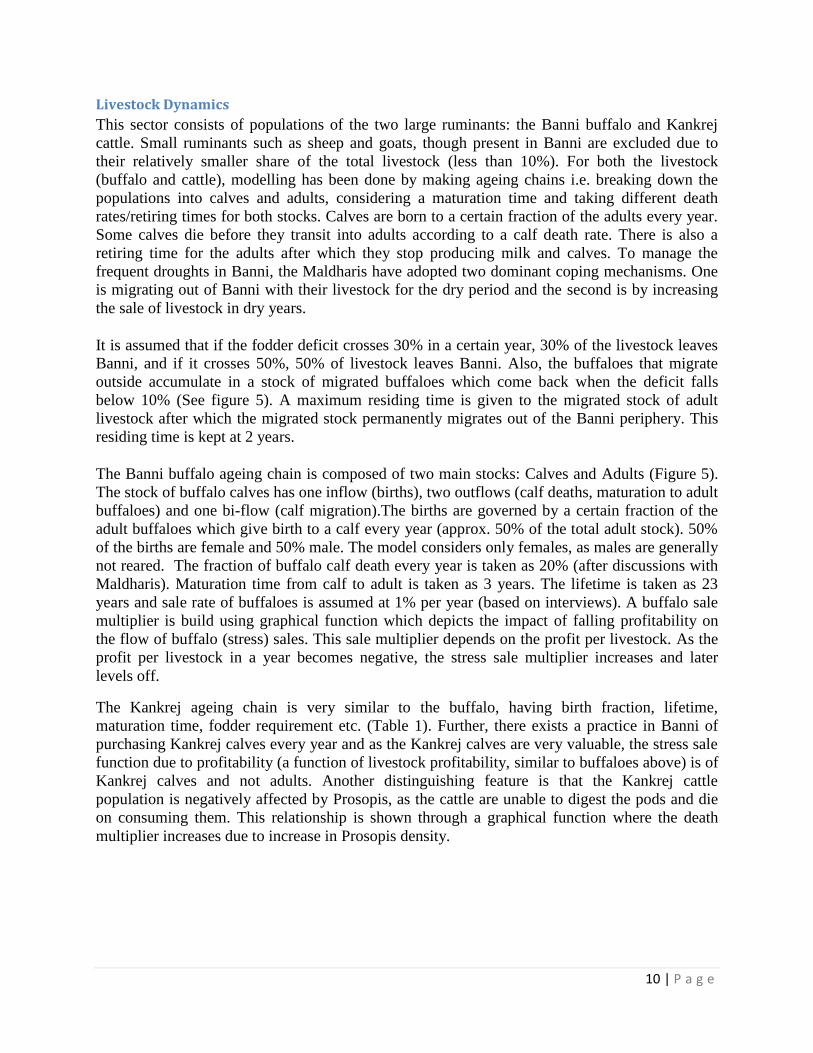
Livestock Dynamics
This sector consists of populations of the two large ruminants: the Banni buffalo and Kankrej
cattle. Small ruminants such as sheep and goats, though present in Banni are excluded due to
their relatively smaller share of the total livestock (less than 10%). For both the livestock
(buffalo and cattle), modelling has been done by making ageing chains i.e. breaking down the
populations into calves and adults, considering a maturation time and taking different death
rates/retiring times for both stocks. Calves are born to a certain fraction of the adults every year.
Some calves die before they transit into adults according to a calf death rate. There is also a
retiring time for the adults after which they stop producing milk and calves. To manage the
frequent droughts in Banni, the Maldharis have adopted two dominant coping mechanisms. One
is migrating out of Banni with their livestock for the dry period and the second is by increasing
the sale of livestock in dry years.
It is assumed that if the fodder deficit crosses 30% in a certain year, 30% of the livestock leaves
Banni, and if it crosses 50%, 50% of livestock leaves Banni. Also, the buffaloes that migrate
outside accumulate in a stock of migrated buffaloes which come back when the deficit falls
below 10% (See figure 5). A maximum residing time is given to the migrated stock of adult
livestock after which the migrated stock permanently migrates out of the Banni periphery. This
residing time is kept at 2 years.
The Banni buffalo ageing chain is composed of two main stocks: Calves and Adults (Figure 5).
The stock of buffalo calves has one inflow (births), two outflows (calf deaths, maturation to adult
buffaloes) and one bi-flow (calf migration).The births are governed by a certain fraction of the
adult buffaloes which give birth to a calf every year (approx. 50% of the total adult stock). 50%
of the births are female and 50% male. The model considers only females, as males are generally
not reared. The fraction of buffalo calf death every year is taken as 20% (after discussions with
Maldharis). Maturation time from calf to adult is taken as 3 years. The lifetime is taken as 23
years and sale rate of buffaloes is assumed at 1% per year (based on interviews). A buffalo sale
multiplier is build using graphical function which depicts the impact of falling profitability on
the flow of buffalo (stress) sales. This sale multiplier depends on the profit per livestock. As the
profit per livestock in a year becomes negative, the stress sale multiplier increases and later
levels off.
The Kankrej ageing chain is very similar to the buffalo, having birth fraction, lifetime,
maturation time, fodder requirement etc. (Table 1). Further, there exists a practice in Banni of
purchasing Kankrej calves every year and as the Kankrej calves are very valuable, the stress sale
function due to profitability (a function of livestock profitability, similar to buffaloes above) is of
Kankrej calves and not adults. Another distinguishing feature is that the Kankrej cattle
population is negatively affected by Prosopis, as the cattle are unable to digest the pods and die
on consuming them. This relationship is shown through a graphical function where the death
multiplier increases due to increase in Prosopis density.
11 | P a g e
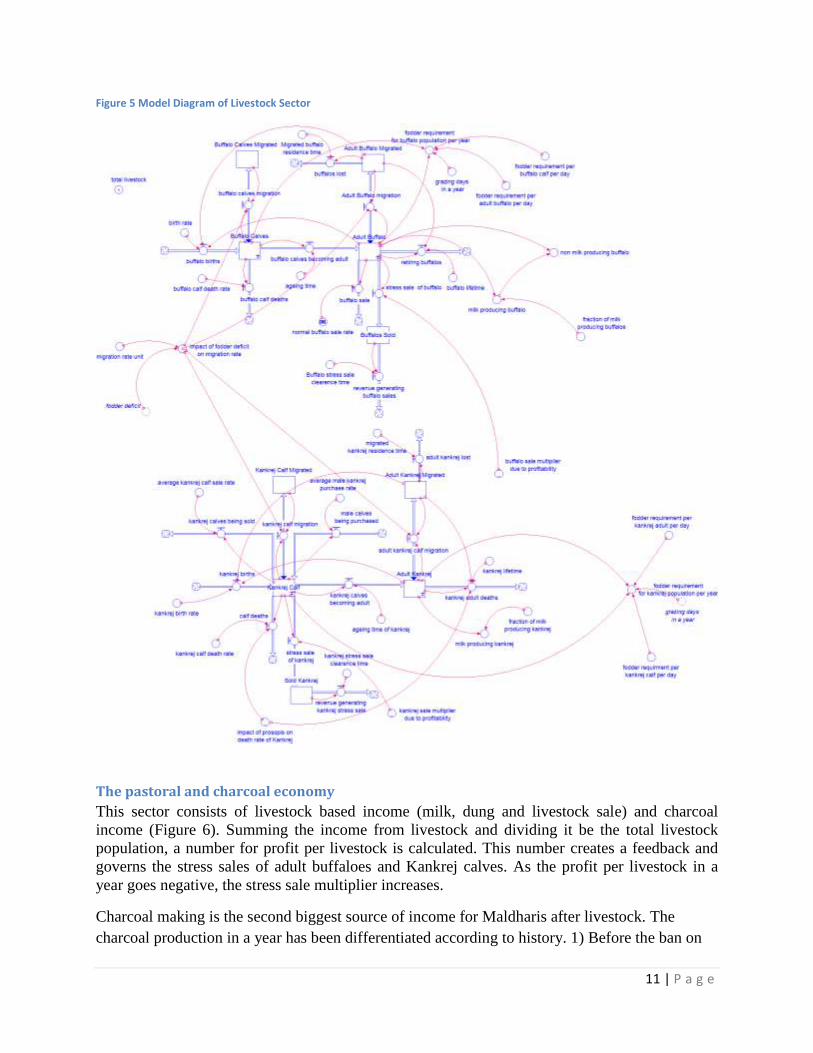
Figure 5 Model Diagram of Livestock Sector
The pastoral and charcoal economy
This sector consists of livestock based income (milk, dung and livestock sale) and charcoal
income (Figure 6). Summing the income from livestock and dividing it be the total livestock
population, a number for profit per livestock is calculated. This number creates a feedback and
governs the stress sales of adult buffaloes and Kankrej calves. As the profit per livestock in a
year goes negative, the stress sale multiplier increases.
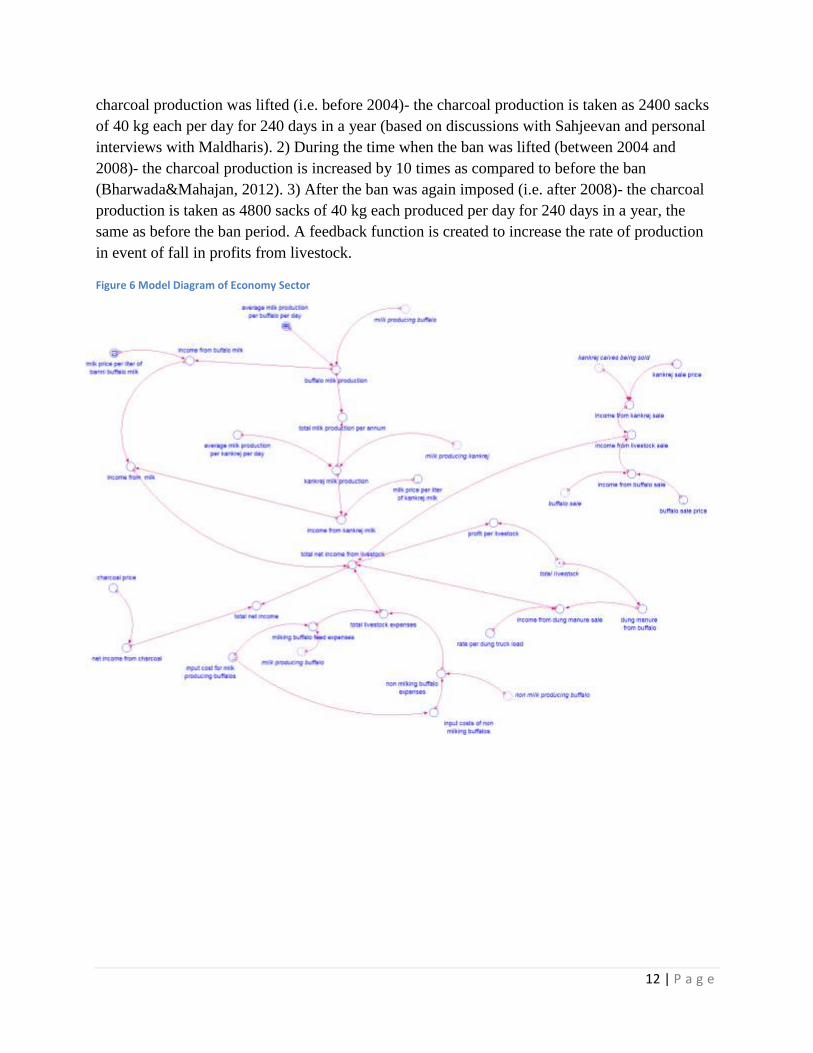
Charcoal making is the second biggest source of income for Maldharis after livestock. The
charcoal production in a year has been differentiated according to history. 1) Before the ban on
12 | P a g e
charcoal production was lifted (i.e. before 2004)- the charcoal production is taken as 2400 sacks
of 40 kg each per day for 240 days in a year (based on discussions with Sahjeevan and personal
interviews with Maldharis). 2) During the time when the ban was lifted (between 2004 and
2008)- the charcoal production is increased by 10 times as compared to before the ban
(Bharwada&Mahajan, 2012). 3) After the ban was again imposed (i.e. after 2008)- the charcoal
production is taken as 4800 sacks of 40 kg each produced per day for 240 days in a year, the
same as before the ban period. A feedback function is created to increase the rate of production
in event of fall in profits from livestock.
Figure 6 Model Diagram of Economy Sector

13 | P a g e
Graphical functions and key feedback relationships There are 6 cross-sectorial feedback loops which govern the dynamics of the model. The
numbers for these graphical functions can be found in the model equations in Supplementary
Material.
1) Impact of fodder deficit on livestock input cost. As the fodder deficit increases so does the
livestock input cost, reflecting the need to purchase fodder from outside.
Figure 7 Impact of Fodder Deficit on Livestock input cost
2) Impact of profit per livestock on livestock stress sale rate. As the profit per livestock
becomes negative, the stress sale of livestock goes up, reflected in an increase in stress
sale fraction.
Figure 8 Impact of Livestock Profitability on Buffalo and Kankrej Sale
3) Impact of fodder deficit on temporary livestock migration. If the fodder deficit lies between
30% and 50% in a certain year, 30% of the livestock leave Banni, and if it crosses 50%,
50% of livestock leave Banni. If fodder deficit is 10% or lower, the livestock migrate
back to Banni.

14 | P a g e
4) Impact of livestock on Prosopis spread rate. As the livestock population increases it leads to
increase in the spread rate of area under Prosopis.
Figure 9 Impact of Livestock on Prosopis Spread Rate
5) Impact of Prosopis density on Kankrej death rate. As the Prosopis density (area under
Prosopis ÷ total productive area) increases it leads to an increase in Kankrej death rate.
However, it has been observed by the Maldharis that Kankrej has adapted to survive in
Prosopis dense areas. Thus the death multiplier evens out at high levels of Prosopis.
Figure 10 Impact of Prosopis Density on Kankrej Death Rate
6) Impact of profit per livestock on charcoal production. As the profit per livestock becomes
negative, charcoal production starts increasing to compensate for the losses.
15 | P a g e
Livestock
Page 2
1992.00 2001.50 2011.00 2020.50 2030.00
Years
1:
1:
1:
20000
50000
80000
1: total livestock
1
1
1
Area under Prosopis and Grassland
Page 3
1992.00 1999.60 2007.20 2014.80 2022.40 2030.00
Years
1:
1:
1:
2:
2:
2:
20000
122500
225000
1: Area under Prosopis 2: area under grassland
1
1
1
1
2
2
2
2
Figure 11 Impact of Livestock Profitability on Charcoal Production
The behavior of the system is governed by these feedback variables and whether the system
grows, declines or oscillates depends on which of these feedbacks are dominant at a particular
time of the simulation.
Results
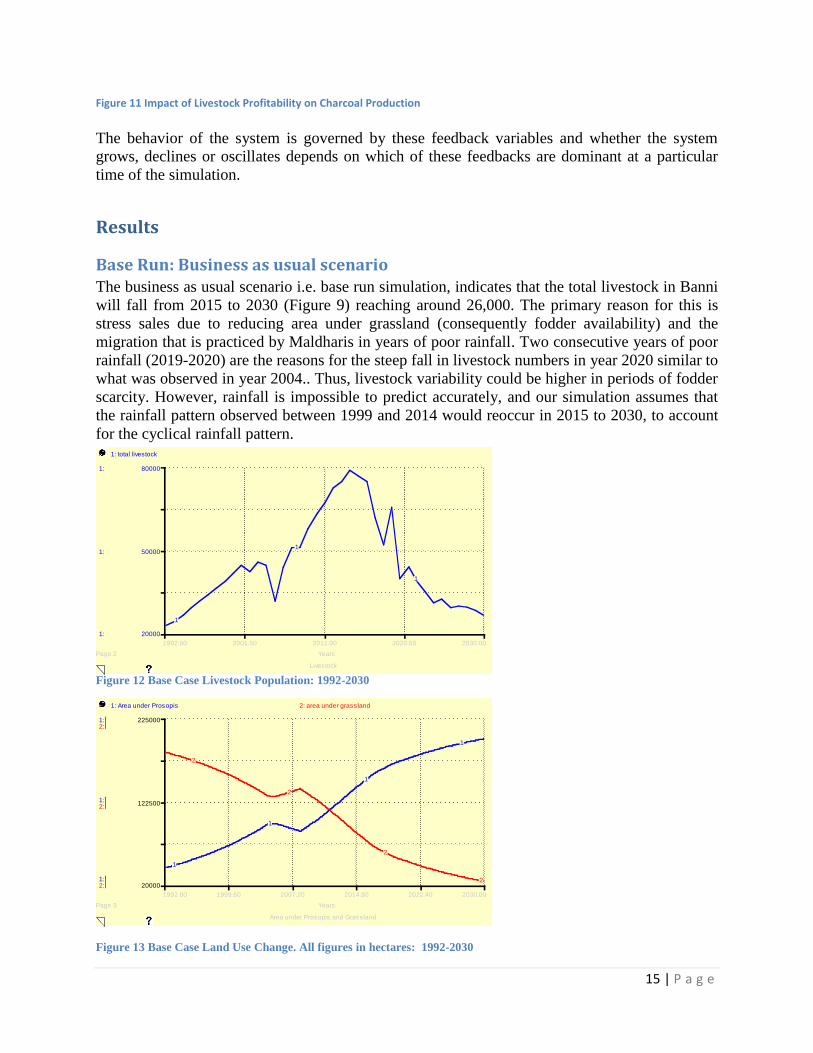
Base Run: Business as usual scenario The business as usual scenario i.e. base run simulation, indicates that the total livestock in Banni
will fall from 2015 to 2030 (Figure 9) reaching around 26,000. The primary reason for this is
stress sales due to reducing area under grassland (consequently fodder availability) and the
migration that is practiced by Maldharis in years of poor rainfall. Two consecutive years of poor
rainfall (2019-2020) are the reasons for the steep fall in livestock numbers in year 2020 similar to
what was observed in year 2004.. Thus, livestock variability could be higher in periods of fodder
scarcity. However, rainfall is impossible to predict accurately, and our simulation assumes that
the rainfall pattern observed between 1999 and 2014 would reoccur in 2015 to 2030, to account
for the cyclical rainfall pattern.
Figure 12 Base Case Livestock Population: 1992-2030
Figure 13 Base Case Land Use Change. All figures in hectares: 1992-2030
16 | P a g e
Net livestock Income
Page 4
1992.00 1999.60 2007.20 2014.80 2022.40 2030.00
Years
1:
1:
1:
-1e+009
1e+009
3e+009
total net income from livestock: 1 -
1 1
1
1
The shrinking area under grassland, due to Prosopis spread, is a cause of concern for Banni
(Figure 10). If current conditions persist then by year 2030 the area under grassland will reduce
to 23,000 hectares from 83,000 hectares in 2015, a reduction of around 70%. The primary reason
for reduction in grasslands is the increase in spread of area under Prosopis juliflora. The model
runs suggest that the area under Prosopis juliflora will reach 200,000 hectares by year 2030.
The period 2004-2008 shows a dip in area under Prosopis and an increase in area under
grassland. This is due to the lifting of the ban on charcoal-making which caused an escalation in
removal of Prosopis from the roots. Because of this, the grasses recovered, increasing the area
under grassland. After the ban was again imposed, it led to growth in area under Prosopis while
the grasslands continued to shrink.
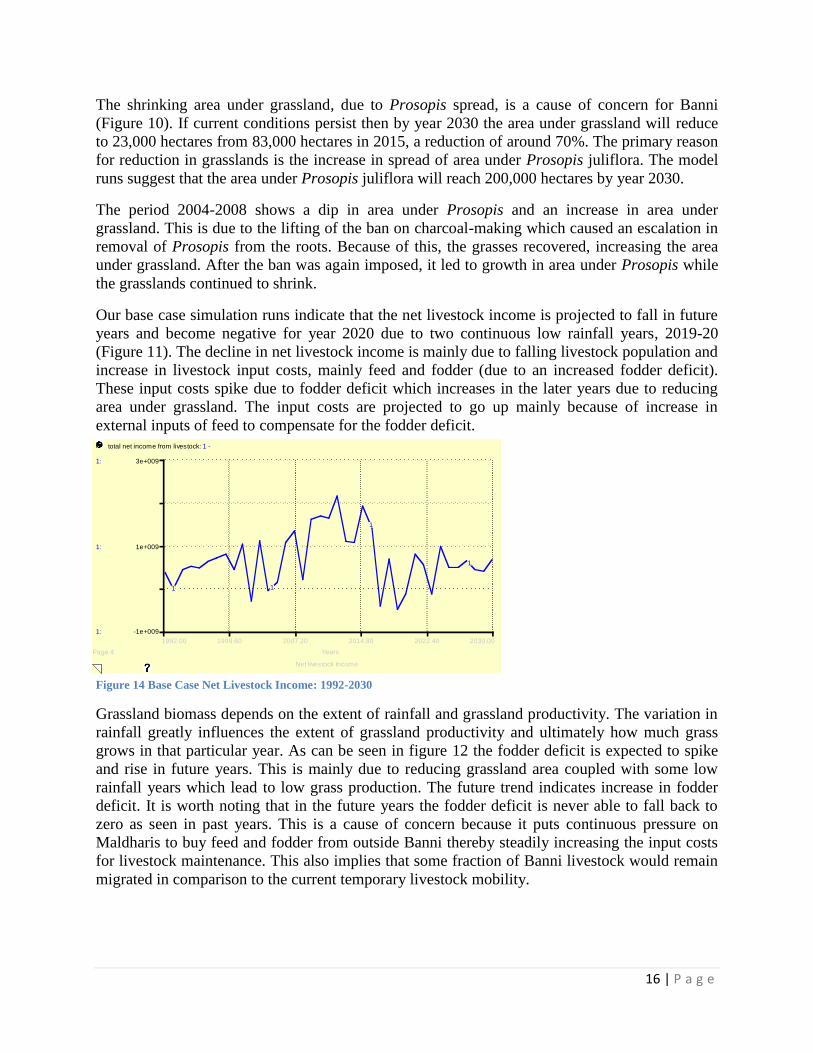
Our base case simulation runs indicate that the net livestock income is projected to fall in future
years and become negative for year 2020 due to two continuous low rainfall years, 2019-20
(Figure 11). The decline in net livestock income is mainly due to falling livestock population and
increase in livestock input costs, mainly feed and fodder (due to an increased fodder deficit).
These input costs spike due to fodder deficit which increases in the later years due to reducing
area under grassland. The input costs are projected to go up mainly because of increase in
external inputs of feed to compensate for the fodder deficit.
Figure 14 Base Case Net Livestock Income: 1992-2030
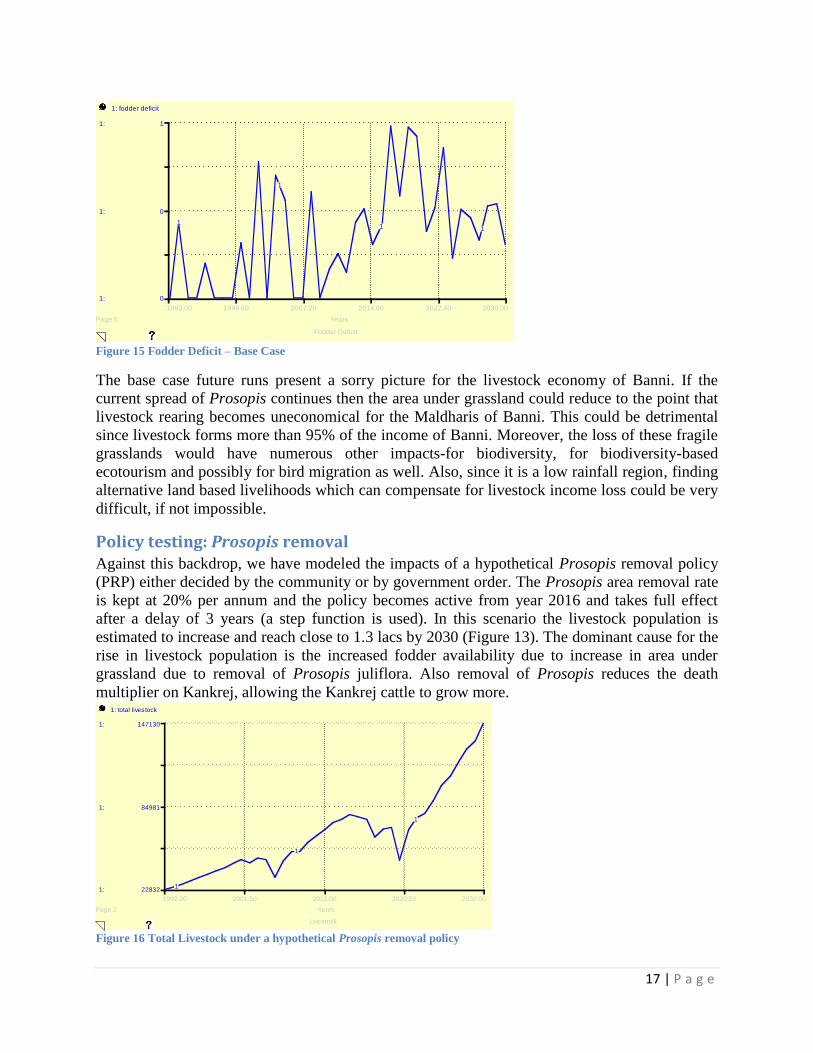
Grassland biomass depends on the extent of rainfall and grassland productivity. The variation in
rainfall greatly influences the extent of grassland productivity and ultimately how much grass
grows in that particular year. As can be seen in figure 12 the fodder deficit is expected to spike
and rise in future years. This is mainly due to reducing grassland area coupled with some low
rainfall years which lead to low grass production. The future trend indicates increase in fodder
deficit. It is worth noting that in the future years the fodder deficit is never able to fall back to
zero as seen in past years. This is a cause of concern because it puts continuous pressure on
Maldharis to buy feed and fodder from outside Banni thereby steadily increasing the input costs
for livestock maintenance. This also implies that some fraction of Banni livestock would remain
migrated in comparison to the current temporary livestock mobility.
17 | P a g e
Fodder Deficit
Page 5
1992.00 1999.60 2007.20 2014.80 2022.40 2030.00
Years
1:
1:
1:
0
0
1
1: fodder deficit
1
1
1 1
Livestock
Page 2
1992.00 2001.50 2011.00 2020.50 2030.00
Years
1:
1:
1:
22832
84981
147130
1: total livestock
1
1
1
Figure 15 Fodder Deficit – Base Case
The base case future runs present a sorry picture for the livestock economy of Banni. If the
current spread of Prosopis continues then the area under grassland could reduce to the point that
livestock rearing becomes uneconomical for the Maldharis of Banni. This could be detrimental
since livestock forms more than 95% of the income of Banni. Moreover, the loss of these fragile
grasslands would have numerous other impacts-for biodiversity, for biodiversity-based
ecotourism and possibly for bird migration as well. Also, since it is a low rainfall region, finding
alternative land based livelihoods which can compensate for livestock income loss could be very
difficult, if not impossible.
Policy testing: Prosopis removal Against this backdrop, we have modeled the impacts of a hypothetical Prosopis removal policy
(PRP) either decided by the community or by government order. The Prosopis area removal rate
is kept at 20% per annum and the policy becomes active from year 2016 and takes full effect
after a delay of 3 years (a step function is used). In this scenario the livestock population is
estimated to increase and reach close to 1.3 lacs by 2030 (Figure 13). The dominant cause for the
rise in livestock population is the increased fodder availability due to increase in area under
grassland due to removal of Prosopis juliflora. Also removal of Prosopis reduces the death
multiplier on Kankrej, allowing the Kankrej cattle to grow more.
Figure 16 Total Livestock under a hypothetical Prosopis removal policy
18 | P a g e
Area under Prosopis and Grassland
Page 3
1992.00 1999.60 2007.20 2014.80 2022.40 2030.00
Years
1:
1:
1:
2:
2:
2:
20000
122500
225000
1: Area under Prosopis 2: area under grassland
1
1
1
1
2
2
2
2
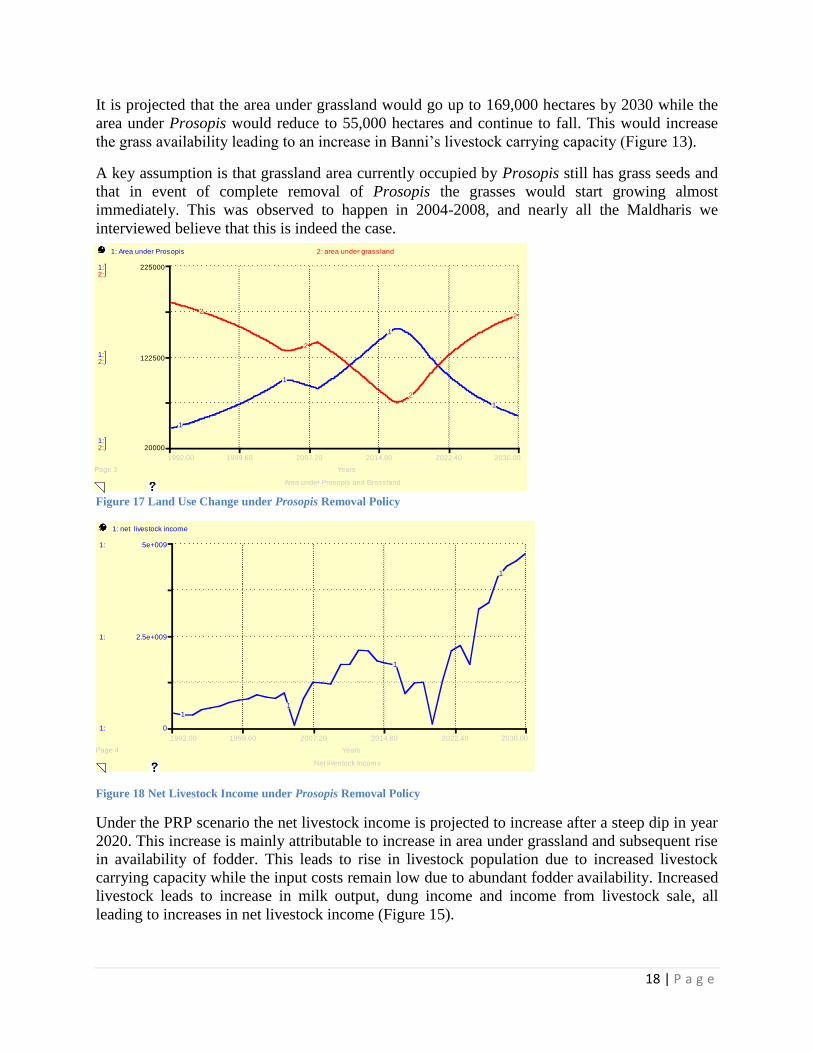
It is projected that the area under grassland would go up to 169,000 hectares by 2030 while the
area under Prosopis would reduce to 55,000 hectares and continue to fall. This would increase
the grass availability leading to an increase in Banni‟s livestock carrying capacity (Figure 13).
A key assumption is that grassland area currently occupied by Prosopis still has grass seeds and
that in event of complete removal of Prosopis the grasses would start growing almost
immediately. This was observed to happen in 2004-2008, and nearly all the Maldharis we
interviewed believe that this is indeed the case.
Figure 17 Land Use Change under Prosopis Removal Policy
Figure 18 Net Livestock Income under Prosopis Removal Policy
Under the PRP scenario the net livestock income is projected to increase after a steep dip in year
2020. This increase is mainly attributable to increase in area under grassland and subsequent rise
in availability of fodder. This leads to rise in livestock population due to increased livestock
carrying capacity while the input costs remain low due to abundant fodder availability. Increased
livestock leads to increase in milk output, dung income and income from livestock sale, all
leading to increases in net livestock income (Figure 15).
Net livestock Income
Page 4
1992.00 1999.60 2007.20 2014.80 2022.40 2030.00
Years
1:
1:
1:
0
2.5e+009
5e+009
1: net livestock income
1
1
1
1
19 | P a g e
Net livestock Income
Page 4
1992.00 1999.60 2007.20 2014.80 2022.40 2030.00
Years
1:
1:
1:
-1e+009
2.5e+009
6e+009
total net income from livestock: 1 - 2 -
1 1
1
12
2
2
2
Livestock
Page 2
1992.00 2001.50 2011.00 2020.50 2030.00
Years
1:
1:
1:
22832
84981
147130
total livestock: 1 - 2 -
1
1
1
2
2
2
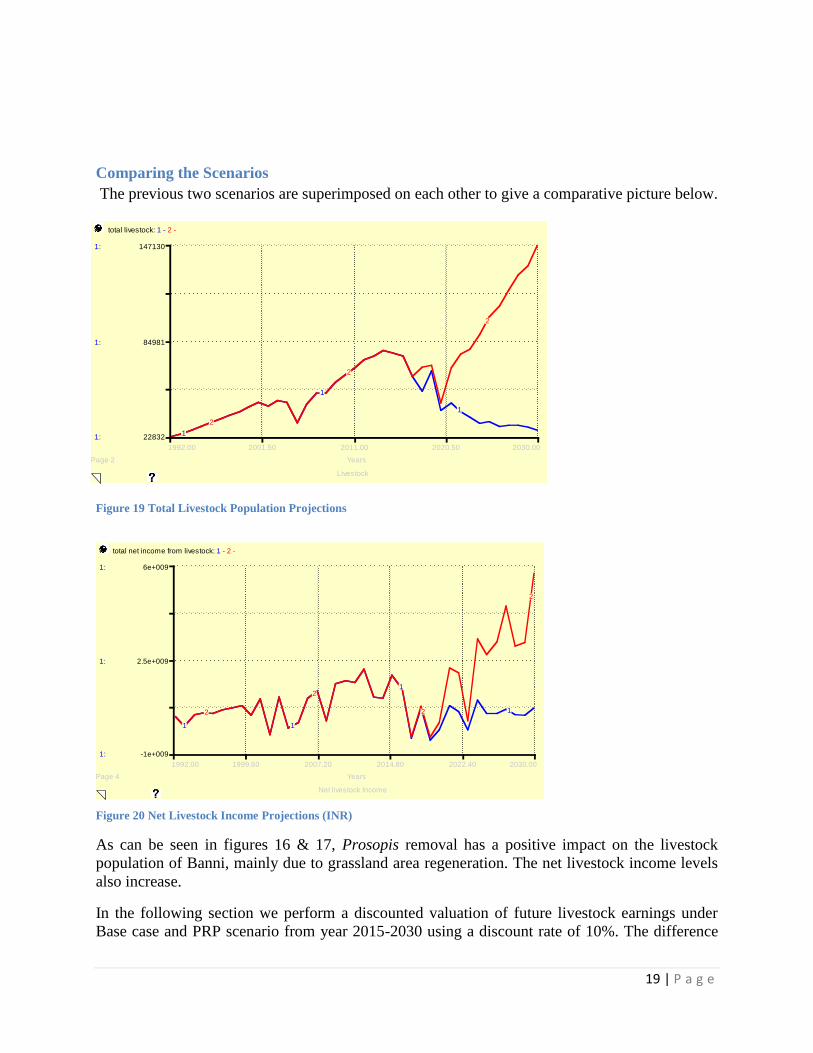
Comparing the Scenarios
The previous two scenarios are superimposed on each other to give a comparative picture below.
Figure 19 Total Livestock Population Projections
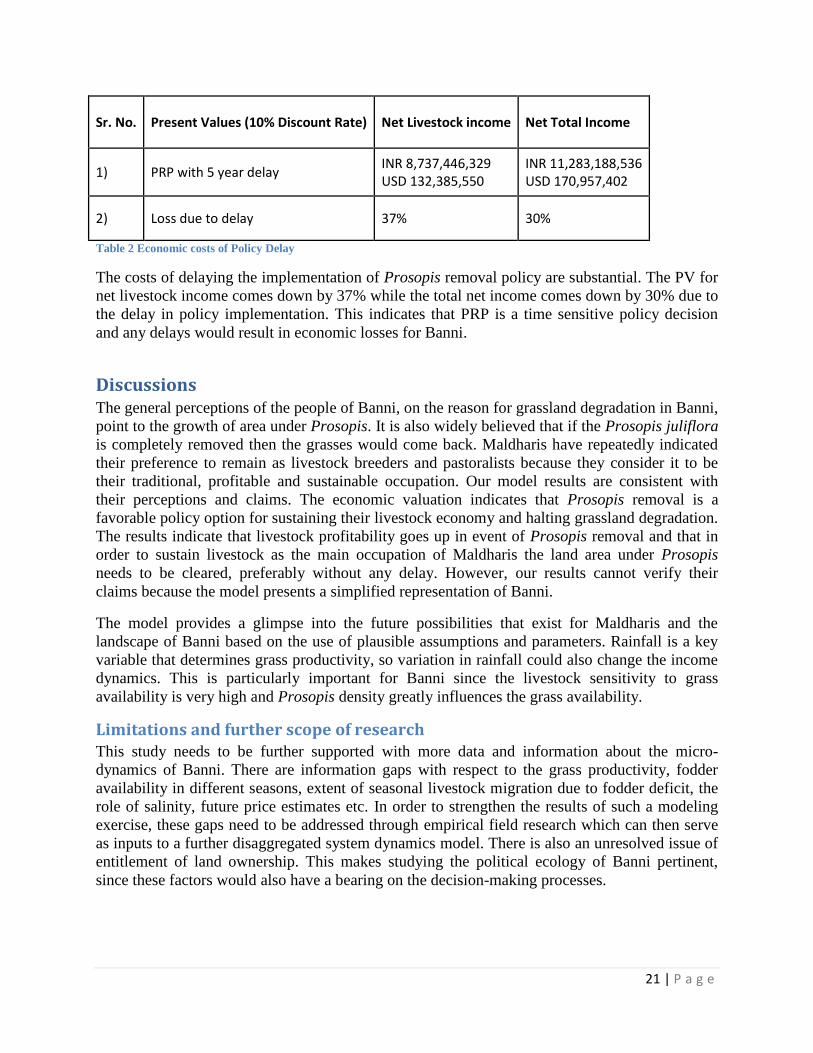
Figure 20 Net Livestock Income Projections (INR)
As can be seen in figures 16 & 17, Prosopis removal has a positive impact on the livestock
population of Banni, mainly due to grassland area regeneration. The net livestock income levels
also increase.
In the following section we perform a discounted valuation of future livestock earnings under
Base case and PRP scenario from year 2015-2030 using a discount rate of 10%. The difference

20 | P a g e
between the two can be assumed to be the partial costs of grassland degradation induced by
Prosopis spread in the Banni2.
Economic Valuation of Income Flows from 2015 to 2030 As per the base run model results the total net annual income of Banni in 2015 is around INR
190 crores i.e. USD 28,787,879. Milk income contributes more than 95% of the total pastoral
income of Banni and more than 85% to the total income of Banni. Charcoal income contributes
around 14% of the total income of Banni.
The total net income includes net income from 1) milk, 2) dung, 3) livestock sale, 4) charcoal
production. The net livestock income, under the base case, is projected to continuously decline.
The sum of present value of livestock and total net income from 2015-2030 comes to INR 500
crores and INR 750 crores respectively. If PRP is in place then the PV (Present Value) increases
to INR 1,385 crores and INR 1,618 crores. This indicates that Prosopis removal has a big
positive multiplier impact on the economy of Banni. Although, there would be a loss of charcoal-
based income due to removal of Prosopis (it is assumed that the Prosopis removed is not used
for charcoal making) the net impact remains positive.
Sr. No. Present Values (10% Discount Rate) Net Livestock income Net Total Income
1) Base Case INR 4,963,208,007 USD 75,200,121
INR 7,502,200,836 USD 113,669,709
2) Prosopis Removal Policy (PRP) @ 20% p.a.
INR 13,850,200,977 USD 209,851,530
INR 16,180,821,218 USD 245,163,958
3) Policy Multiplier (PRP÷Base Case) 2.8 2.2
4) Difference i.e. costs of grassland degradation (No. 2 minus No. 1)
INR 8,886,992,969 USD 134,651,409
INR 8,678,620,382 USD 131,494,248
5) Per ha costs of grassland degradation (No. 4÷2,50,000 ha)
INR 35,548 USD 539
INR 34,714 USD 526
Table 1 Economic Analysis of Base Case and Policy Runs
One more policy run is done to test the impact of a five year delay in the decision to remove
Prosopis and the impact this would have on the PVs.
2 We assume that these are the partial costs, because we do not include other costs such as of loss of biodiversity,
loss in tourism incomes and other ecosystem services provided by the grasslands.
21 | P a g e
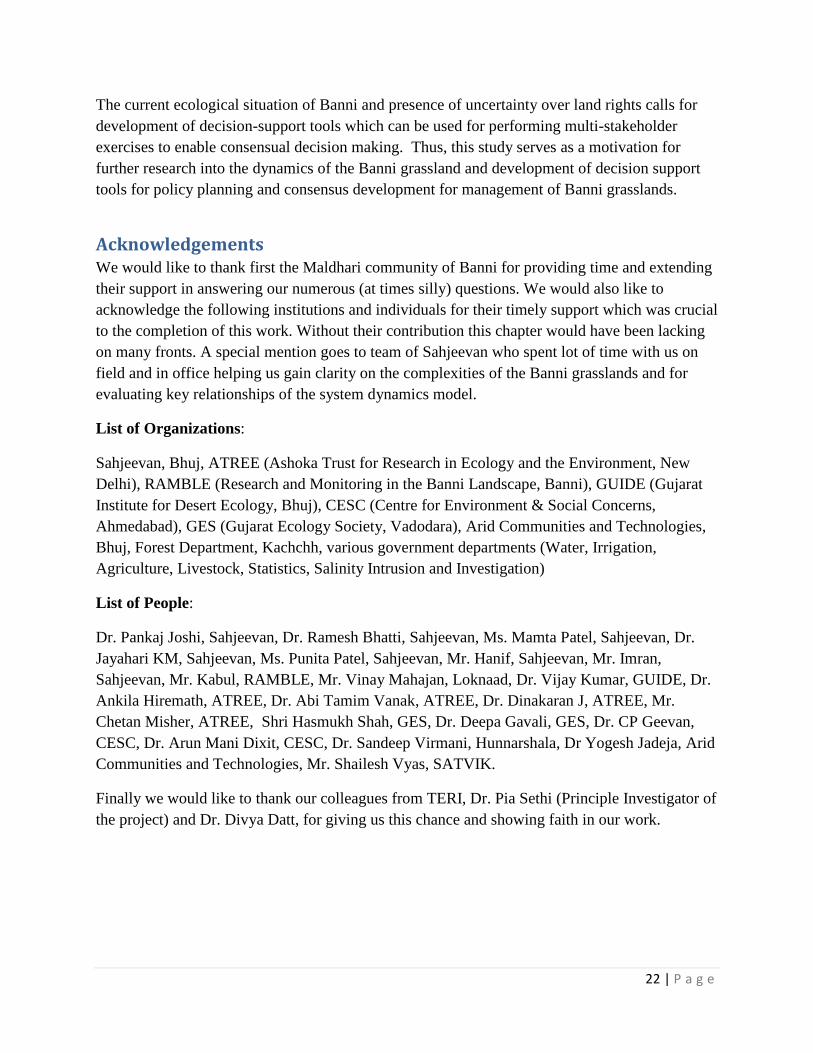
Sr. No. Present Values (10% Discount Rate) Net Livestock income Net Total Income
1) PRP with 5 year delay INR 8,737,446,329 USD 132,385,550
INR 11,283,188,536 USD 170,957,402
2) Loss due to delay 37% 30%
Table 2 Economic costs of Policy Delay
The costs of delaying the implementation of Prosopis removal policy are substantial. The PV for
net livestock income comes down by 37% while the total net income comes down by 30% due to
the delay in policy implementation. This indicates that PRP is a time sensitive policy decision
and any delays would result in economic losses for Banni.
Discussions The general perceptions of the people of Banni, on the reason for grassland degradation in Banni,
point to the growth of area under Prosopis. It is also widely believed that if the Prosopis juliflora
is completely removed then the grasses would come back. Maldharis have repeatedly indicated
their preference to remain as livestock breeders and pastoralists because they consider it to be
their traditional, profitable and sustainable occupation. Our model results are consistent with
their perceptions and claims. The economic valuation indicates that Prosopis removal is a
favorable policy option for sustaining their livestock economy and halting grassland degradation.
The results indicate that livestock profitability goes up in event of Prosopis removal and that in
order to sustain livestock as the main occupation of Maldharis the land area under Prosopis
needs to be cleared, preferably without any delay. However, our results cannot verify their
claims because the model presents a simplified representation of Banni.
The model provides a glimpse into the future possibilities that exist for Maldharis and the
landscape of Banni based on the use of plausible assumptions and parameters. Rainfall is a key
variable that determines grass productivity, so variation in rainfall could also change the income
dynamics. This is particularly important for Banni since the livestock sensitivity to grass
availability is very high and Prosopis density greatly influences the grass availability.
Limitations and further scope of research This study needs to be further supported with more data and information about the micro-
dynamics of Banni. There are information gaps with respect to the grass productivity, fodder
availability in different seasons, extent of seasonal livestock migration due to fodder deficit, the
role of salinity, future price estimates etc. In order to strengthen the results of such a modeling
exercise, these gaps need to be addressed through empirical field research which can then serve
as inputs to a further disaggregated system dynamics model. There is also an unresolved issue of
entitlement of land ownership. This makes studying the political ecology of Banni pertinent,
since these factors would also have a bearing on the decision-making processes.
22 | P a g e
The current ecological situation of Banni and presence of uncertainty over land rights calls for
development of decision-support tools which can be used for performing multi-stakeholder
exercises to enable consensual decision making. Thus, this study serves as a motivation for
further research into the dynamics of the Banni grassland and development of decision support
tools for policy planning and consensus development for management of Banni grasslands.
Acknowledgements We would like to thank first the Maldhari community of Banni for providing time and extending
their support in answering our numerous (at times silly) questions. We would also like to
acknowledge the following institutions and individuals for their timely support which was crucial
to the completion of this work. Without their contribution this chapter would have been lacking
on many fronts. A special mention goes to team of Sahjeevan who spent lot of time with us on
field and in office helping us gain clarity on the complexities of the Banni grasslands and for
evaluating key relationships of the system dynamics model.
List of Organizations:
Sahjeevan, Bhuj, ATREE (Ashoka Trust for Research in Ecology and the Environment, New
Delhi), RAMBLE (Research and Monitoring in the Banni Landscape, Banni), GUIDE (Gujarat
Institute for Desert Ecology, Bhuj), CESC (Centre for Environment & Social Concerns,
Ahmedabad), GES (Gujarat Ecology Society, Vadodara), Arid Communities and Technologies,
Bhuj, Forest Department, Kachchh, various government departments (Water, Irrigation,
Agriculture, Livestock, Statistics, Salinity Intrusion and Investigation)
List of People:
Dr. Pankaj Joshi, Sahjeevan, Dr. Ramesh Bhatti, Sahjeevan, Ms. Mamta Patel, Sahjeevan, Dr.
Jayahari KM, Sahjeevan, Ms. Punita Patel, Sahjeevan, Mr. Hanif, Sahjeevan, Mr. Imran,
Sahjeevan, Mr. Kabul, RAMBLE, Mr. Vinay Mahajan, Loknaad, Dr. Vijay Kumar, GUIDE, Dr.
Ankila Hiremath, ATREE, Dr. Abi Tamim Vanak, ATREE, Dr. Dinakaran J, ATREE, Mr.
Chetan Misher, ATREE, Shri Hasmukh Shah, GES, Dr. Deepa Gavali, GES, Dr. CP Geevan,
CESC, Dr. Arun Mani Dixit, CESC, Dr. Sandeep Virmani, Hunnarshala, Dr Yogesh Jadeja, Arid
Communities and Technologies, Mr. Shailesh Vyas, SATVIK.
Finally we would like to thank our colleagues from TERI, Dr. Pia Sethi (Principle Investigator of
the project) and Dr. Divya Datt, for giving us this chance and showing faith in our work.

23 | P a g e
Works Cited Bharwada, C, Mahajan, V. 2012. Let it be Banni: Understanding and Sustaining Pastoral
Livelihoods of Banni. Centre for Economic and Social Studies (CESS) Monograph.
RULNR Monograph-13. Begumpet, Hyderabad, India.
http://www.cess.ac.in/cesshome/mono/CESSMonograph-26(RULNR-13).pdf
Casti, J.L.1997. Would-be worlds: How simulation is changing the frontiers of science. New
York: John Wiley & Sons.
Directorate General of Census Operations. 2011. Census India. Retrieved September 2016, from
Census India:
http://www.censusindia.gov.in/2011census/dchb/2401_PART_B_DCHB_KACHCHH.pd
f
Forrester, J. W. 1958. Industrial Dynamics -a major breakthrough for decision makers. Harvard
Business Review. Jul-Aug 1958.
Gallati J, Wiesmann U. 2011. System dynamics in transdisciplinary research for sustainable
development. In: Wiesmann U, Hurni H, editors; with an international group of co-
editors. Research for Sustainable Development: Foundations, Experiences, and
Perspectives. Perspectives of the Swiss National Centre of Competence in Research
(NCCR) North-South, University of Bern, Vol. 6. Bern, Switzerland: Geographica
Bernensia, pp 345–360.
Gavali, D., Rathod, J., Patel, T. 2015. Vegetation dynamics in Banni grasslands under the
influence of changing climate. Vadodara: Gujarat Ecology Society.
Geevan, C.P., Dixit,A. M., Silori, C.S. 2003. Ecological Economic Analysis of Grassland
Systems. EERC Working Paper Series: CPR-5. Bhuj: Gujarat Institute of Desert Ecology.
http://www.cesc-india.org/doc-archiv/ee-cpg-report-full.pdf
IMD. 2016. Customized Rainfall Information System (CRIS). Retrieved September 2016, from
India Meteorological Department:
http://hydro.imd.gov.in/hydrometweb/(S(lmae0jvse31sb045m2gxd5i1))/DistrictRaifall.as
px
Koladiya, M.H., Gajera, N. B., Mahato, A.K.R., Kumar, V.V., Asari, R.V.2016. Birds of Banni
Grassland. Gujarat Institute of Desert Ecology, Bhuj. The Ravi Sankaran Foundation.
http://www.ravisankaran.org/wp-content/uploads/2016/06/Birds-of-Banni-Grassland.pdf
Mehta, A., Sinha, M., Chaudhary, R. 2014. Evaluation of land cover changes in Banni grassland
using GIS and RS Technology-A Case Study. Bulletin of Environmental and Scientific
Research Vol 3, No 4 (2014).
MIT. 1997. System Dynamics. Retrieved September 2016, from MIT:
http://web.mit.edu/sysdyn/sd-intro/
24 | P a g e
Vaibhav, V., Inamdar, A. B., Bajaj, D.N.2012. Above Ground Biomass and Carbon Stock
Estimation From Prosopis Juliflora in Banni Grassland Using Satellite and Ancillary
Data. 33rd
Asian Conference on Remote Sensing, Thailand. http://a-a-r-
s.org/acrs/administrator/components/com_jresearch/files/publications/E3-1.pdf
25 | P a g e
Annexure
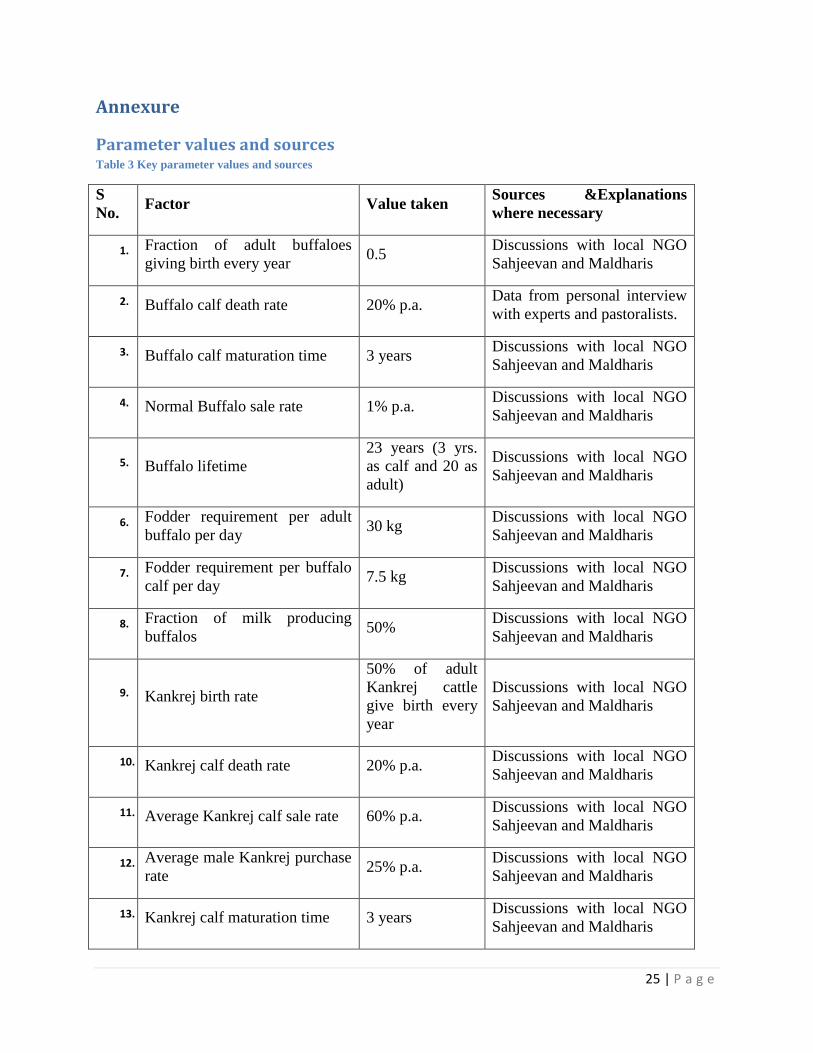
Parameter values and sources Table 3 Key parameter values and sources
S
No. Factor Value taken
Sources &Explanations
where necessary
1. Fraction of adult buffaloes
giving birth every year 0.5
Discussions with local NGO
Sahjeevan and Maldharis
2. Buffalo calf death rate 20% p.a. Data from personal interview
with experts and pastoralists.
3. Buffalo calf maturation time 3 years Discussions with local NGO
Sahjeevan and Maldharis
4. Normal Buffalo sale rate 1% p.a. Discussions with local NGO
Sahjeevan and Maldharis
5. Buffalo lifetime
23 years (3 yrs.
as calf and 20 as
adult)
Discussions with local NGO
Sahjeevan and Maldharis
6. Fodder requirement per adult
buffalo per day 30 kg
Discussions with local NGO
Sahjeevan and Maldharis
7. Fodder requirement per buffalo
calf per day 7.5 kg
Discussions with local NGO
Sahjeevan and Maldharis
8. Fraction of milk producing
buffalos 50%
Discussions with local NGO
Sahjeevan and Maldharis
9. Kankrej birth rate
50% of adult
Kankrej cattle
give birth every
year
Discussions with local NGO
Sahjeevan and Maldharis
10. Kankrej calf death rate 20% p.a. Discussions with local NGO
Sahjeevan and Maldharis
11. Average Kankrej calf sale rate 60% p.a. Discussions with local NGO
Sahjeevan and Maldharis
12. Average male Kankrej purchase
rate 25% p.a.
Discussions with local NGO
Sahjeevan and Maldharis
13. Kankrej calf maturation time 3 years Discussions with local NGO
Sahjeevan and Maldharis
26 | P a g e
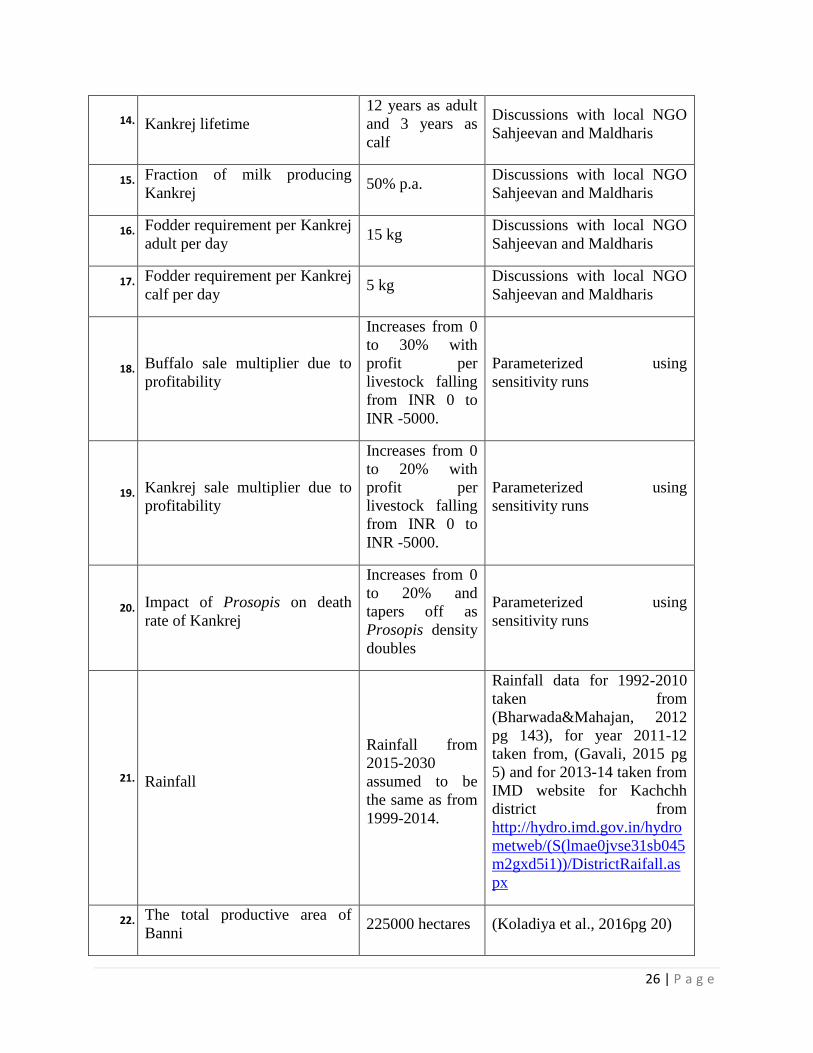
14. Kankrej lifetime
12 years as adult
and 3 years as
calf
Discussions with local NGO
Sahjeevan and Maldharis
15. Fraction of milk producing
Kankrej 50% p.a.
Discussions with local NGO
Sahjeevan and Maldharis
16. Fodder requirement per Kankrej
adult per day 15 kg
Discussions with local NGO
Sahjeevan and Maldharis
17. Fodder requirement per Kankrej
calf per day 5 kg
Discussions with local NGO
Sahjeevan and Maldharis
18. Buffalo sale multiplier due to
profitability
Increases from 0
to 30% with
profit per
livestock falling
from INR 0 to
INR -5000.
Parameterized using
sensitivity runs
19. Kankrej sale multiplier due to
profitability
Increases from 0
to 20% with
profit per
livestock falling
from INR 0 to
INR -5000.
Parameterized using
sensitivity runs
20. Impact of Prosopis on death
rate of Kankrej
Increases from 0
to 20% and
tapers off as
Prosopis density
doubles
Parameterized using
sensitivity runs
21. Rainfall
Rainfall from
2015-2030
assumed to be
the same as from
1999-2014.
Rainfall data for 1992-2010
taken from
(Bharwada&Mahajan, 2012
pg 143), for year 2011-12
taken from, (Gavali, 2015 pg
5) and for 2013-14 taken from
IMD website for Kachchh
district from
http://hydro.imd.gov.in/hydro
metweb/(S(lmae0jvse31sb045
m2gxd5i1))/DistrictRaifall.as
px
22. The total productive area of
Banni 225000 hectares (Koladiya et al., 2016pg 20)
27 | P a g e
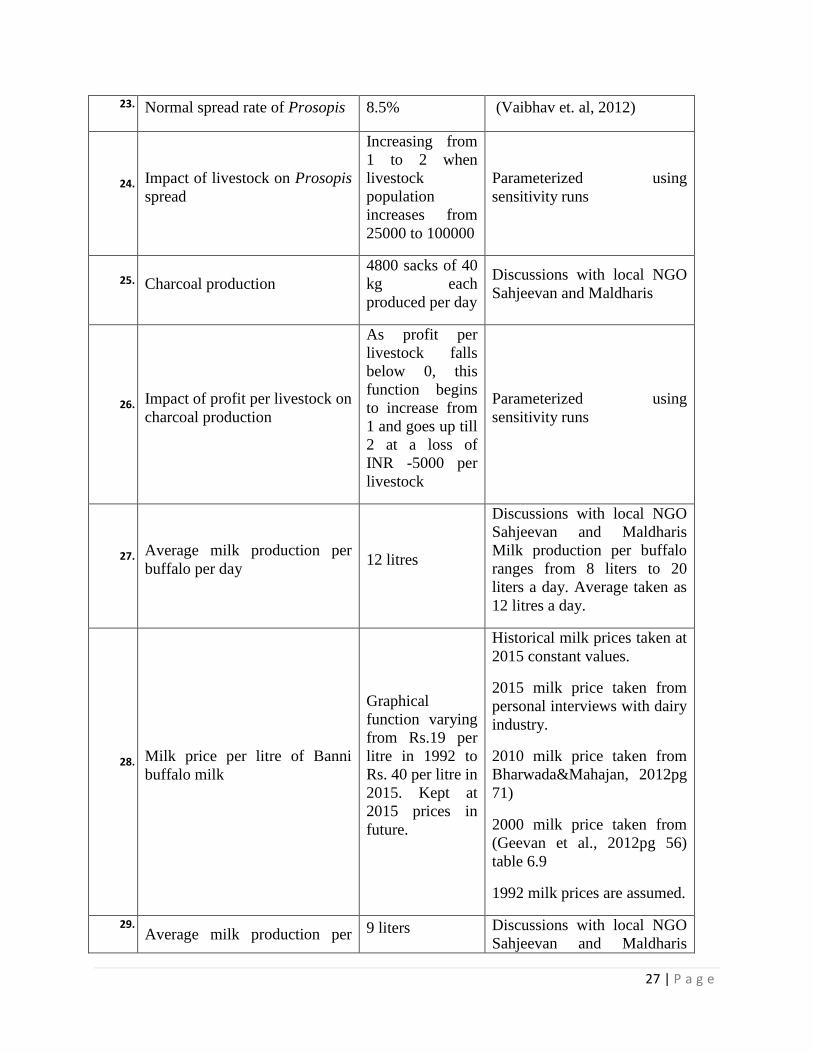
23. Normal spread rate of Prosopis 8.5% (Vaibhav et. al, 2012)
24. Impact of livestock on Prosopis
spread
Increasing from
1 to 2 when
livestock
population
increases from
25000 to 100000
Parameterized using
sensitivity runs
25. Charcoal production
4800 sacks of 40
kg each
produced per day
Discussions with local NGO
Sahjeevan and Maldharis
26. Impact of profit per livestock on
charcoal production
As profit per
livestock falls
below 0, this
function begins
to increase from
1 and goes up till
2 at a loss of
INR -5000 per
livestock
Parameterized using
sensitivity runs
27. Average milk production per
buffalo per day 12 litres
Discussions with local NGO
Sahjeevan and Maldharis
Milk production per buffalo
ranges from 8 liters to 20
liters a day. Average taken as
12 litres a day.
28. Milk price per litre of Banni
buffalo milk
Graphical
function varying
from Rs.19 per
litre in 1992 to
Rs. 40 per litre in
2015. Kept at
2015 prices in
future.
Historical milk prices taken at
2015 constant values.
2015 milk price taken from
personal interviews with dairy
industry.
2010 milk price taken from
Bharwada&Mahajan, 2012pg
71)
2000 milk price taken from
(Geevan et al., 2012pg 56)
table 6.9
1992 milk prices are assumed.
29. Average milk production per 9 liters Discussions with local NGO
Sahjeevan and Maldharis
28 | P a g e
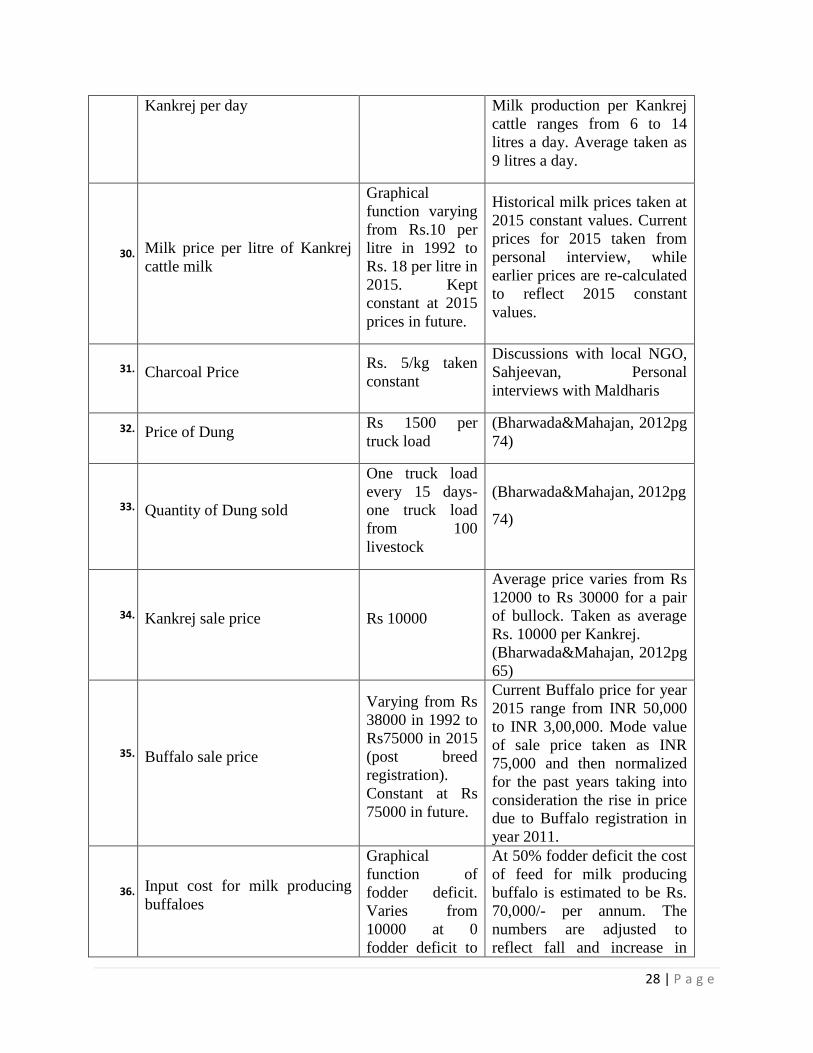
Kankrej per day Milk production per Kankrej
cattle ranges from 6 to 14
litres a day. Average taken as
9 litres a day.
30. Milk price per litre of Kankrej
cattle milk
Graphical
function varying
from Rs.10 per
litre in 1992 to
Rs. 18 per litre in
2015. Kept
constant at 2015
prices in future.
Historical milk prices taken at
2015 constant values. Current
prices for 2015 taken from
personal interview, while
earlier prices are re-calculated
to reflect 2015 constant
values.
31. Charcoal Price Rs. 5/kg taken
constant
Discussions with local NGO,
Sahjeevan, Personal
interviews with Maldharis
32. Price of Dung Rs 1500 per
truck load
(Bharwada&Mahajan, 2012pg
74)
33. Quantity of Dung sold
One truck load
every 15 days-
one truck load
from 100
livestock
(Bharwada&Mahajan, 2012pg
74)
34. Kankrej sale price Rs 10000
Average price varies from Rs
12000 to Rs 30000 for a pair
of bullock. Taken as average
Rs. 10000 per Kankrej.
(Bharwada&Mahajan, 2012pg
65)
35. Buffalo sale price
Varying from Rs
38000 in 1992 to
Rs75000 in 2015
(post breed
registration).
Constant at Rs
75000 in future.
Current Buffalo price for year
2015 range from INR 50,000
to INR 3,00,000. Mode value
of sale price taken as INR
75,000 and then normalized
for the past years taking into
consideration the rise in price
due to Buffalo registration in
year 2011.
36. Input cost for milk producing
buffaloes
Graphical
function of
fodder deficit.
Varies from
10000 at 0
fodder deficit to
At 50% fodder deficit the cost
of feed for milk producing
buffalo is estimated to be Rs.
70,000/- per annum. The
numbers are adjusted to
reflect fall and increase in
29 | P a g e
DT = 0.1
Page 11
1992.00 1999.60 2007.20 2014.80 2022.40 2030.00
Years
1:
1:
1:
20000
50000
80000
1: total livestock
1
1
1
1
DT = 1
Page 10
1992.00 1999.60 2007.20 2014.80 2022.40 2030.00
Years
1:
1:
1:
20000
50000
80000
total livestock: 1 -
1
1
1
1
140000 at 100%
fodder deficit
fodder deficit and its
corresponding impact on feed
cost due to increase in supply.
37. Feed cost for non-milk
producing buffaloes
One-third of No.
36. Discussions with local NGO
Sahjeevan and Maldharis
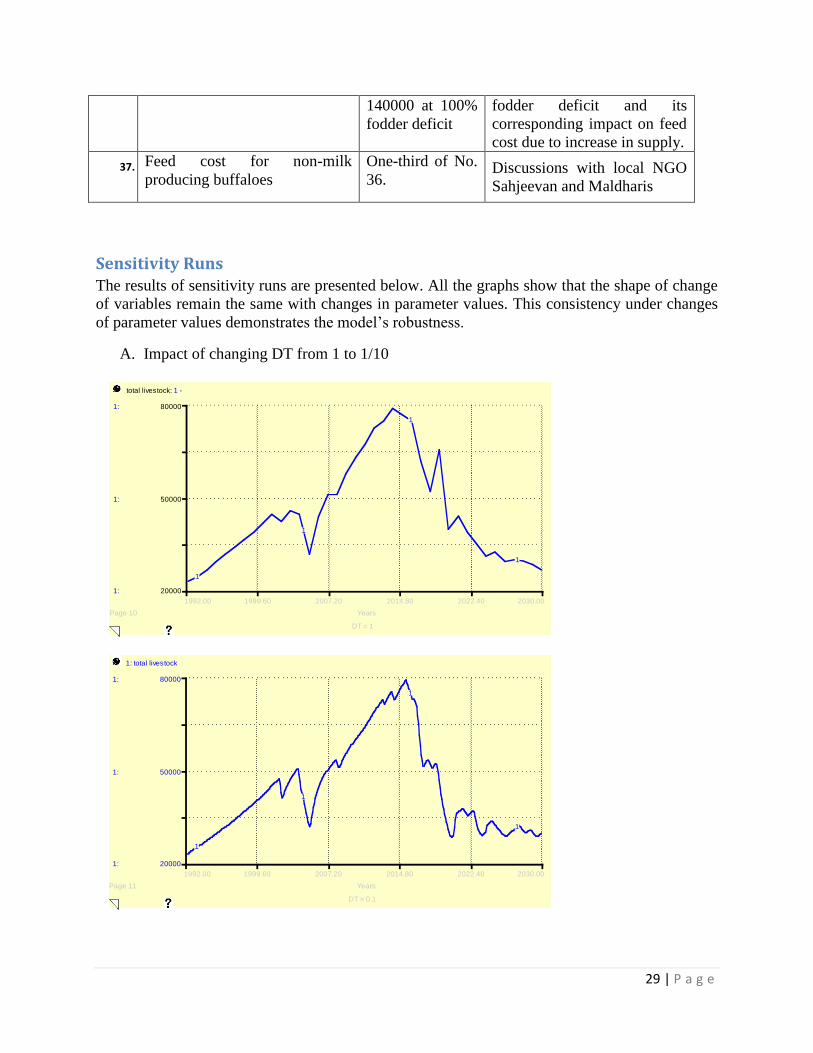
Sensitivity Runs The results of sensitivity runs are presented below. All the graphs show that the shape of change
of variables remain the same with changes in parameter values. This consistency under changes
of parameter values demonstrates the model‟s robustness.
A. Impact of changing DT from 1 to 1/10
30 | P a g e
Sensitivity Run - Total Productive Area
Page 6
1992.00 1999.60 2007.20 2014.80 2022.40 2030.00
Years
1:
1:
1:
20000
50000
80000
total livestock: 1 - 2 - 3 -
1
1
1
12
2
2
2
3
3
3
Sensitivity Run - Prosopis Spread Rate
Page 7
1992.00 1999.60 2007.20 2014.80 2022.40 2030.00
Years
1:
1:
1:
15000
60000
105000
total livestock: 1 - 2 - 3 -
1
1
1
1
2
2
2
2
3
3
3
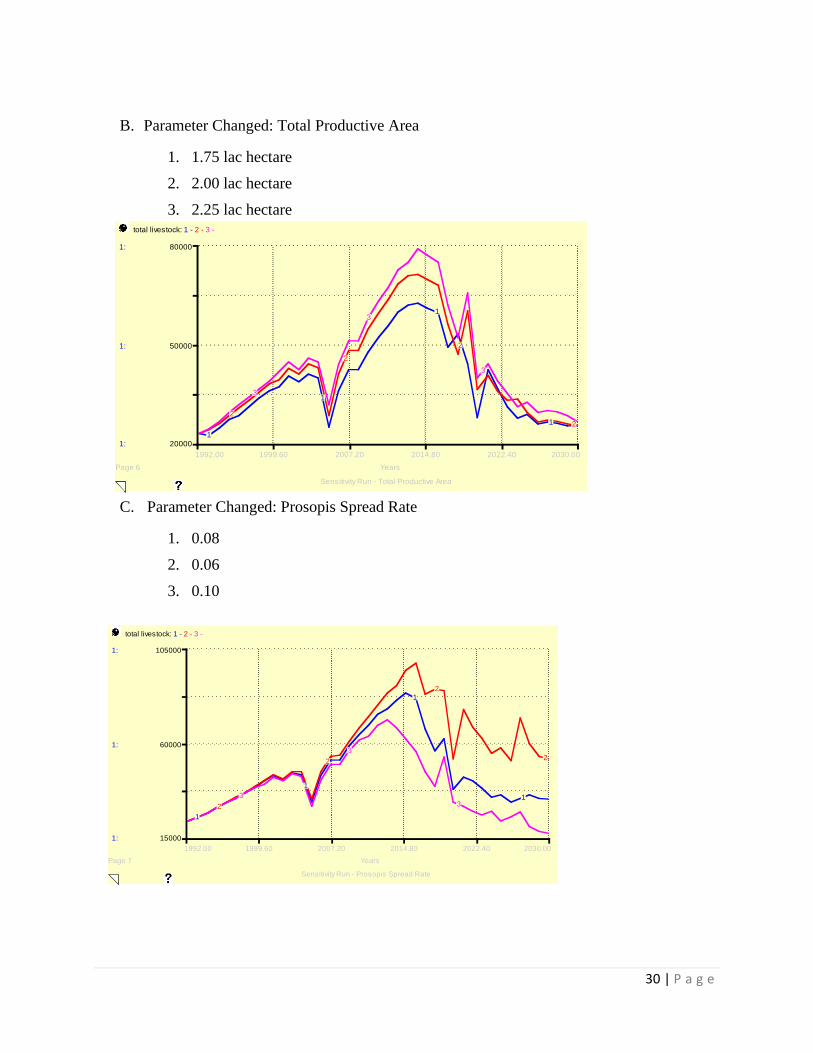
B. Parameter Changed: Total Productive Area
1. 1.75 lac hectare
2. 2.00 lac hectare
3. 2.25 lac hectare
C. Parameter Changed: Prosopis Spread Rate
1. 0.08
2. 0.06
3. 0.10
31 | P a g e
Sensitivity Run - Buffalo Sale Rate
Page 8
1992.00 1999.60 2007.20 2014.80 2022.40 2030.00
Years
1:
1:
1:
20000
50000
80000
total livestock: 1 - 2 - 3 -
1
1
1
12
2
2
23
3 3
Sensitivity Run - Mil Production Per Buffalo Per Day
Page 9
1992.00 1999.60 2007.20 2014.80 2022.40 2030.00
Years
1:
1:
1:
20000
55000
90000
total livestock: 1 - 2 - 3 -
1
1
1
12
2
2
2
3
3
3
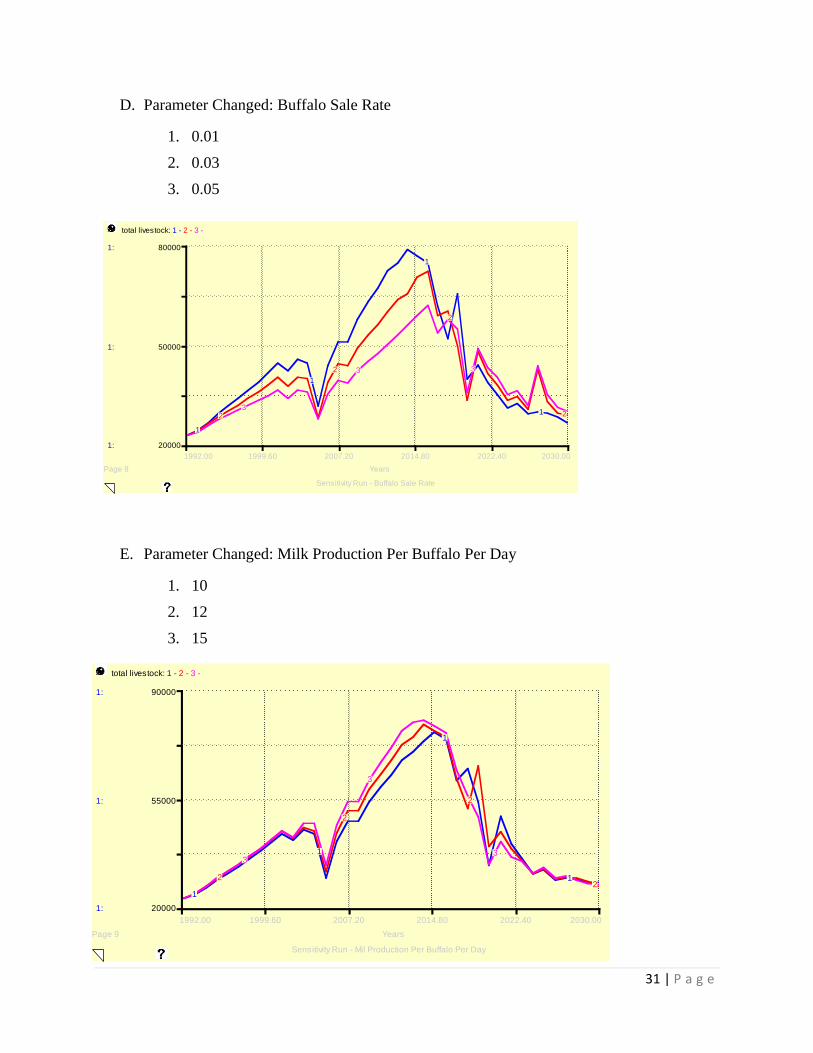
D. Parameter Changed: Buffalo Sale Rate
1. 0.01
2. 0.03
3. 0.05
E. Parameter Changed: Milk Production Per Buffalo Per Day
1. 10
2. 12
3. 15
32 | P a g e
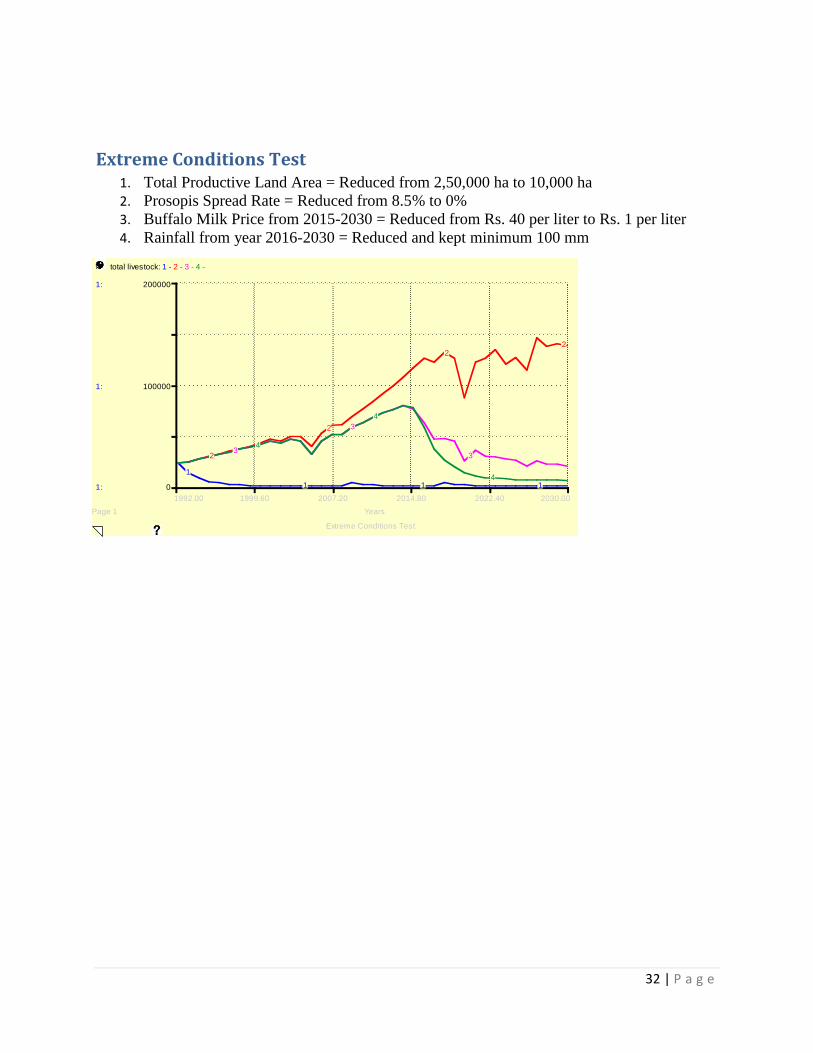
Extreme Conditions Test
Page 1
1992.00 1999.60 2007.20 2014.80 2022.40 2030.00
Years
1:
1:
1:
0
100000
200000
total livestock: 1 - 2 - 3 - 4 -
1
1 1 1
2
2
22
3
3
3
4
4
4
Extreme Conditions Test 1. Total Productive Land Area = Reduced from 2,50,000 ha to 10,000 ha
2. Prosopis Spread Rate = Reduced from 8.5% to 0%
3. Buffalo Milk Price from 2015-2030 = Reduced from Rs. 40 per liter to Rs. 1 per liter
4. Rainfall from year 2016-2030 = Reduced and kept minimum 100 mm