modeling the atmospheric transport and outflow of...
TRANSCRIPT

lable at ScienceDirect
Atmospheric Environment 45 (2011) 2820e2827
Contents lists avai
Atmospheric Environment
journal homepage: www.elsevier .com/locate/atmosenv
Modeling the atmospheric transport and outflow of polycyclicaromatic hydrocarbons emitted from China
Yanxu Zhang a,1, Huizhong Shen a, Shu Tao a,*, Jianmin Ma b
a Laboratory for Earth Surface Processes, College of Urban and Environmental Sciences, Peking University, Beijing 100871, ChinabAir Quality Research Division, Science and Technology Branch, Environment Canada, 4905 Dufferin Street, Toronto, Ontario M3H 5T4, Canada
a r t i c l e i n f o
Article history:Received 2 October 2010Received in revised form28 February 2011Accepted 2 March 2011
Keywords:PAHAtmospheric transport modelOutflow fluxCanMETOP
* Corresponding author. Tel./fax: þ86 10 62751938E-mail address: [email protected] (S. Tao).
1 Department of Atmospheric Sciences, University98195, United States
1352-2310/$ e see front matter � 2011 Elsevier Ltd.doi:10.1016/j.atmosenv.2011.03.006
a b s t r a c t
An Euler atmospheric transport model CanMETOP (Canadian Model for Environmental Transport ofOrganochlorine Pesticides) was applied to the atmospheric transport and outflow of polycyclic aromatichydrocarbons (PAHs) in China in 2003 based on a square kilometer resolution emission inventory.The reactionwith OH radical, gas/particle partition by considering the adsorption onto total aerosol surfacearea, and dynamic soil/oceaneair exchange of PAHswere also considered. The results show that the spatialdistribution of PAH concentration levels in the atmosphere is greatly controlled by emission and meteo-rological conditions. Elevated concentration levels are predicted in Shanxi, Guizhou, North China Plain,Sichuan Basin and Chongqing metropolitan areas due to the high emission densities at those locations.High concentrations are also modeled in environments offshore of China and in the western Pacific Ocean.The model also predicts a slightly decreasing vertical profile in the planetary boundary layer (lower than∼1 km), but concentration decreases ∼2 orders ofmagnitude in the free atmosphere. TheWesterlies aswellas the East Asian Monsoon and local topographical forcings are identified as key factors influencing thetransport pattern of PAHs in China. In 2003, ∼3800�tons of the sixteenparent PAHs listed on USEPA prioritycontrol list were transported out of China with about 80% transported through the eastern boundary.The outflow concentrates near 30�N, signifying a slight discrepancy from the position of emission densitypeaks. The center of the outflow plume is located at a height of ∼1 km at 120�E, and climbs to 3.5 km and5 km at 130�E and 140�E, respectively. A seasonal variation of 5e6 fold is also found for the outflow fluxwith greatly elevated transport flux in spring and winter.
� 2011 Elsevier Ltd. All rights reserved.
1. Introduction
As the world’s largest emitter (Zhang and Tao, 2009), Chinasuffers from severe atmospheric PAH pollution. High concentra-tions of PAHs were extensively detected (Liu et al., 2007), andelevated lung cancer risk is induced among Chinese populationdue to inhalation exposure of PAHs (Zhang et al., 2009). In additionto domestic risk, as one of the sixteen substances listed in theConvention on Long-range Transboundary Air Pollution Protocol onPersistent Organic Pollutants (United Nations Economic Commis-sion, http://www.unece.org/env/lrtap/pops_h1.htm), the outflowof PAHs from China is also of international concern. Extensivemonitoring studies have shown that the PAHs emitted by China canundergo long-range transport and significantly enhance the near
.
of Washington, Seattle, WA
All rights reserved.
ground concentrations in surrounding countries and continentslocated downwind of China, including Korea, Japan, and NorthAmerica under certain meteorological conditions (Lee et al., 2006;Killin et al., 2004; Primbs et al., 2007; Tamamura et al., 2007; Yanget al., 2007; Lang et al., 2008). However, qualitative analysis ofthe outflow flux of PAHs from China is generally missing in theliterature except for a rough estimate by Lang et al. (2008) witha statistical trajectory approach and highly simplified transport andchemistry schemes.
Great diversity exists for PAHs emission density as well asclimatological and meteorological conditions in different parts ofChina (Zhang et al., 2008; Zhang, 1991). Therefore, the transportpatterns of PAHs are anticipated to have great variance. For example,Lang et al. (2007) modeled the transport of PAHs emitted fromGuangdong, China and found that there is a main transport pathwayto the South China Sea and Southeast Asian countries in winter anda main transport pathway to northern mainland China in summer.In another study, Liu et al. (2007) found that eastward and south-ward transport routes are the main transport pathways for the PAHsemitted from the North China Plain.

Y. Zhang et al. / Atmospheric Environment 45 (2011) 2820e2827 2821
Modeling studies for the transport and fate of PAHs were con-ducted both in regional (Matthias et al., 2009; Prevedouros et al.,2008; Lang et al., 2008; Zhang et al., 2009) and global scale (Sehiliand Lammel, 2007; Lammel et al., 2009) with multicompartment(multimedia) and atmospheric chemistry and transport models.These studies focus on the influence of gas/particle partitioning ofPAHs and typically use Benzo[a]pyrene or other selected compoundsas the reference chemical. In addition, several studies haveaddressed the atmospheric transport andoutflowof pollutants otherthan PAHs emitted from East Asia (Liu et al., 2003; Liang et al., 2004;Liang et al., 2005). For instance, Liang et al. (2004) summarized themain outflow mechanisms for CO emitted from East Asia by liftingthrough convection and the warm conveyor belt followed by a fasttransport in the free atmosphere.
In this study, we used a regional scale PAH transport modelwith a relatively high spatial resolution (24 km � 24 km) to modelthe atmospheric transport and fate of PAHs in China. The mainobjectives are 1) to conduct a comprehensive investigation of theatmospheric transport patterns of PAHs in China, and 2) to quan-titatively evaluate the outflow of PAHs from China, with specialemphasis on the flux estimate as well as its source location andseasonal variation.
2. Methodology
A modified version of the CanMETOP was used to model thetransport and outflow of PAHs (Ma et al., 2003). The details of thismodel have been presented previously (Ma et al., 2003 and citedreferences). Briefly, the model has a horizontal spatial resolution of24 km � 24 kmwith 210 � 270 grids and covers the entirety Chinaand surrounding regions (Fig. 1). The model has 12 vertical layerscantered at 1.5, 3.9, 10, 100, 350, 700, 1200, 2000, 3000, 5000and 7000 m, respectively. Three dimensional atmospheric advec-tion and eddy diffusion are solved numerically by a finite-differ-ence approximation and operator-splitting scheme. An advancedboundary layer parameterization scheme and a non-local turbu-lence closure are employed to calculate boundary layer height andother related parameters. The dry deposition of particulate mattersassociated PAHs is assumed to occur at the bottom 4 layers, whilethe dry deposition velocity is calculated by a series-of-resistancesapproach. On the contrary, the wet deposition occurs in the wholeatmospheric column based on the archived total precipitation data.Due to the short lifetime of PAHs in the atmosphere (Hafner et al.,2005), the contribution of sources from other regions are negligiblecompared with that from local Chinese sources. Therefore, a zeroconcentration boundary condition is used in this simulationfollowing Matthias et al. (2009).
The modeled compounds include the sixteen PAHs in theUSEPA priority control list, including naphthalene (NAP), ace-naphthylene (ACY), acenaphthene (ACE), fluorene (FLO), phenan-threne (PHE), anthracene (ANT), fluoranthene (FLA), pyrene (PYR),
Fig. 1. Near surface atmospheric concentrations of three representa
benz(a)anthracene (BaA), chrysene (CHR), benzo(b)fluoranthene(BbF), benzo(k)fluoranthene (BkF), benzo(a)pyrene (BaP), dibenz(a,h)anthracene (DahA), indeno(l,2,3-cd)pyrene (IcdP), and benzo(g,h,i)perylene (BghiP). The total concentration of the 16 PAHs isdenoted as PAH16. Among them, BaP was chosen as a represen-tative compound to discuss the general transport and outflowpattern because BaP is the largest contributor to the nationaltotal lung cancer risk associated with inhalation exposure of PAHsin China in 2003 (Zhang et al., 2009). BaP’s contribution to lungcancer risk was evaluated based on a set of BaP equivalent toxicityfactors derived from an animal experiment by Nisbet and Lagoy(1992).
Because the PAH compounds with intermediate molecularweights are semi-volatile and can adsorb onto the surface of aero-sols in the atmosphere, the fraction of particulate associated PAHs iscalculated according to the temperature and total aerosol surfacearea concentration (Pankow, 1987). The PAHs in gaseous andparticulate phases are combined into a single tracer in the model tosave computation time. This setting implies instantaneous partitionequilibrium between these two phases and may slightly alter thelifetime of PAHs in each phase; but the influence on the total PAHsshould be minimal. The chemical reaction of gas phase PAHs withOH radical is considered and second-order degradation kinetics isassumed for the reaction. The reaction of PAHs with other oxidants,such as NO3 and O3were neglected due to their minor contributions(Prevedouros et al., 2008; Lammel et al., 2009). The degradationof particulate phase PAHs was also neglected because of the lackof experimental data and much smaller reaction coefficient(Estève et al., 2006). The offline monthly mean total aerosol surfacearea concentration and OH radical number concentrations werecollected from themonthly archived data outputted by GEOS-Chemmodel (http://www-as.harvard.edu/chemistry/trop/geos/geos_hi_res.html). At the bottom level of the atmosphere, the mass trans-fer flux of gaseous PAHs between air and the underlying soil/wateris calculated according to the difference of instantaneousfugacity between air and soil/water. The leaching/sedimentationand degradation of PAHs in soil/water are also modeled dynami-cally. The modeling details of PAH fate and related parameters aredescribed in the Supporting Information.
A PAH emission inventory with spatial resolution of1 km � 1 kmwas aggregated to 24 km � 24 km and applied in thisstudy (Zhang et al., 2008). The meteorological and initial concen-tration data used to drive this model have been described else-where (Ma et al., 2003; Zhang et al., 2009). The model was run forthe reference year of 2003. In order to evaluate the accuracy ofmodel output for inhalation exposure calculation and lung cancerrisk assessment, the annual mean near surface concentrations werecarefully compared with observations in our previous study (Zhanget al., 2009). In this study, further comparison with observationsfrom a long time series measurement in Gosan, Korea was con-ducted and the details are provided in the Supporting Information.
tive PAHs (from left to right: PHE, CHR and BaP, respectively).
Y. Zhang et al. / Atmospheric Environment 45 (2011) 2820e28272822
3. Results and discussion
3.1. Surface concentration and vertical profile
Fig. 1 illustrates the annual mean near surface atmosphericconcentration of PHE, CHR and BaP, representing volatile, semi-volatile and non-volatile PAHs compounds, respectively. Due to therelatively short lifetime of PAH species, the spatial distribution ofPAH concentrations in the atmosphere is dominated largely by localemissions (Hafner et al., 2005). When prevailing westerly winds inthe middle and upper troposphere exist over north China, plumeswith high levels of PAHs from the Eastern part of China are swept tothe East China Sea, the Korean Peninsula, Japan, and further to thewestern Pacific Ocean. This implies a major eastward transportand outflow pathway. Because of fast degradation, dispersion anddeposition, the concentration of PAHs decreases rapidly away fromthe source regions. For example, BaP concentration is ∼1 ng m�3
near the north China seaboard, and subsequently decreases to∼0.1 ng m�3 atw1000 km away from the seaboard. Although northwinds are dominant near the surface during the wintertime inEastern China (Zhang, 1991), the meridional wind is much weakercompared to the zonal wind, and no distinct southward plumes canbe identified in Fig. 1.
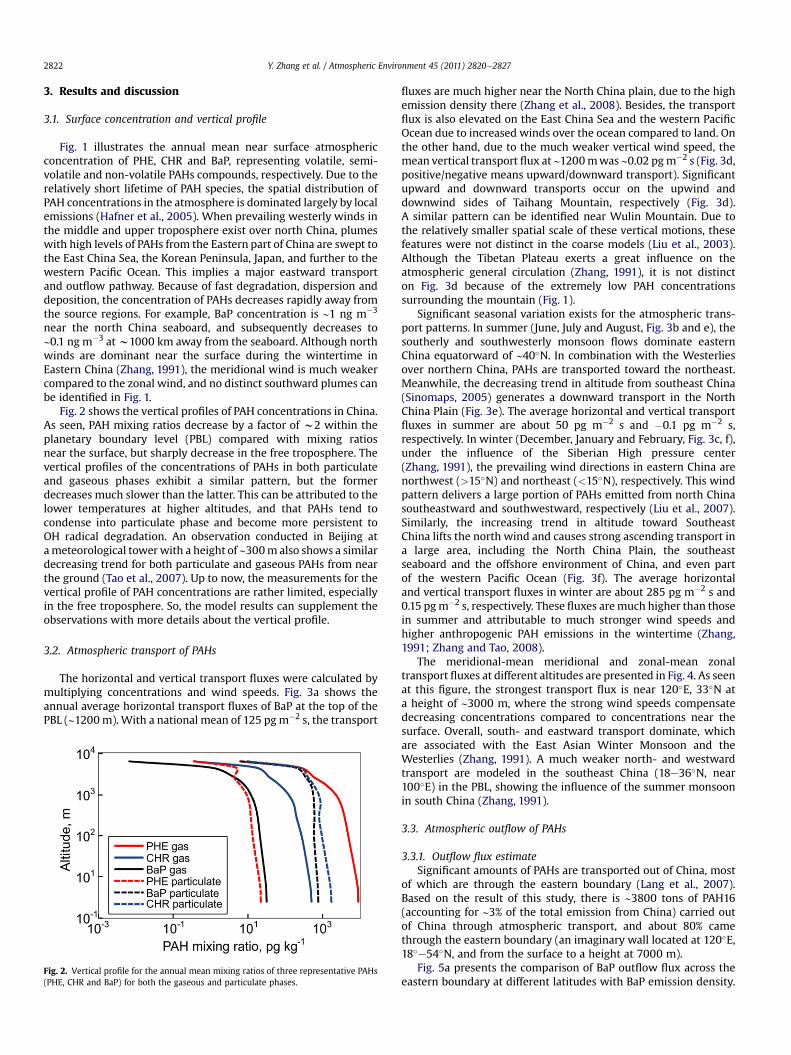
Fig. 2 shows the vertical profiles of PAH concentrations in China.As seen, PAH mixing ratios decrease by a factor of w2 within theplanetary boundary level (PBL) compared with mixing ratiosnear the surface, but sharply decrease in the free troposphere. Thevertical profiles of the concentrations of PAHs in both particulateand gaseous phases exhibit a similar pattern, but the formerdecreases much slower than the latter. This can be attributed to thelower temperatures at higher altitudes, and that PAHs tend tocondense into particulate phase and become more persistent toOH radical degradation. An observation conducted in Beijing atameteorological towerwith a height of ∼300m also shows a similardecreasing trend for both particulate and gaseous PAHs from nearthe ground (Tao et al., 2007). Up to now, the measurements for thevertical profile of PAH concentrations are rather limited, especiallyin the free troposphere. So, the model results can supplement theobservations with more details about the vertical profile.
3.2. Atmospheric transport of PAHs
The horizontal and vertical transport fluxes were calculated bymultiplying concentrations and wind speeds. Fig. 3a shows theannual average horizontal transport fluxes of BaP at the top of thePBL (∼1200m).With a national mean of 125 pgm�2 s, the transport
Fig. 2. Vertical profile for the annual mean mixing ratios of three representative PAHs(PHE, CHR and BaP) for both the gaseous and particulate phases.
fluxes are much higher near the North China plain, due to the highemission density there (Zhang et al., 2008). Besides, the transportflux is also elevated on the East China Sea and the western PacificOcean due to increased winds over the ocean compared to land. Onthe other hand, due to the much weaker vertical wind speed, themean vertical transport flux at ∼1200mwas ∼0.02 pgm�2 s (Fig. 3d,positive/negative means upward/downward transport). Significantupward and downward transports occur on the upwind anddownwind sides of Taihang Mountain, respectively (Fig. 3d).A similar pattern can be identified near Wulin Mountain. Due tothe relatively smaller spatial scale of these vertical motions, thesefeatures were not distinct in the coarse models (Liu et al., 2003).Although the Tibetan Plateau exerts a great influence on theatmospheric general circulation (Zhang, 1991), it is not distincton Fig. 3d because of the extremely low PAH concentrationssurrounding the mountain (Fig. 1).
Significant seasonal variation exists for the atmospheric trans-port patterns. In summer (June, July and August, Fig. 3b and e), thesoutherly and southwesterly monsoon flows dominate easternChina equatorward of ∼40�N. In combination with the Westerliesover northern China, PAHs are transported toward the northeast.Meanwhile, the decreasing trend in altitude from southeast China(Sinomaps, 2005) generates a downward transport in the NorthChina Plain (Fig. 3e). The average horizontal and vertical transportfluxes in summer are about 50 pg m�2 s and �0.1 pg m�2 s,respectively. In winter (December, January and February, Fig. 3c, f),under the influence of the Siberian High pressure center(Zhang, 1991), the prevailing wind directions in eastern China arenorthwest (>15�N) and northeast (<15�N), respectively. This windpattern delivers a large portion of PAHs emitted from north Chinasoutheastward and southwestward, respectively (Liu et al., 2007).Similarly, the increasing trend in altitude toward SoutheastChina lifts the north wind and causes strong ascending transport ina large area, including the North China Plain, the southeastseaboard and the offshore environment of China, and even partof the western Pacific Ocean (Fig. 3f). The average horizontaland vertical transport fluxes in winter are about 285 pg m�2 s and0.15 pgm�2 s, respectively. These fluxes aremuch higher than thosein summer and attributable to much stronger wind speeds andhigher anthropogenic PAH emissions in the wintertime (Zhang,1991; Zhang and Tao, 2008).
The meridional-mean meridional and zonal-mean zonaltransport fluxes at different altitudes are presented in Fig. 4. As seenat this figure, the strongest transport flux is near 120�E, 33�N ata height of ∼3000 m, where the strong wind speeds compensatedecreasing concentrations compared to concentrations near thesurface. Overall, south- and eastward transport dominate, whichare associated with the East Asian Winter Monsoon and theWesterlies (Zhang, 1991). A much weaker north- and westwardtransport are modeled in the southeast China (18e36�N, near100�E) in the PBL, showing the influence of the summer monsoonin south China (Zhang, 1991).
3.3. Atmospheric outflow of PAHs
3.3.1. Outflow flux estimateSignificant amounts of PAHs are transported out of China, most
of which are through the eastern boundary (Lang et al., 2007).Based on the result of this study, there is ∼3800 tons of PAH16(accounting for ∼3% of the total emission from China) carried outof China through atmospheric transport, and about 80% camethrough the eastern boundary (an imaginary wall located at 120�E,18�e54�N, and from the surface to a height at 7000 m).
Fig. 5a presents the comparison of BaP outflow flux across theeastern boundary at different latitudes with BaP emission density.

Fig. 3. Average horizontal (aec) and vertical (def) transport fluxes for BaP in summer (June, July and August, b and e) and winter (December, January and February, c and f), and thetotal year (a, d). For the vertical transport flux, positive (negative) values mean upward (downward) transports.
Y. Zhang et al. / Atmospheric Environment 45 (2011) 2820e2827 2823
The peaks of the emission density are located at about 39�N and26�N, near Shanxi and Guizhou. These provinces have intensivesmall-scale coke productions. Elevated emission density also existsbetween 31�N and 40�N, indicating two high emission densityregions in the North China Plain as well as the Sichuan Basin andthe Chongqing metropolitan area (Zhang et al., 2008). The total BaPoutflow flux in this section is w290 t yr�1 with two peaks near30�N. The flux decreases toward the north and south borders ofChina. Generally, the outflow flux greatly concentrates at 27e40�N,and the outflow in this latitudinal band contributes to more than80% of the total outflow flux in China. This suggests the bestsampling locations for capturing the outflow plume of PAHs fromChina, where intensive measurements, especially aircraft observa-tions in the free atmosphere, are extremely helpful to quantify theoutflow flux.
It is necessary to mention that this estimate is based on a singleyear (2003) study which was subjected to significant interannual
variability. Liu et al. (2003) found that the frequency of cold surgesacross China associated with the Southern Oscillation Index is thekey factor influencing the interannual variability of outflow of COfrom East Asia. The outflow was enhanced during La Niña episodeswhile depressed over El Niño episodes. Liang et al. (2005) proposedthat the Asian outflow corresponds to the average sea levelpressure over Northeast Asia, which is associated with cyclogenesisin East Asia. Besides, the continuous weakening of the EastAsian winter monsoon since the late 1980s also contributes to theinterannual variability (Nakamura and Izumi, 2002). However, thebasic flow pattern and outflow mechanism stay more or lessunchanged.
In a previous study, we have estimated an uncertainty of roughlya factor of 2 for the near surface concentration by considering theuncertainties of emission density, OH radical and aerosol surfacearea concentration and dry deposition velocity (Zhang et al., 2009).This uncertainty is also applicable to the outflow flux in this study.

Fig. 4. The annual meridional-mean meridional (a) and zonal-mean zonal (b) transport flux for BaP at different altitudes. Red colors denote east- and southward transport, bluecolors denote west- and northward transport, and white color denotes nearly zero transport flux. (For interpretation of the references to colour in this figure legend, the reader isreferred to the web version of this article.)
Y. Zhang et al. / Atmospheric Environment 45 (2011) 2820e28272824
Moreover, the lack of experimental results and the simplification ofseveral key processes for PAH transport and fate also contribute tothe overall uncertainty of outflow flux estimate. Based on theparameterization of Lammel et al. (2009), the removal of PAHs byOHradical in daytime contribute about 70%, 20% and 40% for ANT, FLTand BaP, respectively, to the total degradation. The neglecting of NO3and O3 degradation in this study caused an overestimate of thelifetime of PAHs and thus outflow flux, especially during the night-time. Another important source of uncertainty is the gas/particlepartition of PAHs. The model calculated the spatial distribution ofseasonal mean particulate phase fraction for three representativePAHs (PHE, CHR and BaP) which are provided in the SupportingInformation. In this study, we employed the parameterization byPankow (1987), which predicts a significantly lower particle-boundfraction of semi-volatile PAHs rather than taking into account boththe adsorption onto black carbon (BC) and absorption into organicmatters (OM) (Lammel et al., 2009). Although these model settingsgave reasonable results overall in comparison with observations(Zhang et al., 2009), the neglecting of high-affinity BC and OM to thegas/particle partition predicts a shorter residence time of PAHs inthe atmosphere due to the overestimation of the gaseous fractionexposure to fast chemical degradation (Lammel et al., 2009). Thisthus indicates an underestimation of the outflow flux of PAHs in thisstudy, and the adsorption onto BC and absorption into OM should be
Fig. 5. The variation of outflow flux for BaP; a) the outflow flux at different latitudes compa120�E, 130�E and 140�E, respectively. The concentration information in the lower portion ofsouth of 35�N, respectively) in d are outside of the model domain, however the center of t
included in future studies. As the mechanism of gas/particle parti-tioning of PAHs is still not well understood and open to discussion(Lohmann and Lammel, 2004), more experimental studies and fieldobservations, especially focusing on the association between thepartition dynamics and the characteristics of the aerosols, includingsize, chemistry composition, aging, etc. are required to give morereasonable parameterizations of this process.
3.3.2. Outflow from different regions of ChinaDue to the great variance of emission density as well as meteo-
rological and climatological conditions, the transport and outflow ofPAHs from different regions of China are quite different and wereevaluated by a tagged emission approach. The PAH emissions fromChina were tagged to different tracers based on the geographiclocation, emission density and topographic conditions (R1e8, shownin Fig. 6a). Fig. 6 also illustrates the transport and outflow patterns ofthe PAHs emitted by different regions of China. Although the abso-lute outflow flux has great uncertainty, the transport patterns andthe relative contributions from different regions are more accurate.
On an annual basis, R4, R2, R5, R3, R6 and R1 contributed about33%, 32%, 10%, 6.8%, 5.1% and 4.2% to the total outflow of BaP fromChina, respectively, while the rest of the source regions onlycontributed about 7.6% to the total outflow flux. The BaP in R2(mainly including the North China Plain) is transported eastward
red with that of emission density; b, c, and d) the zonal transport flux cross sections atc (south of ∼25�N) and upper and lower portions (gray shaded area, north of 47�N andhe outflow plume was captured.

Fig. 6. Transport and outflow pathways of the sum of the gaseous and particulate phase BaP from different regions of China, (a) the tagged emission regions, (bef) transportpathways of BaP emitted from R2e6, respectively.
Y. Zhang et al. / Atmospheric Environment 45 (2011) 2820e2827 2825
directly to thewestern Pacific. However, frequent occurrences of coldsurges from Siberia and Mongolia during the winter season pusha large portion of BaP southward up to 30�N and lift the chemicals toa higher atmospheric level where they are subsequently deliveredby stronger westerly winds to the west Pacific. Liu et al. (2007) hasextensively investigated the transport pathways of PAHs in thisregion by a forward trajectory clustering approach without consid-ering the removal processes during transport, and divided thetrajectories into three groups. The transport occurred mainly in twomodes: zonal andmeridional, which correspond to the eastward andthe southward transport, respectively. Although only qualitative, theanalysis by Liu et al. (2007) helps to explain the peak of outflow thatappears at about 30�N,where the emission density is not the highestin China. A similar situation takes place in R4 (mainly includingthe Shanxi province and surrounding areas), although this region isfarther from the eastern boundary, strong zonal winds at the lowertroposphere associated with southward penetration of the polarfront during the wintertime carry a large quantity of PAHs out ofChina. In this case, the outflow flux was almost evenly distributedbetween 30� and 40�N. As the PAH emission from Shanxi province isdominated by small-scale coke production (Zhang et al., 2008), theemission control over this industry could not only benefit the local
environment (Zhang et al., 2009), but alsomitigate the outflowfluxofPAHs from China.
Different from the south- and east- ward transport in northernChina, a northward transport occurs in south China on an annualbasis (R3, R5 and R6). Although located south of 30�N, the BaPemitted from R3 was transported north of 30�N in the PBL andflowed toward the western Pacific thereafter. Strong transport andoutflow fluxes are found north of 30�N. Lang et al. (2007) also foundthat the PAHs emitted from Guangdong (in R3 in this study) areprimarily transported northward in summer and southward inwinter. Approximate symmetrical dispersion plumes were foundnorth and south of Guangdong on an annual mean map. For R5 andR6 (including the entire Yunnan province and part of the Sichuanand the Guizhou provinces), although there are large emissiondensities and strong atmospheric transport near the source region,the outflow flux is generally smaller than R2 and R4 due to thesignificant distance between R5 and R6 and the boundary of China.
3.3.3. Transport of PAHs in the western PacificFig. 5bed illustrate the vertical structure of the outflow plume by
a series of latitudeealtitude cross sections at 120�E,130�E and 140�E,respectively. As seen in this figure, the outflow is strongest at about

Y. Zhang et al. / Atmospheric Environment 45 (2011) 2820e28272826
27�e36�N from the surface to ∼3500 m at 120�E. The high transportflux near the surface shows that transport in the PBL during the coldseason is an important outflow pathway near source regions, espe-cially poleward of 30�N. Moreover, there is also significant outflowin the mid-upper troposphere, and the high outflow flux band canextend to a height of ∼7000 m. The largest outflow flux appears atthe top of PBL at about 30�N. This implies large-scale ascendingmotion and convection near the southeast China seaboard inwinteras another important transport pathway for the outflow of BaPfrom China (Fig. 3f). During the journey of the BaP plume induced byChina emission to the east, the center of the plume turns northwardover the region bounded by 36�Ne40�N and 130�Ee140�E, respec-tively (Fig. 5bed). Meanwhile, the plume climbs to an altitude of∼3500 m and ∼5000 m over this region. This is largely because thenorthward moving warm air climbs over the cold West Siberia air,and it is expected that this forced large-scale ascending motionwould lift the chemical to higher altitudes where the jet streamwould transport BaP across the Pacific Ocean in a period of severaldays (Wallace and Hobbs, 2005; Zhang et al., 2010).
3.3.4. Seasonal variation of outflow fluxFig. 7 presents the seasonal variationof BaPoutflow from themajor
source regions (R2e6) of China. Generally, the outflow fluxes aremuch larger in winter and spring than in summer and autumn.The magnitude of outflow flux varies 5e6 fold between a peak of40 tmonth�1 in December and aminimumof less than 7 tmonth�1 inJune. Given 1e2 fold seasonal variation of the BaP emission flux(Zhang and Tao, 2008), the meteorological conditions are likely tocontribute to the remaining 3e4 fold of variation. The episodicoutbreak of cold surges in winter and spring that leads to the south-ward and eastward transport and penetration into the South ChinaSea is believed to be the controlling factor for the modeled seasonalvariability for BaP outflow (Liu et al., 2003). As seen in Fig. 7, thismechanism is of particular importance for the sources located in northChina (e.g. R2 and R4), the outflow fluxes peak during November toApril, when the outbreak of cold surges is most frequent (Zhang et al.,1997). In addition, small peaks also exist in July for R2, R3 and R6,where the summermonsoon delivers BaP poleward of ∼30�N and thePAHs are transported out of the country by the Westerlies.
4. Conclusions
The spatial distributions of PAH concentration levels in atmo-sphere are greatly controlled by emission and meteorologicalconditions. Elevated concentration levels are modeled in Shanxi,
0.0
0.1
0.2
0.3
0.4
0.5
0.6
J F M A M J J A S O N D
R2R3R4R5R6
Mon
thly
ave
rage
out
flow
flux
, Mg/
d
Fig. 7. The seasonal variation of the total BaP outflow from selected source regions inChina in 2003.
Guizhou, North China Plain, Sichuan Basin as well as the Chongqingmetropolitan area for the high emission density. High concentra-tions are also modeled at near the China seaboard and the westernPacific Ocean. The model also predicts a slightly decreasing verticalprofile in the planetary boundary layer (less than ∼1 km), but theconcentrations decrease ∼2 orders of magnitude in the freeatmosphere compared with the level near the surface.
The strongest atmospheric transport of PAHs occurs near theNorthChina Plain and the adjacent areas of the East China Sea and westernPacific Ocean. The Westerlies as well as the East Asian Monsoon andlocal topographical forcing are also identified as key factors influ-encing the transport pattern of PAHs in China. Mean meridional andzonal transport flux indicate that the strongest transport occursat near 120�E, 33�N at a height of about 3000 m. With stronger windspeeds and anthropogenic emissions, the transport flux is largelyenhanced in the wintertime.
About 3800 tons of PAH16 were transported out of China in2003 through atmospheric pathways with about 80% transportedthrough the eastern boundary of China. The outflow concentratesnear 30�N, causing a slight discrepancy from the position ofemission density peaks. The outflow flux density is highest ata height of ∼1 km at 120�E, and keeps climbing to 3.5 km and 5 kmat 130�E and 140�E, respectively. A seasonal variation of 5e6 fold isalso found for the outflow flux of PAHs in China with greatlyelevated transport fluxes in spring and winter.
Acknowledgements
The funding for this studywas provided by the National ScientificFoundation of China (40710019001, 40730737), National BasicResearch Program (2007CB407303) and the Ministry of Environ-mental Protection (200809101). The authors gratefully acknowledgeMaria Zatko of the University of Washington for polishing theEnglish of the manuscript.
Appendix. Supplementary material
Supplementary data related to this article can be found online atdoi:10.1016/j.atmosenv.2011.03.006.
References
Estève, W., Budzinski, H., Villenave, E., 2006. Relative rate constants for theheterogeneous reactions of NO2 and OH radicals with polycyclic aromatichydrocarbons adsorbed on carbonaceous particles. Part 2: PAHs adsorbed ondiesel particulate exhaust SRM 1650a. Atmospheric Environment 40, 201e211.
Hafner, W.D., Carlson, D.L., Hites, R.A., 2005. Influence of local human population onatmospheric polycyclic aromatic hydrocarbon concentrations. EnvironmentalScience & Technology 39, 7374e7379.
Killin, R.K., Simonich, S.L., Jaffe, D.A., DeForest, C.L., Wilson, G.R., 2004. Transpacificand regional atmospheric transport of anthropogenic semivolatile organiccompounds to Cheeka Peak Observatory during the spring of 2002. Journal ofGeophysical Research-Atmosphere 109 (D23). doi:10.1029/2003jd004386.
Lammel, G., Sehili, A.M., Bond, T.C., Feichter, J., Grassl, H., 2009. Gas/particlepartitioning and global distribution of polycyclic aromatic hydrocarbons ea modelling approach. Chemosphere 76, 98e106.
Lang, C., Tao, S., Zhang, G., Fu, J., Simonich, S., 2007. Outflow of polycyclic aromatichydrocarbons from Guangdong, Southern China. Environmental Science &Technology 41, 8370e8375.
Lang, C., Tao, S., Liu, W., Zhang, Y., Simonich, S., 2008. Atmospheric transport andoutflow of polycyclic aromatic hydrocarbons from China. EnvironmentalScience & Technology 42, 5196e5201.
Lee, J.Y., Kim, Y.P., Kang, C.H., Ghim, Y.S., Kaneyasu, N., 2006. Temporal trend andlong-range transport of particulate polycyclic aromatic hydrocarbons at Gosanin northeast Asia between 2001 and 2004. Journal of Geophysical Research-Atmosphere 111 (D11303). doi:10.1029/2005JD00653711.
Liang, Q., Jaegle, L., Jaffe, D.A., Weiss-Penzias, P., Heckman, A., Snow, J.A., 2004. Long-range transport of Asian pollution to the northeast Pacific: seasonal variationsand transport pathways of carbon monoxide. Journal of Geophysical Research109 (D23S07). doi:10.1029/2003jd004402.

Y. Zhang et al. / Atmospheric Environment 45 (2011) 2820e2827 2827
Liang, Q., Jaegle, L., Wallace, J.M., 2005. Meteorological indices for Asian outflow andtranspacific transport on daily to interannual timescales. Journal of GeophysicalResearch-Atmosphere 110 (D18308). doi:10.1029/2005jd005788.
Liu, H., Jacob, D.J., Bey, I., Yantosca, R.M., Duncan, B.N., Sachse, G.W., 2003. Transportpathways for Asian pollution outflow over the Pacific: interannual and seasonalvariations. Journal of Geophysical Research-Atmosphere 108 (D20). doi:10.1029/2002JD003102.
Liu, S., Tao, S., Liu, W., Liu, Y., Dou, H., Zhao, J., Wang, L., Wang, J., Tian, Z., Gao, Y.,2007. Atmospheric polycyclic aromatic hydrocarbons in north China: a winter-time study. Environmental Science & Technology 41, 8256e8261.
Lohmann, R., Lammel, G., 2004. Adsorptive and absorptive contributions to the gasparticle partitioning of polycyclic aromatic hydrocarbons: state of knowledgeand recommended parameterization for modelling. Environmental Science &Technology 38, 3793e3803.
Ma, J., Daggupaty, S., Harner, T., Li, Y., 2003. Impacts of lindane usage in theCanadian prairies on the Great Lakes ecosystem. 1. Coupled atmospherictransport model and modeled concentrations in air and soil. EnvironmentalScience & Technology 37, 3774e3781.
Matthias, V., Aulinger, A., Quarte, M., 2009. CMAQ simulations of the benzo(a)pyr-ene distribution over Europe for 2000 and 2001. Atmospheric Environment 43,4078e4086.
Nakamura, H., Izumi, T., 2002. Interannual and decadal modulations recentlyobserved in the Pacific storm-track activity and East Asian winter monsoon.Journal of Climate 15, 1855e1874.
Nisbet, I.C.T., Lagoy, P.K., 1992. Toxic equivalency factors (TEFs) for polycyclicaromatic-hydrocarbons (PAH). Regulatory Toxicology and Pharmacology 16,290e300.
Pankow, J.F., 1987. Review and comparative analysis of the theories on partitioningbetween the gas and aerosol particulate phases in the atmosphere. Atmo-spheric Environment 21, 2275e2283.
Prevedouros, K., Palm-Cousins, A., Gustafsson, O., Cousins, I.T., 2008. Developmentof a black carbon-inclusive multi-media model: application for PAHs in Stock-holm. Chemosphere 70, 607e615.
Primbs, T., Simonich, S., Schmedding, D., Wilson, G., Jaffe, D., Takami, A., Kato, S.,Hatakeyama, S., Kajii, Y., 2007. Atmospheric outflowof anthropogenic semivolatile
organic compounds from East Asia in spring 2004. Environmental Science &Technology 41, 3551e3558.
Sehili, A.M., Lammel, G., 2007. Global fate and distribution of polycyclic aromatichydrocarbons emitted from Europe and Russia. Atmospheric Environment 41,8301e8315.
Sinomaps, 2005. Atlas of Physical Geography of China. Sinomaps Press, Beijing.Tamamura, S., Sato,T.,Ota,Y.,Wang,X., Tang,N.,Hayakawa,K.,2007. Long-range transport
of polycyclic aromatic hydrocarbons (PAHs) from the eastern Asian continent toKanazawa, Japanwith Asian dust. Atmospheric Environment 41, 2580e2593.
Tao, S., Wang, Y., Wu, S., Liu, S., Dou, H., Liu, Y., Lang, C., Hu, F., Xing, B., 2007. Verticaldistribution of polycyclic aromatic hydrocarbons in atmospheric boundary layerof Beijing in winter. Atmospheric Environment 41, 9594e9602.
Wallace, M.J., Hobbs, P.V., 2005. Atmospheric Science: an Introductory Survey,second ed. Elsevier, Burlington.
Yang, X., Okada, Y., Tang, N., Matsunaga, S., Tamura, K., Lin, J., Kameda, T., Toriba, A.,Hayakawa, K., 2007. Long-range transport of polycyclic aromatic hydrocarbonsfrom China to Japan. Atmospheric Environment 41, 2710e2718.
Zhang, J., 1991. China Climate. China Meteorological Press, Beijing.Zhang, Y., Sperber, K.R., Boyle, J.S., 1997. Climatology and interannual variation
of the East Asian winter monsoon: results from the 1979e95 NCEP/NCARreanalysis. Monthly Weather Review 125, 2605e2619.
Zhang, Y., Tao, S., 2008. Seasonal variation of polycyclic aromatic hydrocarbons(PAH) emissions in China. Environmental Pollution 156, 657e663.
Zhang, Y., Tao, S., 2009. Global atmospheric emission inventory of polycyclic aromatichydrocarbons (PAHs) for 2004. Atmospheric Environment 43, 812e819.
Zhang, Y., Dou, H., Chang, B., Wei, Z., Qiu, W., Liu, S., Liu, W., Tao, S., 2008. Emission ofpolycyclic aromatic hydrocarbons from indoor straw burning and emission inven-tory updating in China. Annals of the NewYork Academy of Sciences 1140, 218e227.
Zhang, Y., Tao, S., Shen, H., Ma, J., 2009. Inhalation exposure to ambient polycyclicaromatic hydrocarbons and lung cancer risk of Chinese population. Proceedings ofNational Academy of Sciences of the United States of America 106, 21063e21067.
Zhang, L., Ma, J., Tian, C., Li, Y., 2010. Atmospheric transport of persistent semi-volatileorganic chemicals to the Arctic and cold condensation at the mid-troposphere epart 2: 3-D modeling of episodic atmospheric transport. Atmospheric Chemistryand Physics 10, 7315e7324.