modeling soil moisture processes and recharge under …tenaya.ucsd.edu/~dettinge/flint08.pdf ·...
TRANSCRIPT

www.vadosezonejournal.org · Vol. 7, No. 1, February 2008 350
Infi ltration of water into bedrock in mountainous terrain rep-
resents a signifi cant portion of recharge in the western United
States, especially under conditions of a melting snowpack (Wilson
and Guan, 2004; Flint et al., 2004). Under anticipated increases
in air temperature associated with global warming, snowmelt pro-
cesses and the associated runoff in the Sierra Nevada Mountains
are likely to occur earlier in the springtime (Dettinger et al., 2004),
with uncertain implications regarding recharge. Developing a
better understanding of the processes contributing to moun-
tain block recharge under these conditions is deemed prudent
(Earman et al., 2006).
The conceptual model of infiltration into bedrock was
described by Flint et al. (2004) as resulting from water perco-
lating through a shallow soil column at a rate exceeding that
of the underlying bedrock permeability, ponding at the bedrock
interface, and penetrating the bedrock at a rate equivalent to
the permeability of the fractured bedrock. Use of a basin-scale
water-balance model (Flint et al., 2004) that accounts for melting
snow, the physical characteristics of a location dominated by the
granitic bedrock present throughout much of the Sierra Nevada,
and shallow soils generally results in calculations indicating a
higher potential for runoff than in-place recharge into the bed-
rock (Flint et al., 2004). Th is process is strongly controlled by the
bulk bedrock permeability, the nature of the matrix and fracture
properties refl ected in the bedrock moisture retention charac-
teristics, and the rate of snowmelt. Th e contribution of bedrock
infi ltration was shown in a small headwater catchment by Kosugi
et al. (2006), who illustrated that saturated fl ow from overlying
soil into weathered granite was the dominant hydrologic process
at the soil–bedrock interface. Th is study supports the conceptual
model of Flint et al. (2004) that regards the soil thickness as one
of the most important infl uences on the relative proportion of
bedrock infi ltration and saturated lateral fl ow.
Catchment-scale analyses of water budget have been used
to estimate rates of bedrock infi ltration (Terajima et al., 1993;
Anderson et al., 1997). However, few local-scale fi eld measure-
ments of all of the various processes have been made that allow
for estimation of the bulk bedrock permeability (combination
of matric and fracture permeability) and when accompanied
by detailed numerical investigations, provide a means to glean
additional understanding of how the processes of snowmelt, soil
moisture fl ow, ponding, bedrock fl ow, and redistribution operate
in this complex system.
The USGS, working with the Scripps Institution of
Oceanography and the California Cooperative Snow Surveys,
has established a research fi eld site located in Yosemite National
Modeling Soil Moisture Processes and Recharge under a Melting SnowpackAlan L. Flint,* Lorraine E. Flint, and Michael D. Dettinger
U.S. Geological Survey, 6000 J St., Sacramento, CA, 95819-6129. Received 15 Sept. 2006. *Corresponding author (afl [email protected]).
Vadose Zone J. 7:350–357doi:10.2136/vzj2006.0135
© Soil Science Society of America677 S. Segoe Rd. Madison, WI 53711 USA.All rights reserved. No part of this periodical may be reproduced or transmitted in any form or by any means, electronic or mechanical, including photocopying, recording, or any information storage and retrieval system, without permission in writing from the publisher.
ABBREVIATIONS: HDP, heat dissipation probe; TDR, time domain refl ectometry.
OPE
CIA
L SEC
TIO
N: T
OU
GH
2
Recharge into granitic bedrock under a melting snowpack is being investigated as part of a study designed to understand
hydrologic processes involving snow at Yosemite National Park in the Sierra Nevada Mountains of California. Snowpack mea-
surements, accompanied by water content and matric potential measurements of the soil under the snowpack, allowed for esti-
mates of infi ltration into the soil during snowmelt and percolation into the bedrock. During portions of the snowmelt period,
infi ltration rates into the soil exceeded the permeability of the bedrock and caused ponding to be sustained at the soil–bedrock
interface. During a 5-d period with little measured snowmelt, drainage of the ponded water into the underlying fractured gra-
nitic bedrock was estimated to be 1.6 cm d−1, which is used as an estimate of bedrock permeability. Th e numerical simulator
TOUGH2 was used to reproduce the fi eld data and evaluate the potential for vertical fl ow into the fractured bedrock or lateral
fl ow at the bedrock–soil interface. During most of the snowmelt season, the snowmelt rates were near or below the bedrock
permeability. Th e fi eld data and model results support the notion that snowmelt on the shallow soil overlying low permeability
bedrock becomes direct infi ltration unless the snowmelt rate greatly exceeds the bedrock permeability. Late in the season, melt
rates are double that of the bedrock permeability (although only for a few days) and may tend to move laterally at the soil–bed-
rock interface downgradient and contribute directly to streamfl ow.

www.vadosezonejournal.org · Vol. 7, No. 1, February 2008 351
Park at a California Department of Water Resources snow-instru-
mented station on the western boundary of the park at Gin Flat
to study soil moisture processes under the accumulation and
melting of snow (Fig. 1). Th is research is part of the California
Energy Commission’s Climate Change Center’s research program
to understand how climate change will infl uence California’s
future economic, social, and natural systems.
The established field site hosts a variety of instruments
to measure turbulent heat and vapor fl uxes, soil moisture and
temperature, and snowpack temperatures. Specifi cally, the soil
measurements of matric potential, water content, and tempera-
ture are used to develop conceptual models of the interaction
between the soil and snowpack. Th e measurements are accom-
panied by calculations of snowmelt, on the basis of snow pillow
measurements, to provide properties and boundary conditions
for a numerical model to elucidate the relative importance of the
processes and to test hypotheses regarding soil moisture drainage
and bedrock infi ltration. Overall, the study will help develop
an understanding of the water balance between the atmosphere,
snowpack, soil moisture, drainage, recharge, and runoff .
MethodsMeasurements
For the purposes of investigating the processes occurring in
the snowpack, instruments were installed to measure the tem-
perature and volume of the snow, as well as all of the associated
meteorological components (e.g., solar radiation, net radiation,
evapotranspiration, sublimation). An array of temperature loggers
(?0.25°C resolution) were suspended approximately every 15 cm
from 3 to 248 cm above the soil surface with one temperature
logger buried −12 cm below the surface. Acoustic vertical-dis-
tance sensors operated by University of California at Merced
provided snow thickness data (Bob Rice, personal communica-
tion, 2004). Adjacent to (within 10 m) the aboveground snow
instruments, soil instrumentation was installed in the 76-cm deep,
loamy sand, overlying fractured granite (Fig. 2). Measurements
were made at 4-h intervals from the fall of 2002 to March 2004,
then changed to hourly intervals until the fall of 2004, and are
used to illustrate the subsurface processes associated with the
2004 springtime snowmelt.
A series of time domain refl ectometry (TDR; Model CS
615 and 616, Campbell Scientifi c, Inc., Logan, UT) probes were
installed at 10, 36, and 72 cm below the surface to measure
soil water content. Alongside the TDR probes were heat dissipa-
tion probes (HDPs) calibrated to an extended range (Flint et al.,
2002) that measure soil matric potential and soil temperature
(Fig. 2). During instrument installation, bulk soil samples and
soil cores were taken for measurements of physical and hydrologic
properties. Laboratory measurements of bulk density (using core
method; Grossman and Reinsch, 2002), particle density (using
helium pycnometry; Flint and Flint, 2002a), porosity (calculated
from bulk density and particle density; Flint and Flint, 2002b),
and moisture retention characteristics (using pressure pots; Dane
and Hopmans, 2002) were conducted. Th ermal conductivity and
heat capacity were measured on soil samples in the laboratory
using the dual-probe heat pulse method (Kluitenberg, 2002).
Model Development
Using the numerical simulator TOUGH2 (Pruess et al.,
1999), a two-dimensional model was developed using measured
soil properties with three soil layers, 25, 30, and 20 cm thick
(Table 1), and one bedrock layer (25 cm thick). Th e upper bound-
TABLE 1. Results of laboratory measurements on soil samples.
Layer 1 Layer 2 Layer 3
Hydrologic propertiesDepth (cm) 25 30 20Bulk density (g cm−3) 1.52 1.53 1.39Porosity (cm3 cm−3) 0.436 0.433 0.486Grain density (g cm−3) 2.7 2.7 2.7Gravel (% of total soil) 16 22 24Organic matter (% of total soil) 7 5 5Sand (% of fi nes) 85 86 88Silt (% of fi nes) 10 8 8Clay (% of fi nes) 5 6 4van Genuchten alpha (1 Pa−1) 1.37E-04 1.05E-04 2.43E-04van Genuchten m 0.3038 0.3136 0.3162
Thermal propertiesThermal conductivity (W m−1 K−1; soil
VWC = 0.10 cm3 cm−3) 1.17 1.17 1.17Specifi c heat (kJ kg−1 K−1) 1.15 1.15 1.15
FIG. 1. Map of study location in Yosemite National Park, central Sierra Nevada Mountains.
FIG. 2. Time domain refl ectometry (TDR) and heat dissipation probes (HDP) at three depths in shallow soil above granitic bedrock.

www.vadosezonejournal.org · Vol. 7, No. 1, February 2008 352
ary condition consisted of a specifi c fl ux
identifi ed on the basis of the variable snow
melt and the lower boundary condition was
a specified matric potential to maintain
drainage below the bedrock layer. Water
moved from the soil into the bedrock layer
only when the soil above was nearly satu-
rated. Grids consisted of 5-cm-thick layers
with the model domain being 1 m deep × 10
m wide with a 5% topographic slope, esti-
mated on the basis of general site conditions,
to evaluate the potential for lateral fl ow at
the soil-bedrock interface. Two scenarios
were investigated with the two-dimensional
model: seasonal processes at three depths
for 3 mo during the snowmelt period, and
hourly melt and drain processes at the beginning of snowmelt.
Th e hourly timing of snow melt was not known but was assumed
to ramp up then down between 10:00 a.m. to 7:00 p.m. by
adding and subtracting increments of approximately 0.025% of
the total daily melt per hour. On each day of melt at 10:00 a.m.,
an initial fl ux of 0.05% was assigned, which was incremented at
11:00 a.m. to 0.075% so that by 2:00 p.m. it was 0.15% Th e
fl ux at 3:00 p.m. was also set to 0.15% which was then ramped
down until 7:00 p.m., which had a fl ux of 0.05% Snowmelt was
stopped after that until the next day, when the process was started
over again at 10:00 a.m. with a new total daily melt.
Th e only property that could be adjusted in a calibration
process to match simulated data with measured data was the
bulk bedrock permeability. Th is was changed iteratively until the
drainage profi le in the model matched the measured data.
Results and DiscussionLaboratory Measurements
Soil samples were measured to provide hydrologic and ther-
mal properties for each of the three soil layers (Table 1). Soil water
content measurements were made periodically to help develop
fi eld-specifi c calibration equations for the TDR probes; however,
site access problems (roads closed due to snow) only allowed
for measurements during relatively dry periods. An average soil
permeability of 400 cm d−1, estimated from textural properties
using Rosetta (Schaap et al., 2001), was used for the numerical
model. Rock properties were estimated from literature values and
modifi ed to match summer dry equilibrium conditions for the
soil with a porosity of 0.04 cm3 cm−3, grain density of 2.7 g cm−3,
van Genuchten alpha of 2.43E-4 (1 Pa−1), and van Genuchten m
of 0.3162. Bulk bedrock permeability was determined iteratively
using computer simulations.
Field Data
Snow persisted at the site from about 1 Nov. 2003 to early
May 2004. Snow accumulation and compaction can be seen to
persist until early March 2004. Snow accumulation occurred
during below-freezing snow events, with snow compaction (and
sublimation) occurring during above-freezing events (Fig. 3). Th e
cold air temperature from late December 2003 and intermittently
until mid-February kept the upper meter of the snowpack con-
siderably colder than the approximately 0°C in the bottom 25 cm
that persisted through the entire period. Around mid-February,
cloudy conditions and warm temperatures heated the snowpack
to near 0°C conditions, which is where most of it remained
until the melt was over in early May. Estimates of snowmelt and
input to the soil column were made from 14 March to 15 May
2004 (Fig. 4). Th e day-to-day changes in daily mean snow-water
content values at the Gin Flat snow pillow were computed (by
subtracting each day’s mean content from the mean content the
day before). On most days, this change was considered to be
the infi ltration rate. On the few spring days when precipitation
was recorded at Gin Flat and the Hetch Hetchy manual gage,
if the snow water content at the snow pillow stayed the same
or declined, the precipitation value from the Gin Flat gage was
added to the snow-water content change to estimate the total
infi ltration rate for that day. On wet days when the snow-water
content at the snow pillow increased, the precipitation rate was
reduced by the gain in snow-water content, and the remainder
was assumed to infi ltrate.
Volumetric soil-water content is shown in Fig. 5 for three
depths. Water content was the highest for the 72-cm depth,
where it reached saturation under ponded conditions in early
April. Initial evaluation of the data suggested that the water
content at the 10-cm depth seemed low but could possibly be
explained as a soil under steady-state conditions with melting
FIG. 3. Half-hourly snow and air temperatures, and snow depths, during winter 2003–2004 at Gin Flat.
FIG. 4. Estimated daily changes in snow water content, daily inputs to soil column, and bedrock permeability at Gin Flat.

www.vadosezonejournal.org · Vol. 7, No. 1, February 2008 353
snow (water content becomes constant under steady-state gravity
drainage). Numerical modeling suggests possible measurement
errors, which are discussed later. At the maximum water content,
after snowmelt in April, the soil profi le contained more than 28
cm of water; in September, at the minimum water content, the
soil profi le contained about 4 cm of water (Fig. 6).
Hourly soil moisture measurements for 6 wk in April and
May (Fig. 7a) illustrate daily fl uctuations that resulted from
nightly freezing of the snowpack and subsequent daytime snow-
melt. Th e snowpack temperatures show the alternating melt and
freeze as red and white bands of temperature over the snowmelt
period (Fig. 3). Th e soil drained continuously as long as water
was available, regardless of snow processes, but soil-water content
fl uctuated according to the drainage of snowmelt water in the
soil each day.
Diurnal changes in water content of the soil profi le resulted
from infi ltration into the soil and can be seen in all three instru-
mented layers. Snowmelt was initiated around 14 March (Fig. 3
and Fig. 4) but at a rate lower than the estimated permeability
of the bedrock (Fig. 4). As the snow started and stopped melting
diurnally, small pulses of water increased the water content at 10
and 36 cm, and then decreased as the water drained away. Th e
72-cm depth shows similar patterns until it became saturated,
and even then there were small fl uctuations near saturation. Th e
sequence continued until a large cold front resulted in the dis-
continuation of diurnal melting between 18 and 23 April, which
added new snow to the snowpack (Fig. 3). Th is was followed by
an increase in temperature, and the diurnal melt started again.
Snow began melting again on 23 April, resulting in increased soil-
water content. Calculations indicated that approximately 3.5 cm
d−1 was draining into the 88-cm-deep soil, exceeding the perme-
ability of the bedrock and causing ponding at the soil–bedrock
interface (saturation at the 72-cm depth and near saturation at
the 36-cm depth until the second week of May). Divergence from
the estimated input to the soil column of 2.0 cm d−1 (Fig. 4) for
that period may be due to the heterogeneity of the melting of the
snowpack discussed earlier. Water was ponded and the soil was
saturated at the 72-cm depth beginning 7 April (Fig. 7b). Hourly
soil-water measurements indicate that melt water penetrated the
soil column in less than 2 h. Soil matric potential is shown for
the same three depths and supports the interpretation of satu-
rated conditions as the bottom two depths reached −0.001 MPa
(Fig. 6). Th e 36-cm depth likely had hysteretic conditions and
air entrapment resulting in less than full saturation (indicated by
the TDR data). Th is is noted by comparing Fig. 7a and 8 at the
36-cm depth between 6 March and 6 May 2004, which show
water potential at or near saturation (indicated by the HDP).
During April 18 to 23, which was a period of little snowmelt (0.3
cm d−1), calculations on the basis of the slope of the declining
water content between 18 and 23 April and between 5 and 16
May indicated that 1.6 cm d−1 (and up to 1.9 cm d−1) of water
infi ltrated into the saturated bedrock. Th e drainage that occurred
during that period can also be seen as a slight upward movement
from saturation at the 36- and 72-cm depth around 20 March
(Fig. 8). Calculations of changes in soil moisture indicated that
FIG. 5. Volumetric soil water content for June 2003 to September 2004 at three depths.
FIG. 6. Cumulative water content for entire soil profi le for June 2003 to September 2004.
FIG. 7. Detailed soil water content for springtime snowmelt for (a) the month of April 2004 and (b) for 4–9 Apr. 2004.
www.vadosezonejournal.org · Vol. 7, No. 1, February 2008 354
there was approximately 36 cm of soil water storage capacity and
approximately 28 cm of water stored at the maximum wetness
during the study period.
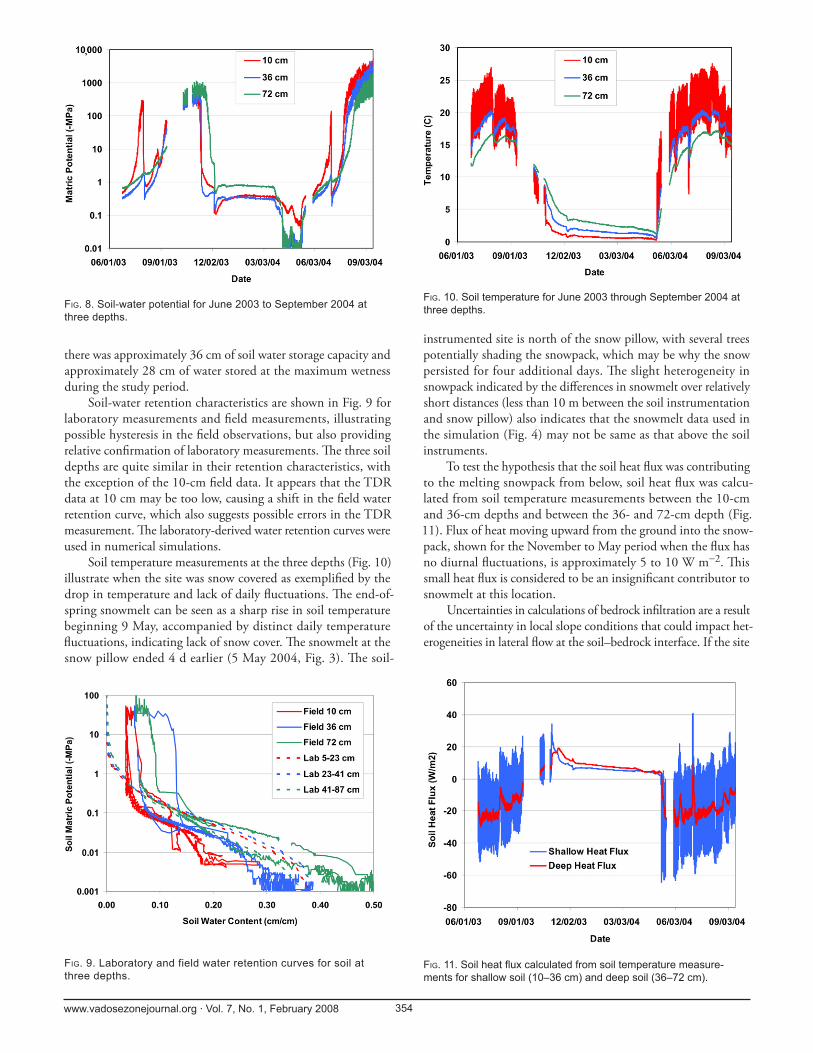
Soil-water retention characteristics are shown in Fig. 9 for
laboratory measurements and fi eld measurements, illustrating
possible hysteresis in the fi eld observations, but also providing
relative confi rmation of laboratory measurements. Th e three soil
depths are quite similar in their retention characteristics, with
the exception of the 10-cm fi eld data. It appears that the TDR
data at 10 cm may be too low, causing a shift in the fi eld water
retention curve, which also suggests possible errors in the TDR
measurement. Th e laboratory-derived water retention curves were
used in numerical simulations.
Soil temperature measurements at the three depths (Fig. 10)
illustrate when the site was snow covered as exemplifi ed by the
drop in temperature and lack of daily fl uctuations. Th e end-of-
spring snowmelt can be seen as a sharp rise in soil temperature
beginning 9 May, accompanied by distinct daily temperature
fl uctuations, indicating lack of snow cover. Th e snowmelt at the
snow pillow ended 4 d earlier (5 May 2004, Fig. 3). Th e soil-
instrumented site is north of the snow pillow, with several trees
potentially shading the snowpack, which may be why the snow
persisted for four additional days. Th e slight heterogeneity in
snowpack indicated by the diff erences in snowmelt over relatively
short distances (less than 10 m between the soil instrumentation
and snow pillow) also indicates that the snowmelt data used in
the simulation (Fig. 4) may not be same as that above the soil
instruments.
To test the hypothesis that the soil heat fl ux was contributing
to the melting snowpack from below, soil heat fl ux was calcu-
lated from soil temperature measurements between the 10-cm
and 36-cm depths and between the 36- and 72-cm depth (Fig.
11). Flux of heat moving upward from the ground into the snow-
pack, shown for the November to May period when the fl ux has
no diurnal fl uctuations, is approximately 5 to 10 W m−2. Th is
small heat fl ux is considered to be an insignifi cant contributor to
snowmelt at this location.
Uncertainties in calculations of bedrock infi ltration are a result
of the uncertainty in local slope conditions that could impact het-
erogeneities in lateral fl ow at the soil–bedrock interface. If the site
FIG. 9. Laboratory and field water retention curves for soil at three depths.
FIG. 11. Soil heat fl ux calculated from soil temperature measure-ments for shallow soil (10–36 cm) and deep soil (36–72 cm).
FIG. 8. Soil-water potential for June 2003 to September 2004 at three depths.
FIG. 10. Soil temperature for June 2003 through September 2004 at three depths.

www.vadosezonejournal.org · Vol. 7, No. 1, February 2008 355
had a slight but consistent slope, lateral fl ow would enter the mea-
surement domain at the same rate that it left, although increased
fl ow from the vertical direction would cause a rise in the perched
system. Th is would result in no net changes in water content at
the 72-cm depth and provide a more accurate estimate of bedrock
infi ltration, assuming enough upslope water availability.
Model Results
Simulations were made with the two-dimensional model for
a 3-mo period, 14 March through 14 May 2004, to simulate the
snowmelt period (Fig. 12). Th e model shows reasonable agree-
ment at the 72-cm depth but shows higher-than-measured water
contents at 10 and 36 cm. It should be noted that the measured
10-cm data in Fig. 12 is not the same as that in Fig. 5. Th e mea-
sured HDP data for the 10-cm depth were converted to water
content using the laboratory-measured water retention curve
to replace the assumed bad TDR data from that depth (other
instrument errors might cause the lack of fi t between the model
and measurements, but we do not have enough data to justify
making additional changes using the HDP data at this time). It
can be seen that model simulations mimic the melt and no melt
(refreezing conditions, and then continued melt for the three soil
layers for this period of time). Although there are mismatches
between the simulated and measured data, we believe the process
of ponding and draining at the bedrock interface is in reasonable
agreement with the fi eld data. When additional soil moisture
fi eld data becomes available in the spring 2007, we will rerun the
modeling eff ort using iTOUGH2 (Finsterle, 1999) to optimize
the soil and bedrock properties to see if better matches to the fi eld
data are possible. Because of the uncertainty in some of the soil
moisture measurements, we will remove the fi eld instruments to
perform recalibration tests. Based on the results of this analysis,
we will further revisit the model development, calibration, and
sensitivity analysis.
To better understand the melt–pond–drain process, hourly
simulation output was evaluated for 4 d at the beginning of
snowmelt, 5 to 8 Apr. 2004 (Fig. 13). Th e simulation does a
reasonable job of reproducing the diurnal signature of the melt–
pond–drain process; however, it does not attain full saturation at
72-cm until midday on 7 April, possibly due to the heterogeneity
of the snowmelt between the snow pillow and the instrumented
soil pit being 10 m away. Th is preliminary model result will be
further tested with more rigorous modeling when the fi eld data
from 2007 become available (battery failure caused loss of data
in 2005 and much of 2006, although some melt data from 2006
is now being analyzed).
One hypothesis tested was that lateral fl ow was contributing
to the drop in water content at the bedrock interface and that
no infi ltration into the bedrock was occurring. To test this hypo-
thesis, vertical columns were extracted from the results of the
two-dimensional model simulation with a 5% slope (illustrated in
Fig. 14). One assumption in this analysis was that the instruments
were on the “crest” of a local subsurface bedrock divide and that
all infi ltrating water was moving away from the instruments with
no infl ow from upgradient. Even under this assumption, there
is a small decrease in water content under the melting condition
that is far exceeded by the no-melt drainage seen on 20 April (Fig.
FIG. 12. Measured and simulated soil water content for 3 mo during springtime snowmelt for three soil layers.
FIG. 13. Measured and simulated soil water content for the 86-cm-deep soil for 5–8 Apr. 2003 during the initiation of the snowmelt sequence. FIG. 14. Results from a two-dimensional simulation with a 5% slope.

www.vadosezonejournal.org · Vol. 7, No. 1, February 2008 356
7a). Th is supports the contention that fi eld observations of local
slope were not this heterogeneous. Th e second scenario of lateral
fl ow away from the measurement site resulting in the decline in
the soil water content (interpreted as bedrock infi ltration) indi-
cates no such result. With only 3 m of upgradient contributing
area, the amount of infl ow equaled the amount of outfl ow along
the soil–bedrock interface. Field observations, including ground
penetrating radar measurements (data not presented) could not
identify a possible bedrock divide, which further supports the
hypothesis that infi ltration into the bedrock was occurring under
the snowpack at the instrumented site. A two-dimensional rep-
resentation of the model domain illustrating volumetric water
content results for the two-dimensional simulation is shown in
Fig. 15, including fl ux vectors indicating direction. Vertical fl ow
still dominates at the soil–bedrock contact; however, the no-fl ow
boundary condition at the downslope boundary is infl uencing
the fl ux direction from 7 to 10 m. Although the water content
continued to increase down gradient from the crest, only small
changes occurred in the fi rst meter (Fig. 14 and 15). It should
be noted that the model results shown in Fig. 12 and 13 were
taken from the vertical column 4 m downslope in the two-dimen-
sional model domain. From these results, it appears that when the
snowmelt rate is at or less than the bedrock permeability (which
is the case for most of the snowmelt season; Fig. 4), direct infi ltra-
tion into the bedrock can occur and little lateral fl ow exists. Th is
would suggest that snowmelt water that reaches the nearby stream
travels through the fractured granitic rock rather than overland
fl ow or subsurface lateral fl ow at the soil–bedrock contact.
SummarySoil moisture fi eld data were collected under a melting snow-
pack at Gin Flat in Yosemite National Park. A conceptual model
was developed that suggests that as the snow melts, it infi ltrates
into the soil and percolates vertically downward until it con-
tacts the soil–bedrock interface. Th e best estimate of the bedrock
permeability (infi ltration rate under ponded conditions) at Gin
Flat is 1.6 cm d−1. As long as the infi ltration from the melting
snowpack does not exceed this, little direct runoff or near-surface
underfl ow can be sustained (instead, the infi ltrating water drains
into deeper bedrock fractures and connections); once the infi l-
tration rate (at the surface) signifi cantly exceeds this rate, water
ponds at the bedrock surface and presumably can support near-
surface underfl ow toward local streams and meadows. As the
snowpack refreezes at night, the soil-water continues to drain
out of the soil profi le at the bedrock permeability rate until the
next morning when the snowpack again begins to melt, result-
ing in increases in soil-water content (the diurnal wetting and
draining cycle). Th is cycle continues until the snowpack is gone
(this assumes air temperatures cycle above and below freezing
during the day). If freezing temperatures were not obtained at
night then the snowpack would continue to melt and not cycle.
Th ere is the potential for some lateral fl ow to be occurring during
this time, but not as signifi cant as the vertical fl ow. Numerical
modeling supports this hypothesis and generally reproduces the
diurnal and seasonal signatures. Further data collection in 2007,
along with additional refi nement of the numerical model, will
be used to refi ne and support the conceptual model of snowmelt
and soil processes.
Future WorkTh e preliminary modeling analysis provides insights provok-
ing further fi eld eff orts and additional modeling analysis. Th e
results of the model are sensitive to the fracture properties of the
underlying bedrock and the timing and duration of snowmelt.
Additional analysis of snowpack measurements is required to better
defi ne the snowmelt and refreezing. Th is upper boundary condi-
tion is the least known and may require an independent numerical
model of snow accumulation, melt, and refreezing. In addition,
the hydrologic properties of the bedrock are not well defi ned, and
additional fi eld measurements or observations are needed to pro-
vide a better rationale for the properties used in the model. New
methods are being used in these remote locations to ensure bat-
tery power to the data loggers to provide more likely success in
collecting soil moisture data in 2007. As mentioned earlier, the
soil instruments will be removed, recalibrated, and reinstalled in
a new soil pit a short distance from the old soil pit.
ReferencesAnderson, S.P., W.E. Dietrich, D.R. Montgomery, R. Torres, M.E. Conrad, and
K. Loague. 1997. Subsurface fl ow paths in a steep, unchanneled catch-
ment. Water Resour. Res. 33:2637–2653.
Dane, J.H., and J.W. Hopmans. 2002. Pressure plate extractor. p. 688–690. In
J.H. Dane and G.C. Topp (ed.) Methods of soil analysis: Part 4. Physical
methods. SSSA Book Ser. 5. SSSA, Madison, WI.
Dettinger, M.D., D.R. Cayan, M.K. Meyer, and A.E. Jeton. 2004. Simulated
hydrologic responses to climate variations and change in the Merced, Car-
son, and American River basins, Sierra Nevada, California, 1900–2099.
Clim. Change 62:283–317.
Earman, S., A.P. Campbell, F.M. Phillips, and B.D. Newman. 2006. Isotopic
exchange between snow and atmospheric water vapor: Estimation of the
snowmelt component of greenwater recharge in the southwestern United
States. J. Geophys. Res. 111:D09302, doi:10.1029/2005JD006470.
Finsterle, S. 1999. iTOUGH2 user’s guide. LBNL-40040. Lawrence Berkeley
National Laboratory, Berkeley, CA.
Flint, A.L., G.S. Campbell, K.M. Ellett, and C. Calissendorff . 2002. Calibration
and temperature correction of heat dissipation matric potential sensors.
Soil Sci. Soc. Am. J. 66:1439–1445.
Flint, A.L., and L.E. Flint. 2002a. Particle density. p. 229–240. In J.H. Dane
and G.C. Topp (ed.) Methods of soil analysis: Part 4. Physical methods.
SSSA Book Ser. 5. SSSA, Madison, WI.
Flint, A.L., L.E. Flint, J.A. Hevesi, and J.M. Blainey. 2004. Fundamental con-
FIG. 15. Two-dimensional representation of two-dimensional simu-lation showing volumetric water content (VWC) and fl ux vector direction on 17 Apr. 2006 (horizontal to vertical was compressed 10:1; however, fl ux direction vectors remained 1:1).

www.vadosezonejournal.org · Vol. 7, No. 1, February 2008 357
cepts of recharge in the desert southwest: A regional modeling perspective.
p. 159–184. In J.F. Hogan, F.M. Phillips, and B.R. Scanlon (ed.) Ground-
water recharge in a desert environment: Th e southwestern United States.
Water Science and Applications Ser. Vol. 9. American Geophysical Union,
Washington, DC.
Flint, L.E., and A.L. Flint. 2002b. Porosity. p. 241–254. In J.H. Dane and G.C.
Topp (ed.) Methods of soil analysis: Part 4. Physical methods. SSSA Book
Ser. 5. SSSA, Madison, WI.
Grossman, R.B., and T.G. Reinsch. 2002. Bulk density and linear extensibility. p.
201–228. In J.H. Dane and G.C. Topp (ed.) Methods of soil analysis: Part
4. Physical methods. SSSA Book Ser. 5. SSSA, Madison, WI
Kluitenberg, G.J. 2002. Heat capacity and specifi c heat. p. 1201–1208. In J.H.
Dane and G.C. Topp (ed.) Methods of soil analysis: Part 4. Physical meth-
ods. SSSA Book Ser. 5. SSSA, Madison, WI
Kosugi, K., S. Katsura, M. Katsuyama, and T. Mizuyama. 2006. Water fl ow
processes in weathered granitic bedrock and their eff ects on runoff gen-
eration in a small headwater catchment. Water Resour. Res. 42:W02414,
doi:10.1029/2005WR004275.
Pruess, K., C. Oldenburg, and G. Moridis. 1999. TOUGH2 user’s guide, ver-
sion 2.0. LBNL-43134. Lawrence Berkeley National Laboratory, Berkeley,
CA.
Schaap, M.G., F.J. Leij, and M.Th . van Genuchten. 2001. Rosetta: A computer
program for estimating soil hydraulic parameters with hierarchical pedo-
transfer functions. J. Hydrol. 251:163–176.
Terajima, T., A. Mori, and H. Ishii. 1993. Comparative study of deep percola-
tion amount in two small catchments in granitic mountain. (In Japanese
with English abstract.). Jpn. J. Hydrol. Sci. 23(2):105–118.
Wilson, J.L., and H. Guan. 2004. Mountain-block hydrology and mountain-
front recharge. p. 113–137. In J.F. Hogan, F.M. Phillips, and B.R. Scanlon
(ed.) Groundwater recharge in a desert environment: Th e southwestern
United States. Water Science and Applications Ser. Vol. 9. American Geo-
physical Union, Washington, DC.