modeling retention at a large public university: can at-risk students be identified early enough
TRANSCRIPT
Modeling Retention at a Large Public University: CanAt-Risk Students Be Identified Early Enough to Treat?
Larry D. Singell • Glen R. Waddell
Received: 18 March 2009 / Published online: 2 February 2010� Springer Science+Business Media, LLC 2010
Abstract We examine the extent to which readily available data at a large public uni-
versity can be used to a priori identify at-risk students who may benefit from targeted
retention efforts. Although it is possible to identify such students, there remains an inev-
itable tradeoff in any resource allocation between not treating the students who are likely to
exit without treatment and treating students who are likely not to exit in the absence of the
treatment. At-risk students are found to remain at risk throughout their college career.
Moreover, conditional on exiting the institution, the degree to which the student was at risk
is predictive of whether the student subsequently re-enrolls elsewhere and the type of
institution at which this re-enrollment occurs. In this context, we discuss how retention
policies relate to insuring the initial match is appropriate, recognizing that some attrition
can be in keeping with the broad social interest.
Keywords Retention � At-Risk students
Introduction
A number of studies have documented the importance of a college degree in terms of a
range of economic and social outcomes such as higher earnings, lower unemployment
rates, greater civic and volunteer engagement, and reduced criminal involvement (e.g.,
Light 1995; DesJardins et al. 1999; Pascarella and Terenzini 2005). There is also a
growing literature that documents a host of factors that account for the variation in
retention rates across students and institutions, such as institutional selectivity, academic
preparation, and financial aid (e.g., DesJardins et al. 2002b; Singell and Stater 2006).
However, few papers examine the pragmatic question of whether universities, using easily
accessible data and standard empirical techniques, can effectively identify students who
L. D. Singell (&) � G. R. WaddellDepartment of Economics, University of Oregon, Eugene, OR 97403-1285, USAe-mail: [email protected]
G. R. WaddellIZA, Bonn, Germany
123
Res High Educ (2010) 51:546–572DOI 10.1007/s11162-010-9170-7
could be retention risks sufficiently early in their college careers to practically intervene
(e.g., Murtaugh et al. 1999; DesJardins and Wang 2002; St John 2003; Miller and Tyree
2009). Our study builds on the education literature by examining this question using data
from the University of Oregon.
Of course, if institutions were unconstrained in their resources, the likely choice would
be for retention efforts to be employed quite broadly with the hope of capturing all possible
returns. However, as budgetary concerns are very much active, we question whether there
are potential efficiency gains to pooling resources on certain types of students and not
others. In an attempt to set the groundwork for such an effort, we model student retention
based on a set of student attributes, arguing that it is reasonable to classify students by their
probabilities of remaining in the institution at a particular time in the future, and in a way
that is actionable. For example, if we consider estimated re-enrollment probabilities by
residency status for the 2001 entering class of freshman, we find that resident (nonresident)
students in the decile with the highest predicted probability of exiting after the first quarter
on campus—those with the lowest estimated probability of re-enrollment—11.0 (12.9)
percent actually exit the institution by the end of their second quarter, while only 0.5 (0.0)
percent of those in the lowest decile actually exit.
In light of the fact that exits occur across all predicted deciles (i.e., attrition cannot be
perfectly predicted), we discuss the importance of considering resource allocations that are
sensitive to the implicit and inevitable tradeoff between ‘‘type-one errors’’ (i.e., not treating
students who will leave without treatment) and ‘‘type-two errors’’ (i.e., needlessly treating
students who will not exit even in the absence of the treatment). Moreover, it may also be
the case that the efficacy of treatment varies systematically by type of student. For
example, it need not be the case that the best practice spends resources first on those who
are at the highest risk of exiting. To the contrary, being most at risk a priori may well
correlate with being less sensitive to intervention, yielding resources spent in this effort
without an offsetting benefit. Moreover, that those resources could have been spent else-
where (e.g., on those who, while at less risk of exiting, may be more responsive to
treatment), makes such spending inefficient.
By the fall term of the 2001 class’ second year, we find that 35.4 (40.4) percent of the
highest-risk residents (nonresidents) fail to be retained, as compared to 3.5 (7.1) for the
lowest-risk residents (nonresidents). However, that at-risk students tend to remain at risk
throughout their college careers suggests that resources devoted to their retention early in
their tenures can be complementary to resources devoted to these same students in sub-
sequent years. Moreover, we find that the degree to which a given student is at risk is
predictive of whether a non-returning student remains in higher education at all and the
type of institution he or she moves to when enrolling elsewhere. In this context, we discuss
how retention policy should not be considered independent of the broader considerations
that relate to the match between student and institution. In short, some attrition can be
optimal under wider social interests.
Broadly, our findings suggest that uncertainty in predicting retention and in the efficacy
of treatment leave unresolved whether administrative action and the associated resource
expenditures would yield a net institutional or social benefit. On the other hand, our
analysis shows how an institution can estimate the degree of future retention risk within
their pool of applicants and the potential maximum yield from an intervention with their
enrollees. Such information is critical in formulating a targeted admissions strategy and a
cost-effective retention policy, which is a nascent objective among increasingly budget
conscience higher educational institutions.
Res High Educ (2010) 51:546–572 547
123

In the following section, we provide a brief account of the necessary background to the
issues at hand. In ‘‘Second-Term Retention’’ section, we model patterns of retention within
the first academic year at the University of Oregon, choosing to discuss longer-term
retention separately in ‘‘Later-Term Retention’’ section. In ‘‘Subsequent Post-Secondary
Re-enrollment of Non-Retainees’’ section, we analyze the subsequent re-enrollment pat-
terns of exiting students using data from the National Student Clearinghouse. We conclude
with further thoughts on experimental designs as extensions of this research.
Background
Early theoretical work on retention by Tinto (1975) modeled attrition as a longitudinal
process where students enter college with a set of attributes and predispositions that
precondition their academic and social commitment to graduation. The academic track is
influenced by the quality of the student’s interactions with the academic elements of the
institution, including faculty and other students, and the social track is refined by the
quality of student’s social interactions, including friends and school activities. Tinto (1987)
shows that this series of joint interactions collectively determines whether the student
persists in the institution. The student-integration model predicts that, all else equal,
institutional commitment and the goal of college completion are positively related to the
degree of student integration into the institutional environment, where the dropout process
includes temporal stages that reflect continuously updated perceptions regarding the stu-
dents’ enrollment status.
Alternatively, Bean (1978) posits a student-attrition model that borrows from the job-
satisfaction literature whereby a student’s decision to leave college relates directly to their
cognitive perception of satisfaction. Consistent with this approach, Bean (1983) finds that
student satisfaction is influenced by a variety of factors that include grades the student
receives and their belief regarding the influence of a college degree on future job prospects.
Thus, student satisfaction relates directly to course-taking behavior and membership in
campus organizations, which determine their perceptions of the value of participation, the
presence of distributive justice, their integration into the institution and other related
factors.
Subsequent work has largely worked to integrate and test the student-integration model
and student-attrition models (e.g., Cabrera et al. 1993; Guarino and Hocevar 2005; Caison
2007). In this context, most retention studies adopt a logistic regression approach and
institution-specific data from either a single or repeated cross section to demonstrate that
both financial and non-pecuniary factors play a role in retention (e.g., Wetzel et al. 1999;
Stratton et al. 2008). For example, logistic regressions have been used to demonstrate the
importance of the gender composition of the faculty (e.g., Robst et al. 1998), teaching
effectiveness of faculty (e.g., Langbein and Snider 1999), the quality of the match between
the student and university (e.g., Light and Strayer 2000), the initial enrollment intensity of
the student as measured by full-time versus part-time status (e.g., Stratton et al. 2007).
In the early empirical literature, the logistic or structural modeling approaches
employed to test the hypothesized determinants of student departure largely ignore the
dynamic nature of attrition that theory predicts should depend critically on the information
implicitly communicated by the timing of the student’s departure. In response, DesJardins
et al. (1999) employ a technique to model the correlation in the observed re-enrollment
over time using an event-history approach. For example, in a particular application of this
548 Res High Educ (2010) 51:546–572
123

technique, DesJardins et al. (2002a) estimate a hazard model that simulates how changes in
financial-aid packaging affect the timing of student departures at the University of
Minnesota.
Our analysis in a sense combines the logistic regression and dynamic hazard modeling
approaches used in prior work. We exploit data that tracks whether a student has been
retained by the University of Oregon and includes routinely available personal, perfor-
mance, and financial information. These data permit estimation of the predicted retention
probability at a particular point in time that serves as a measure of ‘‘at-risk status’’ and
confirms prior work that student attributes, measured performance, and financial aid are
important factors in retention. Subsequently, we test whether the predicted at-risk status
early in a student’s career can be used to anticipate subsequent observed decisions
regarding retention up through graduation. Combining our institutional data with student-
level information available in the National Student Clearinghouse (NSC), we also dem-
onstrate that predicted retention behavior while at the University of Oregon relate to the
post-attrition decisions of students who fail to be retained by the University. Our results
demonstrate the importance of both fixed and time-varying factors in understanding
retention and post-attrition behavior of students, which provide a policy platform to help
institutions effectively identify at-risk students at critical times in the matriculation
process.
Second-Term Retention
We intentionally limit our empirical assessment of retention in two ways. First, we restrict
our attention to information generally available to admissions offices and university
administrators either at the time the student arrives on campus or in the first couple of
terms of enrollment. Second, we use these data to estimate a reduced-form, binary (probit)
model of whether a student is retained or not that could be executed by an office of
institutional research using off-the-shelf statistical packages. In adopting this approach, our
intention is to determine whether an institution could effectively use accessible statistical
models and data to identify those students who are at risk of attrition, and if so, engage in a
preemptive intervention before such students fail to return to campus.
Our initial approach is the most restrictive in the sense that it uses only the information
available at the time of initial enrollment, which would permit the earliest possible
identification and intervention. In particular, our initial analysis focuses on a model of
second-term retention without the inclusion of information on first-term student perfor-
mance. We use these data to obtain an estimate of the second-term retention probability,
which permits an assessment of whether students who a priori enter with a high probability
of attriting from the institution are those who are subsequently more likely to leave. We
later relax this restriction and examine the efficacy of incorporating on-campus perfor-
mance in identifying at-risk students.
Empirical Specification
The University of Oregon is on a quarter system that includes three regular-year terms (i.e.,
fall, winter, spring) and a summer quarter that we (and the institution) do not consider part
of regular full-time enrollment. Because the decision to re-enroll is dichotomous in nature,
we estimate probit models where the dependent variable equals one if the student chooses
Res High Educ (2010) 51:546–572 549
123
to re-enroll in a particular subsequent academic term and zero otherwise.1 The base
specification considers whether the student who enrolls as a fall-term freshman re-enrolls
in the subsequent winter term. Nonetheless, the structure of the estimation procedure itself
is flexible and will not change when we recast the model in terms of predicting later
outcomes (e.g., retention in the fall term of the second year, graduation within 5 years). In
all cases, we estimate the probit model separately for resident and nonresident students.2
Although it would be of interest to model the set of factors that determine retention in a
fully dynamic context—examining the behavior and information that exists even within a
single term—data limitations prevent us from doing so. Having acknowledged this, it is our
belief that this level of aggregation is not likely to constrain policy efforts in any significant
way as it would be difficult to imagine implementations in response to information learned
in any shorter intervals than single terms. Therefore, we focus on the evaluation of
retention probabilities at several points over a student’s academic tenure, with the objective
being to determine what student attributes are predictive of being at risk.
The models we consider each include information on personal attributes that are known
to the institution at the time of enrollment and may correlate with retention (e.g., Singell
2004). Specifically, we allow retention probabilities to differ across gender and race with
the inclusion of binary variables that equal one if the applicant is female, or Asian, African
American, Hispanic, Native American, or other non-White (i.e., the comparison category is
white males). Also among student attributes included in our specifications are high-school
GPA and SAT scores, arguably controlling for measures of aptitude for academic per-
formance upon entry into the institution. Age is controlled for with two binary variables
that allow for the retention behavior of students who are either younger than 18 or older
than 19 to differ from 18 and 19 year old students that comprise majority of University of
Oregon students.
Prior literature has documented the importance of financial considerations in enrollment
and retention (e.g., James 1988). Thus, each of our models control for first-year financial
eligibility and first-year financial aid offered to the applicant.3 Specifically, we include
separate controls for the dollar value of scholarships (e.g., institutional and non-institu-
tional scholarships, etc.), grants (e.g., state and federal), loans (e.g., subsidized and
unsubsidized), and work-study aid offers measured in thousands of dollars. In so doing, we
recall prior work shows that the coefficients on financial aid controls tend to be biased
downward (e.g., St John 1990). In particular, the level of financial aid, while potentially
relaxing financial constraints that would be expected to be positively related to retention, is
also correlated with need that is expected to be negatively related to retention. Identifying
the positive retention effects of aid net of its correlation with need is particularly a problem
1 We also estimate all probit specifications using a logit model, which is frequently used in the literature. Alogit model assumes a Weibull distribution, which was preferred for computational reasons to the probitmodel that requires integrating over a normal distribution. However, these computational limitations nolonger bind and the probit model is relatively robust to outliers because the normal distribution is char-acterized by slightly less mass in the tails relative to the Weibull distribution. In this case, the logit andprobit specifications yield virtually identical findings for all specifications.2 Curs and Singell (2002) show that the costs and related opportunity costs of attrition from the Universityof Oregon differ distinctly between the two groups of students.3 Financial eligibility is a need measure that equals the total dollar value of need-based aid offered to thosereceiving positive amounts of aid, but is a negative number equal to the amount to which the effective familyincome exceeds the cost of attendance. Offered aid is the amount of aid awarded by the financial aid office,which differs from the amount of aid actually disbursed (particularly for loans and work-study that are oftenrefused). We use the offered, rather than the disbursed, level of aid because it reflects an assessment of needthat is expected to be a critical component in retention.
550 Res High Educ (2010) 51:546–572
123

with limited family income measures. Nonetheless, in this case, we adopt a specification
that does not attempt to decouple these offsetting effects, in keeping with our objective of
parsimony.
To permit possible differences in the enrollment propensities of students with different
academic interests, we include two binary variables that allow retention to differ by
whether the applicant files for a major in either the College of Arts and Sciences or in any
of the professional schools. The excluded comparison category is those students who are
undeclared. We further relax our constraints on the model by allowing retention to differ
for those students admitted into the Honors College, which includes both a residential and
curricular component. Finally, we include a binary variable for small freshman seminars
called Freshman Interest Groups (FIGs) which may predict attachment. We also distin-
guish between FIGs associated with resident halls and those that are nonresidential in
nature. Finally, to allow for different enrollment propensities associated with unobserved
time-varying factors, we include binary variables for each year, with the first cohort (i.e.,
2001) being the comparison group.4
Data and Descriptive Statistics
Reflecting the availability of data, we define the sample of University of Oregon students
used for this analysis as first-time, fall-term freshmen from academic years 2001 through
2006. The binding constraint on our sample of students is the availability of student-level
FIG affiliations, which has only been made available from 2001 onward. As will be noted
below, FIG participation is a relatively strong predictor of retention behavior. It is also
reflective of the current state of the campus opportunities. We have thus determined that
the merits of going further back in time with transcript data are not outweighed by the cost
of not including this information in the models. Moreover, the tighter time window has the
added advantage that, while the analysis has sufficient observations to yield precise esti-
mates, it permits us to make out-of-sample predictions on relatively current observed
behavior. To get a sense of the dynamics of the retention decision over a University of
Oregon career, throughout the paper we use the 2001 cohort to examine the effectiveness
of the analysis at identifying a specific set of students who will and will not be retained
over time and up through graduation.
Prior research has established that departure types such as dropout, stopout, and transfer
can be quite different (e.g., Stratton et al. 2008). For consistency, throughout our analysis
student attrition is defined at the first term in which active participation in the institution is
not evidenced in the records of course enrollment and completion. Moreover, we consider
any active engagement within an academic term as attachment and make no distinction by
intensity of attachment (e.g., credit hours). Given the regularity with which students skip
4 Beyond these variables that are directly observed as part of the University of Oregon data system, thereare variables that either can be created using existing data or can be obtained from other data sources thatwould be expected to correlate to behavior as it relates to retention. The U.S. Census collects ZIP-code leveldata that can be matched with parent address to measure the characteristics of peers (e.g., median familyincome). Likewise, the Educational Testing Service collects high-school level data by CEEB code thatcapture peer group academic attributes (e.g., average SAT score for the high school). The University ofOregon also collects information on behavior such as conduct and employment status that, while not readilyavailable, prior work suggests could be used to identify the likelihood of retention (e.g., Terenzin et al.1996). Nonetheless, these variables are excluded in keeping with our focus on data that are readily availablein the University of Oregon data system.
Res High Educ (2010) 51:546–572 551
123
the summer term, we do not interpret inactivity in summer terms as a stop out.5 With this
summer-term exception, we otherwise restrict our attention to continuous and active
participation in the institution. That is, when we predict fall, second-year re-enrollment for
a particular student, we do so only for those students who have been observed at the
institution in the fall, winter and spring terms of the previous year. Further, in predicting a
particular term in which the student has not re-enrolled (e.g., fall of the second year) we
take no account of any subsequent re-enrollment behavior, which is to treat all students
equally no matter whether we eventually observe attritors re-enroll or not.
To get a sense of the importance of our restrictions on the data by our definition of
continuous participation, we reconstruct the histories and observed decisions of recent
University of Oregon students to provide an indication of the relative frequency of the
various paths of progression through the institution. For example, Table 1 provides the
patterns of active annual enrollment for the 2001 cohort of first-time fall freshmen by
eventual graduation outcome, where the real number descriptors are a shorthand way of
capturing the wide variety of possible paths. We use years rather than terms for ease of
presentation because finer distinctions by term greatly expand the number of categories
without changing the qualitative pattern of student participation. In this case, the number of
digits in the number corresponds to the number of years in which the student was actively
enrolled in the institution. The first digit, by definition, will be one with all subsequent
digits assigned the chronological year of contact with the institution. For example, a pattern
of 1,245 would indicate that the student was enrolled in years one and two (i.e., 2001 and
2002), was not enrolled in year three (i.e., 2003), re-enrolled in year four (i.e., 2004) and
again in year five for a total of 4 years of active enrollment spread over five chronological
years. Table 1 indicates that of those students who have graduated, 89% (i.e., 1,585 of
1,779) have continuous year-to-year participation up to the fifth year of enrollment. Thus,
for simplicity and without a great loss of generality, we focus on students who are con-
tinuously enrolled that constitute the majority of students who matriculate through the
University.
Historically, the University of Oregon graduates slightly more than 60% of students
who enroll as freshman by their sixth year. For example, fall freshman in the 2001 cohort
of students have had 6 years on campus and, of cohorts available in the data, have the
longest or most complete spell of potential enrollment within the sample. Using the class of
2001, 1,780 of 2,851 students (i.e., 62.4%) had graduated as of the winter term of 2008,
while 64 students within the cohort remain active at the institution. Moreover, of the
attrition experienced so far from the 2001 cohort, the University of Oregon lost approxi-
mately 39% of the total before the fall term of their sophomore year. Table 2 reports the
complete pattern of attrition observed from the 2001 cohort of students, by year and term.
Generally, the results in Table 2 show that the pattern of attrition is somewhat lumpy, with
recurring clusters of attrition being experienced at the end of each academic year.6
5 For parsimony, we treat summer term as outside the regular academic year and summer-term activity(when observed) is absorbed into the closest previous term of enrollment. For example, if there is activeparticipation in spring and summer terms but no evidence of re-enrollment in the subsequent fall term,spring term is adopted as the last term of active enrollment. As a particle matter, however, sensitivity teststhat merge summer term the opposite direction into fall term enrollment do not qualitatively effect theresults, which arises largely because participation in summer school has a strong positive relationship tocontinuous enrollment at the University of Oregon.6 More generally, term-by-term attrition patterns over the 2001 through 2006 cohorts reveal a similarlumpiness with the early cohorts in the sample—2001 through 2003—experiencing an uptake in attritionaround the end of the fourth year (i.e., the 12th regular term).
552 Res High Educ (2010) 51:546–572
123

Table 1 Paths of persistence bygraduation outcome, 2001 Cohort
Patha Not graduate Graduate Total
1 395 1 396
12 257 1 258
123 98 57 155
1234 91 1,134 1,225
12345 81 392 473
123456 26 53 79
1234567 23 0 23
123457 7 0 7
12346 4 4 8
123467 6 0 6
12347 3 0 3
1235 2 10 12
12356 0 3 3
123567 2 0 2
12357 1 0 1
1236 1 1 2
12367 2 0 2
1237 1 0 1
124 13 35 48
1245 6 33 39
12456 3 2 5
124567 2 0 2
1246 1 2 3
125 1 1 2
1256 2 6 8
12567 2 0 2
126 1 0 1
1267 3 0 3
127 3 0 3
13 6 0 6
134 2 10 12
1345 2 22 24
13456 0 4 4
1346 1 0 1
14 2 4 6
145 1 3 4
1456 3 1 4
14567 6 0 6
1567 3 0 3
167 4 0 4
17 2 0 2
Total 1,069 1,779 2,848
Res High Educ (2010) 51:546–572 553
123

Results
Using only the fixed, student-level information at the time of matriculation (i.e., not
exploiting first-term performance, in particular), we model the decision to re-enroll in the
winter term of the freshman year as a function of the available student attributes discussed
above. The results in Table 3 reveal differences in the probabilities of returning to the
University of Oregon in the second quarter of the freshman year across a number of
observed attributes known at the time each student enrolls.
First, we estimate separate models for residents and nonresidents reflecting the findings
of prior work that these two student groups face a distinctly different set of choices (e.g.,
Singell 2004) and supported by a likelihood-ratio test that rejects the restriction of equal
coefficients by residential status at the 99% level. Our results indicate that across residency
status, winter-term retention probabilities differ by student attributes, and the estimates
differ not only in magnitude but sign. For example, female residents are significantly less
likely to return in the winter term than their male counterparts, whereas there are no gender
differences in retention probabilities for nonresidents. On the other hand, nonresident
students with higher high-school GPAs are less likely to return, whereas the coefficient on
high-school GPA is not significant for residents. Similarly, while not robust across resi-
dency status, out of-state Asian students are more likely to be retained into the winter term.
Nonetheless, high-SAT and African American students are more likely to return in the
second quarter, regardless of residency. Thus, we find that personal attributes matter with
regard to retention, but the pattern of effects is complex.
Table 2 The timing of attrition(without graduation) from the2001 cohort of first-time fallfreshmen
Attrition is measured from thelast term enrolled. Thus, forexample, 2001 Fall indicates thatthe last term enrolled was fallterm 2001
Last term ofenrollment
Frequency Percent Cumulativepercentage
2001 Fall 95 9.43 9.43
2001 Winter 54 5.36 14.8
2001 Spring 247 24.53 39.32
2002 Fall 59 5.86 45.18
2002 Winter 51 5.06 50.25
2002 Spring 147 14.6 64.85
2003 Fall 36 3.57 68.42
2003 Winter 18 1.79 70.21
2003 Spring 51 5.06 75.27
2004 Fall 22 2.18 77.46
2004 Winter 36 3.57 81.03
2004 Spring 50 4.97 86
2005 Fall 40 3.97 89.97
2005 Winter 26 2.58 92.55
2005 Spring 27 2.68 95.23
2006 Fall 16 1.59 96.82
2006 Winter 15 1.49 98.31
2006 Spring 11 1.09 99.4
2007 Fall 6 0.6 100
Total 1,007 100
554 Res High Educ (2010) 51:546–572
123

Second, winter-term retention probabilities are systematically and similarly related to
both need and financial aid for resident and nonresident students. Specifically, needy
students, as measured by financial eligibility, are less likely to return. This finding is
Table 3 Determinants of win-ter-term, first-year re-enrollment,2001–2006 cohorts
Standard errors in parentheses.*** P \ 0.01, ** P \ 0.05,* P \ 0.1 All specifications alsocontrol for cohort yeara The regression also includesyear fixed effects excluded forbrevity
Residentstudents
Nonresidentstudents
Female -0.0113***(0.0028)
-0.0073(0.0049)
High-school GPA 0.0008(0.0052)
-0.0186**(0.0086)
SAT score 0.0280***(0.0103)
0.0537***(0.0185)
Race: Black 0.0211***(0.0035)
0.0210**(0.0095)
Race: Asian 0.0054(0.0047)
0.0230***(0.0054)
Race: Hispanic 0.0049(0.0063)
0.0089(0.0105)
Race: Native American -0.0086(0.0154)
-0.0153(0.0252)
Race: Other non-white -0.0008(0.0057)
0.0088(0.0070)
Private High School 0.0033(0.0049)
-0.0012(0.0088)
Younger than 18 when freshman -0.0020(0.0152)
0.0171(0.0196)
Older than 19 when freshman -0.0570**(0.0262)
-0.0198(0.0233)
Aid: Eligibility (thous) -0.0005*(0.0002)
-0.0004*(0.0002)
Aid: Grant (thous) 0.0010(0.0008)
0.0012(0.0021)
Aid: Scholarship (thous) 0.0121***(0.0019)
0.0091***(0.0020)
Aid: Loan (thous) 0.0006*(0.0004)
0.0008**(0.0004)
Aid: Work-study (thous) 0.0020(0.0023)
0.0034(0.0047)
FIG: Non-residential 0.0165***(0.0026)
0.0167***(0.0047)
FIG: Residential 0.0090***(0.0034)
0.0209***(0.0049)
College of Arts and Science 0.0025(0.0033)
-0.0166**(0.0066)
Professional School 0.0034(0.0030)
0.0053(0.0056)
Admitted to Honors College 0.0044(0.0076)
-0.0067(0.0153)
Observations 11,072 5,937
Log-likelihood -1,484.50 -983.97
Pseudo R-squared .06 .05
Res High Educ (2010) 51:546–572 555
123
consistent with the expectation that meeting financial need is an important factor in
retaining students. Likewise, scholarships and loans positively relate to retention, sug-
gesting that financial assistance can increase the probability that a student remains enrolled
at the University. However, the coefficients on grants and work-study, while positive, are
insignificant and suggest that the type of aid is important in determining whether it will be
effective at improving retention. Broadly, these findings support those of Singell (2004)
that merit aid has larger retention effects than need-based aid in part because merit aid
correlates positively with ability and retention while need negatively correlates with
retention.
Finally, variables relating to the type of student connection to the institution also appear
important for retention. In particular, FIG status is a significant predictor of retention, with
non-residential FIG affiliations having the stronger correlation for in-state students and
residential-FIG affiliations having the stronger correlation for out of-state students. This
supports prior findings in Hotchkiss et al. (2002) that freshman learning communities can
improve both retention and college performance. Student selection into professional-school
majors does not significantly affect the probability of returning winter term relative to
students who are undeclared, but nonresident (resident) CAS majors are (are not) signif-
icantly less likely to return relative to undeclared students. In addition, admission to the
Honors College does not significantly affect winter-quarter retention.
As a general rule, our econometric analysis is suggesting that retention is a difficult
outcome to predict, in the sense that there is much variation that is not explained by the list
of student determinants in the model. However, prediction-based modeling is still valid and
instructive. For example, consider one who has interest in identifying the most-at-risk
students among a given class of freshmen. With the above model operating as the back-
bone of the predictive exercise, we can identify students in a given class who fall on either
side of a prescribed probability threshold or within a range of prescribed probabilities of re-
enrollment. Consider, by the way of example, predicting the retention probability for each
student in the 2001 class and ranking all students in the class from the lowest to the highest
probability of being retained. Doing so, one could then decide to treat those below the tenth
percentile of re-enrollment probabilities from this class—those that the model predicts are
the most at risk of not returning.
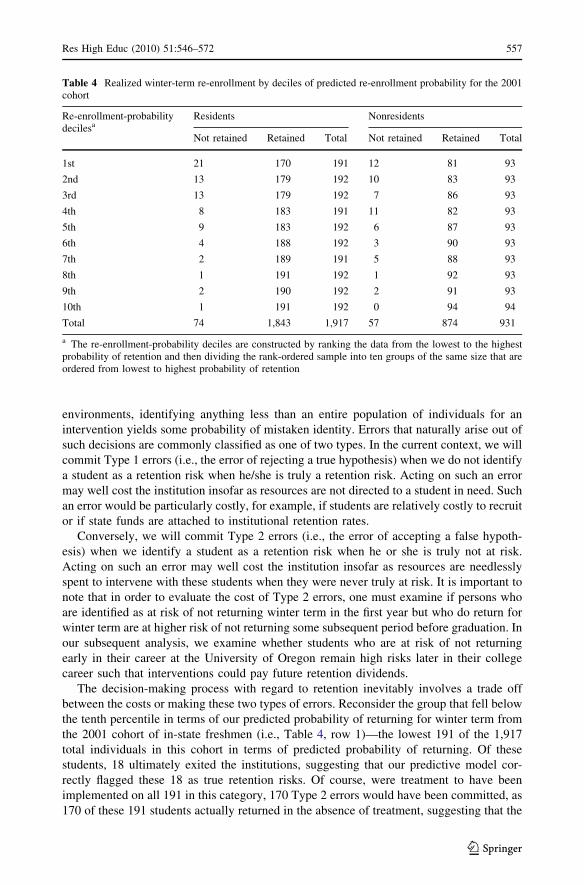
Row 1 of the left panel in Table 4 demonstrates that, for residents, the University of
Oregon would treat 191 most-at-risk students out of a possible 1,917 students in 2001.
These 191 students have predicted probabilities of re-enrolling in winter of their first year
that range between 77.8 and 92.5%. Following these students into their subsequent term,
170 are found to have re-enrolled, while 21 actually left the University. In other words,
their observed re-enrollment rate was 89% (i.e., 170/191). Conversely, the relatively low-
retention-risk categories in rows 2 through 10 include the remaining 1,726 students that our
model predicts have a rank-order re-enrollment probability in winter term that ranges
between 92.6 and 100%. In reality, 53 of these resident students did not re-enroll in the
subsequent term, implying a re-enrollment rate of 96.9% (i.e., 1,673/1,726). The right
panel of Table 4 shows a similar pattern for nonresidents. Thus, broadly speaking, the
model can identify students (resident and nonresident) who are most vulnerable of not
being retained and thereby providing decision makers the opportunity to intervene.
Type I versus Type II Errors in Prediction
At this point, and with this illustration in mind, let us pause to consider the necessity that
errors in assignment be realized in this context. As with many decisions made in uncertain
556 Res High Educ (2010) 51:546–572
123
environments, identifying anything less than an entire population of individuals for an
intervention yields some probability of mistaken identity. Errors that naturally arise out of
such decisions are commonly classified as one of two types. In the current context, we will
commit Type 1 errors (i.e., the error of rejecting a true hypothesis) when we do not identify
a student as a retention risk when he/she is truly a retention risk. Acting on such an error
may well cost the institution insofar as resources are not directed to a student in need. Such
an error would be particularly costly, for example, if students are relatively costly to recruit
or if state funds are attached to institutional retention rates.
Conversely, we will commit Type 2 errors (i.e., the error of accepting a false hypoth-
esis) when we identify a student as a retention risk when he or she is truly not at risk.
Acting on such an error may well cost the institution insofar as resources are needlessly
spent to intervene with these students when they were never truly at risk. It is important to
note that in order to evaluate the cost of Type 2 errors, one must examine if persons who
are identified as at risk of not returning winter term in the first year but who do return for
winter term are at higher risk of not returning some subsequent period before graduation. In
our subsequent analysis, we examine whether students who are at risk of not returning
early in their career at the University of Oregon remain high risks later in their college
career such that interventions could pay future retention dividends.
The decision-making process with regard to retention inevitably involves a trade off
between the costs or making these two types of errors. Reconsider the group that fell below
the tenth percentile in terms of our predicted probability of returning for winter term from
the 2001 cohort of in-state freshmen (i.e., Table 4, row 1)—the lowest 191 of the 1,917
total individuals in this cohort in terms of predicted probability of returning. Of these
students, 18 ultimately exited the institutions, suggesting that our predictive model cor-
rectly flagged these 18 as true retention risks. Of course, were treatment to have been
implemented on all 191 in this category, 170 Type 2 errors would have been committed, as
170 of these 191 students actually returned in the absence of treatment, suggesting that the
Table 4 Realized winter-term re-enrollment by deciles of predicted re-enrollment probability for the 2001cohort
Re-enrollment-probabilitydecilesa
Residents Nonresidents
Not retained Retained Total Not retained Retained Total
1st 21 170 191 12 81 93
2nd 13 179 192 10 83 93
3rd 13 179 192 7 86 93
4th 8 183 191 11 82 93
5th 9 183 192 6 87 93
6th 4 188 192 3 90 93
7th 2 189 191 5 88 93
8th 1 191 192 1 92 93
9th 2 190 192 2 91 93
10th 1 191 192 0 94 94
Total 74 1,843 1,917 57 874 931
a The re-enrollment-probability deciles are constructed by ranking the data from the lowest to the highestprobability of retention and then dividing the rank-ordered sample into ten groups of the same size that areordered from lowest to highest probability of retention
Res High Educ (2010) 51:546–572 557
123
resources associated with treatment may have been employed to greater benefit elsewhere
in the institution. Of the 1,726 students not targeted as retention risks (given this threshold),
forgoing treatment of them would be to commit 56 Type 1 errors (i.e., 56 ‘‘not-at-risk’’
students actually dropped out of the institution and may have benefited from treatment). As
both types of errors are both necessary implications of facing uncertain outcomes and
implicitly costly to the institution, one must bear in mind the need to balance the two.
The comparable breakdown for all intervals is provided in rows two through nine in
Table 4 that shows that the number of students who actually re-enroll increases with their
predicted re-enrollment. This result is true of both residents and nonresidents. Thus, an
empirical retention model can be used to improve an institution’s ability to identify at-risk
students and who might benefit from an intervention.
Persistence in At-Risk Status
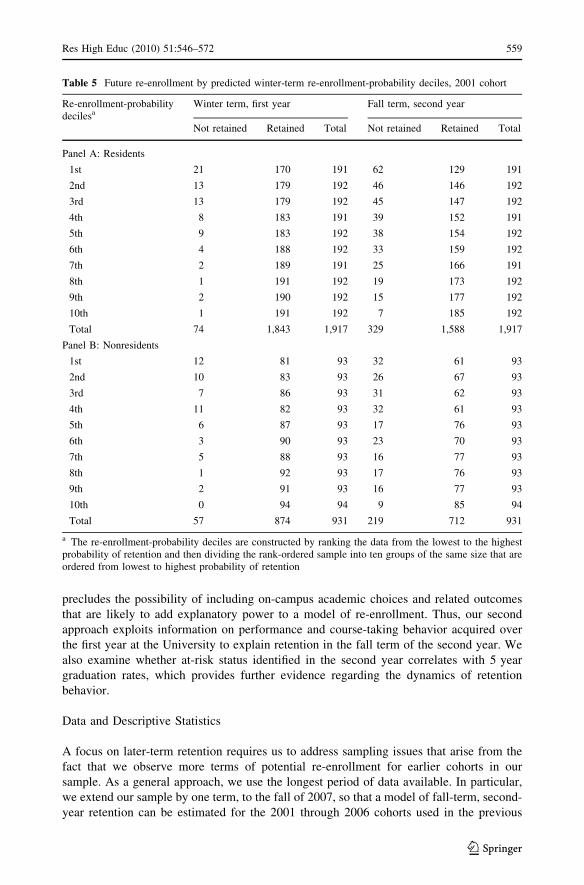
The effectiveness of early detection depends, in part, on whether students who are iden-
tified to be at risk but return continue to be at risk for subsequent re-enrollment decisions.
To this end, the left panel of Table 5 is the same as the left panel of Table 4 representing
the re-enrollment-probability deciles for residents, whereas the right panel of Table 5
examines the actual enrollment behavior for the students identified in these same
re-enrollment-probability deciles but observed in the fall term of the second year. In other
words, Table 5 examines whether students grouped into increasingly higher deciles of
predicted retention rates in the winter term of their first year are observed to have
systematically higher re-enrollment rates in the subsequent fall term of their second year
such that there is persistence in at-risk status.
The results demonstrate that residents identified as at risk for the second term continue
to be at risk in subsequent terms. For example, 21 of 191 students in the highest
re-enrollment-probability decile fail to return winter term of their first year and this number
increases to 62 non-retainees in the fall term of their second year. The second decile,
comprised of students who are at a lower risk of exiting, appears to be associated with the
observed attrition in the second year. Specifically, 13 of the 192 students in the second
decile fail to return for winter term of their first year, which increases to 46 non-retainees
for this same decile in the fall term of their second year. This positive correlation between
second-term and second-year attrition and the declining attrition rate with re-enrollment
probability is observed up to the lowest-risk group. For example, 1 of the 192 students in
the tenth decile fail to return for winter term of first year, which climbs to 7 for this same
decile in the fall term of their second year. The bottom panel of Table 5 conducts a similar
exercise for nonresidents and indicates a similar pattern to that observed for residents.
We subsequently show that the re-enrollment-probability deciles derived early in
students’ careers are effective at predicting outside of the sample as it relates to graduation.
Thus, the findings suggest that identifying students (resident or nonresident) early with the
intent to treat may pay future dividends because term-by-term retention risks are positively
correlated throughout their tenures.
Later-Term Retention
To this point we have restricted our analysis to an evaluation of retention based on student-
level data available upon the arrival of students on campus, which permits immediate
identification of potential retention risks. However, while early detection is beneficial, it
558 Res High Educ (2010) 51:546–572
123
precludes the possibility of including on-campus academic choices and related outcomes
that are likely to add explanatory power to a model of re-enrollment. Thus, our second
approach exploits information on performance and course-taking behavior acquired over
the first year at the University to explain retention in the fall term of the second year. We
also examine whether at-risk status identified in the second year correlates with 5 year
graduation rates, which provides further evidence regarding the dynamics of retention
behavior.
Data and Descriptive Statistics
A focus on later-term retention requires us to address sampling issues that arise from the
fact that we observe more terms of potential re-enrollment for earlier cohorts in our
sample. As a general approach, we use the longest period of data available. In particular,
we extend our sample by one term, to the fall of 2007, so that a model of fall-term, second-
year retention can be estimated for the 2001 through 2006 cohorts used in the previous
Table 5 Future re-enrollment by predicted winter-term re-enrollment-probability deciles, 2001 cohort
Re-enrollment-probabilitydecilesa
Winter term, first year Fall term, second year
Not retained Retained Total Not retained Retained Total
Panel A: Residents
1st 21 170 191 62 129 191
2nd 13 179 192 46 146 192
3rd 13 179 192 45 147 192
4th 8 183 191 39 152 191
5th 9 183 192 38 154 192
6th 4 188 192 33 159 192
7th 2 189 191 25 166 191
8th 1 191 192 19 173 192
9th 2 190 192 15 177 192
10th 1 191 192 7 185 192
Total 74 1,843 1,917 329 1,588 1,917
Panel B: Nonresidents
1st 12 81 93 32 61 93
2nd 10 83 93 26 67 93
3rd 7 86 93 31 62 93
4th 11 82 93 32 61 93
5th 6 87 93 17 76 93
6th 3 90 93 23 70 93
7th 5 88 93 16 77 93
8th 1 92 93 17 76 93
9th 2 91 93 16 77 93
10th 0 94 94 9 85 94
Total 57 874 931 219 712 931
a The re-enrollment-probability deciles are constructed by ranking the data from the lowest to the highestprobability of retention and then dividing the rank-ordered sample into ten groups of the same size that areordered from lowest to highest probability of retention
Res High Educ (2010) 51:546–572 559
123

analysis. However, we also have a specific interest in understanding the dynamics of
retention up through graduation, which requires observing at least one cohort over an
interval sufficiently long to afford them a reasonable opportunity to graduate. In this case,
we use 5 year graduation rates, which allow us to observe the 2001 and 2002 fall-term
freshman cohorts up through their expected graduations.7
While it is reasonable to expect that performance in college relates to retention, it is
important to understand the extent to which measured performance correlates with per-
sistence in college in our sample. For the 2001 cohort of first-time fall freshmen, Fig. 1
considers the typical path of performance (as measured by GPA) by whether the student
(resident or nonresident) graduates within 5 years, does not graduate within 5 years but
continues to be actively enrolled in the University, or does not graduate and is no longer
actively enrolled in the institution. Fig. 1 clearly shows that, without controlling for other
student attributes, there are distinct differences in GPA observable even in the first term of
active enrollment and then throughout the average student’s tenure. In particular, Fig. 1
shows that those students who are ultimately not retained by the University perform worse
during the periods they are enrolled than those students who are retained.
From an empirical perspective, Fig. 1 suggests that a model must to account for two
particular types of performance effects on retention. First, the model should allow for level
Fig. 1 Mean GPA for resident and nonresident students by term, by outcomes, 2001 cohort
7 We also estimate the fall term, second year model restricting the data to the 2001 and 2002 cohorts toinsure that our sample used to evaluate graduation rates is the same as that used to evaluate second-yearretention. This approach, although lowering the precision of the estimates by reducing the sample size, limitscohort-specific idiosyncratic differences and insures that possible differences in retention behavior in the fallterm of the second year and in five-year graduation rates is not related to a change in the sample. In general,the results are qualitatively the same between the two approaches suggesting our conclusion are robust to thesample selected.
560 Res High Educ (2010) 51:546–572
123
differences in performance (i.e., level effects) because students who ultimately leave the
University begin with lower grades than those who stay. Second, the model should allow
any performance effect to change over time (i.e., time trends), to account for the fact that
the trajectory of grades differs for students who eventually exit. Thus, our second-year
retention model includes three term-specific GPA measures to control for ‘‘level effects of
GPA’’ and a ‘‘three-term trend in GPA’’ to permit differences over time in the influence of
academic performance. To improve the fit of the model, the term-specific GPA controls are
measured in logs. Logarithmic transformation is a common method to account for non-
linearity in regressions where an explanatory variable (e.g., GPA) is expected to relate
positively to the dependent variable (e.g., retention) but at a diminishing rate.
To this point, our model specification includes observed GPA but does not account for
the substantial variation in GPAs across subject areas. This is potentially important, given
the wide variance in grades across subjects. For example, considering the mean grade
awarded by subject code within the University reveals that average grades in lower-
division classes by subject range from a low of 2.55 (Accounting) to a high of 3.92
(Military Science) and in upper-division classes range from a low of 2.80 (Economics) to a
high of 4.03 (Education). In this circumstance, controls for the level and trend in GPA are
likely not sufficient to fully measure differences in college performance across students
who themselves differ by subject area. It follows that, beyond our observed GPA measures,
we calculate and include in the model each student’s ‘‘expected GPA.’’ The inclusion of
this measure then incorporates into the model any systematic differences in the difficulty of
obtaining high letter grades in certain disciplines.8
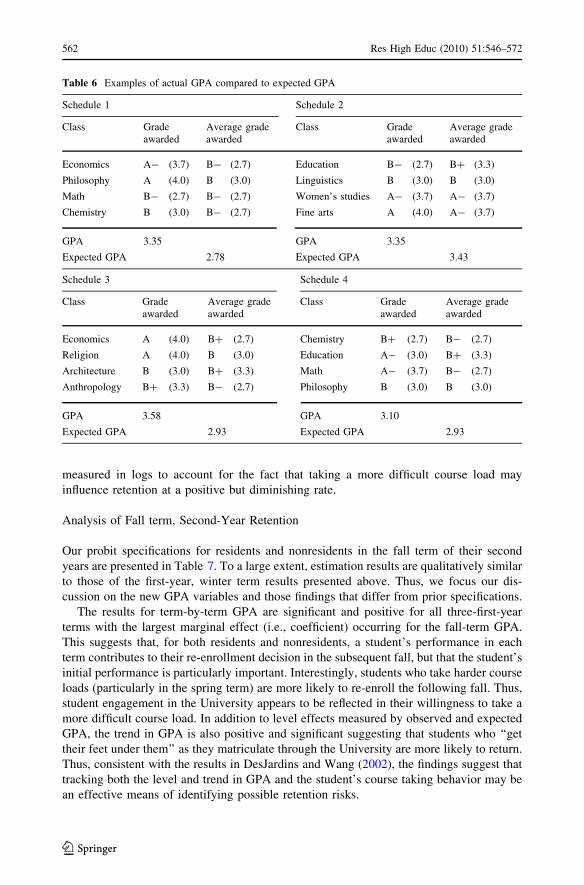
In particular, a student’s expected GPA can be simply defined as the average GPA
(across all students) over all courses in which the student is enrolled in a given term. For
example, consider four schedules of classes in Table 6, with typical grades observed in
lower-division University of Oregon courses by discipline. Comparing schedules 1 and 2
on realized GPA alone would lead one to believe that two different students with these
schedules were comparable insofar as they receive the same GPA (i.e., 3.35). However,
upon reflection, Schedule 1 is a more-difficult course load as measured by the average
grade received across those classes (i.e., a GPA of 2.78), while Schedule 2 implied an
average GPA of 3.43. Likewise, schedules 3 and 4 demonstrate that it is possible for two
students to have distinctly different GPAs in a way that may well imply real differences in
performance, as an expected-GPA calculation suggests that course difficulty was not dif-
ferent. To the extent that course difficulties are systematically chosen by students with
different unobserved attributes (e.g., drive, motivation), and these same attributes correlate
with retention, including both actual GPA and the expected GPA in the model will improve
our ability to predict retention.
In terms of the interpretation of expected GPA, given that the model includes each
student’s realized GPA, which measures actual performance, a lower expected GPA may
speak to a student’s willingness to take a harder course load. Because students take a
different mix of courses each term, our specifications include the expected GPA for fall,
winter, and spring terms, allowing for differences in course taking behavior across time.
Following the specification for observed GPA, the three expected GPA controls are
8 Recent work have shown incentives for grade inflation that can differ across departments and institutions(e.g., Gino et al. 2007; Bar et al. 2008). Higher education institutions are also aware that grades do notdirectly correlate with performance in the classroom and are moving towards reporting such measures as themedian grade (e.g., Dartmouth, Cornell) and the percent A-range grades (e.g., Columbia) on the transcript.The University of Oregon is presently considering reporting the proportion of As and Bs in the class on thetranscript.
Res High Educ (2010) 51:546–572 561
123
measured in logs to account for the fact that taking a more difficult course load may
influence retention at a positive but diminishing rate.
Analysis of Fall term, Second-Year Retention
Our probit specifications for residents and nonresidents in the fall term of their second
years are presented in Table 7. To a large extent, estimation results are qualitatively similar
to those of the first-year, winter term results presented above. Thus, we focus our dis-
cussion on the new GPA variables and those findings that differ from prior specifications.
The results for term-by-term GPA are significant and positive for all three-first-year
terms with the largest marginal effect (i.e., coefficient) occurring for the fall-term GPA.
This suggests that, for both residents and nonresidents, a student’s performance in each
term contributes to their re-enrollment decision in the subsequent fall, but that the student’s
initial performance is particularly important. Interestingly, students who take harder course
loads (particularly in the spring term) are more likely to re-enroll the following fall. Thus,
student engagement in the University appears to be reflected in their willingness to take a
more difficult course load. In addition to level effects measured by observed and expected
GPA, the trend in GPA is also positive and significant suggesting that students who ‘‘get
their feet under them’’ as they matriculate through the University are more likely to return.
Thus, consistent with the results in DesJardins and Wang (2002), the findings suggest that
tracking both the level and trend in GPA and the student’s course taking behavior may be
an effective means of identifying possible retention risks.
Table 6 Examples of actual GPA compared to expected GPA
Schedule 1 Schedule 2
Class Gradeawarded
Average gradeawarded
Class Gradeawarded
Average gradeawarded
Economics A- (3.7) B- (2.7) Education B- (2.7) B? (3.3)
Philosophy A (4.0) B (3.0) Linguistics B (3.0) B (3.0)
Math B- (2.7) B- (2.7) Women’s studies A- (3.7) A- (3.7)
Chemistry B (3.0) B- (2.7) Fine arts A (4.0) A- (3.7)
GPA 3.35 GPA 3.35
Expected GPA 2.78 Expected GPA 3.43
Schedule 3 Schedule 4
Class Gradeawarded
Average gradeawarded
Class Gradeawarded
Average gradeawarded
Economics A (4.0) B? (2.7) Chemistry B? (2.7) B- (2.7)
Religion A (4.0) B (3.0) Education A- (3.0) B? (3.3)
Architecture B (3.0) B? (3.3) Math A- (3.7) B- (2.7)
Anthropology B? (3.3) B- (2.7) Philosophy B (3.0) B (3.0)
GPA 3.58 GPA 3.10
Expected GPA 2.93 Expected GPA 2.93
562 Res High Educ (2010) 51:546–572
123

Table 7 Determinants of fall-term, second-year re-enrollment,2001–2006 cohorts
Residents Nonresidents
Ln(1st-Term GPA) 0.3838***(0.0732)
0.4178***(0.1009)
Ln(Expected 1st-Term GPA) 0.0480(0.0652)
-0.1802*(0.1010)
Ln(2nd-Term GPA) 0.0867***(0.0183)
0.0609**(0.0299)
Ln(Expected 2nd-Term GPA) -0.0233(0.0642)
0.1993**(0.1013)
Ln(3rd-Term GPA) 0.1074***(0.0244)
0.0947***(0.0366)
Ln(Expected 3rd-Term GPA) -0.2421***(0.0598)
-0.2446**(0.0951)
3-Term Trend in GPA 0.0620***(0.0159)
0.0690***(0.0223)
Female -0.0358***(0.0063)
-0.0106(0.0100)
High-School GPA -0.0353***(0.0118)
-0.0217(0.0181)
SAT score 0.0041(0.0239)
0.0324(0.0375)
Race: Black 0.0607***(0.0142)
0.0647***(0.0210)
Race: Asian 0.0381***(0.0097)
0.0461***(0.0142)
Race: Hispanic 0.0283**(0.0138)
-0.0307(0.0265)
Race: Native American -0.0246(0.0329)
-0.0063(0.0420)
Race: Other non-white -0.0100(0.0133)
-0.0149(0.0167)
Younger than 18 when freshman -0.0147(0.0326)
-0.0115(0.0575)
Older than 19 when freshman -0.0727*(0.0432)
-0.0343(0.0412)
Private High School 0.0058(0.0122)
-0.0007(0.0171)
Aid: Eligibility (thous) 0.0007(0.0006)
-0.0010**(0.0005)
Aid: Grant (thous) -0.0011(0.0017)
0.0034(0.0036)
Aid: Scholarship (thous) 0.0039(0.0024)
0.0004(0.0035)
Aid: Loan (thous) -0.0004(0.0008)
-0.0008(0.0007)
Aid: Workstudy (thous) -0.0049(0.0050)
-0.0217***(0.0079)
FIG: Non-residential 0.0325***(0.0066)
0.0440***(0.0100)
FIG: Residential 0.0314***(0.0087)
0.0291**(0.0120)
Res High Educ (2010) 51:546–572 563
123

Interestingly, participation in FIGs (residential and nonresidential) and admittance to
the Honors College have significant and substantial retention effects into the second year
even after controlling for GPA. Consistent with the Student Integreation model of Tinto
(1987), our results suggests that programs that provide students a smaller and well-defined
group of peers may be effective at improving retention. Note, however, that because
students must apply for FIGs and the Honors College, this finding is also consistent with
the Student Attrition model of Bean as it suggests that students who actively seek out these
peer networks are more likely to be retained and opposed to these peer networks causing
these students to be retained. Nonetheless, the findings are useful for identifying students
who may require intervention either because they do not have such peer networks or are
not willing to actively seek and establish these peer networks.
Not surprisingly, the coefficients on high-school performance measures (i.e., high-
school GPA and SAT) are smaller in magnitude and generally insignificant in the speci-
fications that include current college performance. Thus, current performance in college is
a better predictor of retention than past performance in high school, which has been found
in other work (e.g., DesJardins et al. 2002a, b). Likewise, first-year aid values are generally
not important in predicting second-year retention, although scholarships are significantly
positive for residents suggesting that scholarship programs may create some warm-glow
retention effects for resident students.9 Finally, consistent with the findings in Light (2002),
the results for non-white students indicate that African American and Asian American
students are more likely to be retained than white students, net of other attributes. To the
contrary, Hispanics, Native American, and other non-whites do not differ in their retention
probabilities from white students. Thus, non-white students appear to consistently have
higher (or no different) retention probabilities net of other attributes, suggesting that
diversity efforts regarding retention may more appropriately focus on other attributes (e.g.,
current GPA) than on race.
For those in the 2001 cohort who returned winter term of their first year, we use the
models estimated in Table 7 (separately for residents and nonresidents) to predict the
re-enrollment-probability deciles associated with fall-term, second-year retention. Fol-
lowing the previous analysis, the re-enrollment-probability deciles presented in Table 8
focus on the 2001 cohort in order to examine the model’s effectiveness at predicting the
retention behavior for a specific group of students over their career in the institution.
Table 7 continued
Standard errors in parentheses.*** P \ 0.01, ** P \ 0.05,* P \ 0.1. All specifications alsocontrol for cohort year
The regression also includes yearfixed effects excluded from thetable ease of presentation
Residents Nonresidents
College of Arts and Science 0.0019(0.0076)
-0.0041(0.0119)
Professional school 0.0146**(0.0069)
-0.0024(0.0112)
Admitted to Honors College 0.0429***(0.0124)
0.0811***(0.0173)
Observations 10,356 5,519
Log-likelihood -3,384.25 -2,122.67
Pseudo R-squared .10 .07
9 Because students who drop out often fail to complete financial aid forms, second-year aid offers may beobserved to be zero for non-returning students, when they would have actually qualified for aid had they hadapplied for it. Thus, since the level of aid is highly correlated over time, we use first-year aid in theregressions rather than that offered in the second year.
564 Res High Educ (2010) 51:546–572
123

Considering these results for residents, we suggest that being in the most-at-risk decile is
an accurate predictor of second-year attrition (i.e., 63 correct predictions of a possible 173).
However, attrition from the middle deciles is quite uniform up to the ninth decile. For
nonresidents, in the right panel of Table 8, we see that high-risk deciles are consistently
more likely to have higher observed attrition. For example, the model correctly predicts 34
of 84 in the highest-risk decile. With the exception of the second decile, the number of
non-returning out-of-state students increases with the predicted risk of attrition.
Broadly, Table 8 suggests that it is important to look at where non-returnees go after
they leave the University because these exiting students may simply be seeking better
matches at competing institutions, which may differ distinctly with residency status in part
due to their having distinctly different sets of alternatives. Thus, we will later return to
examining the post-secondary re-enrollment of non-retainees of the University of Oregon.
Analysis of Graduation Probabilities
Students who are identified as at risk could receive some intervention on the part of the
University. However, before an institution would potentially find it worthwhile to spend
resources on an intervention for at-risk students it would be important to know if they are,
in fact, less likely to graduate. To examine the correlation between risk of attrition and
graduation, we run a probit model with a dependent variable that equals one for five-year
graduates from the 2001 and 2002 cohorts (i.e., those cohorts in which it is possible to
observe 5 year graduation) and that includes the predicted risk categories (excluding the
most at risk group).
The results for the 5 year graduation model are presented in Table 9, by residency
status. As might be expected, patterns in the data indicate that those students who are most
at risk of not returning in the second year are the least likely to graduate in 5 years and the
probability of graduating increases for those who are at lower levels of risk. For example,
Table 8 Realized re-enrollment by deciles of predicted re-enrollment probability, 2001 cohort
Re-enrollment-probabilitydecilesa
Residents Nonresidents
Not retained Retained Total Not retained Retained Total
1st 63 115 178 34 50 84
2nd 18 161 179 16 69 85
3rd 20 158 178 20 64 84
4th 15 164 179 13 72 85
5th 19 160 179 15 69 84
6th 14 164 178 6 79 85
7th 17 162 179 7 77 84
8th 17 161 178 9 76 85
9th 13 166 179 7 77 84
10th 6 173 179 6 79 85
Total 202 1,584 1,786 133 712 845
a The re-enrollment-probability deciles are constructed by ranking the data from the lowest to the highestprobability of retention and then dividing the rank-ordered sample into ten groups of the same size that areordered from the lowest to the highest probability of retention
Res High Educ (2010) 51:546–572 565
123

residents (nonresidents) in the second re-enrollment-probability decile are 25.3 (14.0)
percent more likely to graduate than those in the first decile. Residents (nonresidents) in the
tenth decile are 36.0 (32.2) percent more likely to graduate than those in the first decile.
These findings highlight a possible tradeoff in intervention expenditures. Specifically, the
greatest percentage (and raw number) of non-retainees are in the highest-risk categories,
which suggests a large potential benefit to identifying and treating high-risk students. On
the other hand, the attributes of high-risk students may also imply that it is harder (i.e.,
more costly) to influence their decisions to re-enroll (i.e., they are further from the margin
in terms of interventions influencing their behavior).
Subsequent Post-Secondary Re-enrollment of Non-Retainees
The net cost of attrition depends critically on post-attrition student outcomes, which the
above analysis and most prior work has heretofore largely ignored. For example, if
the most-at-risk students do not drop out of higher education when they fail to return to the
University of Oregon, but simply move to less-selective institutions, then the failure to
Table 9 Graduation within 5 years (2001 and 2002 cohorts)
Residents Nonresidents
Re-enrollment-probability decilea: 1st 0.2438***(0.0195)
0.1323***(0.0416)
Re-enrollment-probability decile: 2nd 0.2723***(0.0172)
0.2436***(0.0318)
Re-enrollment-probability decile: 3rd 0.2986***(0.0150)
0.2364***(0.0325)
Re-enrollment-probability decile: 4th 0.3216***(0.0133)
0.2873***(0.0274)
Re-enrollment-probability decile: 5th 0.3274***(0.0128)
0.3151***(0.0244)
Re-enrollment-probability decile: 6th 0.3323***(0.0125)
0.3019***(0.0258)
Re-enrollment-probability decile: 7th 0.3422***(0.0119)
0.3315***(0.0227)
Re-enrollment-probability decile: 8th 0.3519***(0.0113)
0.3460***(0.0211)
Re-enrollment-probability decile: 9th 0.3601***(0.0109)
0.3179***(0.0241)
Observations 3,630 1,870
Log-likelihood -2,011.26 -1,129.78
Pseudo R-squared 0.12 0.07
The left-hand-side variables include the predicted re-enrollment deciles with the excluded group being thosewith the lowest probability of retention
Standard errors in parentheses. *** P \ 0.01, ** P \0.05, * P \ 0.1a The re-enrollment-probability deciles are constructed by ranking the data from the lowest to the highestProbability of retention and then dividing the rank-ordered sample into ten groups of the same size that areordered from the lowest to the highest probability of retention
566 Res High Educ (2010) 51:546–572
123

retain a student may signal an initial mismatch whereby attrition is an efficient and natural
mechanism in a student-institution sorting process. On the other hand, if there is no
correlation between at-risk status and post-attrition behavior among those who do not
re-enroll, and non-returning University of Oregon students simply exit higher education
altogether, then the failure to be retained does not necessarily indicate a mismatch around
which one should design policy. In either case, it may be worthwhile from the perspective
of the institution to intervene if such costs are less than the costs from attrition. None-
theless, it is important to understand post-retention behavior and its relationship to at-risk
status because the social cost from attrition clearly differs depending on the factors
underlying the retention process.
To examine post-retention behavior, we obtain data from the National Student Clear-
inghouse (NSC), which is a non-profit organization that tracks post-secondary enrollment
for member institutions that presently comprise nearly the entire population of 2 and 4 year
schools.10 Specifically, we used the institutional data of the University of Oregon to
identify all non-returning students and then queried the NSC for whether they were found
to be attending any other 2 year or 4 year institution. We classify all non-returning students
not found in a 2 year or 4 year NSC-affiliated institution as ‘‘Out of School.’’ We then
restrict our immediate attention to considering whether the student is found in the NSC in
the subsequent term. As such, being classified as ‘‘Out of School’’ does not necessarily
imply that a student is never to be found in the NSC. Moreover, it is possible for some
students who are identified as ‘‘Out of School’’ to be, in fact, attending one of the small
number of institutions not included in the NSC.
With these caveats in mind, Table 10 reports the known outcomes of all attrition losses
occurring for resident and nonresident students over the first summer. Panel A in Table 10
reports the known outcomes of all attrition losses occurring for residents over the first
summer. For example, the first row of Table 10 shows that for the 407 students who exited
the University of Oregon from the most-at-risk groups within the 2001–2006 cohorts (i.e.,
students at the tenth percentile or below), 43.2% (176) were subsequently enrolled in
2 year schools, 8.5% (35) were subsequently enrolled in other 4 year schools, and 48.2%
(196) appeared to have left higher education. This compares to 50 students who exited the
University of Oregon from the least-at-risk group (i.e., students at or above the 90th
percentile of retention probability), where 4.0% (2) were subsequently enrolled at 2 year
schools, 52.0% (26) were subsequently enrolled at other 4 year schools, and 44.0% (22)
were found to have left higher education.
In general, the results show that the percent of non-returning students attending 2 year
institutions or dropping out of higher education appears to increase with the attrition risk,
whereas the percentage subsequently attending other 4 year institutions tends to decrease
with the risk-of-attrition. These findings are consistent with Light and Strayer (2000) and
Kerkvliet and Nowell (2005) who show that re-enrollment responds to the opportunity cost
of alternative choices, which vary across institution types. Moreover, they highlight a
potential concern in attempting to retain at-risk students as it suggests that at least some
non-retained students may not be well matched to a 4 year institution such as the Uni-
versity of Oregon. In particular, attrition and re-enrollment in 2 year institutions, or exiting
higher education altogether, is a realization that could best serve the student. On the other
hand, those residents who leave the University of Oregon to attend a competing 4 year
institution may be better served by staying at the University of Oregon if an effective
10 The NSC maintains a list of participating institutions (i.e., 3,300 as of 15 July 2008) and their associateyears of initial participation at http://www.studentclearinghouse.org/colleges/.
Res High Educ (2010) 51:546–572 567
123

intervention was administered. It follows that any retention policy should consider stu-
dents’ interests, which need not align with those of the institution trying to retain the
student.11
Panel B of Table 10 reports the known outcomes of all attrition losses occurring for
nonresidents over the first summer. For example, the first row of Panel B of Table 10
shows that for the 210 students who exited the University from the most-at-risk groups
within each of the 2001–2006 cohorts (i.e., those at the tenth percentile or below), 38.1%
(80) were subsequently enrolled at 2 year schools, 10.9% (23) were subsequently enrolled
at other 4 year schools, and 51.0% (107) appeared to have left higher education. This can
be compared to 37 students who exited the University from the group of students with the
lowest likelihood of leaving within the 2001–2006 cohorts (i.e., those above the 90th
percentile), where 21.6% (8) were subsequently enrolled at 2 year schools, 54.1% (20)
Table 10 Realized re-enroll-ment by deciles of predicted re-enrollment probability, 2001–2006 cohorts
a The re-enrollment-probabilitydeciles are constructed byranking the data from the lowestto the highest probability ofretention and then dividing therank-ordered sample into tengroups of the ‘‘same size’’ thatare ordered from the lowest to thehighest probability of retention
Re-enrollment-probability decilesa
2 yearschools
4 Yearschools
Out ofschool
Total
Panel A: Residents
1st 176 35 196 407
2nd 35 41 54 130
3rd 36 36 54 126
4th 37 36 32 105
5th 18 43 43 104
6th 14 43 32 89
7th 11 42 41 94
8th 9 32 20 61
9th 5 38 24 67
10th 2 26 22 50
Total 343 372 518 1,233
Panel B: Non residents
1st 80 23 107 210
2nd 28 25 51 104
3rd 16 27 40 83
4th 16 37 25 78
5th 15 14 37 66
6th 14 24 22 60
7th 11 24 22 57
8th 5 24 27 56
9th 12 17 25 54
10th 8 20 9 37
Total 205 235 365 805
11 A more detailed breakdown of the institutions that non-returning residents attend when exiting theUniversity of Oregon clearly shows that most non-returning resident students attend other in-state institu-tions. The most numerous include the two-year institutions of Lane Community College (131 students),Portland Community College (81) and Clackamas Community College (24) and including the four-yearinstitutions of Portland State (111), Oregon State (86), and Southern Oregon University (34). This suggeststhat some of the issues relating to match may well be beyond the control of the University of Oregon ifstudents are returning to institutions that may be closer to home and/or family support networks.
568 Res High Educ (2010) 51:546–572
123
were subsequently enrolled at other 4 year schools, and 24.3% (9) were found to have left
higher education.
Overall, and consistent with the findings for residents, the results show that the percent
of non-returning students attending 2 year institutions or dropping out of higher education
appears to increase with the risk of attrition, whereas the percentage attending other 4 year
institutions tends to decrease with the risk of attrition. It follows that the possible mis-
alignment between student and institutional interests remains for nonresidents. However,
the percentage of nonresident students who exit the University of Oregon for other 4 year
institutions is substantially higher than for resident students, particularly for those most at
risk of attrition. This finding suggests that the University of Oregon may benefit most from
treating nonresidents who are at risk of attrition but nonetheless demonstrate some degree
of attachment to 4 year institutions.12
Policy Remarks
Overall, we find that at-risk students can be identified using accessible statistical models
and information available at the time a student enrolls and that observed performance in
college improves the model’s ability to predict retention. Together, this implies that there
is a tradeoff between early identification/intervention and the information gained by
including additional data that becomes available as the student matriculates through
school.
Our early-career models are used to group students by risk of attrition, which correlates
with future attrition up through graduation. Consistent with theoretical expectations, pre-
dicted retention grows with student experiences that increase integration such as partici-
pation in Freshman Interest Groups and the Honors College. However, for non-returning
resident and nonresident students, spring-to-fall transitions are found to be the most con-
centrated points of attrition. As the percent of exiting students who subsequently attend
2 year institutions or dropout increases with the risk-of-attrition, our findings broadly
suggest that some non-returning students may be mismatched, which may tend to manifest
itself most when the student is away from the institution during the summer.
The fact that at-risk status can be identified before a student arrives on campus suggests
that these models can be used to inform the admissions decision and improve the match
between the student and institution. In particular, admissions offices frequently use a point
system that assigns explicit weight or points to desired attributes that are used to determine
the admissions decision. Such a point system could assign points based on whether a
student’s predicted probability of retention crosses a desired threshold by the institution.
For example, if an institution has an aspiration to obtain a 90% retention rate, the
admissions point system could assign positive points to those student who have a
12 A more detailed breakdown of the institutions that non-returning nonresidents attend when exiting theUniversity of Oregon shows far less concentration in a particular set institutions. However, 47 non-residentstudents were found at Lane Community College and 9 were found at Portland Community College,indicating that some non-returning nonresidents may be motivated in ways other than geography and/or out-of-state tuition premiums. For out-of-state schools, the largest concentration of non-returning studentsattending two-year schools are found in California (e.g., 10 students at Santa Barbara City College andDiablo City College) reflecting the historically high contribution of California students attending the Uni-versity of Oregon. On the other hand, the greatest concentration of non-returning nonresidents can be foundat the University of Colorado (18), University of Hawaii (10), and Colorado State University (9), suggestingthat the motivation for nonresident students leaving the University of Oregon for two-year versus four-yearinstitutions may be quite different.
Res High Educ (2010) 51:546–572 569
123
predicated probability of retention of 90% or higher. Although countervailing factors to
retention that are consistent with institutional priorities may also weigh into an admissions
point system (e.g., first-generation status), explicitly incorporating retention probabilities
would move the process toward admitting a class that is individually and collectively more
likely to succeed once admitted.
Likewise, once a student has arrived on campus, a risk analysis could be used to shape
how students are advised. In particular, students who are identified as retention risks prior
to showing up to campus could be given more comprehensive advising designed to mit-
igate the risk factors regarding retention. Although prior work suggests that what happens
to students after enrolling is more influential in their persistence decisions than charac-
teristics that they bring with them to college (e.g., Pascarella and Terenzini 2005), our
findings suggest that students who are predicted to be at-risk based on their student
attributes remain so throughout their college career. Thus, predictive models can poten-
tially be useful in identifying tendencies to respond adversely to the complex set of post-
enrollment factors that affect retention such that systems designed to improve retention at
an institution could potentially be more optimally employed. Of course, risk assessment
can be updated as the student progresses through school such that students whose revealed
decisions and observed performance change their risk of attrition receive advising that
reflects their risk status. Thus, a retention model can be used to identify who among a class
may require intervention at various stages of their college career.
Ultimately, while a student’s retention risk can be estimated, it remains unclear whether
an intervention in the form of a discrete adjustment in best practices would induce these at-
risk students to stay and, if so, whether benefits exceed the costs of such an intervention.
Moreover, whether interventions should take the form of marginal adjustments in best
practices or broader systemic reform that attempt to tackle the multiple factors that
influence withdrawal decisions is an open question. An obvious extension to this research
exercise is to conduct controlled experiments that examine the efficacy of interventions in
improving retention, where treatments could take the form of discrete adjustments to
existing practices or more holistic systemic changes.
For example, one might consider estimating such a retention model on the observed
retention patterns in earlier cohorts of students in order to predict the retention probabilities
of an incoming class of fall-term freshman. All fall-term freshmen can then be sorted into
deciles by these predicted retention probabilities. Within each of the deciles—each having
similar predicted likelihoods of retention—some students could then be randomly selected
to receive one of a set of alternative treatments, with others in that same group acting as
untreated ‘‘controls’’ against which deviations in their realized attrition can be measured.
Only in this way would policy makers later have the ability to evaluate the efficacy of their
interventions and the cost per student retained over and above what would have been
predicted.
The advantage of a controlled but locally randomized approach to the allocation of
available resources is that it will have the additional benefit of providing insight into how
to best target limited funds in the future, improving overall retention efforts. Such infor-
mation could be used to improve future retention efforts that may then be much more
broadly applied with the added confidence of having demonstrated efficacy. This type of
research is essential because while there is growing evidence of the factors that determine
retention, there is no concrete evidence on whether institutional retention efforts can
reduce attrition and whether these efforts are cost effective from an institutional or social
perspective.
570 Res High Educ (2010) 51:546–572
123

References
Bar, T.R., Kadiyali, V. & Zussman, A. (2008). Quest for knowledge and pursuit of grades: information,course selection, and grade inflation. Johnson School Research Paper Series No. 13-07.
Bean, J. (1978). Dropouts and turnover: The synthesis of a causal model of student attrition. DoctoralDissertation, University of Iowa, Iowa City, Iowa.
Bean, J. (1983). The application of model of turnover in work Organizations to the student attrition process.Review of Higher Education, 6(2), 129–148.
Cabrera, A. F., Nora, A., & Castaneda, M. B. (1993). College persistence: Structural equations modeling testof an integrated model of student retention. Journal of Higher Education, 64(2), 123–139.
Caison, A. (2007). Analysis of institutionally specific retention research: a comparison between survey andinstitutional database methods. Research in Higher Education, 48(4), 435–451.
Curs, B. R., & Singell, L. D. (2002). An analysis of the application process and enrollment demand forinstate and out-of-state students at a large public university. Economics of Education Review, 21(2),111–124.
DesJardins, S. L., Ahlburg, A. A., & McCall, B. P. (1999). An event history model of student departure.Economics of Education Review, 18(3), 375–390.
DesJardins, S. L., Ahlburg, A. A., & McCall, B. P. (2002a). Simulating the longitudinal effects of changes infinancial aid on student departure for college. Journal of Human Resources, 37(3), 653–679.
DesJardins, S. L., Ahlburg, A. A., & McCall, B. P. (2002b). A temporal investigation of factors related totimely degree completion. The Journal of Higher Education, 73(5), 555–581.
DesJardins, S. L., & Wang, J. (2002). An analytic model to assist academic advisors. NACADA Journal(Journal of the National Academic Advising Association), 22(1), 32–44.
Gino, F., Moore, D.A., Swift, S.A. & Sharek, Z.S. (2007). Correspondence bias in performance evaluation:Why grade inflation works. Cornell working paper.
Guarino, A. J., & Hocevar, D. (2005). Tinto’s model and locus of control. College and University, 80(4),43–44.
Hotchkiss, J. L., Moore, R. E., & Pitts, M. M. (2002). Freshman learning communities, college performance,and retention. Education Economics, 14(2), 197–200.
James, E. (1988). Student aid and college attendance: Where are we now and where do we go from here?Economics of Education Review, 7(1), 1–13.
Langbein, L. I., & Snider, K. (1999). The impact of teaching on retention: Some quantitative evidence.Social Science Quarterly, 80(3), 457–472.
Light, A. (1995). The effect of interrupted schooling on wages. Journal of Human Resources, 30(3),472–502.
Light, A. (2002). From Bakke to Hopwood: Does race affect college attendance and completion? Review ofEconomics and Statistics, 81(4), 33–44.
Light, A., & Strayer, W. (2000). Determinants of college completion. Journal of Human Resources, 35(2),299–332.
Miller, T. E., & Tyree, T. M. (2009). Using a model that predicts individual student attrition to intervenewith those who are most at risk. College & University, 84(3), 12–19.
Murtaugh, P., Burns, L., & Schuster, J. (1999). Predicting the retention of university students. Research inHigher Education, 40(3), 355–371.
Pascarella, E. T., & Terenzini, P. T. (2005). How college affects students: A third decade of research (Vol.2). Indianapolis, Indiana: Jossey-Bass.
Robst, J., Keil, J., & Russo, D. (1998). The effect of fender composition of faculty on student retention.Economics of Education Review, 17(4), 429–439.
Singell, L. D., Jr. (2004). Come and stay a while: does financial aid effect retention conditioned onenrollment at a large public university? Economics of Education Review, 23(2), 459–471.
Singell, L. D., Jr., & Stater, M. (2006). Going, going, gone: The effects of aid policies on graduation at threelarge public universities. Policy Science, 39(3), 379–403.
St. John, E. P. (1990). Price response in enrollment decisions: An analysis of the high school and beyondsophomore cohort. Research in Higher Education, 31(2), 161–176.
St. John, E. P. (2003). Refinancing the college dream: Access, equal opportunity, and justice for taxpayers.Baltimore and London: Johns Hopkins University Press.
Stratton, L., O’Toole, D., & Wetzel, J. (2007). Are the factors affecting dropout behavior related to initialenrollment intensity for college undergraduates? Research in Higher Education, 48(4), 453–485.
Stratton, L., O’Toole, D., & Wetzel, J. (2008). A multinomial logit model of college stopout and dropoutbehavior. Economics of Education Review, 27(3), 319–331.
Res High Educ (2010) 51:546–572 571
123

Terenzini, P., Springer, L., Yaeger, P., Pascarella, E. T., & Nora, A. (1996). First generation collegestudents: Characteristics, experiences, and cognitive development. Research in Higher Education,37(1), 1–22.
Tinto, V. (1975). Dropout from higher education: A theoretical synthesis of recent research. Review ofEducational Research, 45(1), 89–125.
Tinto, V. (1987). Leaving college: Rethinking the causes and cures of student attrition. Chicago, IL: TheUniversity of Chicago Press.
Wetzel, J. N., O’Toole, D., & Peterson, S. (1999). Factors affecting student retention probabilities: a casestudy. Journal of Economics and Finance, 23(1), 45–55.
572 Res High Educ (2010) 51:546–572
123