modeling ofradiation-induced dimensional
TRANSCRIPT

저 시-비 리- 경 지 2.0 한민
는 아래 조건 르는 경 에 한하여 게
l 저 물 복제, 포, 전송, 전시, 공연 송할 수 습니다.
다 과 같 조건 라야 합니다:
l 하는, 저 물 나 포 경 , 저 물에 적 된 허락조건 명확하게 나타내어야 합니다.
l 저 터 허가를 면 러한 조건들 적 되지 않습니다.
저 에 른 리는 내 에 하여 향 지 않습니다.
것 허락규약(Legal Code) 해하 쉽게 약한 것 니다.
Disclaimer
저 시. 하는 원저 를 시하여야 합니다.
비 리. 하는 저 물 리 목적 할 수 없습니다.
경 지. 하는 저 물 개 , 형 또는 가공할 수 없습니다.
I
Doctoral Thesis
Modeling of Radiation-induced Dimensional Instability of Metals and Alloys in Nuclear Systems:Improved Understanding of the Stress and Alloying
Elements Effects by Rate Theory
Sang Il Choi
Department of Nuclear Engineering
Graduate School of UNIST
2019

II
Modeling of Radiation-induced Dimensional Instabilityof Metals and Alloys in Nuclear
Systems: Improved Understanding of the Stress and Alloying Elements Effects by Rate Theory
Sang Il Choi
Department of Nuclear Engineering
Graduate School of UNIST

III
Modeling of Radiation-induced Dimensional
Instability of Metals and Alloys in Nuclear
Systems: Improved Understanding of the Stress
and Alloying Elements Effects by Rate Theory
A thesis/dissertation
submitted to the Graduate School of UNIST
in partial fulfillment of the
requirements for the degree of
Doctor of Philosophy
Sang Il Choi
12/06/2018
Approved by
_________________________
Advisor
Prof. Ji Hyun Kim

IV
Modeling of Radiation-induced Dimensional
Instability of Metals and Alloys in Nuclear
Systems: Improved Understanding of the Stress
and Alloying Elements Effects by Rate Theory
Sang Il Choi
This certifies that the thesis/dissertation of Sang Il Choi is approved.
12/06/2018
________________________
Advisor: Ji Hyun Kim
_________________________
Junhyun Kwon
_________________________
Chi Bum Bahn
_________________________
Sangjoon Ahn
_________________________
Jaeyeong Park

V
Abstracts
Historically a rate theory is one of the most favorite modeling methodologies to simulate the radiation
effects on structural materials for nuclear reactors. The easy usability of rate theory, caused by various
simplification, could help many researchers to grasp fundamental the understanding. However,
simplification in rate theory gives not only easy accessibility but also inaccurate information. Various
effect such as alloying element, stress, and cascade effect were neglected because lattice distortion
could not be directly considered. Hence, in this paper, to overcome the simplification of rate theory,
two approaches had been applied to enhance the performance of the rate theory. In the first approach,
detail behavior of defect, which is derived by the state of art simulation tools, were adopted in
diffusion coefficient under the stress and alloying element condition. In the second, cascade effect on
sink annihilation was considered by a fitting method from the experimental observation.
The stress effect on interstitial diffusivity also recently studied by MD simulations. C. Kang and M.
Banislaman show that migration energy of interstitial and its clusters is reduced by applied stress in
iron. Hence in this study, irradiation swelling, and creep is predicted by considering the recent
calculation result. In ultra-long fuel cycle condition, hoop stress could be nearly up to 600 MPa. By
MD simulation it was observed that diffusivity of interstitial has 8.437×10⁻⁵ cm2 /s at 873 K. This
value was 11 times higher than non-stress applied condition (7.414×10⁻⁶ cm2 /s).
In detail, M. Christensen reveals that Nb decreases the interstitial diffusivity nearly 1/5.64 at 500 K
and 1/5.88 at 700 K with 0.5 % Nb in zirconium. Also, the same method was applied to account the
Sn effect. Sn shows the high dependency with temperature and relatively less effect than Nb.
Interstitial diffusivity is decreased about 1/4.05 at 500 K and 1/1.38 at 700 K with 2.5 Sn. This
information was adopted in rate theory and then irradiation growth was predicted. By adding 0.5 %
Nb in cold-worked zirconium, 0.2 % strain is obtained whilst cold-worked pure zirconium shows
nearly 0.3 % strain at 10 dpa. Since there was no experiment about irradiation growth of Zr-0.5Nb,
Zr-2.5Nb experimental result was compared with simulation results.
In case of cascade annihilation of sinks, there is no study including theoretical method. However, by F.
Garner, it was experimentally observed that network dislocation density of iron-based alloy is
saturated nearly 1011 cm2 no matter how fabrication process is applied to the specimen. Hence by the
fitting method, sink annihilation rate by cascade is adopted in rate theory. As results, irradiation
swelling rate is decreased by nearly 30 % compared with non-considering the cascade annihilation of
sink case.

VI
Until now, three representative types of rate theory were developed in the research area of radiation
effect; these are SRT, CDM, and PBM. In case of SRT and CDM, there is no big difference except the
consideration of cluster number density. However, there is a large gap between PBM and SRT/CDM
because 1-D reaction kinetics, caused by mobile interstitial cluster, is accounted in PBM.
Since the purpose of this dissertation is an improvement of scientific understanding of the RIDI
behavior within rate theory frames, there was attempting to verify the stress and alloy element effect
between SRT and PBM in zirconium, and between CDM and PBM in iron. However, unfortunately, in
case of zirconium, PBM could not be carried out because many parameters for cluster such as
migration, formation, and binding energy are not discovered. Hence, stress and alloy element effect
were verified only in SRT. In case of an iron-based alloy, since there was significant progress about
study of defect behavior, stress and alloy effect could be examined in between CDM and PBM.
There was also a conventional way to account the stress and alloy element effect. To improved
scientific understanding, the result of the conventional method and results of this work are compared
in the discussion chapter. Therefore, the result of this study could enhance the fundamental
understanding of radiation effect on structural materials because various effects were considered
within various rate theory frame.

VII
To My Mother, Do Young Lee

VIII
Table of Contents
Abstracts .......................................................................................................................................... V
Table of Contents ......................................................................................................................... VIII
List of figures .................................................................................................................................XII
List of tables...................................................................................................................................XV
Abbreviation ................................................................................................................................ XVI
I Introduction ............................................................................................................................... 1
I.1 Research background: .............................................................................................................. 1
I.2 First discovery of RIDI............................................................................................................. 3
I.3 A brief history of development of cladding materials ................................................................ 4
I.4 Anisotropy materials: Zirconium alloy...................................................................................... 5
I.5 Isotropy materials: Iron-based alloy .......................................................................................... 6
I.6 History of radiation effect modeling ......................................................................................... 7
I.6.1 Particle reaction kinetics .................................................................................................... 7
I.6.2 Defect reaction rate theory ................................................................................................. 9
II Problem statement ................................................................................................................... 11
II.1 Limitation of radiation damage quantification........................................................................ 11
II.1.1 Primary radiation damage ............................................................................................... 13
II.2 Limitation of rate theory........................................................................................................ 16
II.2.1 Mean-field approximation .............................................................................................. 16
II.2.2 New research trend for limitation of rate theory .............................................................. 17
III Rationale and Approach........................................................................................................... 18
III.1 Research goal....................................................................................................................... 18
III.2 Research tools...................................................................................................................... 19

IX
III.2.1 Cluster dynamic modeling............................................................................................. 20
III.2.2 Production bias modeling .............................................................................................. 22
III.2.3 MD simulation & First principle.................................................................................... 24
III.3 Approach and Method.......................................................................................................... 25
III.3.1 Definition of the diffusion ............................................................................................. 25
III.3.2 Normal distribution of particle....................................................................................... 26
III.3.3 Sink strength ................................................................................................................. 28
III.3.4 The connection between sink size and RIDI................................................................... 30
III.3.5 Stress effect on RIDI with the traditional method........................................................... 32
III.3.6 Stress effect on RIDI with a recent method.................................................................... 33
III.3.7 Alloy effect on RIDI with the traditional method ........................................................... 34
III.3.8 Alloy effect on RIDI with a recent method .................................................................... 35
III.3.9 Cascade effect on defect generation rate and sink density .............................................. 35
III.4 Computer code implementation............................................................................................ 37
IV Results – Zirconium and its alloys............................................................................................ 39
IV.1 The methodology of irradiation growth modeling................................................................. 39
IV.1.1 Rate equation of single crystal & polycrystal ................................................................. 39
IV.2 Fundamental parameters ...................................................................................................... 42
IV.3 Irradiation growth modeling of single crystal ....................................................................... 44
IV.3.1 Average strain value for single crystal ........................................................................... 44
IV.3.2 Strain equation for single crystal ................................................................................... 45
IV.4 Irradiation growth modeling of polycrystal........................................................................... 47
IV.4.1 Anisotropy factor for polycrystal................................................................................... 47
IV.4.2 Strain equation for polycrystal....................................................................................... 47

X
IV.5 Results of irradiation growth modeling ................................................................................ 49
IV.5.1 Single crystal ................................................................................................................ 49
IV.5.2 Cold worked polycrystal ............................................................................................... 55
IV.5.3 Annealed polycrystal..................................................................................................... 58
IV.6 Stress effect on zirconium.................................................................................................... 63
IV.7 Alloy effect on zirconium .................................................................................................... 65
IV.8 Limitation of SRT frame and PBM approach as a possible breakthrough.............................. 67
V Results – Iron and its alloys ..................................................................................................... 69
V.1 Methodology of iron-based alloy modeling ........................................................................... 69
V.1.1 Rate equation of pure iron .............................................................................................. 69
V.2 Fundamental parameters ....................................................................................................... 71
V.3 Irradiation swelling modeling................................................................................................ 73
V.4 Results of irradiation swelling modeling................................................................................ 74
V.4.1 Pure iron ........................................................................................................................ 74
V.5 Stress effect on iron .............................................................................................................. 79
V.6 Alloy effect on iron............................................................................................................... 82
V.7 Cascade effect on iron........................................................................................................... 84
V.8 Limitation of CDM frame and PBM approach as a possible breakthrough ............................. 85
VI Discussion ............................................................................................................................... 87
VI.1 Parametric study .................................................................................................................. 88
VI.1.1 Defect generation rate ................................................................................................... 88
VI.1.2 Diffusivity .................................................................................................................... 88
VI.1.3 Bias factor..................................................................................................................... 93
VI.1.4 Sink density .................................................................................................................. 93

XI
VI.2 Path forward ........................................................................................................................ 95
VI.2.1 Reaction kinetics of defects........................................................................................... 95
VI.2.2 Frame of rate theory (SRT vs CDM vs PBM)................................................................ 96
VI.2.3 Cluster number density.................................................................................................. 96
VI.2.4 He effects on iron-based alloy ....................................................................................... 97
VI.2.5 Stochastical fluctuation ................................................................................................. 97
VI.2.6 Residual stress .............................................................................................................. 97
VII Conclusion .............................................................................................................................. 98
VII.1 Zirconium and its alloys ..................................................................................................... 99
VII.2 Iron-based alloy................................................................................................................ 101
References..................................................................................................................................... 103
Acknowledgment .......................................................................................................................... 108

XII
List of figures
Figure II.1.1 Visualization of the reaction mechanism of each time sequence.................... 12
Figure III.2.1 Schematic of cluster dynamic modeling ...................................................... 21
Figure III.2.2 Schematic of cluster evolution .................................................................... 21
Figure III.2.3 Schematic of production bias modeling....................................................... 24
Figure III.3.1 Problem of 1-dimension diffusion ............................................................... 26
Figure III.3.2 Solution of 1-dimension diffusion problem ................................................. 27
Figure III.3.3 Spherical mass balance system for void sink strength .................................. 28
Figure III.3.4 Cylindrical mass balance system for dislocation sink strength ..................... 29
Figure III.3.5 Modified master equation by considering the cascade annihilation of sink... 36
Figure III.4.1 Schematic diagram of code implementation ................................................ 38
Figure IV.3.1 Schematic of main sinks in zirconium by SRT............................................. 44
Figure IV.5.1. Radiation-induced (a) point defect concentrations, and (b) net defect flux to
dislocation loops in single-crystal zirconium at 553 K............................................... 50
Figure IV.5.2. Sink information of (a) number density, (b) average radius, and (c) sink
strength in single-crystal zirconium at 553 K ............................................................ 53
Figure IV.5.3. Modeled and experimental irradiation growth strain in single-crystal
zirconium at 553 K................................................................................................... 54
Figure IV.5.4. Radiation induced (a) defect concentrations, and (b) net defect flux to
dislocation line in cold-worked polycrystal zirconium at 553 K................................. 56
Figure IV.5.5. Sink strength in in cold-worked polycrystal zirconium at 553 K ................. 57
Figure IV.5.6. Modeled and experimental irradiation growth strain in cold-worked
XIII
polycrystal zirconium at 553 K ................................................................................. 58
Figure IV.5.7. Radiation-induced (a) defect concentrations, and (b) net defect flux to
dislocation loops and grain boundary in annealed polycrystal zirconium at 553 K ..... 59
Figure IV.5.8. Sink information of (a) number density, (b) average radius, and (c) sink
strength in annealed polycrystal zirconium at 553 K ................................................. 61
Figure IV.5.9. Modeled and experimental irradiation growth strain in annealed polycrystal
zirconium at 553 K................................................................................................... 62
Figure IV.6.1 Stress effect on irradiation creep in cold-worked polycrystal zirconium at 553
K.............................................................................................................................. 64
Figure IV.7.1. Nb effect on irradiation growth in cold-worked polycrystal zirconium at 553
K.............................................................................................................................. 66
Figure IV.7.2. Sn effect on irradiation growth in cold-worked polycrystal zirconium at 553
K.............................................................................................................................. 66
Figure IV.8.1. Schematic of the main sinks in zirconium by PBM..................................... 67
Figure IV.8.2 Vacancy cluster concentration in cold-worked polycrystal zirconium at 553 K
by PBM.................................................................................................................... 68
Figure IV.8.3 Interstitial cluster concentration in cold-worked polycrystal zirconium at 553
K by PBM ................................................................................................................ 68
Figure V.4.1 Vacancy and its cluster concentrations in iron at 700 K ................................. 75
Figure V.4.2 Interstitial and its cluster concentrations in iron at 700 K .............................. 75
Figure V.4.3 Dislocation loop and void radius in iron by logarithmic scale at 700 K.......... 77
Figure V.4.4 Dislocation loop and void radius in iron by linear scale at 700 K .................. 77
Figure V.4.5 Irradiation swelling behavior in iron at 700 K............................................... 78
Figure V.5.1 Stress effect on irradiation creep in iron at 873 K and 600 MPa. ................... 81

XIV
Figure V.6.1 Precipitation effect on point defect concentration in iron at 700 K................. 82
Figure V.6.2 Precipitation effect on irradiation swelling in iron......................................... 83
Figure V.7.1 Cascade annihilation effect on irradiation swelling in iron at 700 K .............. 84
Figure V.8.1 Stress effect on irradiation swelling behavior in iron by PBM ....................... 86
Figure VI.1.1 Brailsford method vs modified Brailsford method....................................... 90
Figure VI.1.2 Calculation result by Brailsford method and modified Brailsford method in
iron at 700 K ............................................................................................................ 91
Figure VI.1.3 Defect concentration behavior in iron by a conventional method................. 92
Figure VI.1.4 Defect concentration behavior in iron by this work ..................................... 92

XV
List of tables
Table IV.2.1 Input parameters ........................................................................................... 43
Table V.2.1 Input parameters ............................................................................................ 72
Table V.5.1 Diffusion coefficient by stress effect by MD simulation.................................. 81
Table V.8.1 Various rate theory study about iron-based alloy steel..................................... 85
Table VI.2.1 Defect reaction kinetics ................................................................................ 95

XVI
Abbreviation
1-D: One dimensional
3-D: Three dimensional
CDM: Cluster dynamic modeling
CP-3: Chicago pile-3
DAD: Diffusion anisotropy difference
FBR: Fast breeder reactor
NRL: Northern research laboratories
MSD: Mean square displacement
PBM: Production bias modeling
PWR: Pressurized water reactor
RIDI: Radiation-induced dimensional instability
SIPG: Stress-induced preferred growth
SPIA: Stress preferential induced attraction
SPIN: Stress induced preferred nucleation
SRT: Standard rate theory
TDE: Threshold displacement energy
UKAEA: Atomic energy authority in UK

1
I Introduction
I.1 Research background:
In nuclear engineering history, aluminum, zirconium, and iron are firstly considered as cladding
materials. Until now, these materials are still used for cladding because the properties of each material
are optimized in various aspects. There were numerous attempts to development a new advance alloy
system over the 70 decades. As a result, Oxide dispersion-strengthened alloy, high entropy alloy,
functional grade materials and Sic composite are considered as candidate materials for cladding of
next-generation nuclear reactor. However, despite these efforts, there are limitations to replace the
conventional materials by new alloy system because verification is needed to confirm that new alloy
system could maintain adequate properties such as ductility, compatibility, weldability, toughness,
mechanical, corrosion resistant, irradiation resistant and thermal conductivity.
In this circumstance, a fundamental understanding of the radiation effect on conventional materials
could be a valuable study in an engineering point of view. Among the various radiation effects on
materials, Radiation-Induced Dimensional Instability (RIDI) is one of the most important factors for a
design principle. Therefore, the objective of this thesis dissertation is the improvement of the
scientific understanding of the RIDI behavior of cladding and structural materials in various reactor
conditions for the development of a prediction model of RIDI.
In specifically, the RIDI behavior of zirconium and its alloys were investiged for pressure tube
condition in CANDU reactor. In case of iron and its alloys, environmental condition were assumed as
that of Fast Breeder Reactor (FBR). Irradiation growth and creep of Zr-2.5Nb pressure tube determine
the life of the CANDU reactor. Hence simulation result of this study could contribute to the safety
analysis of CANDU rector with fundamental understating. Not only zirconium and its alloys but also
iron and its alloys are important issued as cladding materials in FBR. Hence this study could
contribute the safety analysis of cladding materials.
Until now, many types of researches about RIDI have been carried out. There are significant progress
about rate theory including the development of Production Bias Modeling (PBM) [1], Diffusion
Anisotropy Difference (DAD) [2], and Cluster Dynamic Modeling (CDM) [3]. Nevertheless, there is
no general model to explain RIDI because too many parts of defect behavior remain with un-known.
In detail, the scientific understanding of defect reaction kinetics should be defined in various
environment situations. However, only limited information about alloy element and stress effect on
defect behavior is revealed in irradiation situation. Moreover, cascade effects on defect generation or

2
sink annihilation had not been studied extensively. Hence in this study, to grasp the improved the
fundamental understanding, RIDI was calculated by combining between various rate theory and the
recent results of state of art simulation tools.
3
I.2 First discovery of RIDI
The first historical discovery of RIDI is from the fissile material such as uranium and plutonium.
Radiation-induced anisotropic swelling was firstly confirmed in uranium rod in the 1950s and then
subsequently degradation of cladding materials was also found in 1960s [4]. Before the radiation-
induced degradation is discovered, those kinds of the phenomenon are already predicted by Wigner
who is famous for the symmetry principle in quantum physics physic. It was an obviously predictable
phenomenon because the high energy particle destroys the lattice ordering [5]. In order to confine the
characteristic of uranium deformation, a single crystal of uranium metal was tested. Form the test
results, it was confirmed that the uranium matrix is elongated by <010> direction and shorten by
<100> direction.
Subsequently, irradiation creep and growth of cladding materials were discovered and then other
structure materials for nuclear power plants could gain research interest. In the early 1960s, RIDI of
iron-based materials was firstly confirmed by an experiment. In 1967, the swelling phenomenon of
stainless steel was firstly figured by Cawthorne [6]. From a few nanometers up to more 150
nanometers, the cavity was founded by an electron.
In case of fuel materials, the degree of radiation damage is much more severe than cladding material
because not only neutron but also fission fragments bombard the lattice ordering. Hence irradiation
swelling is unavoidable phenomena in nuclear fuel system [7]. However, in the case of cladding
materials, depend on based metal, the volume could be conserved, i.e. irradiation swelling could not
occur. By experimental observation, it was confirmed that there are three representative dimensional
changes by radiation in cladding materials [8]. Those are irradiation growth, swelling, and creep.
These dimensional changes are classified by volume and stress.
1. Irradiation growth is volume conservative distortion without applied stress;
2. Irradiation swelling is the isotropic volume expansion without any applied stress;
3. Irradiation creep is the volume conservative distortion by the applied stress.

4
I.3 A brief history of development of cladding materials
The first modern type cladding was an aluminum alloy in Chicago pile-3 (CP-3) because aluminum
has fairly good properties as structural materials at low-temperature condition (However, the poor
corrosion properties of aluminum lead to its replacement at CP-3 condition) [9]. The advantages of
aluminum as structural materials include low mass density, low neutron reaction cross section, high
thermal conductivity, and high specific heat. Hence aluminum cladding is still used for research
reactor condition. However, irradiation swelling occurs, and heat conductance is decreased by the
accumulation of radiation damage.
The iron-based alloy was chosen as cladding material because chrome element could increase
corrosion resistant with high mechanical strength in high-temperature condition. From the
experimental result of Chicago pile-1, researchers confirmed that neutron chain reaction could be
sustainable and controllable. And then, researchers focus was moved on the development of a new
type of reactor, where fissile materials could consistently be generated for its power resource, i.e.
breeding of fissile materials. As result concept of FBR was developed. Since one of the most
important characteristics of FBR is using the fast neutron, cladding material is exposed in a harsh
radiation condition. SS 316 shows severe irradiation creep and swelling behavior. Depending on
materials properties, irradiation swelling occurred from 5 % to 30 %. Which give motivation for the
researcher to develop a new iron-based alloy. Subsequently advanced iron-based alloy is developed
for cladding candidate materials in FBR. Since in the FBR condition, cladding candidate materials
must maintain corrosion resistant property and reasonable mechanical strength, ferritic martensitic
stainless steel was chosen for cladding material. As results, various type of high chrome steel were
tested in Experiment Breeder Reactor-II [10]. HT-9 maintain its dimensional integrity until 200 dpa.
Early in 1970s navy admire H. Rickover designed the Pressurized Water Reactor (PWR) system to
prevent sodium and water reaction in seawater [11]. Simultaneously, the Kroll process was developed,
and then nuclear grade pure zirconium could be generated. Hence nuclear graded zirconium-based
alloys were chosen for PWR because of excellent corrosion resistant and high neutron resistant
property. After the 1970s, FBR program lost its driving force and then PWR became most dominant
nuclear reactor, hence, a research about the zirconium cladding materials had been overwhelming
more than 4 decades in the cladding research area. However, despite their excellent properties as
structure materials, unlikely iron-based alloy, zirconium has anisotropy properties as hcp structure
hence zirconium shows irradiation growth and creep.

5
I.4 Anisotropy materials: Zirconium alloy
The typical RIDI of anisotropic materials (i.e. zirconium or titanium) is expansion in the a-direction
and contraction in the c-direction, i.e. irradiation growth.
The research history about irradiation growth of zirconium is started by Buckely who firstly suggest
quantitative irradiation growth mechanism by the atomic move in 1969 [12]. After that, principle
researches had been done by Fidleris [13] and Adamson [14]. In 1980s irradiation growth are
systemically organized researched extensively by Northerm Research Laboratories (NRL) of Atomic
Energy Authority in UK (UKAEA). For the understanding of the environment (fluence and
temperature) effect on zirconium, three key parameters (temperature, fluenece and materials
properties) are controlled by researchers [15-18]. In detail, experiment had been done by varying the
interest factor while other factors are fixed.
Specifically, to figure out the texture effect on the growth mechanism, researchers examined the
irradiation growth of single crystal. After the analysis of single crystal data, polycrystalline zirconium
and its alloy were also researched with same environment condition. To maintain consistency of
neutron spectrum, irradiation tests were carried out by same reactor, i.e. DIDO reactor
From these experiments, quantitative information was obtained by major parameters. Moreover, sink
morphology change is researched by microstructure analysis, and then the qualitative mechanism was
suggested. Up to now, several experiments of irradiation growth and creep also have been done for
pressure tube [19].
6
I.5 Isotropy materials: Iron-based alloy
For isotropic materials, irradiation swelling is typical RIDI behavior because 3-D vacancy sink is
generated, i.e. void nucleation and growth. There is three distinguished regimes for irradiation
swelling. First stage is void nucleation stage. In this stage, there is no swelling because the relaxation
volume of cluster is very high. However, after this stage, void growth induced the high swelling rate
with exponential form. In the finally stage, steady-state volume expansion occurs because sink density
is saturated.
Historically, RIDI of iron had been independently researched by many different laboratories in various
countries such as U.K, France and U.S.A etc. Representative researchers and laboratories are
E.A.little of UKAEA in UK [20], D.S. Gelles of Hanford Laboratory, F. A. Garner of Pacific
Northwest National Laboratory in USA [10, 21], and D. Gilbon & P. Dubuisson of CEA in France
[22].
Unlike zirconium alloy, there was no systemically organized experimental project for iron-based alloy
because iron-based alloy has many different phases with various alloy composition and fabrication
process. Hence, many laboratories independently investigate the environment or manufacturing effect
on RIDI of the iron-based alloy. With this tendency, void swelling of the iron-based alloy was
examined by alloying element, fabrication process, and environment conditions. For example, the
swelling degree was simply researched by depending on Cr concentration or temperature change or
degree of cold work. Also, austenite and the ferritic material are directly compared to figure out why
ferritic steel has high swelling resistance rather than austenite steel. Lately, it was revealed that the
relaxation volume of bcc ferrite for self-interstitial is larger than that of fcc austenite. Large relaxation
volume means unstable configuration and it induces high mobility. Specifically, it is believed that
migration energy of vacancy in bcc iron has only 0.55 eV whilst that of fcc austenite lattice has 1.4 eV
[23].

7
I.6 History of radiation effect modeling
Like any other theory, the history of rate theory is started from the experimental observation.
Development of fission reactor gives chance to think about radiation interaction with materials. In
detail, to understand RIDI phenomena, point defect reaction with solid are studied. As result, Kinchin
& Pease and NRT model were suggested for the quantification of defect generation. And then, rate
theory which is based on mean field approximation was adopted to predict RIDI. Mansur [24] and
Sizmann [25] are compressively organized the point defect reaction mechanism. Temperature and
fluence effect on dimensional instability were calculated and analyzed. Since the reaction kinetics
between the defect and lattice atom is the heart of chemistry, it was natural that rate theory was
adopted to explain irradiation degradation.
However, in this formulation, which is based on point defect modeling, various radiation-induced
phenomena could not be explained. For example, high swelling rates in low dislocation density, void
swelling near grain boundary, and void lattice formation. The new approach had been introduced by
Woo and Singh to solve these problems. At the first time, the migrating dislocation effect was only
considered. In this approach, interstitial clusters are the only generation and assumed vacancy cluster
are annihilated. Hence this model is named by production bias method. However, it was revealed that
interstitial cluster is mobile itself. Hence 1-D reaction kinetics have been developed and the more
realistic formulation is suggested to replace the traditional rate theory. Although, there were some
limitations of the PBM frame, i.e. swelling saturation or void lattice ordering, Barash and Goloubov
attempt to solve those limitation [26].
Before Mansur and Sizmann summarized and generalized the rate theory, theoretical model of general
reaction kinetic is already developed for various application such as stellar system and biosystem.
Reaction probability could be derived from general reaction kinetic, and then rate theory could be
established. Hence particle reaction kinetics, the central idea of general reaction kinetics, is reviewed.
I.6.1 Particle reaction kinetics
After observation of severe RIDI in cladding materials, rate theory became the most powerful
approach to understand the RIDI. As particle reaction kinetics is the basis of rate theory, prediction or
analysis of radiation defect behavior totally depend on calculated results from particle reaction such as
capture efficient and diffusivity.
Until the 1950s, particle reaction kinetics had been exclusive properties of physics of chemistry or
bioengineering. However, after observation of severe radiation degradation of dimensional instability,

8
this particle reaction kinetics became the most powerful research tool for prediction or analysis of
radiation defect behavior.
The first quantification approach published in 1917 by Smoluchowski and then Waite expanded his
accomplishment with elegant expression [27]. Gosele and Woo are most representative researchers in
reaction kinetics of irradiation defect [2, 28]. Gosele found the generalized reaction formula of
radiation defect. After several years woo development methodology to reflect diffusion anisotropy of
non-cubic structure by changing the normal coordinate system. Also, He successfully predicts
irradiation growth and creeps phenomena base on Gisele's works. Diffusion anisotropy effect on
defect reaction with each type of sinks was systemically organized. Hence behavior of dislocation
loop which is representative radiation sink in zirconium materials had been analyzed with a change of
dimensional instability.
The reaction between the extended sink and mobile defects is one of a special case in particle reaction
kinetics. Hence reaction probability is the most generalized problem and important concern of
reaction kinetics. From Fick’s second law to Smoluchowski boundary condition, simplified
mathematical treatments are well organized. Particle concentration is one of the most important result
which calculated from reaction probability. In the non-production situation, Concentration is simply
decreased isotopically to the other molecular. In the non-cubic system, reaction kinetics need to be
modified probability density
I.6.1.1 Formulation of particle reaction kinetics
In 1957 Waite formulate the general equation for reaction kinetics in condensed materials system [27].
Reaction probability was expressed by define probability distribution as follow
���(��)(��, �; ��)���/� Equation I.6.1
Where ���(��) is probability that �� is in the volume element ��� at ��, � given that �� is at ��
����
��= �
��
���
����+ ����
���� + ����� ���
Equation I.6.2
The average number of pairs having the A in ��� at ��, � given that ��is in ��� at ��, t

9
���(��, ��, �)������ = 1/� � � ���(��, ��, �)
���
�
���
�
������Equation I.6.3
From this problem, a general solution is derived with complicate mathematics by the change of
Cartesian coordinate and new variable
���
��=
���
��= 4���
�������
� ���(�, �) Equation I.6.4
There is three representative boundary condition, one is about equilibrium probability, two is an initial
condition, third is reaction radius condition:
��� → 0 �� � → 0, ���(�, � = 0) = ℎ(�), ���(� = ��, �) = 0 Equation I.6.5
Therefore, the unique solution to this problem is (�� = ��)
1
��=
1
��=
1
���+ � �
2��
(���)��
� ���� Equation I.6.6
Therefore, the unique solution to this problem is (�� ≠ ��)
�� =���
� − ������
�
��� − ��
� exp �−�(��� − ��
�) �1 +2��
(���)��
��
Equation I.6.7
I.6.2 Defect reaction rate theory
The simplest defect rate equation was made by Sizmann [25], from this balance equation model, it
could be calculated that defect concentration in a matrix which could be expressed by three terms. ��
is defect production rate. It could be calculated from ���� term by considering cascade relaxation.
��� is recombination rate which mean vacancy and interstitial are combine and go to perfect lattice
atom, the last term ��� & ��� means that total sink strethe ngths of all the extended defects in the
material. �� and �� are defect concentration of interstitial and vacancy. And ��� is total sink
strength of matrix.

10
Tvo iv i v vs v s
dCK K C C K C C
dt= - - Equation I.6.8
Tio iv i v is i s
dCK K C C K C C
dt= - - Equation I.6.9
Defect rate equation is the mathematical expression of radiation-induced defect quantity and quality.
Hence quantification of radiation-induced defect concentration is the essential part of theoretical
irradiation growth modeling. Therefore, defect rate equation is must need to irradiation growth
modeling. It is researched from uranium to structure materials.

11
II Problem statement
II.1 Limitation of radiation damage quantification
All of radiation-induced phenomenon (creep, segregation, growth and swelling) could be
characterized by two classified parts. The first part, which is called as primary radiation damage, is
occurred below than 10-11 sec [29]. In this time scale, radiation-induced cascade is created and
recovered. This part composed with two sequences. The first sequence could be only explained by
collision theory because neutron has high energy and speed. In detail, the interaction between neutron
and matrix generate the primary knock on atom (PKA). And then PKA interact with the other atom in
the lattice matrix. And then, secondary knock on the atom, ternary knock on the atom are generated.
This phenomenon seems like quite simple. However, lately it will be dealt with NRT model in the
next section, the interaction between atoms is a complex mechanism which includes all radioactive
phenomenon such as electron excitation, Compton scattering, and photoelectronic effect etc. In view
point of displacements, the energy which is not used for displacements could be referred to as
inelastic scattering. And then in the second sequence, cascade relaxation or cascade cooling
phenomenon is occurred from 10-11 sec up to 10-8 sec when most of the defects are annihilated. The
difficulty to calculated survive defect is similar to that of the first sequence, because cascade
relaxation is also too fast, and the atom is fluctuated in a various potential field. In this sequence, the
most defect will be directly or spontaneously annihilated to stabilize each atom’s energy state because
atoms are entangled. Hence the quantification of surviving defect is the hardest part in radiation
damage research and study. Therefore, research about quantitative analysis of RIDI would be valuable
work only if each part could be calculated by probable approach and methodology.
The second part is thermal migration of defects which phenomenon is occurred from 10-8. In this
region, rate theory finally could be used for RIDI. Recombination, clustering, and sink absorption and
& emission occurred by a thermal diffusion mechanism. The relatively second part has been
researched many years than first parts hence many research results are compiled with a systemically
organized approach.
The Defects concentration could be characterized by time which criteria was firstly suggested by
Sizmann. In Figure II.1.1. the reaction mechanism is visualized by time sequence.

12
Figure II.1.1 Visualization of the reaction mechanism of each time sequence

13
II.1.1 Primary radiation damage
There are many factors to occur the RIDI, the fundamental input parameters are environment
variables. Hence the irradiation effect on materials could be analyzed by three environmental
parameters (fluence, stress and temperature) and materials properties. Among these three parameters,
the fluence is a most important parameter in radiation damage because it is the origin all of radiation-
induced phenomena. Hence to quantify the primary radiation damage, the neutron spectrum is
fundamental input information. And then, finally, radiation damage could be quantitively expressed by
using threshold energy and collision theory model, surviving defects could be calculated. There are
various models for radiation damage from NRT to Kinchin and Pease. Nowadays NRT model is most
accepted in world-wide.
II.1.1.1 Limitation of Neutron spectrum calculation
To calculate the primary radiation damage which is occurred up to 10-11 sec, firstly neutron fluence
should be quantified by neutron spectrum. However, this information is beyond of material science
and engineering. The neutron spectrum could be calculated from the research group of the nuclear
reactor physic. There are many codes for neutron physics which in include McCARD and MCNP.
Fortunately, these codes also use Monte Carlo transport method and the calculation result is very
accurate. Therefore, it is obvious that the discrepancy of radiation damage between reality and
simulation does not depend a neutron spectrum.
II.1.1.2 Limitation of Threshold displacement energy (TDE)
Next step to calculate radiation damage is derived the threshold displacement energy (TDE). TDE is
minimum energy to generate defect. This value is change depending on the material. By considering
TDE and neutron spectrum, finally, radiation damage could be quantified. However, it is not an easy
way to determine the exact value of TDE. The state of art technic to calculate the exact value of TDE
must consider all parameters such as the direction of PKA, thermal vibration, and cell size of
simulation etc. This methodology is well described in B. Mosab’s paper [30]. However, only TDE of
pure materials could be calculated and there is no comprehensive study about TDE. Hence world-
wide literature study is needed.
II.1.1.3 Limitation of NRT model
In 1972, NRT model was proposed and until now this model is using as international standard [31]

14
( )( )
( )ν 2
e
d
k E ST NRT
E
-= Equation II.1.1
Where E is the total energy of the PKA, Se is the energy lost in the cascade by electron excitation, E�
is damage energy. From the above equation, a total number of defect created by PKA could be
deduced. And then dpa could be derived by dividing by a total number of the atom. However, to
calculate over all neutron effects, we have to calculate the average cross section of the neutron
spectrum. Below equation is about the average neutron cross-section.
( ) ( ) ( ) ( ) ( )ˇ ˇ
ˆˆ
σ σ , ν dT σ , ν dT
D i D i D i
T
E E T T E Tf
f
f= = Wò ò Equation II.1.2
σ�(�� , �) is the probability that a particle of energy �� impart a recoil energy T to a struck lattice
atom, ν(�) = the number of displaced atoms. After calculating the average cross section of the
various neutron spectrums, finally, total number of the defect could be calculated.
( ) ( )E
E
d i D i iR N E E dEf s= ò
)
(Equation II.1.3
( )ˇ
ˆ
( )E
NRT i D i i
E
G N Ф E E dEs= ò Equation II.1.4
where N is the lattice atom density, Ф(E�) is the energy-dependent particle flux, σ�(E�) is the
energy-dependent displacement cross-section. This equation could be simplified after some
mathematical calculation. In these days, SPECTER code [39] is most widely used by many
researchers.
As referred, all-atom interaction mechanism which includes all radioactive phenomenon such as
electron excitation, Compton scattering, and photoelectronic effect etc are hard to be considered.
Hence simplification of NRT model is the main problem. Mechanism of the neutron and matrix is
complex to analyze. There is four mechanisms (elastic, inelastic, (n, γ), (n, α)) to occur displacement.
However, there is no tool to analyze all reaction kinetics. In MD simulation, neutral collision kinetics
could be calculated but, ionic interaction is neglected. In the case of SRIM code, electron excitation
could be considered but neutron interaction does not consider. Hence the simplification NRT model
should be modified by considering all reaction kinetics.

15
II.1.1.4 Limitation of quantification of cascade relaxation
As referred, radiation damage is classified as two parts. In second phase, most of the defect is
recombined by the corruption of cascade and thermal recombination. However, until now, these
phenomena are not systemically organized. There are too many energy groups in the neutron spectrum,
grouping method and functional analyze are an essential part. The similar approach or methodology
could be fined in neutron physic because neutron physics researcher should use various grouping
method to calculate the neutron reactivity. However, in case of neutron physics, reactivity is so much
important for a nuclear reactor to maintain sustainable fission reaction, hence unlikely radiation
damage research, it was systemically organized. Even if it obvious that organizing the primary
radiation damage is the major problem of rate theory, there is no research group which has enough
capacity to generate the cascade recombination phenomenon.

16
II.2 Limitation of rate theory
Traditionally, the modeling of RIDI was derived by simplified rate theory based on diffusion’s limited
reaction and MD simulation [32]. Technically depending on three factors i.e., sink density, defect flux,
and bias factor, RIDI is calculated. However, various assumption and limitation is still a barrier to
understand the fundamentals of radiation effect on materials. Especially, limitations of rate theory are
clearly revealed when it compared with MD simulation about reaction kinetics. Among the various
limitation, major issues are treated in this section.
II.2.1 Mean-field approximation
First, the rate theory is based on a deterministic method based on the mean field which means that rate
theory could not consider the heterogeneous generation and growth of sinks and defects in the matrix.
Hence sink size and morphology are uniform and stochastic sink development could not be accounted.
The second limitation is about bias factor or capture efficiency. Obviously capture efficiency is not
constant because sink morphology and density are changed, and other environments are applied.
However, until now, there is no research about bias fact, which could consider the all variation.
Obviously, all researcher also assume that capture efficiency is constant. Despite this recognition,
there was no general approach or systemically method to analyze capture efficiency.
Third, modification of diffusion coefficient in stress applied condition is needed more sophisticated
analytic treatment. In Braisford model, stress-induced diffusion coefficient is calculated by ideal
volume of lattice atom and applied stress [33]. Although the more theoretical approach is already
developed by Woo and Gosele for prediction of irradiation creep [2, 34]. These study results have
never been verified. Moreover, there is no theoretical study about bimolecular reaction kinetics in a
radiation environment after Woo’s study. Recently ab-initio simulation takes the place the position of
this analytical method [35].
Lastly, the role of the alloy also un-clear in rate theory. From experimental results, it was clear that
alloy has an effect on irradiation swelling and growth [36]. As stress effect, diffusivity
characterization could be a solution to this problem. However, few literature studies about alloy effect
on defect diffusivity had been carried out [37].

17
II.2.2 New research trend for limitation of rate theory
Not only rate theory but also various simulation tools were adopted to analyze the RIDI. Molecular
dynamic simulation, ab-initio and kinetic Monte Carlo simulation are representative simulation tools.
Alloy element and stress effect is a region where new methodology application could be effectively
used. In case of MD simulation or first principle method, each atom position could be detected. Hence,
near the alloy element, point or cluster defect could be analyzed their displacements.
In rate theory, single diffusivity value is adopted to express the point defect diffusivity. However, until
now this value is adopting by fitting the experiment result or only useful for the pure metal. Hence
recently point defect diffusivity is calculated by using MSD. It was revealed that Nb act trap for
interstitial hence its diffusivity is dramatically decreased in zirconium. Just as an alloy element case,
stress effect on diffusivity could be clearly confirmed by MD simulation. In this case, also the MSD
method is used for calculating the diffusivity of point defect. One thing is different is only strain
commend is added in input script. In this case not only point defect case but also a cluster defect could
be analyzed by C.W. Kang’s results [37].
Although, significant progress of computer simulation performance (i.e. MD simulation and ab-initio),
rate theory is still a favorite option to simulate radiation effect on materials because this method can
give an instinctive understanding of irradiation behavior with short computation time. Moreover, scale
of simulation time and simulation length is large enough to satisfy the engineering point of view
whilst other simulation method still need a lot of limitation of time and length scale. Therefore, it is
important to organize the pro and cons of each tool’s characteristic.
In conclusion, since rate theory must use average value in a various terms such as defect generation,
recombination rate, and sink absorption rate, hence each term should be verified by MD simulation or
ab-initio method. However, it is hard to calculate that each term characteristic because there are too
many things, which has to be considered. For example, to calculate absorption rate of just one type of
sink, such as dislocation, not only direction of dislocation but also stress applied degree should be
considered with various alloy element effect. However, the only limited human and financial resource
could be available to consider all parameters effect with organized test matrix. Therefore, fragment
knowledge on the specific condition where MD simulation or ab-initio simulation have been adopted,
should be organized, summarized and combined for rate theory.

18
III Rationale and Approach
III.1 Research goal
This chapter describes the research goal and approach. For life extension and improved safety analysis
of cladding candidate materials in nuclear reactor condition, my research aims to establish the
physical model.
Until now many experimental fitting models are used for safety analysis. However, these modelings
have fundamental limitation without an experimental database. Moreover, to suggest the new idea for
radiation resistant materials, the physical model should be an essential part.
There were many attempts to explain radiation damage and effect by the physical model. However, as
referred in introduction and problem-statements chapters, there is blank part to filled with new results
which are calculated by new methodology and tools such as MD simulation, kinetic monte carlo and
ab-initio method.
Not only new methodology but also traditional rate theory has been developed to explain various
phenomenon such as void lattice ordering, the high swelling rate with low dislocation density and
high swelling rate change depend on grain boundary.
Therefore, in this study, state of art results about specific topics such as stress effect or alloy effect on
defect behavior and cascade effect on defect generation will be adopted in advanced rate theory.
Finally, calculated results will be verified with other simulation results or experimental results.

19
III.2 Research tools
Historically, quantitative evaluation of defects generated by neutron irradiation has been
internationally carried out. Unfortunately, sixty years ago, there was no generalized tool for
quantitative analysis. Hence quantitative evaluation of primary radiation damage and sinks
development were calculated by using an analytic equation.
For this reason, theoretical evaluation of nuclear materials has been developed since the 1960s and
various studies have been conducted to derive fundamental mechanisms for various phenomena that
have not been clarified yet.
Rate theory is the most important results of the theoretical study. Reaction probability was calculated
by solving the diffusion equation. In rate theory, defect generation, recombination and absorption rate
could be derived. At firstly only point defects were considered and cluster defects were neglected. As
referred in introduction chapter, Mansur [24] and Sizmann [25] systemically organized the fluence,
temperature and sink effect on materials in an early stage. Recently rate theory had been developed
up-to CDM and PBM to consider the cluster defect behaviors [1, 38].
However, even theoretical and analytical method could give hint to interpret radiation damage and
effect phenomena, many studies about the predicting the life expectancy had been carried out through
the experimental results rather than theoretical approach because the theoretical basis still has a lot of
immature parts.
Nevertheless, this certain limitation, the reason of why much research on the degradation behavior has
been made on the theoretical basis is there is no way to directly examine the high-level radiation
effect on microstructure in an experimental manner. Although there are few studies about the in-situ
observation of radiation effect on materials in low temperature with electron source [39].
Hence, recently, state of art simulation tools are adopted in the field of nuclear materials society, i.e.
ab initio, MD, and kMC, which are recognized as key to solve the limitation of rate theory [40, 41].
These three methodologies could cover the microstate of atomic behavior, which rate theory could
never consider.

20
III.2.1Cluster dynamic modeling
The fundamental of rate theory, which is including approach and methodology, are well-described in
Fundamental of radiation materials science [8] and Brailsford papers [32] where reaction kinetics
were summarized, and reaction probability is calculated by SRT. In this chapter, simple characteristics
are represented. The SRT is not integrated method, number density is needed as input data. Hence to
derive number density of sinks, i.e. vacancy and interstitial cluster, the master equation should be
extended up-to unlimited number. There is two representative methods to obtain cluster distribution.
The one is Kritani method [42] which is originally to calculate the vacancy distribution in quenching.
The other is Goloubov method [43] to consider transmutation effect on cluster effect. Unfortunately,
these methods are needed specialized numerical ODE solver and simulation time. However, the form
of the master equation itself is simple as following equations.
( )2 2 3 42 3 4- -= + + + +å ii
o iv i v n n i i i v i ii in
dCK K C C Z C D E C E C E C
dtr b Equation III.2.1
( ) ( )2
1 3 3 2 1 13 2
2 / 22+ + - + += +icl
dpa i i v i i v i i ii f
G C E C E CdC
dth b b b b Equation III.2.2
( ) ( )3
2 4 4 3 3 32 4 3
3
3+ + - + += +icl
dpa i v i i v i i ii f
G C E C E CdC
dth b b b b Equation III.2.3
( )4
3 4 4 443 4
4= + - + +i icl
dpa i i v i i i
dC fG C E C
dth b b b Equation III.2.4
Where ��� �� �� is vacancy or interstitial cluster concentration in the iron matrix (cm��), �� is the
defect generation rate (cm�����), which means vacancy and interstitial are combined to be a perfect
lattice atom. ���� is the cluster defect generation rate (cm�����), ���� is the fraction of cluster, � is
the cascade efficiency, ��� is the recombination rate (������), �� is the density of sink of n type in
the iron matrix (����), ��� �� � is the vacancy or interstitial bias factor of sink on n type in the iron
matrix, which is a dimensionless number, � is the point defect absorption constant, � is the point
defect emission constant, �� is the density of a specific sink such as dislocation line, dislocation loop,
and void. Figure III.2.1 and Figure III.2.2 show the fundamental mechanism of cluster dynamic theory.
Each cluster could be growth or dissolved by absorption of point defect.

21
Figure III.2.1 Schematic of cluster dynamic modeling
Hence defect concentration equation of any size cluster (it is denoted by m size cluster) could be
understood as shown Equation III.2.1. If m-1 size cluster absorbs same type point defect, it will be m-
size cluster. In case of m-size cluster, any absorption or emission of point defect will decrease the
concentration of m-size cluster.
Figure III.2.2 Schematic of cluster evolution

22
�� �� �� =
�� �� ��
��� �� �� ��� �� � = 4�(�� + ��)(�� + ��) Equation III.2.5
��� =
��
��� exp(−
���
��) = 4�(��)(��)exp(−
���
��) Equation III.2.6
The physical meaning of the first term on the right hand of Equation III.2.1 is defect generation rate;
the second is recombination rate; the third is the vacancy absorption rate of any sink in the iron matrix;
the rest term is about cluster growth and dissolve. In Equation III.2.2, first term show cluster
generation rate and the rest term represent cluster behavior. The rate theory of vacancies follows the
same method as that of interstitials in Equation III.2.2 ~ Equation III.2.4.
Among these various terms in the Equation III.2.1, sink absorption rate is the most interesting factor
in the point of view to calculate dimensional instability because it determines the accumulation rate of
defect on the sinks. The integral of accumulating defect rate to sink directly induced dimensional
instability in mean field rate theory assumption.
III.2.2Production bias modeling
As referred, simple rate theory, i.e. CDM was not enough to explain some phenomenon. It was
obvious that a new approach is needed. In 1997 Singh published the paper which is well formulated
and organized about cascade effect on microstructure [1]. After then, various papers about the reaction
kinetics are published. For example, in 2000, Goloubov summarize these limitations and explain the
discrepancy between bcc and fcc structure [44]. However, there is no big change in 1997’s frame.
Therefore, the original frame of Singh’s paper in 1997 is still important and enough to understand
core ideas.
The key idea of Singh’s paper is the mobile interstitial cluster is generated and reacted with other
sinks. Hence the modified master equation of simple rate theory is necessary. Moreover. the new
equation about mobile interstitial cluster should be formulated. The theoretical basis of the one-
dimensional approach is described in Borodin’s work approach [45]. The noticeable point in Singh
approach is that only the mobile interstitial cluster and sink reaction was considered in Equation
III.2.7.

23
( ) 2= -g
g g g g
dCK t D C k
dtEquation III.2.7
here �� is the mobile interstitial number density concentration, �� is the generation rate of mobile
interstitial, �� mobile interstitial diffusion coefficient and ��� sink strength. In the Equation III.2.7
equation about sink strength is
( )2
4 2= + +
-abs
g v v
g
dk N
l R l
prs Equation III.2.8
here ���� is effective interaction diameter, �� is grain radius, � is the distance from the grain
boundary, σ� are the cross-section clusters with size. From the Equation III.2.7, master the equation
should be modification because mobile interstitial cluster has always positive effect on interstitial
cluster number density whilst mobile interstitial cluster has negative effect on vacancy cluster.
( )11 ( )b b b b b
--- -= + - + + - + g
g
x xx x x x xi x i v i i xi MIT xi MIT x x i
x K C E C C CdC
dtEquation III.2.9
here ���� is absorption rate of mobile interstitial cluster with extended sinks. As shown in Figure
III.2.3.

24
Figure III.2.3 Schematic of production bias modeling
III.2.3MD simulation & First principle
The thermal dynamic is about equilibrium. In the past, there is no way to precisely analyze the atomic
behavior. But by creating the concept of entropy, the phase of materials is predicted hence all kind of
thermal dynamic approach is based on experimental results. Nowadays, the research trend turns from
the thermodynamic to kinetics, because of development of first principle method. As implied by the
name, the first principle needs nothing from experimental results because the first principle is the law
to consist the all of matter in the universe. However, in order to solve the wave equation for electron
structure, the various assumption should be applied, moreover, many-body problem needs a lot of
computer simulation power. Nevertheless, ab-initio and MD study give a lot of information about
atomic behavior which has never revealed before. Therefore, nowadays, we are in the phase transition
of academic tools for analyzing the materials behavior. In the past, thermodynamic is only ways,
however, nowadays first principle and MD simulation are the major issues in nuclear materials
academia. Specifically, radiation-induced phenomena are occurred in wide time and length scale
because neutron has high energy. The range of time scale is started from femtoseconds to decades and
the range of dimensions is started from the angstrom to meter scale, that has more than 13 orders of
magnitude. Therefore, to accurate analysis of atomic behavior, MD simulation and ab-initio tools have
to be used.
MD simulation is about the solution of Newton equation which about the position, velocity, and
acceleration. By using the initial positions and potential field, find the lower energy states with a
small-time interval. What makes MD simulation to be important is methodology or algorithm to solve
the many-body problem and computer capacity which makes MD simulation is possible. In the past,
the idea is already has been suggested. However, there is no way to solve many-body system without
a computer. Not only algorithm and computer capacity but also potential is the most important factor
in MD because, without potential, MD is useless. Recently potential is calculated by the first principle
or is fitted by experimental results.
To calculate the interatomic potential of the atom, the first principle had been suggested. This method
is a memorial invention which is developed form the state of art physical model. There are many
underlings physic and mathematic to consist the first principle method. The art of this simulation is
not just solution of wave equation, but, the various logical assumptions to solve wave equation. Wave

25
equation itself is not a hard problem because it is second order PDE which solution is well known.
However, wave equation is only available in a simple case such as hydrogen model. In case of
transient metal, there are so many electrons exist hence variable is too many. There is history to solve
the complex system. However, this modeling development is out of this study range.
III.3 Approach and Method
In rate theory, RIDI was calculated by reaction probability between defects and sinks hence sink size
and number density should be derived. Traditionally sink strength is a useful concept to calculate the
reaction probability and it induced sink size change. In this section, it will be explained that how to
derive the sink strength and how to connect between RIDI and sink strength. Finally, as referred in
problem state chapter, traditional calculation of sink strength could not consider the stress and alloy
effect. Hence in this section, methodology to consider the stress and alloy effect is described.
III.3.1Definition of the diffusion
Before to derive sink strength, it is necessary to define the diffusion coefficient because what is dealt
with in this study is almost kinetics of atomic behavior. Before directly derive the diffusion coefficient
in 3-Dimension, it is easy to derive in lower dimension, i.e. 2-Dimension. In 2-Dimension, one point
can move each step �, hence if let �� be position of after the ���ℎ step then
�� = ���� ± � Equation III.3.1
the average value of each step will be zero, hence by using mean squared position
��� = ����
� ± 4����� + 4�� = ����� + 4�� Equation III.3.2
from the above equation, displacement from zero point could be expressed
��� = 6��� = 4 �
��
�� � = 4�� Equation III.3.3
therefore, diffusion coefficient can be defined as a tool for expression the displacement in a mean
square position. Now, turn into a 3-Dimensional problem, it is very simple because mean square
displacement is linearly increasing with time

26
��� = 6��� = 6 �
��
�� � = 6�� Equation III.3.4
III.3.2Normal distribution of particle
It must be easier to understanding sink strength if normal distribution is understood. Because both
problems are dealing with second-order PDE. There are many ways to solve second order PDE. There
is a general solution and specific solution. As literature, the general solution is a most general way to
solve PDE. From this method, it could be determined that the solution is existance or not. However, in
this study, the only specific solution will be treated because the general solution is needed furrier
transform which is beyond of this study scope. As shown in Figure III.3.1, Fick’s second law is a
second order PDE problem.
��(�) =1
(4���)��
�� � �−��
4��� Equation III.3.5
Figure III.3.1 Problem of 1-dimension diffusion

27
To obtain the normal distribution of some particle position, a new variable is suggested, and the
separation of variable technic is used. Finally, particle concentration could be derived.
Figure III.3.2 Solution of 1-dimension diffusion problem
28
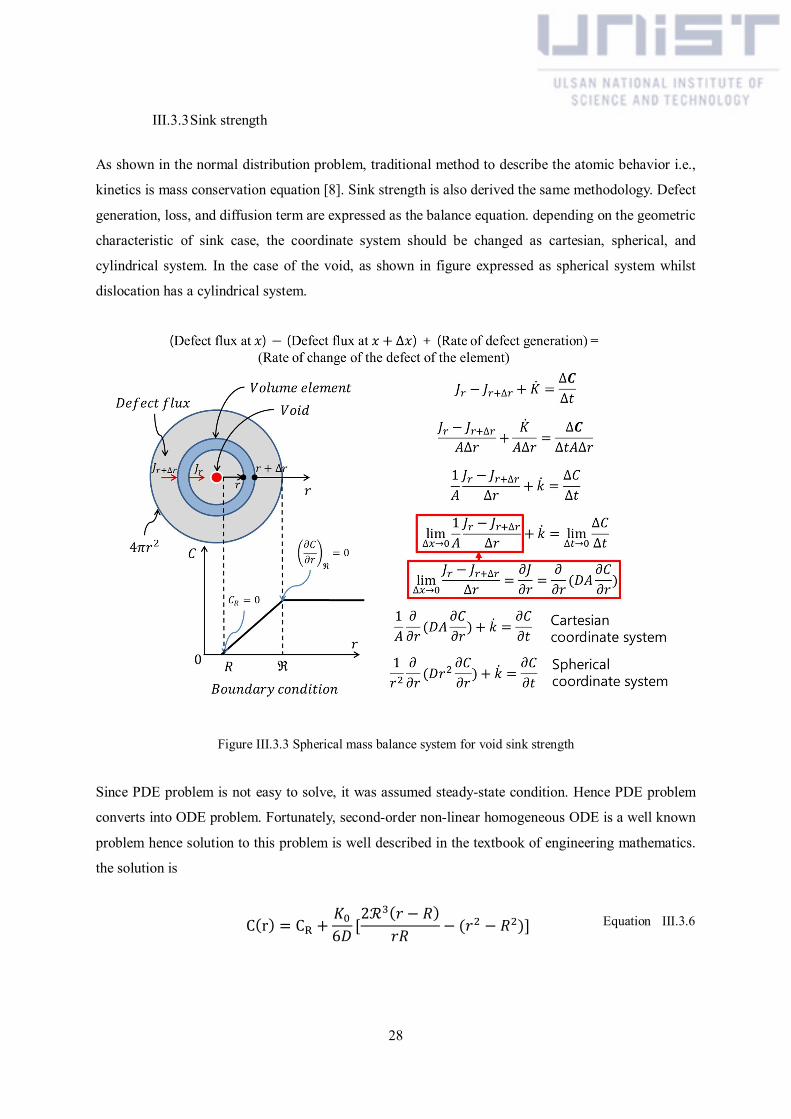
III.3.3Sink strength
As shown in the normal distribution problem, traditional method to describe the atomic behavior i.e.,
kinetics is mass conservation equation [8]. Sink strength is also derived the same methodology. Defect
generation, loss, and diffusion term are expressed as the balance equation. depending on the geometric
characteristic of sink case, the coordinate system should be changed as cartesian, spherical, and
cylindrical system. In the case of the void, as shown in figure expressed as spherical system whilst
dislocation has a cylindrical system.
Figure III.3.3 Spherical mass balance system for void sink strength
Since PDE problem is not easy to solve, it was assumed steady-state condition. Hence PDE problem
converts into ODE problem. Fortunately, second-order non-linear homogeneous ODE is a well known
problem hence solution to this problem is well described in the textbook of engineering mathematics.
the solution is
C(r) = C� +��
6�[2ℛ�(� − �)
��− (�� − ��)] Equation III.3.6

29
Figure III.3.4 Cylindrical mass balance system for dislocation sink strength

30
III.3.4The connection between sink size and RIDI
Radiation-induced dimensional instability in cladding materials is mainly caused by defect and sink
reaction. Hence RIDI could be fully explained with sinks growth and nucleation behavior. Before to
directly consider the various effect (i.e. stress and alloy) on rate theory, the relationship between RIDI
and sink size was reviewed to verify its methodology.
From traditional reaction mechanisms which are well explained in the previous section, diffusion’s
limited reaction is applied to calculate defect abortion rates. Hence, sink size could be derived by sink
strength and which means that atom is accumulated at a certain type of sink. Since atomic
accumulation is directly proportioned with dimensional change, RIDI could be simply calculated by
sink size change.
There is various type of sinks such as void, dislocation, and precipitation etc. For the sake of
simplification, these representative irradiation sinks are classified as disk and sphere. From blow
equation, sink number density and sink change could be derived. To calculate all defect absorption
rate from each sink, total number density has to be derived. Total number density is
2d id i sksk d isk
r Nr p= Equation III.3.7
= =void p ppt s hNr r Equation III.3.8
Here, ����� ��� ����� are the radius of sink and number density of sink, which has disk
morphology. From these density equations and sink strength equation, reaction probability of defect
and sink or total defect accumulation rate could be calculated
( )i vx
x x i i x v v
dSZ D C Z D C
dtr= - Equation III.3.9
here, �� is the total number of defects in sithe nk, ��� �� � is the vacancy and interstitial bias factor of
any given sink, �� �� � is vacancy or interstitial concentration in the iron matrix (cm��), �� �� � is
the diffusion coefficient of vacancy or interstitial in the matrix (������ ). Since interstitial and
vacancy are recombined at sinks, reaction rate should be expressed by net defect flux (��� ���� −
�������). (In Eq., interstitial flux is positive and that of vacancy is negative for interstitial net defect
flux. However, the type of net defect flux could be changed by sink type i.e., void will be expressed

31
by vacancy net defect flux because void is composed by vacancy).
As assumed, there is two types of sink. In case of a disk type of sinks such as dislocation line and loop,
it induced the irradiation creep and growth. If defect diffusivity is not biased, irradiation creep and
growth do not occur. However, in case of zirconium, diffusion is biased as DAD hence irradiation
growth occurs without external stress. In case of stainless steel, irradiation creep is only occurred by
external stress. Therefore, irradiation growth and creep could be calculated by the general equation of
strain rate. The equations are
=d
bvdt
er Equation III.3.10
where, � is the elongation (cm), and � is the dislocation velocity (cm��s��). In this equation, most
import parameter is dislocation velocity which physical meaning is exactly same of defect flux (i.e.
reaction probability between defects and sinks). Hence the equation of dislocation velocity is
1( )j j
i i i v v vv z D C z D Cb
= - Equation III.3.11
Therefore, from that equation, irradiation growth and creep are calculated. In case of irradiation
swelling, it could be calculated as below equation
4 ( )j jsph v v v i i i
dVr z D C z D C
dtp= W - Equation III.3.12
From Eqs., not only dimensional instability but also microstructure characteristic, i.e. number density
and radius of sink can be calculated. Although microstructure can’t be fully explained in detail, the
average radius of the sink would be derived as below equation [32]:
( )sph i vsph v v sph i i
sph
drZ D C Z DC
dt r
W= - Equation III.3.13
In case of disk type, the total number defect in disk type of sinks is used to drive change of radius.
This method is well-described in a previous work [46]. Therefore, the equation for the radius of a disk
type of sink is below.

32
( / )=disk disk diskr S bNpEquation
ffffffffIII.3.14
III.3.5Stress effect on RIDI with the traditional method
It is worth noting that stress-induced preferred dislocation loop nucleation and growth has been
already considered. In 1973, Brailsford simply showed that irradiation creep and swelling will be
explained by two mechanisms, i.e. stress induced preferred nucleation (SIPN) and stress-induced
preferred growth (SIPG) [33]. However, in this study, SIPN was not considered because it was
revealed that SPIN has little effect compared with SIPG.
In the preview section, RIDI is formulated by using the net defect flux which is the origin of RIDI.
Hence in applied stress condition, defect absorption equation should be modified to consider the stress
effect by adopting SPIG. Specifically, SIPG was accounted by modifying the reaction probability
between defect and sinks.
To modify reaction probability, the SIPG mechanism should be reviewed. Firstly, it was developed to
explain the diffusional creep mechanism in thermal creep behavior. Brailsford borrows this concept
and then applied irradiation situation. In the thermal creep mechanism, especially in diffusional creep,
stress effect was accounted by modifying the bulk defect concentration (equilibrium concentration). In
detail, bulk defect concentration would be changed by depending on the direction of applied stress.
This is the key idea of diffusional creep mechanism. In tensile stress field, bulk vacancy concentration
will be decreased as blew equation.
30 exp( )= -j
v v
bC C
kT
sEquation III.3.15
In 1972, Brailsford uses the concept of diffusional creep. Bulk defect concentration was assumed that
it is affected by the emission of vacancy from sink to free matrix. Hence bulk defect concentration has
a negative effect on vacancy absorption rate to sink.
The difference between diffusional creep and Brailsford’s irradiation model is the consideration of the
interstitial atom. In his model dislocation loop growth was explained by stress preferential induced
attraction (SPIA).

33
Therefore, Brailsford just combine two phenomena. In traditional diffusion creep equation, it can be
interpreted that vacancy is simultaneously absorbed and emitted by sink. Therefore, vacancy
absorption rate, which considers stress effect, should be expressed more precisely as below equation.
= -j j jv v v v v v vA z D C z D C Equation III.3.16
Here, ��� is the bulk defect concentration near the sinks, ��
� is the bulk defect concentration, and �
is the Burgers vector (cm) hence vacancy absorption rate decrease with increasing of the bulk defect
concentration. From this equation, SPIA is could be expressed as below equation by considering
interstitial flux and bulk defect concentration which is reflect stress effect on creep.
( )j j j jj i i i v v v v v vJ z DC z DC z DCr= - + Equation III.3.17
Unfortunately, this Brailsford approach does not account the vacancy formation from the free matrix
which has a positive effect on vacancy absorption rate. Moreover, one thing remained which is not
considered in Equation III.3.15 is stress effect on the diffusion coefficient. It is obvious that self-
diffusion is a function of applied stress. However, until now, the stress effect on defect diffusivity and
defect generation in the free matrix were not considered. Those phenomena are important especially at
high temperature which is SFR condition.
In this study, to account the stress effect on diffusivity, activation energy is modified as same approach
method in diffusional creep model.
30 exp( )= -v v
bD D
kT
sEquation III.3.18
Here, �� is the vacancy diffusion coefficient in stress applied condition, ��� is vacancy diffusion
coefficient in non-stress applied condition. This kind of approach was already adopted in zirconium
and its based alloy [2]. However, this approach was not extended to iron and its based alloy.
III.3.6Stress effect on RIDI with a recent method
To establish the sink strength in the previous section, the defect absorption rate is calculated by

34
solving the isotropy diffusion equation. However, to consider the stress effect, reaction probability has
to be modified as the anisotropy diffusion equation. It is not a simple task to generate and solve the
anisotropy diffusion equation. Therefore, in the traditional method, sinks are characterized as two-part
depending on stress direction. In the recent method, the sink will be treated as two parts depending on
stress direction. However, there is the difference between traditional and recent method, that is
diffusion tensor. From diffusion tensor, more accurate analysis become a possible.
As discussed in previous section, MD simulation is powerful tool and stress effect on diffusivity did
not consider. Hence stress effect on diffusivity could be calculated by MD simulation. Fortunately,
recently, many MD simulation has been conducted to account the various effect on defect behavior.
C.W. Kang and M. Banislaman is most representative researcher [37].
The most important progress on stress effect on diffusivity in MD simulation is an analysis of cluster
behavior. In non-stress applied condition, cluster diffuse in an arbitrary way. However, in applied
stress condition, clusters diffuse in one diction. In the traditional approach, only point defect behavior
could be analyzed, hence this information is much valuable information.
Not only qualitative information but also quantitative data could be obtained by following the
trajectory of atom position. From this information, Mean Square Displacement (MSD) could be
derived to obtain the diffusion tensor.
III.3.7Alloy effect on RIDI with the traditional method
Alloy plays many roles in metallurgy, i.e. improve mechanical, physical, and, corrosion properties.
Specifically, in cladding materials, alloy improves the radiation resistant properties. There is two
mechanisms that alloy effect on metal properties, i.e. alloy change the defect diffusion behavior and
make precipitation, which acts as a trap for point defect and mobile dislocation.
However, in the early stage of nuclear engineering, there is no research tool to analyze the alloy effect
on defect diffusivity. Hence only precipitation effect could be treated because precipitation could be
observed by experimental equipments such as TEM or SEM.
During the process to optimize the cladding materials, the iron-based alloy is chosen from austenite
steel to ferritic-martensitic steel. Meanwhile, it was revealed that precipitation reduced the irradiation
swelling. To explain this phenomenon, one assumption was suggested that precipitation play neutral
sinks. In detail, it was assumed that precipitation could provide recombination site as a point defect
trap because precipitation is not composed with a lattice defect, but it composed with other alloy
35
elements and a different structure. What means is if interstitial is absorbed nearby precipitation,
compressive potential field is generated and then vacancy is absorbed favorably. This mechanism
could be applied for vacancy absorption nearby precipitation.
Therefore, the bias factor of precipitation should be changed by considering net defect flux. This kind
of approach is well-described in Brailsford’s paper [47].
v i i
ppt
v v
DCZ
D C= Equation III.3.19
This traditional method could explain why precipitation improves the irradiation swelling. However,
all alloy element does not form the precipitation. Solution-state of alloy play on the improvement of
RIDI needs state of art simulation tools.
III.3.8Alloy effect on RIDI with a recent method
Recently by using first principle and MD simulation, the reaction between defects and alloy have been
revealed. The materials design company is the most advanced research group in this study region. Not
only point defect but also the stability of extended defects which is affected by alloy had been
researched. Nb effect on interstitial diffusivity in Zr-Nb was simulated and express as MSD [35].
Firstly, in first principle simulation, one lattice atom is extracted and then the alloy element is created.
By relaxation process, each alloy element characteristic could be expressed by each energy state such
as formation migration and binding energy.
Alloy play not only substantial but also an interstitial role. Hence alloy is inserted in any interstitial
site, and then same type information of could be revealed. Form this result, MD simulation could
simulate the relationship between point defect and alloy. Finally, it was confirmed that interstitial
diffusion by MSD
III.3.9Cascade effect on defect generation rate and sink density
Not only defect generation rate but also sink density was affected by cascade annihilation. Garner
show the experimental evidence of cascade annihilation effect [48]. In case of solution annealed
materials, it could be analyzed that neutron bombardment only increase the sink density. However, in
case of 20% cold-worked specimen, sink density is decreased by radiation damage. Hence both
mechanism of defect generation and annihilation should be considered in rate theory. The modified
rate equation is needed for consideration of cascade annihilation. The modified equation is expressed

36
as shown as Figure III.3.5. Defect generation and sink strength is modified from normal equation.
From the experimental result, sink annulation rate (��) could be derived.
Figure III.3.5 Modified master equation by considering the cascade annihilation of sink

37
III.4 Computer code implementation
The python 2.0.7 language is used for the rate theory modeling [49]. In detail, python library module
(Scipy) is used to solve the simultaneous ordinary differential equation, i.e. master equation of the rate
theory [50]. Generally, Scipy module is used to solve the linear algebra, integration, special functions
and image processing with efficient numerical routines.
Among the various module in Scipy, the scipy.integrate.odient is numerical integrate a system of
ordinary differential equations in Scipy routines. From this system, the defect concentration could be
integrated by numerical method.
To adopt the scipy.integrate.odient, time step function should be defined. In scipy.integrate.odient,
integration time step is defined as “array” in python. Hence in this study, time step was defined by
using “for” statement. Interval of time was given as 0.25 (0.25, 0.50, 0.75…). The region of time was
defined that irradiation damage started from the 10-7 to 109. Since time is accounted from 10-7,
primary radiation damage did not consider. Hence defect generation rate was input parameter in this
study.

38
Figure III.4.1 Schematic diagram of code implementation

39
IV Results – Zirconium and its alloys
IV.1 The methodology of irradiation growth modeling
In case of zirconium, irradiation growth and creep are two representative RIDI mechanism. To
eliminate the texture effect, irradiation growth was firstly simulated from a single crystal, and then
polycrystal is examined. To calculated irradiation creep, stress was considered by modifying the
diffusion coefficient. Finally, the alloying elements effect was simulated. The detail approach method
and equations were introduced in rationale chapter. Hence in this chapter, the equation for specific
systems (such as single crystal and polycrystal) are briefly described.
IV.1.1Rate equation of single crystal & polycrystal
In case of single crystal zirconium, dislocation loop and dislocation line are the main sinks in the
matrix. Hence, sinks in the defect rate equations could be simply composed by dislocation loop and
line. The initial dislocation line density was obtained from experimental observation as shown in
Table IV.2.1. Each sink is characterized by <a> and <c> axis because the origin of irradiation growth
was assumed as DAD phenomenon.
v v v vsvo iv i v ilp ilp v v vlb vlb v v dp dp v v db db v v
dCK K C C Z C D Z C D Z C D Z C D
dtr r r r= - - - - - Equation IV.1.1
i v i isio iv i v ilp ilp i i vlb vlb i i dp dp i i db db i i
dCK K C C Z C D Z C D Z C D Z C D
dtr r r r= - - - - - Equation IV.1.2
2 2dp db v v i irN rNr r r p p= + + + Equation IV.1.3
where �� is defect production rate. ��� is recombination rate which mean vacancy and interstitial are
combine and go to perfect lattice atom. ����, ���, ���� and ��� are each sink density. ����� and
����� are interstitial and vacancy bias factor of interstitial loop, ���
� athe nd ���� are interstitial and
vacancy bias factor of dislocation line, ����� and ������ �
� are interstitial and vacancy bias factor of
vacancy loop, ���� and ���
� are interstitial and vacancy bias factor of dislocation line. ��� and ���
are defect concentration of interstitial and vacancy in single crystal matrix, �� and �� are the
diffusion coefficient in the matrix.

40
The first term on the right-hand side of Equation IV.1.1 is the defect generation rate; the second is the
recombination rate; the third is the vacancy absorption rate of <a> interstitial loops, which are parallel
to the prism plane; the fourth is the vacancy absorption rate of <c> vacancy loops, which are parallel
to the basal plane; the fifth is the vacancy absorption rate of <a> dislocation lines, which are
perpendicular to the prism plane; the last is the vacancy absorption rate of <c> dislocation lines,
which are perpendicular to the basal plane. The master equation of vacancies follows the same method
as that of interstitials. The constants are listed in Table IV.2.1.
In case of polycrystal zirconium, not only dislocation loop and line but also GB should be considered
as the main sink in the matrix. Therefore, the rate equations are more complex than a single crystal
case. Using single crystal defect rate equation, defect rate equation could be simply expressed.
2 2v vg
pv svg p gp v v g pp v v
dC dCk C D k C D
dZ
t dtZ= - - Equation IV.1.4
2 2i ig
pi sig p gp i i g bb i i
dC dCk C D k C D
dZ
t dtZ= - - Equation IV.1.5
2 6 /r= ´gb gbk d Equation IV.1.6
where ��� and ��� is defect concentration of interstitial and vacancy in polycrystal matrix. ���� and
���� are grain boundary sink strength. ���
� and ���� are interstitial and vacancy bias factor of grain
boundary in prism. ���� and ���
� are interstitial and vacancy bias factor of grain boundary in basal
plane.
In the polycrystal equation, the sink strength of the grain boundary was calculated using Brailsford
and Bullough’s method. The constants are listed in Table IV.2.1. it is assumed that the dislocation line
density does not change because dislocation loops absorb all the defect flux. The loop number density
is hard to calculate by a theoretical method because there is no general equation for loop nucleation
and growth equation under radiation. Therefore, the experimental value of the loop number density
was used.
As described in Equation IV.1.4 and Equation IV.1.5, vacancy dislocation loops in the prismatic plane
are not considered in this study because the consideration of co-existence of vacancy and interstitial is

41
needed to modify the fundamental assumption of SRT. Since SRT assumes that all sink is
homogeneously distributed, and these sinks receive same defect flux, the expression of co-existence
of vacancy and interstitial dislocation loops are neglected in this study. However, since the reaction
probability was calculated by SRT using average defect flux value of each sink, vacancy loops in the
prismatic plane could be neglected without having any problem in the situation where the sinks are
distributed homogeneously.

42
IV.2 Fundamental parameters
The experiment of irradiation growth has been done many researchers after Buckly [12]. From these
experiments, qualitatively mechanisms are suggested by using microstructure analysis and then,
defect rate theory is used to the calculation of defect concentration for quantitatively modeling.
Historically, Hesketh [51] and Carpenter [52] set up firstly theoretical growth modeling by experiment
database. After that, theoretical modeling base on rate theory developed by Dollins [53], Fainsteins -
Dedraz [54], MacEWEN [55] and Bullough [56] who adopt rate theory. However, these papers,
published in the 1980s, had two limitations. First mobile defects are only composed only point defect.
Second point defect has isotropic diffusion. From these assumptions, calculation results could not
fully explain the microstructural characteristic.
In the after of 1980s, noticeable theoretical modeling paper is about to sink strength in zirconium was
published by Woo [2]. He considered difference of the interstitial diffusion coefficient <a> axis and
<c> axis. Therefore, the bias factor could be developed at each sink in the zirconium matrix. Until
now this modeling gives a fundamental base with PBM approach in the growth research area.
Recently, a computer simulation was developed, and theoretical analysis was advanced. From these
evolutions, irradiation growth modeling is researched again to fundamental understanding. Christien
[57] had been theoretically modeled with Frenkel pair three diffusion model in a single crystal. And
after that Golubov [58] also predict with theoretical modeling in a single crystal with PBM modeling.
More specifically, in Christien work, he assumed that main sink is dislocation loop and line. <a>
elongation occurs by <a> dislocation loop growth. <c> shortening occurs by agglomeration of
vacancy loop. From Christien an equation, irradiation growth result show good agreement of
experimental data. In case of Golubov, elongation is calculated by account reaction kinetics of 1-D
interstitial cluster in steady state.
To simulation irradiation growth, basic parameters are adopted from these literature studies. The
diffusion coefficient is the most important parameter as a fitting parameter. Hence, from the Christien
study, the value of the diffusion coefficient is adopted. The bias factor is adopted from Woo’s
researched. The experimental result such as dislocation number density is accounted from Northwood
study as shown in Table IV.2.1.

43
Table IV.2.1 Input parameters
Input parameter Symbol Unit ValueReference/
comment
Defect generation rate � dpa s-1
10-7 [16]
Recombination radius ��� cm 10-7 [57]
Burgers vector � cm-2
3.23 × 10⁻⁸ [59]
Diffusion coefficient
Vacancy �� cm2
s-1
3.0 × 10⁻¹⁷ [57]
INTERSTITIAL ��� cm2
s-1
1.0 × 10⁻⁶ [57]
Sink strength
<a> loop ���� cm-2 2����� [58]
<c> loop ���� cm-2 2����� [58]
<a> dislocation line ��� cm-2Single: 7.25 × 10⁶ [36]
Cold: 20 × 109 [36]
<c> dislocation line ��� cm-2Single: 2.25 × 10⁶ [36]
Cold: 5 × 10⁹ [36]
<a> GB (���/2) cm-2 6 × �� ÷ ��� [60]
<c> GB (���/2) cm-2 6 × �� ÷ ��� [60]
Average strain factor
<a> loop ���� Constant 0.5 [53]
<c> loop ���� Constant 1.0 [53]
<a> dislocation line ��� Constant 0.5 [53]
<c> dislocation line ��� Constant 1.0 [53]
<a> GB ���� Constant 0.5 Assume in this work
<c> GB ���� constant 0.5 Assume in this work
Bias factor
<a> loop ����� Constant 1 [61]
<c> loop ����� Constant 0.586 [2]
<a> dislocation line ���� Constant 1.56 [2]
<c> dislocation line ���� Constant 0.586 [2]
<a> GB ���� Constant 1.56 [2]
<c> GB ���� Constant 0.586 [2]

44
IV.3 Irradiation growth modeling of single crystal
The strain rate is determined not only by defect flux but also average strain. The concept of the
average strain was first suggested by Dollins. Before this concept was suggested, irradiation growth
was assumed to be directly proportioned with the growth of dislocation line and loop size. However,
dislocation has each directionality. Since depending on dislocation direction, irradiation growth
should be changed.
IV.3.1Average strain value for single crystal
In Dollins’s work, the direction of dislocation loops and lines was accounted to calculate the
irradiation growth of a single crystal in any given direction. As shown in Figure IV.3.1, depending on
the directionality of dislocation loop, irradiation growth could be changed. For example, if the
dislocation is growth in b1 direction, there is no strain change in the perpendicular direction of b1.
Since dislocation loop is randomly distributed, average stain value is deduced by 0.5.
Figure IV.3.1 Schematic of main sinks in zirconium by SRT
Hence, from this quantitative analysis, irradiation growth by dislocation lines and loops could be
expressed in terms of an average strain value. Therefore, the average strain factor effect was
considered in the irradiation growth equation for single-crystals.
45
IV.3.2Strain equation for single crystal
After the definition of average stain value and anisotropy factor, the irradiation growth strain rate was
calculated using the dislocation climb mechanism.
dbV
dt
er= Equation IV.3.1
( )1
i i i v v vV Z D C Z D Cb
= - Equation IV.3.2
where � is the elongation (cm), � is the dislocation density (cm��), � is the Burgers vector (cm), �
is the dislocation velocity (cm��s��), and �� and zv are the interstitial and vacancy bias factors of
dislocations, respectively.
Physically, Equation IV.3.1 expresses all the dimensional changes that could explain the creep- and
stress-induced strain. These phenomena occur in one direction. However, irradiation growth occurs in
various directions because the defect flux originates in neutron bombardment. Therefore, this general
equation is limited to the calculation of each sink strain. Because of the anisotropy of the interstitial
diffusion coefficient, the defect flux is specified for each sink. (For vacancies, the diffusion coefficient
is always isotropic because the activation energy is much higher than that of interstitials.) From these
equations, irradiation growth could be calculated for a specific sink type.
The bias factor is also considered to affect the capture efficiency because it determines the reaction
probability of defect and sinks reactions. In an hcp system, the bias factor depends on the DAD
because the crystal structure is anisotropic. Therefore, the detailed irradiation growth equation of a
single crystal is expressed for each sink type:
( )ilp
i vailp ilp ilp i i ilp v v
dA Z DC Z DC
dt
er= - Equation IV.3.3
( )dp
i vadp dp dp i i dp v v
dA Z DC Z DC
dt
er= - Equation IV.3.4

46
( )vlb
v icvlb vlb vlb v v vlb i i
dA Z DC Z DC
dt
er= - Equation IV.3.5
( )db
i vcdb db db i i db v v
dA Z DC Z DC
dt
er= - Equation IV.3.6
ilp dpad dd
dt dt dt
e ee= + Equation IV.3.7
d d dc vlb db
dt dt dt
e e e= + Equation IV.3.8
where �����, ��
�� , �����, and ��
�� are the irradiation growth strain induced by interstitial dislocation
loops in the prism plane, dislocation lines parallel to the prism plane, vacancy dislocation loops in the
basal plane, and dislocation lines parallel to the basal plane, respectively, and ���� , ��� , ���� ,
and ��� are the corresponding average strain factors for each sink.

47
IV.4 Irradiation growth modeling of polycrystal
In the growth equation for polycrystal zirconium, the grain boundary sinks and grain orientation
(texture) are considered. Therefore, irradiation growth of polycrystal zirconium is expressed
differently from that of single crystals.
IV.4.1Anisotropy factor for polycrystal
For polycrystals, the effect of texture (the anisotropy of each grain direction) should be considered in
the strain equation, and then the growth strain rate could be calculated by each sink type. For single
crystals, irradiation growth could be simply expressed by average strain value, the dislocation loop
density because a-axis elongation and c-axis shortening are caused directly by dislocation loops.
However, in case of polycrystal, anisotropy factor is needed to consider the texture because
polycrystal irradiation growth indirectly is proportional to sink radius. F-factor is about the resolved
fraction of basal poles in any given direction. Therefore, by using F-factor, anisotropy factor (����� =
1 - 3Fd) is considered for irradiation growth. For example, if the texture is homogeneously distributed,
F-factor has 0.33, and then irradiation growth will not be occurred because anisotropy factor is 0
IV.4.2 Strain equation for polycrystal
The average strain factor of grain boundaries is also considered after the <a>- and <c>-axis growth
strain rate is calculated to determine the growth in a certain direction. The average strain factor of
grain boundaries is 0.5 because anisotropic grain boundary distribution is assumed for sufficiently
high annealing. Therefore, the growth strain rate equations including the texture are expressed as
( )2gp
i vagp gp gp i i gp v v
dA k Z DC Z DC
dt
e= - Equation IV.4.1
( )ilp dp gpa a a
pd
oly
d d d dG
dt dt dt dt
e e e e= ´ + + Equation IV.4.2
where �� is irradiation growth strain in the direction of interest of polycyrstal; and ����
are the
irradiation growth strain induced by grain boundaries in the prism of single grain; ��� are the
average strain factors for grain boundaries in the prism of single grain;
From the anisotropy factor, the relationship between radiation growth of single crystal and polycrystal

48
could be defined. In tradition, anisotropy factor was simply calculated by F factor (����� = 1 − 3F).
However, recent studies reported that irradiation growth of polycrystal could not be simply calculated
by simple anisotropy factor because the difference of each grain orientation induced the grain-
interaction. Therefore, the grain-interaction could make a change of irradiation growth depending
upon specimen texture. Therefore, in this study, grain-interaction accounted from Woo’s research.

49
IV.5 Results of irradiation growth modeling
The irradiation growth strain is calculated by the SRT and general dislocation climb equation. The
results for both single-crystal and polycrystal zirconium are examined in terms of the defect
concentration, defect flux, sink strength, and growth strain. The effect of dislocation lines and loops
on growth was verified for single-crystal zirconium. The effect of grain boundaries on growth was
confirmed for polycrystal zirconium. For annealed polycrystals, the grain boundary effect was an
important parameter for dislocation lines and loops. In contrast, the grain boundary effect was
negligible for cold-worked polycrystal zirconium. Finally, for verification, the calculation results are
compared with experimental data.
IV.5.1Single crystal
The defect concentration shows typical low-sink-density behavior in single-crystal zirconium. Initially,
the defect concentration increases because reaction probability is too low to recombine or interact
with sinks. Next, the interstitial defect concentration decreases and the vacancy concentration
increases because of rapid interstitial diffusivity. From this region, the defect reacts with the sink, and
the sink density is changed. Finally, point defects are in a steady state because the production rate
could be compensated by the recombination rate (10-8 dpa). Figure V.4.2 (a) shows the defect
concentration of single-crystal zirconium.

50
Figure IV.5.1. Radiation-induced (a) point defect concentrations, and (b) net defect flux to dislocation loops in
single-crystal zirconium at 553 K

51
From the calculated defect concentration, the interstitial net defect fluxes to the major sinks are
calculated. In single-crystal zirconium, these are the <a> and <c> dislocation loops. Figure V.4.2 (b)
shows the interstitial net defect flux to the sinks. The defect flux initially increases at 10-9 dpa and
immediately afterward decreases up to 1 dpa. In this early stage, net defect flux occurs during a very
short time. Therefore, sinks are not developed significantly, i.e. the effect of initial regime on
irradiation growth is negligible. Actually, the growth is affected in the steady-state net flux region, i.e.
the high-dpa region. The net defect flux to <a> dislocation loops become positive, whereas the that of
vacancy become negative. It is obvious behavior because DAD assumption already indicate that
interstitial defects are accumulated in <a> dislocation loops, and vacancies are reacted with <c>
dislocation loops. In this irradiation growth model, two types of dislocation loops are examined and
calculated. The method of calculating the dislocation density follows that of Barashev. The number
density and radius of dislocation loops are used to calculate the dislocation density. Figure IV.5.2 (a)
shows the number density of dislocation loops. The value of the former is obtained from an
experimental database, and then the radius is calculated using the the total number of defects:
2 ( )v v v v sv i siS r N DC DCp= -& Equation IV.5.1
( / )v v vr S bNp= Equation IV.5.2
where �� is the total number of vacancies in the vacancy dislocation loops. The change in Sv could
be calculated from the defect flux because the reaction probability is proportional to the
circumference of the dislocation loops and the defect flux. The radius of interstitial dislocation loops
can be calculated using the same equation as that used for vacancies. Figure IV.5.2 (b) shows the
radius of the dislocation loops. For interstitial <a> loops, the radius increases dramatically in the early
dpa region. Subsequently, the radius is in the steady state. For <c> dislocation loops, the radius
increases linearly from 3 to 7 dpa. However, there is no general information about the number density
of <c> dislocation loops. The early-stage research presented only the ratio of the number densities of
dislocation loops. Fortunately, the presence of <c> dislocation loops was analyzed by Holt and Gilbert
in order to understand breakaway phenomena. In zircaloy-2, <c> dislocation loops do not appear
before the 3 dpa region.
Figure IV.5.2 (c) shows the change in the dislocation loop density versus the dpa. Initially, the <a>
dislocation loop density increases dramatically, whereas that of <c> type loops increases above <3>
dpa. Next, the density of both types of dislocation loops shows a saturation region. The <a>
dislocation loops are generated by the net interstitial defect flux behavior. However, <c> dislocation

52
loops generation and growth are caused by the net vacancy flux. These behaviors exactly follow the
model structure. Discontinuities behavior of dislocation loops is caused by the limitation of the SRT
model. Dislocation loop number density was based on the experimental result. It seems that there is a
discrepancy between the defect concentration/defect flux (shown in Figure V.4.2) and the number
density of dislocation loop (shown in Figure IV.5.2 (c)).

53
Figure IV.5.2. Sink information of (a) number density, (b) average radius, and (c) sink strength in single-crystal
zirconium at 553 K

54
Finally, irradiation growth can be calculated using the defect concentration and sink density results.
The results are compared with experimental measurements by Carpenter [11] in Figure IV.5.3.
Although the experimental values of the growth strain were higher than the calculation data at 2–6 dpa,
the overall growth tendency is similar to that of the experimental database and other irradiation
growth models [7,8]. The modeled result shows a breakaway phenomenon, which is in good
agreement with experimental data.
Figure IV.5.3. Modeled and experimental irradiation growth strain in single-crystal zirconium at 553 K
For single-crystal zirconium, dislocation loops have a stronger effect on irradiation growth than any
other sink. Therefore, the strain should be analyzed by dislocation behavior. As described in previous
section, dislocation density depends on the diffusivity, point defect concentration, initial dislocation
line density, and bias factor. Among these four parameters, only the point defect concentration is
dependent variable. Other parameters are independent variable. However, point defect is also
determined at by other three parameters, i.e. diffusivity, initial dislocation line density, and bias factor.
Therefore, fundamental research has to be carried out about the basic parameters such as diffusivity,
bias factor, and initial dislocation density. Hence, in discussion chapter, each parameter is examined to
further understanding.

55
In this study, number density of dislocation loops is the obtained from experimental results [17,18].
However, Christien and Barbu theoretically calculate the number density of dislocation loops by
CDM. Nevertheless, those researchers did not verify the number density of dislocation loops with
experimental results.
IV.5.2Cold worked polycrystal
In cold-worked polycrystal zirconium, the defect concentration shows typical high-sink-density
behavior. As in single-crystal zirconium, the interstitial defect concentrations initially increase 10-11
up to 10-12 dpa. However, in cold-worked polycrystal zirconium, interstitial defect concentrations
initially increase 10-10 up to 10-12 dpa. Next, the effect of the recombination rate can be neglected
because of the high sink density. Therefore, the rate of decrease of the interstitial concentration is
smaller than that in single-crystal zirconium. Finally, interstitial and vacancy concentrations are in a
steady state. Figure IV.5.4 (a) shows the defect concentrations in cold-worked polycrystal zirconium.
The net defect flux to the sinks is analyzed for <a> dislocation lines, <c> dislocation lines, and grain
boundaries. Figure IV.5.4 (b) shows the net defect fluxes to these sinks. The defect fluxes to sinks
show quasi-steady-state regions instead of peaks, unlike the behavior in single-crystal zirconium. This
phenomenon is caused by the high sink strength (the sink strength is enough to consume the defects at
an early stage). Subsequently, as in single-crystal zirconium, the defect fluxes decrease. After 10-2 dpa,
the net defect fluxes show a final steady-state region. Finally, these constant net defect fluxes
determine the irradiation growth strain. Therefore, irradiation growth is accelerated by these constant
fluxes to sinks.

56
Figure IV.5.4. Radiation induced (a) defect concentrations, and (b) net defect flux to dislocation line in cold-
worked polycrystal zirconium at 553 K

57
Because the major sinks in cold-worked polycrystal zirconium are dislocation lines and grain
boundaries, three types of the sink are examined. Figure IV.5.5 shows the dislocation line density and
grain boundary sink strength versus the dpa. The dislocation line density was assumed to be a time-
independent parameter. Therefore, the dislocation line density is constant with respect to the dpa.
(Physically, the dislocation line density in cold-worked zirconium is already sufficiently developed.
Therefore, it could not be increased because dislocation lines develop into network dislocations.) The
grain boundary sink strength function depends on the dislocation line density. Therefore, the sink
strength of grain boundaries also constant with respect to dpa.
Figure IV.5.5. Sink strength in in cold-worked polycrystal zirconium at 553 K
Figure IV.5.6 presents the model results for cold-worked polycrystal zirconium. The irradiation
growth strain of cold-worked polycrystal zirconium is also quite similar to experimental results. In
this case, dislocation line sink effects are dominant. As result, irradiation growth exhibits very simple
behavior, i.e. a linear increase with dpa. The results for cold-worked polycrystal zirconium were
compared to experimental data of cold-worked zircaloy because of an absence of that of cold-worked
polycrystal zirconium data. In cold-worked polycrystal zirconium, dislocation lines are the most
powerful factor in irradiation growth modeling.
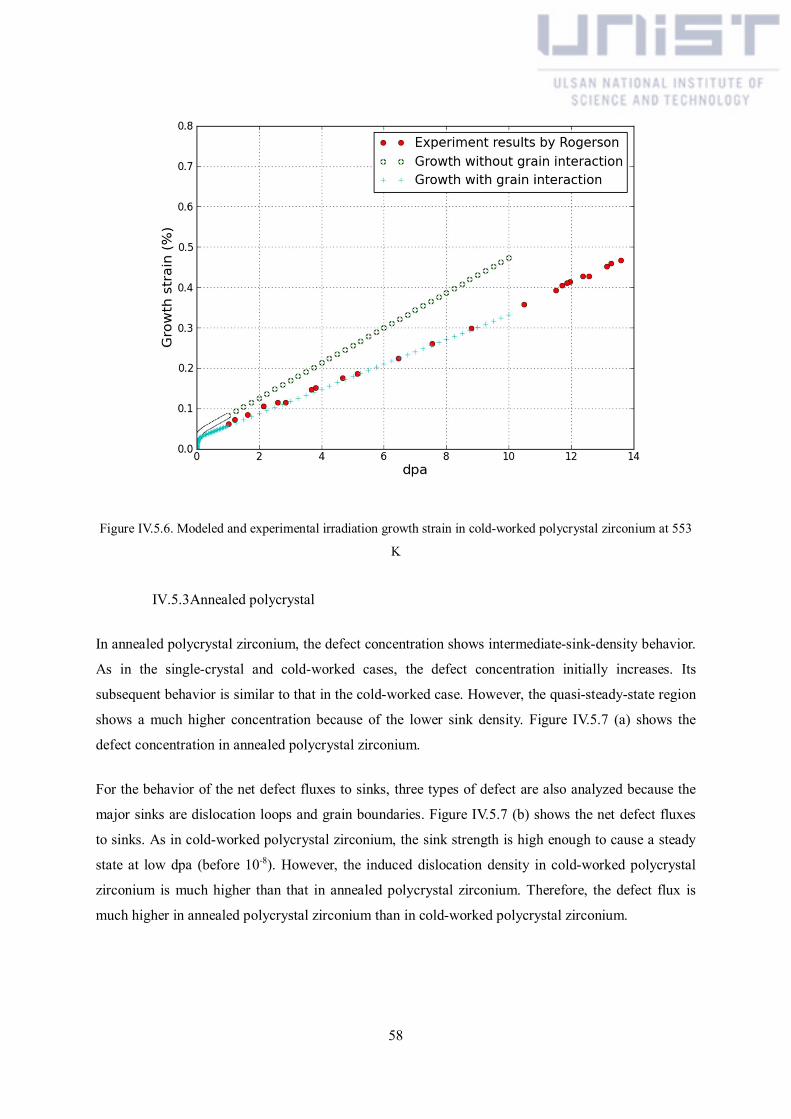
58
Figure IV.5.6. Modeled and experimental irradiation growth strain in cold-worked polycrystal zirconium at 553
K
IV.5.3Annealed polycrystal
In annealed polycrystal zirconium, the defect concentration shows intermediate-sink-density behavior.
As in the single-crystal and cold-worked cases, the defect concentration initially increases. Its
subsequent behavior is similar to that in the cold-worked case. However, the quasi-steady-state region
shows a much higher concentration because of the lower sink density. Figure IV.5.7 (a) shows the
defect concentration in annealed polycrystal zirconium.
For the behavior of the net defect fluxes to sinks, three types of defect are also analyzed because the
major sinks are dislocation loops and grain boundaries. Figure IV.5.7 (b) shows the net defect fluxes
to sinks. As in cold-worked polycrystal zirconium, the sink strength is high enough to cause a steady
state at low dpa (before 10-8). However, the induced dislocation density in cold-worked polycrystal
zirconium is much higher than that in annealed polycrystal zirconium. Therefore, the defect flux is
much higher in annealed polycrystal zirconium than in cold-worked polycrystal zirconium.

59
Figure IV.5.7. Radiation-induced (a) defect concentrations, and (b) net defect flux to dislocation loops and grain
boundary in annealed polycrystal zirconium at 553 K

60
In annealed polycrystal zirconium, the major sinks are <a> and <c> dislocation loops and grain
boundaries. Therefore, these three types of the sink are examined. Dislocation loop examined the
same method of a single crystal. Figure IV.5.8 (a) shows the number density of dislocation loops. The
value of the former is obtained from an experimental database, and the radius is calculated using the
change rate of the total number of defects. Figure IV.5.8 (b) shows the dislocation loop radius. Unlike
the case for the single crystal, the <c> dislocation loop radius is much larger than the <a> dislocation
loop radius. Figure IV.5.8 (c) shows the dislocation loop density and grain boundary sink strength
versus the dpa. The grain boundary sink strength increases with increasing dpa because it depends on
the dislocation line and loop density. The <a> dislocation loop density has the shape of a semicircle
before 4 dpa, after which <a> dislocation loops are saturated. The increase in the <c> loop density
resembles an exponential model. However, <c> dislocations have a much higher sink strength than
<a> dislocation loops. This result does not match the experimental results well.

61
Figure IV.5.8. Sink information of (a) number density, (b) average radius, and (c) sink strength in annealed
polycrystal zirconium at 553 K

62
Figure IV.5.9 shows the modeled growth in annealed polycrystal zirconium. Both results show high
growth strain initially. However, after 1 dpa, the calculated strain shows a much slower increase. This
discrepancy between the calculation and measurement increases with increasing dpa.
The strength model for grain boundaries is based on the dislocation line and loop densities. The
dislocation lines are assumed to be constant with respect to the dpa. Therefore, the primary reason for
the disagreement of annealed polycrystal zirconium is dislocation loops behavior.
In this model, the sink strength of dislocation loops is calculated using experimental data on the
number density. The behavior of the sink strength depends strongly on the number density. However,
there are no precise experimental data in the given dpa region. Therefore, cascade annihilation of sink,
which is referred in rationale chapter, could be another possibility to overcome the discrepancy.
Other possibility could be reason of discrepancy, may be new mechanism for the grain boundary
strength should be suggested. However, there is currently no general theory or simulation result for
the grain boundary sink strength.
Figure IV.5.9. Modeled and experimental irradiation growth strain in annealed polycrystal zirconium at 553 K

63
IV.6 Stress effect on zirconium
In previous section, strain equations were derived by considering each sink effect on the irradiation
growth. As same method, each sink effect on irradiation creep was expressed. For the simplification,
dislocation is assumed that it is distributed isotopically. Hence, initial dislocation density, which is
perpendicular with stress applied direction, was assumed 1/3 of total dislocation density. The detailed
irradiation creep equation is:
( )er= -
lpi va
lp lp lp i i lp v v
dA Z DC Z DC
dtEquation IV.6.1
( )dp
i vadp dp dp i i dp v v
dA Z DC Z DC
dt
er= - Equation IV.6.2
e e e= +p lp dpd d d
dt dt dtEquation IV.6.3
where ���� are the irradiation creep strain induced by interstitial dislocation loops, and dislocation
lines where stress is applied in the perpendicular direction. �� is the total irradiation creep strain
along stress applied direction, respectively.
To account the stress effect on defect evolution, we need to know only three fundamental parameters
such as migration, formation, and binding energy. However, until now there is no extensive study
about migration, formation, and binding energy of zirconium under the stress condition.
The originality of this study is the modifying of Brailsford method. In Brailsford method, only
vacancy emission of dislocation loop was considered. However, stress effect on diffusion coefficient
and defect formation energy do not account. Those phenomena are important especially at high
temperature. In this study, to account the stress effect on diffusivity, activation energy is modified as
same approach method in diffusional creep model. In detail, as described rationale chapter, stress
effect also considered by modified Arrhenius formulation.

64
Figure IV.6.1 Stress effect on irradiation creep in cold-worked polycrystal zirconium at 553 K
In case of cold-worked zirconium alloy, it was assumed that dislocation density is already saturated.
Hence sinks number density and radius behavior are not analyzed. However, in case of stainless steel,
sink behavior should be analyzed because stainless steel is more ductility than zirconium. therefore,
more detail analysis will be conducted in the iron-based alloy.
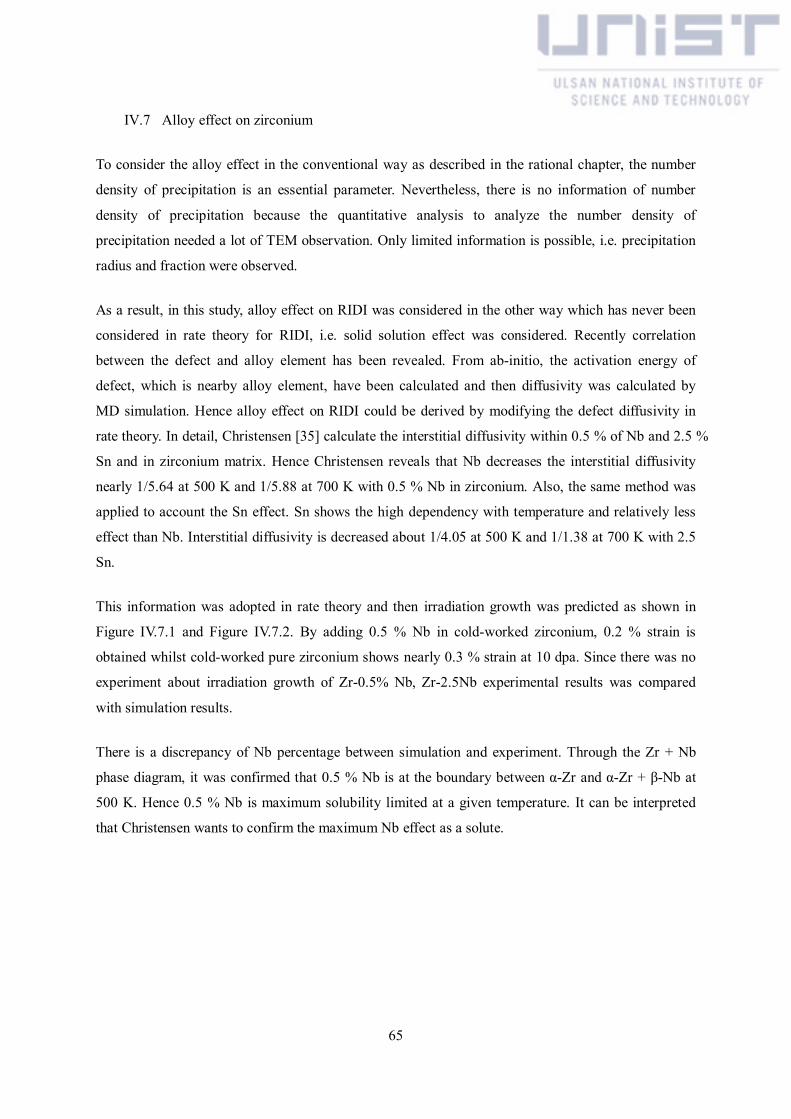
65
IV.7 Alloy effect on zirconium
To consider the alloy effect in the conventional way as described in the rational chapter, the number
density of precipitation is an essential parameter. Nevertheless, there is no information of number
density of precipitation because the quantitative analysis to analyze the number density of
precipitation needed a lot of TEM observation. Only limited information is possible, i.e. precipitation
radius and fraction were observed.
As a result, in this study, alloy effect on RIDI was considered in the other way which has never been
considered in rate theory for RIDI, i.e. solid solution effect was considered. Recently correlation
between the defect and alloy element has been revealed. From ab-initio, the activation energy of
defect, which is nearby alloy element, have been calculated and then diffusivity was calculated by
MD simulation. Hence alloy effect on RIDI could be derived by modifying the defect diffusivity in
rate theory. In detail, Christensen [35] calculate the interstitial diffusivity within 0.5 % of Nb and 2.5 %
Sn and in zirconium matrix. Hence Christensen reveals that Nb decreases the interstitial diffusivity
nearly 1/5.64 at 500 K and 1/5.88 at 700 K with 0.5 % Nb in zirconium. Also, the same method was
applied to account the Sn effect. Sn shows the high dependency with temperature and relatively less
effect than Nb. Interstitial diffusivity is decreased about 1/4.05 at 500 K and 1/1.38 at 700 K with 2.5
Sn.
This information was adopted in rate theory and then irradiation growth was predicted as shown in
Figure IV.7.1 and Figure IV.7.2. By adding 0.5 % Nb in cold-worked zirconium, 0.2 % strain is
obtained whilst cold-worked pure zirconium shows nearly 0.3 % strain at 10 dpa. Since there was no
experiment about irradiation growth of Zr-0.5% Nb, Zr-2.5Nb experimental results was compared
with simulation results.
There is a discrepancy of Nb percentage between simulation and experiment. Through the Zr + Nb
phase diagram, it was confirmed that 0.5 % Nb is at the boundary between α-Zr and α-Zr + β-Nb at
500 K. Hence 0.5 % Nb is maximum solubility limited at a given temperature. It can be interpreted
that Christensen wants to confirm the maximum Nb effect as a solute.

66
Figure IV.7.1. Nb effect on irradiation growth in cold-worked polycrystal zirconium at 553 K
Figure IV.7.2. Sn effect on irradiation growth in cold-worked polycrystal zirconium at 553 K

67
IV.8 Limitation of SRT frame and PBM approach as a possible breakthrough
Irradiation growth and creep of zirconium were predicted by DAD assumption with SRT approach.
However, recently, MD and ab-initio study show that DAD assumption is not true, and then suggest
that the origin of irradiation growth is 1-D diffusion of the interstitial cluster.
In case of a bcc structure, the interstitial cluster could be mobile in <111> direction. In one <111>
plane, there is three mobile directions. And there is 4 families of <111> plane. Hence total 12 isotropic
diffusions could be possible. However, in case of zirconium, interstitial cluster only could mobile on
prism plane of hcp structure. Therefore, it was suggested that irradiation growth is originated by
anisotropic diffusion of the interstitial cluster rather than DAD.
Recently, Goloubov and Barashev use the PBM approach to consider the anisotropic diffusion of the
interstitial cluster. They successfully predict the irradiation growth behavior of single crystal.
However, they neglect the recombination and cluster evolution. Hence the only possibility of PBM is
verified as replacement of DAD assumption.
Figure IV.8.1. Schematic of the main sinks in zirconium by PBM
Therefore, in this study, from the equation which described in rationale chapter, PBM equation is
developed with 6 major sinks as shown in Figure IV.8.1. Therefore, the master equation was
established, and the defect absorption rate was calculated. However, since many energy parameters
were not determined for PBM. Simulation results are failed as shown in Figure IV.8.3.

68
Figure IV.8.2 Vacancy cluster concentration in cold-worked polycrystal zirconium at 553 K by PBM
Figure IV.8.3 Interstitial cluster concentration in cold-worked polycrystal zirconium at 553 K by PBM

69
V Results – Iron and its alloys
V.1 Methodology of iron-based alloy modeling
As mentioned in introduction chapter, the iron-based alloy is isotropic materials hence there is no
texture such as zirconium. Since zirconium alloy has directionality, single crystal should be examined
to analyze the texture effect on irradiation growth. However, iron-based alloy shows isotropic volume
change, texture effect does not need to be verified. Hence irradiation swelling of single crystal had not
been researched to confirm texture effect. Therefore, in this study, irradiation swelling of
polycrystalline is directly calculated.
Iron-based alloy has many phases such as ferritic, austenitic, and cementite etc. Among various phase,
austenite and ferrite are a most famous phase which is used for cladding materials. At the early stage
of nuclear engineering, it was revealed that austenitic steel has a fundamental weakness about
irradiation swelling. Hence high chrome ferritic-martensitic steel is chosen for SFR cladding materials
[62]. In this point, simulation targeting structure is a bcc ferritic structure
V.1.1 Rate equation of pure iron
Unlikely zirconium case, iron-based alloy does not need to consider the texture, hence rate theory and
strain equation are simple. What is really needed to accurately calculate the irradiation swelling is
advanced rate theory equation, which could consider the complex defect behavior. As introduced in
rationale chapter, CDM approach is applied for iron-based alloy,
( )2 2 3 42 3 4- - ii
o iv i v n n i i i v i ii in
dCK K C C Z C D E C E C E C
dtr b= + + + +å Equation V.1.1
( ) ( )2
1 3 3 2 1 13 2
2 / 22+ + - + += +icl
dpa i i v i i v i i ii f
G C E C E CdC
dth b b b b Equation V.1.2
( ) ( )1 1 1 3 3 31 1
3
nn n nicl
dpa i n v i n v i i nni f
G C E C E CdC
dth b b b b- + +
- ++ + - + += + Equation V.1.3
( )4
3 4 4 443 4
4= + - + +i icl
dpa i i v i i i
dC fG C E C
dth b b b Equation V.1.4

70
where ��� �� �� is vacancy or interstitial cluster concentration in the iron matrix (cm��), �� is the
defect generation rate (cm�����), which means vacancy and interstitial are combined to be a perfect
lattice atom. ���� is the cluster defect generation rate (cm�����), ���� is the fraction of cluster, � is
the cascade efficiency, ��� is the recombination rate (������), �� is the density of sink of n type in
the iron matrix (����), ��� �� � is the vacancy or interstitial bias factor of sink on n type in the iron
matrix, which is a dimensionless number, � is the point defect absorption constant, � is the point
defect emission constant, �� is the density of a specific sink such as dislocation line, dislocation loop,
and void. Unfortunately, these methods are needed specialized numerical ODE solver and simulation
time. Hence in this paper, the master equation is expended only up to fifteen to the simplified
calculation.

71
V.2 Fundamental parameters
In the early 2000s, important papers were published by various authors. H. Duparc uses CDM
approach as rate theory to predict the radius and number density of interstitial and vacancy loops.
Calculated results were compared with the experimental result under 1 MeV electron by high voltage
microscope [63]. This study object is the verifying the irradiation hardening of pressure vessels by
CDM. In this study, the diffusivity of point defect was used as a fitting parameter to calibrate with
experimental and simulations results. From the calibration, it was revealed that interstitial has ��� =
4 × 10�� and ��� = 0.3, respectively, a vacancy has ��
� = 1 and ��� = 1.3
By C.C. Fu, valuable information on the properties of defects, i.e. migration, formation or binding
energy could be obtained by comparison between simulation and experiment [64]. In detail, the multi-
simulation method was adopted, that is, kMC and ab-initio were used to simulate the resistivity
experiments. In detail, defect concentration is predicted by following Takaki’s discussion depending
on temperature. In Takaki’s discussion, various regimes of temperature were characterized by defect
behaviors; In case of the stages (I) (23 - 101 K), recombination of the Frenkel pair is derived by
specific geometries; In the stage (ID2), (107.5 K), correlated recombination is caused by free
migration of the interstitial; In the stage (IE) (123–144 K) recombination is introduced interstitial
diffusion, migration energy is 0.27 ± 0.04 eV; In stage (II) (164–185 K), di-interstitial could also have
effects on reaction kinetic with ���� = 0.42 ± 0.03 eV; In stage (III) (220–278 K), vacancy attributes
recombination, with ��� = 0.55 ± 0.03 eV; In the stage (IV) (520–550 K), dissociation is taken
accounted of consideration. From these information, stress or alloy effect was not considered.
Therefore, from these fundamental parameters, RIDI was calculated with various stress and
temperature conditions.

72
Table V.2.1 Input parameters
Input parameter Symbol Unit Value Ref
Temperature T K 673
Hoop stress σ MPa 200
Iron density ρ g cm-3 7.85 -
Burgers vector � cm-2
3.23 × 10⁻⁸ -
Recombination radius ��� cm 0.65 × 10⁻⁷ [63]
Surface tension � eV cm-3
10.04 × 10¹⁷ [65]
Defect generation rate G dpa s-1 8.45 × 10⁻⁷ [66]
Interstitial fraction ��� - 0.594 [67]
Di-interstitial clustering fraction ��� - 0.334 [67]
Tri-interstitial clustering fraction ��� - 0.0723 [67]
Vacancy fraction �� - 0.625 [67]
Di-vacancy clustering fraction ��� - 0.292 [67]
Tri-vacancy clustering fraction ��� - 0.0825 [67]
Di-vacancy binding energy ���� eV 0.3 [64]
tri-vacancy binding energy ���� eV 0.37 [64]
tetra-vacancy binding energy ���� eV 0.62 [64]
Di-interstitial binding energy ���� eV 0.8 [64]
tri-interstitial binding energy ���� eV 0.92 [64]
tetra- interstitial binding energy ���� eV 1.64 [64]
Vacancy formation energy ��� eV 2.07 [64]
Vacancy migration energy ��� eV 0.3 [63]
Interstitial migration energy ��� eV 1.3 [63]
Sink strength
<a> loop ���� cm-2 2����� [57]
<a> dislocation line ��� cm-2 1 × 10¹¹ Assume in this work
Void ��� cm-2 4����������� [32]
Bias factor
Dislocation line ����� Constant 1.1 [63]
Dislocation loop ����� Constant 1.0 [63]
Void ���� Constant 1.0 [63]

73
V.3 Irradiation swelling modeling
In the case of iron, the rate of irradiation swelling could be calculated directly by considering the
defect absorption rate. In case of zirconium, the concept of the average strain is needed to consider the
texture. Hence the equation to calculate the irradiation swelling is very simple to compare with
zirconium case. As described in the rationale chapter, irradiation swelling was calculated by defect
absorption rate of the void as described in Equation V.3.1.
4 ( )p= W -j jvoid v v v i i i
dVr z D C z D C
dtEquation V.3.1

74
V.4 Results of irradiation swelling modeling
To validate the simulation model, the temperature dependence of irradiation swelling of pure iron
polycrystalline was calculated and compared with experimental data at 1 dpa [68]. Although cluster
was calculated only up-to fifteen, experimental number density does not need because it was assumed
that most large cluster is directly developed as sinks such as dislocation loop and void. From
concentration of number density, sink radius was calculated and then, void swelling is derived.
V.4.1 Pure iron
Figure V.4.1 and Figure V.4.2 shows point defect concentration and number density of cluster defects.
The defect concentration of pure iron show typical high-temperature behavior, both point and cluster
defects are saturated at 10-6 dpa. As written by G.S. Was in fundamental of radiation materials, this
fast saturation is occurred by fast recombination and absorption phenomena [8].
The common phenomenon of these defects’ behavior is the saturation. In case of a point defect, the
saturation behavior was determined by recombination and absorption rate. More exactly, generation
rate was balanced with recombination rate when each type of defect flux (��� ���� or ��
�����) were
equally absorbed at sinks. However, in the cluster, saturation the mechanism is different from that of
point defect. In case of cluster defects, saturation is derived by absorption and emission of point
defects. However, in the cluster, saturation the mechanism is different from that of point defect. In
case of cluster defects, saturation is derived by absorption and emission of point defects. One thing to
be noted in this paper is large vacancy cluster concentration eventually overwhelm the that of a small
cluster. This phenomenon is caused by a characteristic of capture efficiency and emission rate because
larger cluster has larger surface, which mean larger absorption rate.
From defect concentration, cluster number density is derived by calculating the absorption rate as
shown in Figure V.4.1 and Figure V.4.2. The absorption rate is derived by following the rule, which
was used to calculate the sink strength. In case of emission, simple Arrhenius formulation is used.
Number density shows the same trend of cluster defects because number density is obtained from the
largest cluster concentration. Base on the result of number density, the radius of sinks was calculated
and expressed in Figure V.4.3. One thing to be noted here is larger vacancy cluster overwhelm the
small cluster.
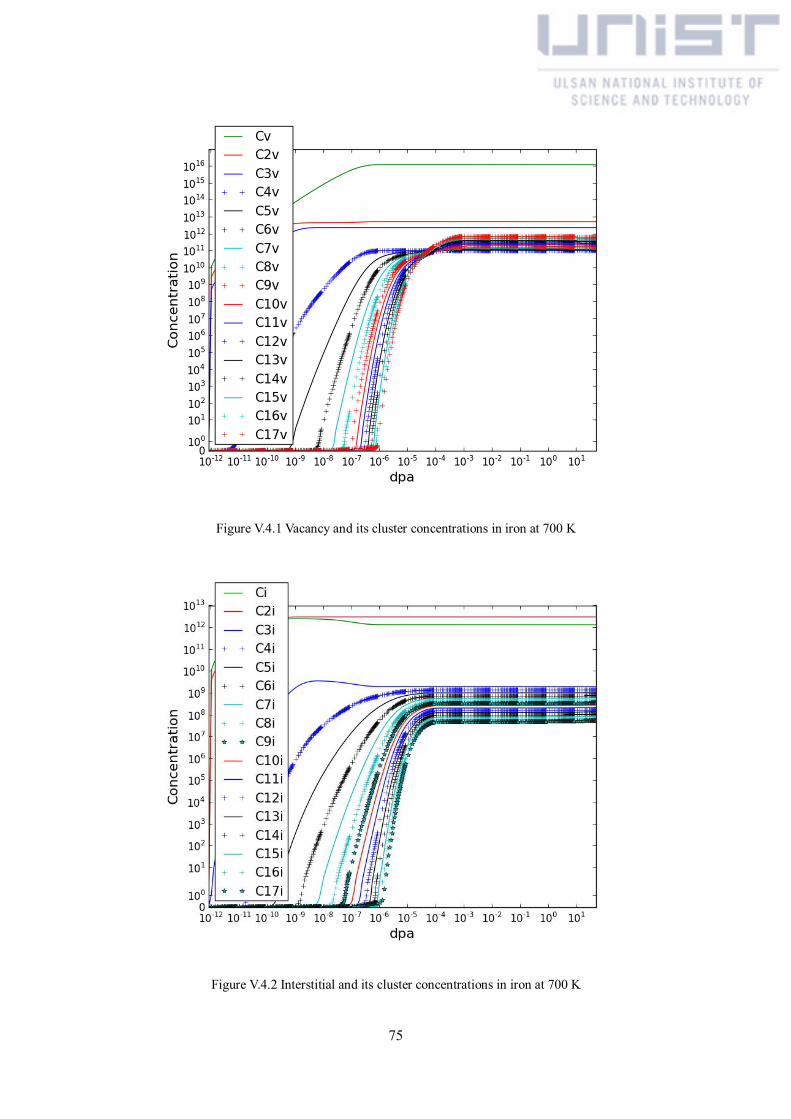
75
Figure V.4.1 Vacancy and its cluster concentrations in iron at 700 K
Figure V.4.2 Interstitial and its cluster concentrations in iron at 700 K

76
Both sink radius was increased at 10-6 dpa because number density is too low, and then until 10-4 dpa,
both radiuses were decreased. The discrepancy between two sinks happens after 10-4 dpa. In case of
the void, the absorption rate is much higher than emission rate hence radius growth with given
number density. However, in case of dislocation loop were dissolved at SFR condition. To verify the
radius behavior with linear scale, Figure V.4.4 was added.

77
Figure V.4.3 Dislocation loop and void radius in iron by logarithmic scale at 700 K
Figure V.4.4 Dislocation loop and void radius in iron by linear scale at 700 K

78
Finally, irradiation swelling was calculated and described by Figure V.4.5. The irradiation swelling
depending on dpa shows exponential shape. It is predictable behavior because radius is increased as
exponentially with saturated number density. This behavior was already confirmed in experiment
result in EBR II or FFTF [6].
Figure V.4.5 Irradiation swelling behavior in iron at 700 K

79
V.5 Stress effect on iron
Just like zirconium case, dislocation climb mechanism is applied to calculated irradiation creep. From
the general climb equation, irradiation creep equation is derived by the same method of zirconium.
The detailed irradiation creep equation is expressed for each sink type:
( )er= -
lpi va
lp lp lp i i lp v v
dA Z DC Z D C
dtEquation V.5.1
( )dp
i vadp dp dp i i dp v v
dA Z DC Z D C
dt
er= - Equation V.5.2
e e e= +p lp dpd d d
dt dt dtEquation V.5.3
where ����
and ����
are the irradiation creep strain induced by interstitial dislocation loops, and
dislocation lines where stress is applied in the perpendicular direction. �� is the total irradiation
creep strain along stress applied direction, respectively.
In zirconium results chapter, stress effect was accounted by modifying the Brailsford model. However,
as described in the rationale chapter, stress effect could be directly considered by MD simulation.
Hence the MD simulation method was adopted to calculated interstitial diffusivity.
The supercell 8x8x12 results with 1536 Fe atoms and periodic boundary condition is applied. To
account stress effect, isothermal Uniaxial deformation along [100], [010], [110] or [111]. The cell
stretching along [111] direction leads to shrinkage in both [1-1 0] and the [1 1-2]. The stretching along
[010] leads to shrinkage in both [001] and [100]. The stretching along [100] leads to shrinkage in both
[010] and [001]. The stretching [110] leads to shrinkage along [001] and [1-10].
The equilibration step allows the lattice to expand to a temperature of 800 K ~ 900 K with a pressure
of 0 kbar at each simulation cell boundary using isothermal-isobaric NPT ensemble. Then, the
simulation cell is deformed in the x-direction, to maintain a constant strain, while the lateral
boundaries are controlled using the canonical (NVT) ensemble. By assuming 1-time step is equal to 1
fs we evaluate the diffusivity for 1 ns.

80
In case of migration energies, MD simulations are performed at temperatures over the temperature
range, which are high enough to obtain sufficient defect mobility. The potential model used embedded
atomic potential developed by Mendelev as it shows the potential was obtained by fitting to both ab
initio total energy calculation results and experimentally measured properties [69].
We need to get the deviation time between the position of a particle and some reference position. It is
the most common measure of the spatial extent of random motion and can be thought of as measuring
the portion of the system "explored" by the random walker, this is called the MSD.
By getting the MSD results from MD calculation for 1 ns of run, the diffusion coefficient calculated
using the Equation V.5.4 as shown below.
2( )( )
2N
d
R TD T
n t= Equation V.5.4
Where R�(�) is the mean square displacement nd is the dimensionality of the diffusion process.
From the extracted the trajectories of the single interstitial diffusivity, the OVITO is used for
visualization the dimensionality of the diffusivity. � is the simulation time. The migration energies
represent difference of total energy between the initial SIAs configuration and the SIAs at saddle.
The MD approach does not preselect migration paths hence the n� value was determined from the
extracted trajectories of diffusion of the defects for 1 ns simulation using the OVITO code, and the
migration energies are obtained from temperature dependence equation. The migration energies are
extrapolated from Arrhenius expression, Equation V.5.5
0,( )mE
kTN ND T D e
-
= Equation V.5.5
where � is Boltzmann's constant, E� is the migration energy, and D�,� is a pre-factor. Table V.5.1
shows interstitial diffusivity by stress applied directions.

81
Table V.5.1 Diffusion coefficient by stress effect by MD simulation
Stress direction Migration energy (eV) Do pre-factor (cm2/s)Diffusion coefficient
(cm2/s)
<100> 0.121413223 0.0004246 8.4375×10⁻⁵
<110> 0.448910772 0.0001709 2.24905×10⁻⁴
<111> 0.114562858 0.0004690 9.24655×10⁻⁵
From the calculation interstitial diffusivity, the concentration of defect and cluster, radius, and
swelling is recalculated. The hole results on stress condition show the same tendency of that of non-
stress condition. However, the strain rate was rapidly increased. In this study, the purpose of research
is establishing the prediction model for the long fuel cycle condition. Hence, 600 MPa is applied and
show ridiculous behavior because strain rate was so high. After 1 dpa, simulation was broken because
of limitation of calculating power
Figure V.5.1 Stress effect on irradiation creep in iron at 873 K and 600 MPa.

82
V.6 Alloy effect on iron
In case of zirconium alloy, solute state of alloy effect was considered. However, in case of an iron-
based alloy, precipitation effect was considered by the traditional method. In case of precipitation, it
has unique property compared with other sinks because precipitation is not composed with a lattice
defect, but it composed with other alloy element with a different structure. Hence precipitation could
provide recombination site as a point defect trap. Therefore, the bias factor of precipitation should be
changed by considering net defect flux. This kind of approach is well-described in Brailsford’s paper
[47]. From established irradiation swelling model, precipitation effect was considered, and then defect
concertation and swelling was calculated as shown Figure V.6.1.
Figure V.6.1 Precipitation effect on point defect concentration in iron at 700 K
One thing to be noted is vacancy concentration behavior in the early stage (~10-8) is abnormal. This
phenomenon is caused by a bias factor of precipitation. Since precipitation provides recombination
site, vacancy flux has to be compensated with interstitial flux. As result, vacancy concentration is
decreased as shown in Figure V.6.1. (To prevent vacancy defect has minus value, code structure was
modified.)

83
Figure V.6.2 Precipitation effect on irradiation swelling in iron
In Figure V.6.2, the comparison result of swelling with non-precipitation and precipitation is described.
In case of precipitation case, total concentration is lower than that of the non-precipitation case.
Nevertheless, the general behavior of radius and swelling did not change. However, total swelling is
much decreased. When it compares with experimental results, swelling rate of non-precipitation has
the same slope with SS316 steel. In case of the swelling rate of precipitation, F17 experimental results
are well matched. Since precipitation number density and size were adopted from microstructure
analysis of F17, it is obvious behavior.
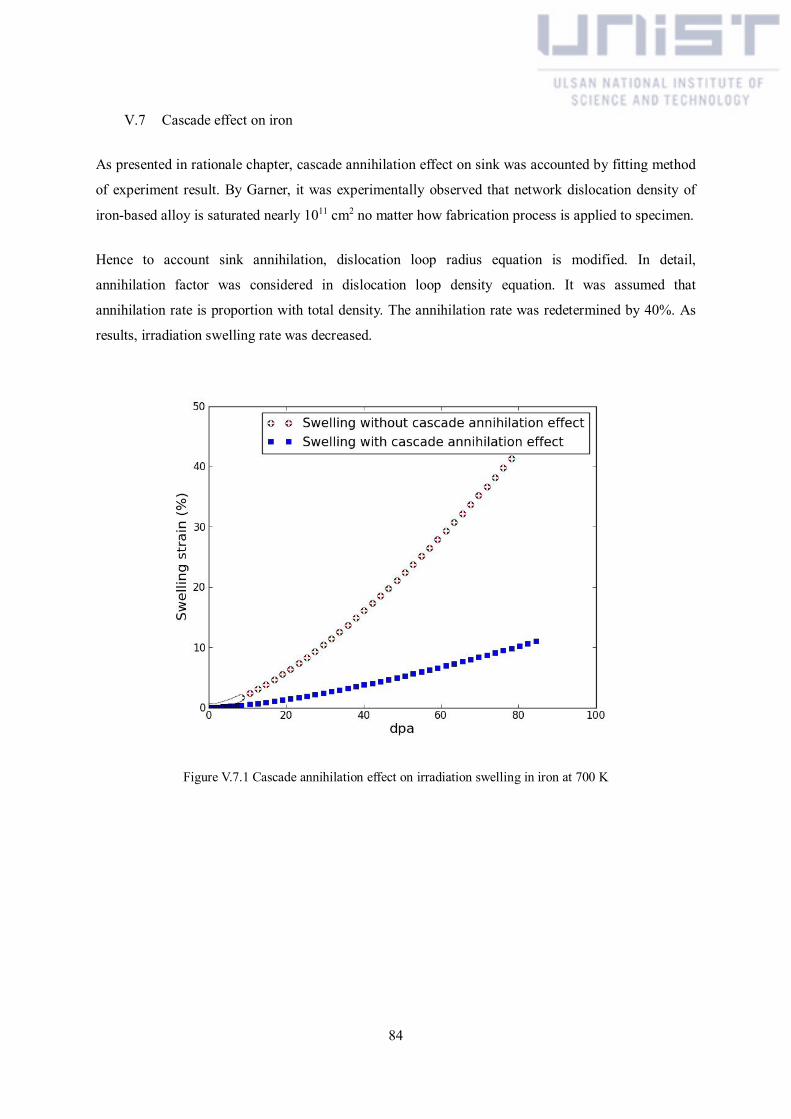
84
V.7 Cascade effect on iron
As presented in rationale chapter, cascade annihilation effect on sink was accounted by fitting method
of experiment result. By Garner, it was experimentally observed that network dislocation density of
iron-based alloy is saturated nearly 1011 cm2 no matter how fabrication process is applied to specimen.
Hence to account sink annihilation, dislocation loop radius equation is modified. In detail,
annihilation factor was considered in dislocation loop density equation. It was assumed that
annihilation rate is proportion with total density. The annihilation rate was redetermined by 40%. As
results, irradiation swelling rate was decreased.
Figure V.7.1 Cascade annihilation effect on irradiation swelling in iron at 700 K
85
V.8 Limitation of CDM frame and PBM approach as a possible breakthrough
In the previous section, irradiation swelling and creep could be analyzed with the CDM approach.
However, as referred in rationale chapter, void lattice ordering had been founded many years ago.
Which phenomenon could not be explained by traditional rate theory such as CDM. Not only just this
void lattice ordering, High swelling rates in low dislocation density and void swelling near grain
boundary are typical examples, what traditional rate theory could not be used. Hence, Singh and Woo
suggested new rate theory, which calls PBM by considering cascade. At firstly it was assumed that
SIAs cluster will survive after cascade relaxation and react with a mobile sink. Recently it was
revealed that 1-D mobile SIAs cluster with sinks is the main reaction mechanism. Until now, PBM is
the most advance rate theory to explain radiation damage phenomenon including microstructure.
However, as shown in this Table V.8.1, PBM do not use to predict irradiation degradation, a simple
cluster dynamic model is adopted for many authors. Because PBM has critical limitations. Actual
cladding material, void lattice ordering does not occur. And Singh-Foreman catastrophe does not
occur.
Nevertheless, it is deniable that all study has the same limitation that neglecting the 1-D SIAs. Hence
the point is what kind of mechanism is applied to change the frame from PBM to CDM. In another
way, the specific mechanism has to be considered in rate theory. Although many authors in Table V.8.1
do not consider specific mechanism which can neglect PBM, all of them insist that that atomic
simulation could be the solution to overcome the limitation of rate theory.
Table V.8.1 Various rate theory study about iron-based alloy steel
E.M. Getto, (2016), USA
A. Gokhman (2011), Ukraine
E. Meslin (2008), France
A. H. Duparc (2002), France
Model CDM CDM CDM CDM
Temp. 440 ~ 480 ℃ 300 ℃ 200 ~ 400 ℃ 300 ~ 600 ℃
Materials F/M steel & HT-9 Fe-12.5 Cr alloys Pure iron Fe-0.13 Cu alloys
Pressure Non Non Non Non
Source Iron+ (ions) Neutron Kr+ (ions) Electron
Target subject Cladding for FBR Cladding for FBR PBV for PWR PBV for PWR
dpa 180 ~ 650 0.6, 1.5
Code DLSODE (Fortran) LSODA (Fortran)

86
Recently, there are many MD and ab-initio study about stress and alloy effect on defect behavior.
Because the strain field is distorted mainly by stress and alloy element. Which is never systemically
organized in rate theory. Therefore, it is natural to think about that stress effect on SIAs in PBM could
give hint to interpret this frame change. Stress effect on frame change is not new idea. It already
suggested by ORNL research team. They suggested that the correlation between dislocation and void
could be the reason of unsaturated void growth. Hence verification of external stress effect on PBM
could be indirect evidence of Barashev suggestion [26]. Moreover, quantitatively analyze is possible
to derive how much energy is needed to frame change from PBM to CDM.
Hence irradiation swelling was predicted by establishing the PBM master equation. As expected,
irradiation swelling is saturated with steady-state defect concentration as shown in Figure V.8.1. In the
experiment, pure iron swelling is much higher than that of simulation. Moreover, recent experimental
research suggests that pure iron also depends on dpa. Therefore, more fundamental study about defect
reaction mechanism with sink should be needed a more fundamental study.
Figure V.8.1 Stress effect on irradiation swelling behavior in iron by PBM

87
VI Discussion
In this study, RIDI behavior of zirconium and iron-based alloy were analyzed. The modeling of RIDI
was derived by combing the rate theory and results of state of art simulation. As results, more
improved understanding could be possible by considering alloying element and stress effects.
However, although, as referred in rationale chapter, all simulation has certain limitations because
various assumption and its induced limitation are still a barrier to grasp the fundamental
understanding. Therefore, in this discussion chapter, among the various limitations, major issues were
treated, and then path forward was dealt.

88
VI.1 Parametric study
Various parameters are used in rate theory to calculate the defect generation rate, defect recombination
rate, and defect absorption rate. Among various parameters in master equations, independent variables
are defect generate rate, defect diffusivity and each sink bias factor. In case of sink density and
concentration is a dependent variable. Hence in this section, those parameters were examined to
define the limitation of this thesis and to see the possibility to improve it’s limitations.
VI.1.1Defect generation rate
Defect generation term is the most important parameters to determine RIDI as input data. Hence dpa
is suggested and calculated, based on the NRT method, to unify the degree of radiation damage with
various neutron spectrum by different reactor type. However, detail calculation sequence of dpa is not
suggested. It is specious that same calculation methodology is adopted to obtain dpa for each
experiment.
Fortunately, in case of zirconium, experimental data of irradiation growth was researched by one
extensive experimental project from NRL of UKAEA. In NRR programs, the same reactor (DIDO)
was used, hence direct comparison by each experimental result was possible [70]. At that time,
experimental results were presented by fluence. Recently F. Christien represents these results with dpa
by assuming that 1 dpa has the same effect with 7 × 1024 fluence in DIDO reactor without any proof
[57]. From the F. Christen simulation result for single crystal zirconium, diffusivity was used as fitting
parameters. Therefore, the simulation result should be well matched with experimental results.
However, in case of an iron-based alloy, irradiation swelling is independently researched by many
research groups with various reactors. Although experimental results are expressed by dpa, it cannot
be assured that every researcher used a standardized method for calculating the dpa. Following the
Garner’s statements, some experimental results show the incorrect calculation of dpa [48].
VI.1.2Diffusivity
As referred in the previous section, defect generation rate is the most important criteria. However,
diffusivity and concentration also determine the recombination rate and absorption rate. Since defect
concentration is also determined by diffusivity, diffusivity is the only independent variable.
In case of zirconium, after the 1980s, only two research groups have used the rate theory, i.e. F.
Christien in France and S.I Golubov in the U.S.A. Both research groups use the diffusion coefficient

89
as a fitting factor [58]. In the results chapter, diffusivity values of zirconium were adopted from F.
Christien. Hence these values are needed to be validated with experimental and simulation results. In
detail, since the only the fitting value of diffusivity is applied to predict the irradiation growth of
zirconium, dislocation radius should be compared between calculation and experimental results.
Moreover, simulation results of diffusivity were not suggested for zirconium in CANDU reactor
condition. Therefore, extensive study is suggested for the fundamental understanding.
In case of iron-based alloy, the situation is better than zirconium case, because C.C. Fu simulation
results were used as diffusivity value [64]. Moreover, C.C. Fu simulation result for diffusivity had
been calibrated by comparing the microstructure analysis. In A.H. Duparc study, 1 MeV irradiations is
used as a microscope for experimental observation. It was revealed that interstitial migration energy
should be modified from C.C. Fu simulation results, i.e. migration energy should be increased from
0.3 to 1 eV and binding energy of di-interstitial should be decreased from 0.9 to 0.2 eV. Therefore, the
calculation result of this study could be more reliability when it compared with that of Duparc results.
In case of E. Meslin, to calibrate the diffusion coefficient, point defect clustering is simulated and its
results were comprised by experimental data under cascade damage conditions [71]. The difference of
H. Duparc study is considering of cascade phenomenon [63]. Various activation energy is obtained
from C.C. Fu simulation results. Migration energy of interstitial and its cluster are ��� = 0.34, ��
�� =
0.34, ���� = 0.42; Respectively, vacancy type cluster has ��
� = 0.67, ���� = 0.62, ��
�� = 0.35, and
���� = 0.48. Not only E. Meslin, there are many studies about radiation effect on materials. However,
it is believed that E. Mesline study is most extensive study because not only interstitial cluster but also
vacancy cluster mobility is accounted.
VI.1.2.1 Stress effect on defects
In this study, stress effect was considered in both way; In a conventional way, modified Brailsford
method is applied in zirconium; Recent MD simulation results were adopted in the iron-based alloy.
However, these methods are needed to be verified.
As described in the rationale and results chapter, there are mis-concept in the Brailsford model, it was
assumed that vacancy concentration in thermal equilibrium has an only negative effect on vacancy
defect flux �� = ���������� − ��
�������. However, the vacancy concentration in thermal equilibrium
could be positive effect. Moa reover, recently, vacancy emission from sink is already the considered in
rate theory as binding energy. Hence Brailsford model is modified as figure

90
Figure VI.1.1 Brailsford method vs modified Brailsford method
To validate modified method in iron-based alloy, calculation results are comprised with Brailsford
method. As shown in Figure VI.1.2, irradiation creep does not occur in Brailsford model whilst
modified model shows significant creep behavior with the same diffusion coefficient. However, both
calculations are carried out by over-simplified CDM. Only up-to tri-vacancy and tri-interstitial cluster
considered in the master equation. Therefore, the MD simulation result could not be verified. Three
approaches should be validated with the same rate theory frame.
The limitation in both conventional and recent method to consider stress effect is only one type of
defect is considered; In the conventional method, vacancy diffusivity is modified; In the recent
method, only interstitial considered. Both point defect should be considered in rate theory.
Not only irradiation creep, but also irradiation swelling is affected by stress. However, stress effect on
binding energy of cluster defects had not been researched. From the experiment, it was clear that
irradiation swelling rate could be increased depending on temperature and stress. In this simulation,
only irradiation creep is calculated when stress is applied. Hence both irradiation swelling and creep
should be simultaneously verified.

91
Figure VI.1.2 Calculation result by Brailsford method and modified Brailsford method in iron at 700 K
VI.1.2.2 Alloy element effect on defects
In conventional method to consider alloying element effect, the oversimplified assumption is applied.
Since precipitates is treated as a neutrally-biased sink, defect flux of vacancy should be a negative
value at the initial stage as shown in Figure VI.1.3. Which is an inevitable phenomenon to compensate
with interstitial flux. Hence in this study, vacancy concentration behavior is controlled by “if” state in
python code to be a positive value as shown in Figure VI.1.4. Nevertheless, vacancy absorption rate
should be modified at the initial stage because the precipitate effect is so strong. The effective radius
of the precipitation could be indirectly observed by TEM analysis. From the TEM analysis, highly
distorted areas seem to have only two or three layers. Therefore, a modified approach is needed by
considering the effective radius concept.

92
Figure VI.1.3 Defect concentration behavior in iron by a conventional method
Figure VI.1.4 Defect concentration behavior in iron by this work

93
Not only the conventional method but also a recent method has certain limitation. In MD simulation,
the correlation between defect and solution state of the alloying element was considered. However,
alloying element changes the hole microstructure. Not only basic lattice structure, but also grain
boundary size, texture, sink morphology and sink density etc. are affected by alloying element.
However, MD simulation is not enough to consider hole microstructure information.
VI.1.3Bias factor
The third limitation is bias factor, which is about capture efficiency. In the previous section, only bulk
diffusivity was treated. However, defect behavior near the sink is totally different from the normal
lattice matrix because sink distorts the matrix by strain field. Obviously, this strain field is not
constant because sink morphology is changed by external stress and alloying elements. However, in
this paper, the value was assumed constant regardless of environment condition. Despite this
recognition, there is no general theory or systemically method to analyze the bias factor. Although,
C.H. Wo. and G. Gosele use elegant elastic theory to obtain the bias factor [2, 34]. However, recent
simulation result denied those results. Hence, direct observation of defect reaction with sink is
presented by long-time atomic simulation from ORNL. Nevertheless, the bias factor could be derived
directly from this observation. The methodology should be suggested to derive a bias factor from the
direct observation. Because of reaction kinetics is the heart of defect reaction mechanism, capture
efficiency should be systemically researched to establish the general model in radiation effect on
metals.
VI.1.4Sink density
Sink number density and radius were also important parameter to determine the defect absorption rate.
Up to present, sink number density and radius were analyzed based on defect flux. There was no study
about cascade annihilation of the sink. In this study, cascade annihilation of the sink was accounted by
considering the saturation of sink density.
The different approach had been used in zirconium and iron-based alloy. In case of zirconium, number
density was obtained from the experimental result because SRT is used. In case of ion-based alloy,
number density was derived by CDM.
Since the experimental result of sink number density is used as input parameters in zirconium case,
Therefore, cascade annihilation is already accounted. In detail, it was revealed that dislocation number
density and radius were saturated at certain dpa [72]. In case of <a> dislocation, saturation is occurred
at 4 dpa whilst <c> dislocation is saturated as 7 dpa. At that time, this saturation phenomenon was not

94
considered as cascade annihilation of the sink. Nevertheless, there was no recognition about cascade
annihilation of the sink, it was successfully adopted in rate theory.
However, in case of iron-based alloy, CDM approach is adopted to explain the RIDI. Hence cascade
annihilation of the sink could not be considered as experimental results. Therefore, to account cascade
annihilation of the sink, a simplified approach is suggested
If it was assumed that all defect is annihilated in a cascade zone, the quantitative analysis could be
possible. In this point of view, the cascade zone should be derived, and then the annihilation rate will
could be derived. To derive the total size of cascade zone, depending on neutron spectrum, NRT
method or MD simulation should be applied with all energy group.

95
VI.2 Path forward
In the previous section, the most important parameters are examined to confirm the limitation of each
parameter. In this section, to see the other possibility of defect behavior, all defect reaction mechanism
will be examined, and then new methodology will be examined for the improved understanding.
VI.2.1Reaction kinetics of defects
From the PBM analysis, the defect reaction mechanism is expanded by 1-D diffusivity. Hence defect
reaction mechanism could be summarized 3 by 3 symmetry table as shown below Table VI.2.1.
Table VI.2.1 Defect reaction kinetics
Point defect (3-D mobile)SIAs cluster (1-D
mobile)Sink (immobile)
I type V type I I type V type Precipitate
Point defect
(3-D mobile)
I typeThe growth of
SIAs clusterRecombination
The growth of
SIAs cluster
The growth
of I type sink
Dissolution
of V type
sink
Recombination
V type RecombinationThe growth of
vacancy cluster
Dissolution of
SIAs cluster
Dissolution
of I type sink
The growth
of V type
sink
Recombination
SIAs cluster
(1-D mobile)I type
The growth of
SIAs cluster
Dissolution of
SIAs cluster
SIAs cluster
reaction with
SIAs cluster
The growth
of I type sink
Dissolution
of V type
sink
Recombination
Sink
(immobile)
I typeThe growth of I
type sink
Dissolution of v
type sink
The growth of I
type sink
Non
V typeDissolution of I
type sink
The growth of V
type sink
Dissolution of V
type sink
Precipitate Recombination Recombination Recombination

96
In Table VI.2.1, reaction kinetics could be characterized by five types of reactions. Among five
reactions, 3-D mobile & 3-D mobile / 3-D mobile & immobile / 1-D mobile & immobile reaction
were considered in rate theory, i.e. reaction 3-D mobile & immobile defect were considered in SRT
and CDM and reaction 1-D mobile & immobile defect was considered in PBM. However, two
reactions; 3-D mobile defect & 1-D mobile / 1-D mobile & 1-D mobile, were not considered in the
reaction mechanism. Those two mechanisms also should be considered in rate theory.
VI.2.2Frame of rate theory (SRT vs CDM vs PBM)
Recently many research activities on RIDI already have been done by using CDM. However, there is
no guarantee that the accuracy of CDM is better than the old approach of using experimental sink
densities and SRT. In this work, calculation results for single-crystal and cold-worked polycrystal
zirconium without considering the cluster is quite similar to the experiment result. From this result, it
is difficult to determine that cluster is the reason for the disagreement in radiation growth of annealed
polycrystal. Moreover, straight-forward master-equation-based formulation in CDM requires
microscopic information on the particle-cluster reaction (forward and backward) for each cluster size,
such as association and dissociation enthalpies and entropies of clusters, which is difficult to get and
many empirical assumptions have to be made. Hence, to develop this method, various parametric
information should be calculated and reaction probability by considering atomic configuration should
be obtained [40,41]. Also, CDM is based on the diffusion-controlled kinetics to explain reaction
between defect and cluster. Diffusion-controlled kinetics is not suitable method to predict the reaction
between defect and cluster. In case of small clusters, reaction-controlled kinetics is more suitable
method to describe reaction probability. In case of PBM, reaction kinetic is more complex than CDM.
In this situation, SRT is one of easy and simple tools to be applicable to and simulate various situation.
When PBM is compared with SRT/CDM, the frame is totally changed. In conventional way, the
origin of RIDI was freely migrating point defect. However, in case of PBM, RIDI is affected by 1-D
interstitial cluster. Hence, recently there are many studies about behavior of interstitial cluster.
Nevertheless, there is no general explanation about 1-D interstitial cluster effect on RIDI.
VI.2.3Cluster number density
In this study, only fifteen clusters (2 ≤ n ≤ 15) were accounted for cluster defect. Large Cluster (>
15) was assumed that it is directly developed as dislocation loop or void which has a uniform size. It
is obvious that lager number of the master equation will be more sophisticated to analyze the radiation
effect on materials. Nevertheless, the advance of the technic in grouping method, large calculation
time and high-performance computing system is needed. Hence in this study, a limited number of the

97
cluster were considered. As result, the simulation result is limited in its accuracy. However, an ode15s
module in MatLab provides unlimited number of the master equation. Therefore, more accurate
simulation is possible if Matlab module is possible in python.
VI.2.4He effects on iron-based alloy
He transmutation play the important role in RIDI because the stability of the void is determined by
implantation of He in vacancy cluster. However, in this study, He reaction between void did not
consider. Recently thermal stability of vacancy cluster and void are researched by OKMC. Hence by
adopting this research results, RIDI prediction could be more realistic for an engineering application.
VI.2.5Stochastical fluctuation
The rate theory is based on a deterministic method based on the mean field which means that rate
theory could not consider the heterogeneous generation and growth of sinks and defects in the matrix.
Hence sink size and morphology are uniform and microstructure characteristic could not be accounted.
Stochastic fluctuations can be an alternative method to explain the deviate between calculation results
and the experimental database [73]. In this approach, thermal and other noises could be taken into
account in reaction probability. Because of the complexity of CDM and PBM approach, classical rate
theory based on stochastic fluctuation could be more suitable for anisotropy materials. However, in
order to adopt this method, stochastic concept should be defined and understood in materials
perspective. This academic background is beyond this study.
VI.2.6Residual stress
In this paper, residual stress effects on the anisotropy factor were neglected in annealed polycyrstal.
However, Causey et al. revealed profound effects of residual stress in radiation growth [23]. In the
specific case, radiation growth occurs in opposite direction to relax residual stress. After the relaxation,
the strain shows a common tendency. To describe this effect, the upper-bound model was used since
this model base on the numerical method. Unfortunately, there is no available data about residual
stress of the specimen, which was used for in this paper. Moreover, single crystal compliances also
should be calculated by Hill’s criteria and Eshelby model in hexagonal structural slip system. This
method also will be adopted in the next research step.

98
VII Conclusion
In this study, stress, alloy and cascade annihilation effects were considered with conventional and
recent method to improve the fundamental understanding of the RIDI. Stress effect was account by
modifying the defect diffusivity. Brailsford method, modified Brailsford method and result of MD
simulation are adopted to modify the diffusivity. In case of alloying element effect, precipitation effect
was considered as conventional method, and then solute state effect on defect diffusivity was
considered by MD simulation results. Cascade annihilation effect on sink was accounted by fitting
method from the experimental result.
Since the 1960s, RIDI of structural materials has been the most important phenomena in nuclear
reactors. However, there is no general model of RIDI, which could also explain microstructural
changes, owing to lack of knowledge of the fundamental understanding of atomistic behavior.
Recently, not only rate theory but also various simulation tools were developed to analyze the RIDI.
Molecular dynamic simulation and kinetic Monte Carlo simulation are representative simulation tools.
Although those various research tools with significant progress in computer performance, rate theory
is still a favorite option to simulate radiation effect on materials since this method can give instinctive
understanding with short computation time. Moreover, the scale of simulation time and simulation
length is large enough to satisfy the engineering point of view whilst another simulation method still
need a lot of limitation of time and length scale. Therefore, systematically organization of fragmented
knowledge by combining state of art simulation method with rate theory would be valuable work.
Fortunately, in-situ experimental equipment, which could detect the sink development behavior, have
been developed. From this advanced experimental equipment, validation of advanced rate theory
could take one step further to grab fundamental understanding and engineering value.
So far, rate theory plays the assistant role to analyze the integrity of structural material by suggesting
the radiation-induced degradation mechanism. However, recently, there is research trend to predict the
life of structural materials by simulation approach. This means that the simulation approach could be
the main method to determine the nuclear system design. In this point of view, the author thinks that
the result of the study could give engineering contribution to nuclear society.
Therefore, the following summarizes is a part of effort to improved limitation of perception of RIDI
by systematically organizing the fragmented knowledge of atomic behavior in various condition.

99
VII.1 Zirconium and its alloys
In order to maintain a consistent viewpoint, annealed single crystal, annealed polycrystal and cold-
worked polycrystal were predicted with same SRT method, and then, stress and alloying element
effect were verified by considering the modified diffusivity and precipitation. The simulation target
environment was condition of pressure tube in CANDU reactor. So far, there was no research to
predict both single crystal and polycrystal with same rate theory.
In case of single, the defect concentration shows typical low-sink-density behavior. Hence the defect
flux initially increases at 10-9 dpa and immediately afterward decreases up to 1 dpa. From the defect
flux, sinks radius was calculated. Initially, the <a> dislocation loop density increases dramatically,
whereas that of <c> type loops increases above 3 dpa. Next, the density of both types of dislocation
loops shows a saturation region. The <a> dislocation loops are generated by the net interstitial defect
flux behavior. However, <c> dislocation loops generation and growth are caused by the net vacancy
flux. Irradiation growth was calculated by sink development, and then calculation result was
compared with experimental measurements by Carpenter. Although the experimental values of the
growth strain were higher than the calculation data at 2–6 dpa, the overall growth tendency is similar to
that of the experimental database and other irradiation growth models.
In cold-worked polycrystal zirconium, the defect concentration shows typical high-sink-density
behavior. The dislocation line density was assumed to be a time-independent parameter. (Since the
density of dislocation line in cold-worked zirconium is already sufficiently developed, there is no
chance to develop the dislocation loop) The irradiation growth strain of cold-worked polycrystal
zirconium is also quite similar to experimental results. In this case, dislocation line sink effects are
dominant. Therefore, irradiation growth shows very simple behavior, i.e. a linear increase with dpa.
In annealed polycrystal zirconium, the defect concentration shows intermediate-sink-density behavior.
Unlike the case for the single crystal, the <c> dislocation loop radius is much larger than the <a>
dislocation loop radius. The <a> dislocation loop density has the shape of a semicircle before 4 dpa,
after which <a> dislocation loops are saturated. However, <c> dislocations have a much higher sink
strength than <a> dislocation loops. Calculation results show high growth strain initially. However,
after 1 dpa, the calculated strain shows a much slower increase.
To account stress effect on diffusivity, activation energy is modified as same approach method in
diffusional creep model. In detail, as described rationale chapter, stress effect also considered by
modified Arrhenius formulation. In case of cold-worked zirconium alloy, it was assumed that
dislocation density is already saturated. Hence, for the simplification, simulation was carried out only

100
in cold-worked zirconium case because sinks number density and radius behavior did not need to be
analyzed. As results, strain rate of irradiation creep is accelerated depending of stress. At 10 dpa,
irradiation growth shows 0.3 % strain, whilst 1.1 % strain of irradiation creep was obtained by 100
Mpa.
In this study, alloy effect on RIDI were considered in the other way, which has never been considered
in rate theory for RIDI, i.e. solid solution effect was considered. In detail, Christensen [35] calculate
the interstitial diffusivity within 0.5 % of Nb and 2.5 % Sn and in zirconium matrix. Hence
Christensen reveal that Nb decrease the interstitial diffusivity nearly 1/5.64 at 500 K and 1/5.88 at 700
K with 0.5 % Nb in zirconium. Also, same method was applied to account the Sn effect. Sn shows the
high dependency with temperature and relatively less effect than Nb. Interstitial diffusivity is
decreased about 1/4.05 at 500 K and 1/1.38 at 700 K with 2.5 Sn. This information was adopted in
rate theory and then irradiation growth was predicted. By adding 0.5 % Nb in cold-worked zirconium,
0.2 % strain is obtained whilst cold-worked pure zirconium shows nearly 0.3 % strain at 10 dpa. Since
there was no experiment about irradiation growth of Zr-0.5% Nb and Zr-2.5Nb experimental results
was compared and simulation results shows good agreement.

101
VII.2 Iron-based alloy
In case of iron-based alloy, the nucleation and growth behavior of sinks were simulated by CDM
approach, and then stress, alloying element and cascade annihilation effect were considered. Unlike
zirconium case, different method is applied to account stress and alloying element effect. In detail,
Migration energy was derived by MD simulation and adopted in rate theory to account stress effect.
The defect concentration of pure iron show typical high-temperature behavior, both point and cluster
defects are saturated at 10-6 dpa. This fast saturation is occurred by fast recombination and absorption
phenomena [8]. From defect concentration, cluster number density is derived by calculating the
absorption rate. Number density shows same trend of cluster defects because number density is
obtained from the largest cluster concentration.
The both sink radius were increased at 10-6 dpa because number density is too low. And then until 10-4
dpa, both radiuses were decreased. The discrepancy between two sinks is happened after 10-4 dpa. In
case of void, absorption rate is much higher than emission rate hence radius growth with given
number density. However, in case of dislocation loop were dissolved at 700 K condition.
Base on the result of number density, the radius of sinks was calculated, and then irradiation swelling
simulated. The irradiation swelling shows exponential shape by dpa. It is predictable behavior because
radius increase as exponentially with saturated number density. This behavior was already confirmed
in experiment result in EBR II or FFTF [6].
In zirconium results chapter, stress effect was accounted by modifying the Brailsford model. However,
as described in rationale chapter, stress effect could be directly considered by MD simulation. Hence
MD simulation method were adopted to calculated interstitial diffusivity. As result, stress effect on
diffusivity was calculated. It was observed that diffusivity of interstitial has 8.437 × 10⁻⁵ cm2 /s at
873 K. This value was 11 times higher than non-stress applied condition (7.414 × 10⁻⁶ cm2 /s). From
the calculation interstitial diffusivity, concentration of defect and cluster, radius, and swelling is
recalculated. The purpose of research is prediction of ultra-long fuel cycle, 600 Mpa is applied. Up to
the 10 dpa, irradiation creep shows 40% elongation with the stress applied direction.
In case of zirconium alloy, solute state of alloy effect was considered. However, in case of iron-based
alloy, precipitation effect was considered by traditional method. From established irradiation swelling
model, precipitation effect was considered, and then defect concertation and swelling was calculated.
Since precipitation provide recombination site, vacancy flux has to be compensated with interstitial
flux. As result, vacancy concentration is decreased. In case of precipitation case, total concentration is

102
lower than that of non-precipitation case. Nevertheless, general behavior of radius and swelling did
not change. However, total swelling is much decreased. When it compares with experimental results,
swelling rate of non-precipitation has same slope with SS316 steel. In case of swelling rate of
precipitation, F17 experimental results are well matched. Since precipitation number density and size
were adopted from microstructure analysis of F17, it is obvious behavior.

103
References
[1] B. N. Singh, S. I. Golubov, H. Trinkaus, A. Serra, Y. N. Osetsky, and A. V. Barashev, "Aspects of microstructure evolution under cascade damage conditions," Journal of Nuclear Materials, Article vol. 251, pp. 107-122, 1997.
[2] C. H. Woo, "Theory of irradiation deformation in non-cubic metals effects of anisotropic diffusion," Journal of Nuclear Materials, vol. 159, pp. 237-256, 1988.
[3] M. Kiritani, "Analysis of the clustering process of supersaturated lattice vacancies," Journal of the Physical Society of Japan, vol. 35, no. 1, pp. 95-107, 1973/07/15 1973.
[4] R. H. Johnson and G. W. Greenwood, "Deformation of uranium during alpha/beta cycles under small stresses and a quantitative interpretation of the mechanical weakness of metals undergoing phase transformations," Nature, vol. 195, p. 138, 07/14/online 1962.
[5] E. P. Wigner, "Theoretical physics in the metallurgical laboratory of chicago," Journal of Applied Physics, vol. 17, no. 11, pp. 857-863, 1946/11/01 1946.
[6] C. Cawthorne and E. J. Fulton, "Voids in irradiated stainless steel," Nature, Letter vol. 216, no. 5115, pp. 575-576, 1967.
[7] B. A. Loomis, T. H. Blewitt, A. C. Klank, and S. B. Gerber, "Elongation of uranium single crystals during neutron irradiation," Applied Physics Letters, vol. 5, no. 7, pp. 135-137, 1964.
[8] G. S. Was, "fundamentals of radiation materiasl science," 2007.
[9] K. Farrell, "5.07 - Performance of Aluminum in Research Reactors," in Comprehensive Nuclear Materials, R. J. M. Konings, Ed. Oxford: Elsevier, 2012, pp. 143-175.
[10] F. A. Garner, "Irradiation Performance of Cladding and Structural Steels in Liquid Metal Reactors," Materials Science and Technology, 2006.
[11] R. Krishnan and M. K. Asundi, "Zirconium alloys in nuclear technology," Proceedings of the Indian Academy of Sciences Section C: Engineering Sciences, journal article vol. 4, no. 1, pp. 41-56, April 01 1981.
[12] S. N. Buckley, Proc. Int. Conf. on Properties of Reactor Materials and the Effects of Radiation Damage, Butterworths, London, p. 413, 1962.
[13] V. FIDLERIS, "The irradiation creep and growth phenomena," Journal of Nuclear Materials, vol. 159, pp. 22-42, 1988.
[14] R. B. Adamson, zirconium in the nuclear industry, vol. ASTM 633 p. 326, 1977.
[15] A. Rogerson and R. A. Murgatroyd, "Effects of texture and temperature cycling on irradiation growth in cold-worked zircaloy-2 at 353 and 553 K," Journal of Nuclear Materials, vol. 80, pp. 253-259, 1979.

104
[16] A. Rogerson and R. H. Zee, "High fluence irradiation growth in single crystal zirconium at 553 K," journal of Nuclear Materials, vol. 151, pp. 81-83, 1987.
[17] A. Rogerson and R. A. Murgatroyd, "‘Breakaway’ growth in annealed zircaloy-2 at 353 K and 553 K," Journal of Nuclear Materials, vol. 113, pp. 256-259, 1983.
[18] A. R. Causey, "Acceleration of creep and growth of annealed zircaloy-4," Journal of Nuclear Materials, vol. 193, pp. 277-278, 1986.
[19] R. A. Holt, "In-reactor deformation of cold-worked Zr–2.5Nb pressure tubes," Journal of Nuclear Materials, vol. 372, no. 2, pp. 182-214, 2008/01/31/ 2008.
[20] E. A. Little, "Void-swelling in irons and ferritic steels: I. Mechanisms of swelling suppression," Journal of Nuclear Materials, vol. 87, no. 1, pp. 11-24, 1979/11/01/ 1979.
[21] D. S. Gelles, "Microstructural examination of several commercial alloys neutron irradiated to 100 dpa," Journal of Nuclear Materials, vol. 148, no. 2, pp. 136-144, 1987/04/01/ 1987.
[22] P. Dubuisson, D. Gilbon, and J. L. Séran, "Microstructural evolution of ferritic-martensitic steels irradiated in the fast breeder reactor Phénix," Journal of Nuclear Materials, vol. 205, pp. 178-189, 1993/10/01/ 1993.
[23] R. L. Klueh and A. T. Nelson, "Ferritic/martensitic steels for next-generation reactors," Journal of Nuclear Materials, vol. 371, no. 1, pp. 37-52, 2007/09/15/ 2007.
[24] L. K. Mansur, "Void swelling in metals and alloys under irradiation: an assessment of the theory," Nuclear Technology, vol. 40, no. 1, pp. 5-34, 1978/08/01 1978.
[25] R. Sizmann, "The effect of radiation upon diffusion in metals," Journal of Nuclear Materials, vol. 69-70, no. C, pp. 386-412, 1968.
[26] A. V. Barashev and S. I. Golubov, "Steady-state size distribution of voids in metals under cascade irradiation," Journal of Nuclear Materials, vol. 389, no. 3, pp. 407-409, 6/1/ 2009.
[27] T. R. Waite, "Theoretical Treatment of the Kinetics of Diffusion-Limited Reactions," Physical Review, vol. 107, no. 2, pp. 463-470, 07/15/ 1957.
[28] U. Gösele and A. Seeger, "Theory of bimolecular reaction rates limited by anisotropic diffusion," The Philosophical Magazine: A Journal of Theoretical Experimental and Applied Physics, vol. 34, no. 2, pp. 177-193, 1976/08/01 1976.
[29] S. J. Zinkle and B. N. Singh, "Analysis of displacement damage and defect production under cascade damage conditions," Journal of Nuclear Materials, vol. 199, no. 3, pp. 173-191, 1993/02/01/ 1993.
[30] M. J. Banisalman, S. Park, and T. Oda, "Evaluation of the threshold displacement energy in tungsten by molecular dynamics calculations," Journal of Nuclear Materials, vol. 495, pp. 277-284, 2017/11/01/ 2017.
[31] M. J. Norgett, M. T. Robinson, and I. M. Torrens, "A proposed method of calculating displacement dose rates," Nuclear Engineering and Design, vol. 33, no. 1, pp. 50-54,

105
1975/08/01/ 1975.
[32] A. D. Brailsford and R. Bullough, "The rate theory of swelling due to void growth in irradiated metals," Journal of Nuclear Materials, vol. 44, pp. 121-135, 1972.
[33] A. D. Brailsford and R. Bullough, "Irradiation creep due to the growth of interstitial loops," Philosophical Magazine, vol. 27, no. 1, pp. 49-64, 1973.
[34] U. Gösele, "Anisotropic diffusion, long-range energy transfer and bimolecular exciton recombination kinetics," Chemical Physics Letters, Article vol. 43, no. 1, pp. 61-64, 1976.
[35] G. D. Samolyuk, A. V. Barashev, S. I. Golubov, Y. N. Osetsky, and R. E. Stoller, "Analysis of the anisotropy of point defect diffusion in hcp Zr," Acta Materialia, Article vol. 78, pp. 173-180, 2014.
[36] A. Rogerson, "Irradiation growth in zirconium and its alloys," Journal of Nuclear Materials, 1988.
[37] C. Kang, Q. Wang, and L. Shao, "Kinetics of interstitial defects in α-Fe: The effect from uniaxial stress," Journal of Nuclear Materials, vol. 485, pp. 159-168, 2017/03/01/ 2017.
[38] F. Christien and A. Barbu, "Modelling of copper precipitation in iron during thermal aging and irradiation," Journal of Nuclear Materials, vol. 324, no. 2-3, pp. 90-96, 2004.
[39] W. Xu et al., "In-situ atomic-scale observation of irradiation-induced void formation," Nature Communications, Article vol. 4, p. 2288, 08/05/online 2013.
[40] A. Ervin and H. Xu, "Mesoscale simulations of radiation damage effects in Materials: A SEAKMC perspective," Computational Materials Science, vol. 150, pp. 180-189, 2018/07/01/ 2018.
[41] Y. Zhang, H. Huang, P. C. Millett, M. Tonks, D. Wolf, and S. R. Phillpot, "Atomistic study of grain boundary sink strength under prolonged electron irradiation," Journal of Nuclear Materials, vol. 422, no. 1, pp. 69-76, 2012/03/01/ 2012.
[42] M. Kiritani, "Microstructure evolution during irradiation," Journal of Nuclear Materials, vol. 216, pp. 220-264, 1994.
[43] S. I. Golubov, A. M. Ovcharenko, A. V. Barashev, and B. N. Singh, "Grouping method for the approximate solution of a kinetic equation describing the evolution of point-defect clusters," Philosophical Magazine A, vol. 81, no. 3, pp. 643-658, 2001/03/01 2001.
[44] S. I. Golubov, B. N. Singh, and H. Trinkaus, "Defect accumulation in fcc and bcc metals and alloys under cascade damage conditions - towards a generalization of the production bias model," Journal of Nuclear Materials, Article vol. 276, no. 1, pp. 78-89, 2000.
[45] V. A. Borodin, "Rate theory for one-dimensional diffusion," Physica A: Statistical Mechanics and its Applications, vol. 260, no. 3, pp. 467-478, 1998/11/15/ 1998.
[46] S. I. Choi, G.-G. Lee, J. Kwon, and J. H. Kim, "Modeling of sink-induced irradiation growth of single-crystal and polycrystal zirconiums in nuclear reactors," Journal of Nuclear

106
Materials, vol. 468, pp. 56-70, 2016.
[47] A. D. Brailsford and R. Bullough, "Void growth and its relation to intrinsic point defect properties," Journal of Nuclear Materials, vol. 49&70, pp. 434-450, 1978.
[48] F. Garner, "irradiation performance of cladding and structural steels in liquid metal reactors," in Materials Science and Technology: Wiley-VCH Verlag GmbH & Co. KGaA, 2006.
[49] M. Luts, "Programming Python," ed: O'Reilly Media, 1996.
[50] O. E. Jones E, Peterson P, et al., "SciPy: open source scientific tools for Python. 2001," 2012.
[51] R. V. Hesketh, "Non-linear growth in zircaloy-4," Journal of Nuclear Materials, vol. 30, no. 1–2, pp. 219-221, 1969.
[52] G. J. C. Carpenter and D. O. Northwood, "The contribution of dislocation loops to radiation growth and creep of Zircaloy - 2," Journal of Nuclear Materials, vol. 56, no. 3, pp. 260-266, 1975.
[53] C. C. Dollins, "In-pile dimensional changes in neutron irradiated zirconium base alloys," Journal of Nuclear Materials, vol. 59, no. 1, pp. 61-76, 1976.
[54] D. Fainstein-pedraza, E. J. Sawno, and A. J. Pedraza, "irradiation-growth of zirconium-base alloys," Journal of Nuclear Materials, vol. 73, pp. 151-168, 1978.
[55] S. R. MacEWEN and G. J. C. Carpenter, "Calculations of irradiation growth in zirconium," Journal of Nuclear Materials, vol. 90, pp. 108-132, 1980.
[56] R. Bullough and M. H. Wood, "Mechanisms of radiation induced creep and growth," journal of Nuclear Materials, vol. 90, pp. 1-21, 1980.
[57] F. Christien and A. Barbu, "Cluster dynamics modelling of irradiation growth of zirconium single crystals," Journal of Nuclear Materials, vol. 393, no. 1, pp. 153-161, 2009.
[58] S. I. Golubov, A. V. Barashev, and R. R. Stoller, "On the origin of radiation growth of hcp crystals" ONRL, 2011.
[59] M. Griffiths, "A review of microstructure evolution in zirconium alloys during irradiation," Journal of Nuclear Materials, vol. 159, pp. 190-218, 1988.
[60] A. D. Braislford and R. Bullough, "Void growth and its relation to intrinsic point defect properties," Journal of Nuclear Materials, vol. 69–70, no. 0, pp. 434-450, 1978.
[61] F. Onimus and J. L. Béchade, "4.01 - Radiation Effects in Zirconium Alloys," in Comprehensive Nuclear Materials, R. J. M. Konings, Ed. Oxford: Elsevier, 2012, pp. 1-31.
[62] D. S. Gelles, "Microstructural examination of neutron-irradiated simple ferritic alloys," Journal of Nuclear Materials, vol. 108-109, pp. 515-526, 1982/07/01/ 1982.
[63] A. Hardouin Duparc, C. Moingeon, N. Smetniansky-de-Grande, and A. Barbu,

107
"Microstructure modelling of ferritic alloys under high flux 1 MeV electron irradiations," Journal of Nuclear Materials, vol. 302, no. 2–3, pp. 143-155, 2002.
[64] C.-C. Fu, J. D. Torre, F. Willaime, J.-L. Bocquet, and A. Barbu, "Multiscale modelling of defect kinetics in irradiated iron," Nature Materials, vol. 4, no. 1, pp. 68-74, 2004.
[65] K. Morishita, B. D. Wirth, T. Diaz de la Rubia, and A. Kimura, "Effects of helium on radiation damage processes in iron", 4th Pacific Rim International Conference on Advanced Materials and Processing, 2001
[66] J. A. Jung, S. H. Kim, S. H. Shin, I. C. Bang, and J. H. Kim, "Feasibility study of fuel cladding performance for application in ultra-long cycle fast reactor," Journal of Nuclear Materials, vol. 440, no. 1–3, pp. 596-605, 2013.
[67] S. I. C. Kwang Beom Ko, Ji Hyun Kim, "Multi-scale Modeling Study of Irradiation Behavior of Reduced Activation Ferritic Martensitic Steels," The 12th International Symposium on Fusion Nuclear Technology, 2015.
[68] F. A. Garner, M. B. Toloczko, and B. H. Sencer, "Comparison of swelling and irradiation creep behavior of fcc-austenitic and bcc-ferritic/martensitic alloys at high neutron exposure," Journal of Nuclear Materials, vol. 276, no. 1, pp. 123-142, 2000/01/01/ 2000.
[69] M. J. Banisalman, S. Park, and T. Oda, "Evaluation of the threshold displacement energy in tungsten by molecular dynamics calculations," Journal of Nuclear Materials, vol. 495, no. Supplement C, pp. 277-284, 2017/11/01/ 2017.
[70] A. Rogerson, "Irradiation growth in annf,aled and 25% cold-worked zircaloy-2 between 353 -673 K," Journal of Nuclear Materials, vol. 154, pp. 276-285, 1988.
[71] E. Meslin, B. Radiguet, and M. Loyer-Prost, "Radiation-induced precipitation in a ferritic model alloy: An experimental and theoretical study," Acta Materialia, vol. 61, no. 16, pp. 6246-6254, 2013/09/01/ 2013.
[72] D. O. Northwood and W. Gilbert,"Neutron radiationdamage in zirconium and itsalloys," Radiation Effects, vol. 22, no. 139-140, 1974.
[73] A. A. Semenov and C. H. Woo, "Stochastic fluctuations and microstructural evolution during irradiation by neutrons and heavy ions," Journal of Nuclear Materials, vol. 205, pp. 74-83, 1993/10/01 1993.

108
Acknowledgment
지난 석사 박사 시간을 되돌아보면, 너무나 많은 분들에게 큰 도움을 받았기에, 어떻게 감사의
인사 말을 전달해야 될지 잘 모르겠습니다. 그러나 제 나름의 기준을 작용하여, 고마운 분들에게
감사의 인사 말을 전하고자 합니다.
우선, 가족인 어머니, 누나에게 감사의 인사를 제일 먼저 드리고 싶습니다. 두 분이 제에게 주신
무한한 사랑과 배려, 인내심이 있었기에 지금의 제가 있을 수 있었다고 생각합니다. 항상
감사하게 생각 하고 있습니다. 특히나, 어머니. 어머니께서 주신 사랑은 다른 이를 포용할 용기를
주셨습니다. 어머님에게 배운 강인한 정신과 사랑은 남은 인생에서 가장 중요한 이정표로서
역할을 할 것입니다. 부디, 건강하게 오래 사셔서, 제가 은혜를 갚을 시간을 보다 많이 주시기를
간절히 기원합니다.
두번째로 김지현 지도 교수님께 감사의 인사를 올립니다. 교수님께는 비단 단순한 지식뿐만
아니라, 연구자로서 갖추어야할 근본 자세, 기본 양식 및 행동 지침에 이르기까지 이루 말할 수
없을 정도의 많은 가르침을 주셨습니다. 순간 이해할 수 없는 내용을 전해 주셨지만, 언제나
시간이 지나면 그 뜻을 헤아릴 수 있었습니다. 교수님께서 주신 가치를 사회에 환원하기 위해
열심히 노력하는 사람이 되고자 하겠습니다. 감사드립니다.
또한, 이번 박사 심사위원으로서 제 연구분야의 구체적이고 전반적 지도를 해 주신 안상준
교수님께 감사의 인사를 드립니다. 그러나 무엇보다 한 인간으로서, 수렁의 빠진 저의 삶의
태도를 구해주신 교수님께 무한한 감사의 인사를 드리고 싶습니다. 언제나 치열하게 사시는
교수님의 모습을 보며 항상 부끄러운 마음을 가지고 있습니다. 교수님께서 말씀해 주셨던
철학적이고 근본적 성찰을 항상 기억하고 있겠습니다.
KAERI 계신 권준현, 이경근 박사님에게 또한 감사의 인사를 드립니다. 두 분 박사님의 선행
연구가 없었다면, 지금의 제 박사 주제에 대한 구체적 연구는 주어진 박사 기간 동안 이루어 질
수 없었을 것입니다. 특히나, 바쁘신 와중에도 전화상으로, 또는 대면으로 연구의 뼈대와 세세한
연구내용을 봐주신 이경근 박사님께 다시 한번 감사의 인사를 드립니다. 박사님의 친절하고
구체적 가르침이 있었기에 박사학위까지 다다를 수 있었습니다. 또 다른 졸업 심사위원이 되어
주신 반치범, 박재영 교수님께도 감사의 인사를 전합니다.
대학원 생활을 하다 보면, 실제적인 연구의 내용들은 모두 연구실에서 이루어 지게 됩니다.
때문에, 울산과학기술대학교 102동 406호 및 112동 514호의 일원이었던 연구실 동료들에게도
감사의 인사를 전해야만 합니다. 김기동, 유승창, 김태용, 송인영, 이윤주, 함준혁, 이정환, 이정현,
고광범, 김종진, 신상훈, 최경준, 정주앙, 김태호, 김승현에게 감사를 표합니다.

109
다른 연구실이지만, 이승원형, 강사라누나, 김성만형, 박성대형, 조병진형, 탁태우형을 비롯한
선배님들로부터 많은 도움을 받았습니다. 언제나 칭얼댈 때마다 받아 주셔서 감사했습니다.
선배님들의 배려로 인해 저는 언제나 기댈 수 있는 곳이 있었습니다. 감사합니다. 또한, 동기인
유동한 형님을 빼 놓을 수는 없습니다. 힘들고 지칠 때 먹여 주시고 재워 주신 은혜 잊지
않겠습니다. 형님과 같이 보낸 석사 기간이 돌이켜 보면 가장 그리울 때가 많습니다. 같이
어려움을 헤매일 때, 언제나 든든한 벗이고, 가족이었습니다. 그리고, 후배님들에게 또한 감사의
인사해야만 합니다. 석사 기간 동안에는 이주영, 백제균, 정관윤, 조태원, 이철민, 신유경, 이희재,
공치동, 김원경, 이욱제, 곽재식, 정영신, 김미진, 김인국, 서석빈 후배들에게 많은 신세를
졌습니다. 여러분들의 지원이 있었기 때문에 지금의 제가 계속해서 연구를 하고 있다고
생각합니다. 또한, 박사기간 중에는, 안교수님 연구실의 이명규, 남창현, 정연송, 김건, 안정수,
김경훈, 하웅씨의 도움을 많이 받았습니다. 특히나, 박사 졸업기간에 많은 도움을 준 명규형에게
감사함을, 함께 시간을 많이 보내준 창현에게 고마움을 표합니다. 안전 연구실의 서정일, 박종우,
강정성, 최교수님 연구실의 정현준, 이찬기 후배님에게도 감사함을 표하고 싶습니다.
그리고, 힘들 때나 슬플 때 힘이 되어준 제 친구들을 언급하고 싶습니다. 부경대 동기인 민우,
유비, 상우, 명한, 영배, 광록이 힘들 때 마다 힘이 되어줘서 고맙다. 너희들이 없었다면, 험난한
대학원 생활 어떻게 견뎠을지 모르겠다. 특히 상우에게는 격 없이 칭얼대어서 미안한 마음이
크다. 주영형 밥 많이 사줘서 고마워요. 구영리에서 자주 만나요. 호상아 너도 박사 한다고
고생이 많다. 부산에서 보자. 중학교때부터 외로움을 서로 달래 주던 인우야. 어디를 가서도 네가
준 선물을 꼭 가지고 다니마. 항상 꾸준히 연락하자. 이번에는 내가 네 생일 선물을 챙겨 주고
싶다. 또한, 고등학교때부터 주말마다 내 곁을 지켜주던 영범아. 옆에 있어주어 고맙다. 네가
주말마다 내 옆에 있어주어 든든했다. 그리고 마지막으로 박사기간 동안 제 어린 마음을 배려해
주었던, 순수하고 마음씨 고운 친구 하림에게 감사의 인사를 전하고 싶습니다.
또한, 학교 심리건강센터에 계신 신지민 상담선생님에게도 감사의 인사를 드립니다. 선생님과
보낸 시간이 있었기에, 저 자신을 용서할 수 있었고, 덕분에 학위를 잘 마칠 수 있었습니다.
마지막으로 지금까지 제 연구가 수행될 수 있도록 허락해주신 모든 분들께 인사를 드립니다.
특히나, 연구 과제 행정일을 챙겨 주신 이남기 선생님, 친구처럼 친동생처럼 살뜰히 챙겨 주신
최은정 선생님 감사합니다. 또한, 도서관에 계신 권유리 선생님께 그간 보여주신 배려와 친절에
감사를 표하고 싶습니다. 학사일정을 챙겨 주신 박소희 선생님 감사합니다. 또한, 얼굴은 실제로
보지 못하였지만, 수 많은 선행 연구자 분들, 또한, 실제적으로 학위를 진행할 수 있게 해 주신
많은 행정 선생님에게도 감사의 인사를 전해 드립니다.
2019년 1월 7일, 밤 11시 12분, 형광등이 꺼지지 않는 112동 514호에서...
-최상일 올림-