modeling of the carbon in pulp (cip) process in gold cyanide leaching plants using … ·...
TRANSCRIPT
http://dx.doi.org/10.5277/ppmp140234
Physicochem. Probl. Miner. Process. 50(2), 2014, 841−852 Physicochemical Problems
of Mineral Processing
www.minproc.pwr.wroc.pl/journal/ ISSN 1643-1049 (print)
ISSN 2084-4735 (online)
Received July 9, 2013; reviewed; accepted February 10, 2014
MODELING OF THE CARBON IN PULP (CIP) PROCESS
IN GOLD CYANIDE LEACHING PLANTS
USING THE PLANT DATA
Baris SAYINER
Koza Altın Isletmeleri A.S., Kaymaz Gold Mine, Eskisehir, Turkey
Abstract: An improved method to model CIP plants by plant data is presented. The Turkish gold cyanide
leaching CIP plants, Bergama Ovacik, Gumushane Mastra and Eskisehir Kaymaz were modeled by using
gold concentrations of monthly carbon, solution and solids spot samples of adsorption tanks without a
need of laboratory work. Five carbon adsorption models were used namely k-n, Nicol-Fleming, Dixon,
Film Diffusion with Langmuir isotherm and Film Diffusion with Freundlich isotherm (Johns model).
Several monthly obtained plant data were collected and modeled separately and model parameters as well
as regression coefficient R2 values were found by non-linear regression. By comparing R2 values, the best
fit model for the three CIP plants was determined as Film Diffusion with Langmuir Isotherm that R2
values were above 0.95. Thus, by using the best fit model, the Kaymaz plant was optimized for existing
49 Mg per hour ore feed tonnage and plant parameters were predicted according to planned feed tonnage
increase to 120 Mg per hour.
Key words: modeling, cyanide leaching, activated carbon, adsorption, gold
Introduction
Gold is predominantly produced from its ores by hydrometallurgical cyanide leaching
process. The cyanide leaching process is applied by first grinding the ore below 75
micrometers and dissolving the gold as Au(CN)2- by mixing the ground ore with dilute
cyanide solution to obtain slurry above pH 10 and by supplying oxygen to leach tanks.
Dissolution of gold-cyanide completes in about 24 hours. The hydrometallurgical
reaction for extracting gold from its ores can be expressed as below:
Au0 +2CN
- + ½ H2O + ¼ O2 Au(CN)2
- + OH
-.
(1)
After dissolution of gold, the slurry passes through the carbon adsorption tanks. In
those tanks, granulated activated coconut carbon is mixed into the slurry and the
B. Sayiner 842
disolved gold is adsorbed by the carbon, leaving the barren solution. The adsorption
phenomena can be defined by the reaction (Davidson and Sole, 2007; Pleysier et al.,
2008):
2Au0 + Ca
+2 + 4CN
- + H2O + ½O2 Ca[Au(CN)2]2 + 2OH
- . (2)
According to Eq. 2, the adsorption ocurrs by the formation of the Ca[Au(CN)2]2
complex. The Ca[Au(CN)2]2 complex is adsorbed by carbon. In this adsorption
reaction Ca comes from adition of lime into the pulp to obtain the pH of 10 or above.
The slurry passes through from first adsorption tank to the last one, while the
activated carbon follows the direction in reverse order from the last tank to the first
one. By this counter current flow of the slurry and the carbon the Au(CN)2- complex is
loaded onto the carbon. From the first adsorption tank the most Au loaded final
activated carbon is obtained and by column elution method the loaded gold is gained
by stripping it from carbon. To prevent the granulated carbon to move forward with
the slurry, special sieves exist at the tanks discharge openings. Next, carbon is driven
backward by special carbon pumps at certain times.
Adsorption of Au(CN)2- by activated coconut carbon is a well proven process
widely used to recover gold from slurry at cyanide leaching plants. In this research,
modelling of adsorption of dissolved gold performed by using real CIP (carbon in
pulp) plant data. For this aim, five kinetic models and the gold mass balance
calculations were used together. After obtaining model parameters, optimization of the
plant would be possible. By optimization of the plants according to those models, the
optimum needed carbon amount in each tank, the residence time of the carbon for each
tank, the stripping amounts per week, the adsorption tank amount and volumes and the
stripping column volume could be determined for certain plant feed ore tonnages.
In this research, the present CIP plants in Turkey, Bergama Ovacik, Gumushane
Mastra and Eskisehir Kaymaz plants were modelled.
Gold Mass Balance
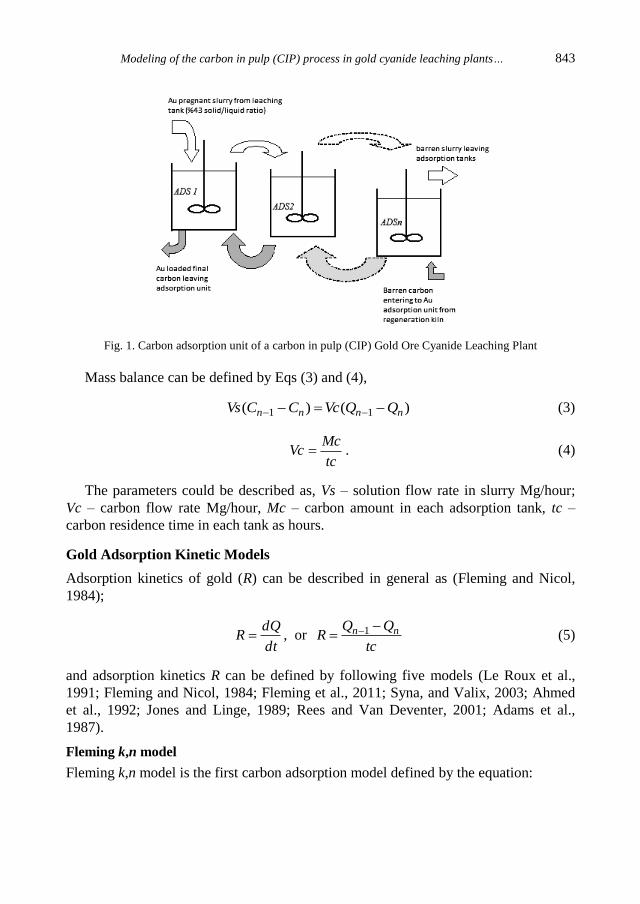
The counter current slurry and carbon flow with gold mass balance are presented in
Fig.1. According to Fig. 1, the parameters are described as follows:
C0 – solution Au concentration of the feed slurry, ppm
Cn – solution Au concentration of the slurry in tank n, ppm
Q0 – Au concentration of pregnant carbon in tank 1, ppm
Qn – Au concentration of loaded carbon in tank n, ppm
ADS1–n – adsorption tanks
Modeling of the carbon in pulp (CIP) process in gold cyanide leaching plants… 843
Fig. 1. Carbon adsorption unit of a carbon in pulp (CIP) Gold Ore Cyanide Leaching Plant
Mass balance can be defined by Eqs (3) and (4),
)()( 11 nnnn QQVcCCVs (3)
tc
McVc . (4)
The parameters could be described as, Vs – solution flow rate in slurry Mg/hour;
Vc – carbon flow rate Mg/hour, Mc – carbon amount in each adsorption tank, tc –
carbon residence time in each tank as hours.
Gold Adsorption Kinetic Models
Adsorption kinetics of gold (R) can be described in general as (Fleming and Nicol,
1984);
dt
dQR , or
tc
QQR nn 1 (5)
and adsorption kinetics R can be defined by following five models (Le Roux et al.,
1991; Fleming and Nicol, 1984; Fleming et al., 2011; Syna, and Valix, 2003; Ahmed
et al., 1992; Jones and Linge, 1989; Rees and Van Deventer, 2001; Adams et al.,
1987).
Fleming k,n model
Fleming k,n model is the first carbon adsorption model defined by the equation:
B. Sayiner 844
tcnkC
QQ nn loglog)log( 1
. (6)
In this equation, k and n are model parameters, k is the rate constant, 1/hours, and n is
a model parameter.
Nicol-Fleming model
This model includes an equilibrium constant as K as a difference from k,n model. The
Nicol-Fleming model can be described as follows:
)( QKCkR . (7)
In Eq. 7 K is the equilibrium constant and k can be defined as rate constant.
Film diffusion model with Freunlich isotherm (Johns model)
Film diffusion models define the adsorption process assuming that dissolved gold is
adsorbed onto the carbon surface by passing film layer which separates the carbon
surface and the solution phase. Thus, the equation can be shown as follows:
n
k
QCAckfR . (8)
In Eq. 8 Ac is carbon film diffusion surface area, K, equilibrium constant, kf is film
diffusion constant.
Film diffusion model with Langmuir isotherm
Film diffusion model with Langmuir isotherm can be defined as
QK
bQCAckfR . (9)
In Eq. 9 Ac is carbon film diffusion surface area, K is the equilibrium constant, kf is
film diffusion constant and b is a model constant.
Dixon model
Dixon model can be defined as
QkQKCkR 21 )( . (10)
Modeling of the carbon in pulp (CIP) process in gold cyanide leaching plants… 845
In Eq. 10 k1 is rate constant for gold adsorption and k2 is defined as rate constant for
gold desorption. Thus, this model takes into account existence of both adsorption and
desorption phenomena at the same time. K is the equilibrium constant.
Material and method
In order to model the CIP plants, the samples that have been taken once a month were
used. The samples include: solid (ore), solution, and carbons from each adsorption
tank. While taking samples, the carbon amounts g/dm3 slurry and solid concentration
of slurry as %solid (w/w) for each tank were measured and noted.
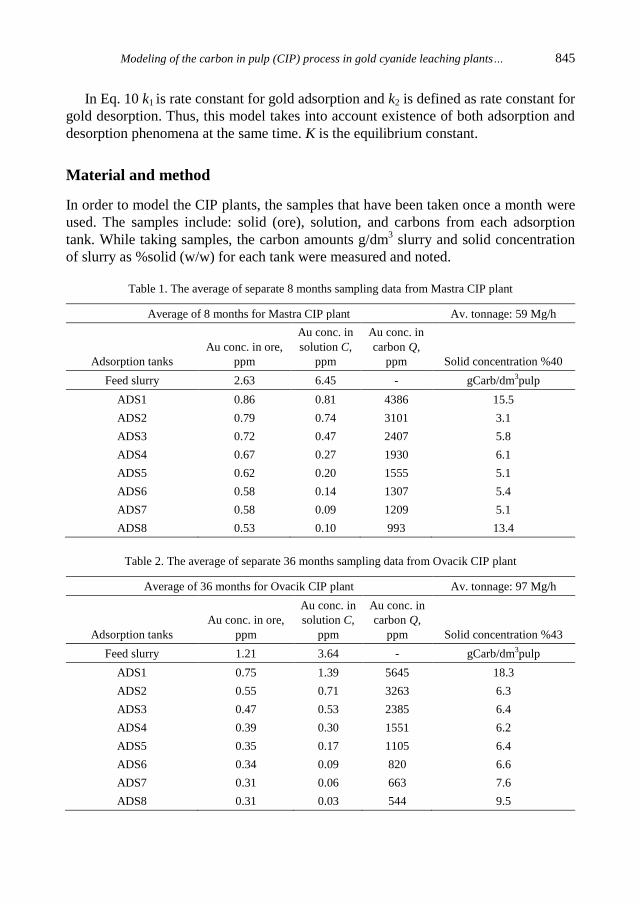
Table 1. The average of separate 8 months sampling data from Mastra CIP plant
Average of 8 months for Mastra CIP plant Av. tonnage: 59 Mg/h
Adsorption tanks
Au conc. in ore,
ppm
Au conc. in
solution C,
ppm
Au conc. in
carbon Q,
ppm Solid concentration %40
Feed slurry 2.63 6.45 - gCarb/dm3pulp
ADS1 0.86 0.81 4386 15.5
ADS2 0.79 0.74 3101 3.1
ADS3 0.72 0.47 2407 5.8
ADS4 0.67 0.27 1930 6.1
ADS5 0.62 0.20 1555 5.1
ADS6 0.58 0.14 1307 5.4
ADS7 0.58 0.09 1209 5.1
ADS8 0.53 0.10 993 13.4
Table 2. The average of separate 36 months sampling data from Ovacik CIP plant
Average of 36 months for Ovacik CIP plant Av. tonnage: 97 Mg/h
Adsorption tanks
Au conc. in ore,
ppm
Au conc. in
solution C,
ppm
Au conc. in
carbon Q,
ppm Solid concentration %43
Feed slurry 1.21 3.64 - gCarb/dm3pulp
ADS1 0.75 1.39 5645 18.3
ADS2 0.55 0.71 3263 6.3
ADS3 0.47 0.53 2385 6.4
ADS4 0.39 0.30 1551 6.2
ADS5 0.35 0.17 1105 6.4
ADS6 0.34 0.09 820 6.6
ADS7 0.31 0.06 663 7.6
ADS8 0.31 0.03 544 9.5
B. Sayiner 846
Besides, ore throughput as Mg/h and tank volumes were taken into account. The
average of monthly data for the Mastra, Ovacik and Kaymaz plants are shown in
Tables 1-3.
Table 3. The average of separate 8 months sampling data from Kaymaz CIP plant
Average of 8 months for Kaymaz CIP plant Av. tonnage: 49 t/h
Adsorption tanks
Au conc. in ore,
ppm
Au conc. in
solution C,
ppm
Au conc.
in carbon
Q, ppm Solid concentration %42
Feed slurry 1.58 3.91 - gCarb/Lpulp
ADS1 0.99 0.85 3387 13.6
ADS2 0.87 0.43 1171 4.3
ADS3 0.78 0.17 754 6.1
ADS4 0.75 0.09 483 6.2
ADS5 0.74 0.04 301 4.4
ADS6 0.73 0.02 360 6.1
ADS7 0.73 0.03 286 1.5
ADS8 0.71 0.02 434 7.9
By using mass balance (Eqs. 3 and 4) and data of Tables 1-3, tcn for each
adsorption tank ADSn and further, model parameters could be found by the
calculation method as shown in Table 4.
Table 4. model parameters for different 5 models
Models Model parameters
k, n model k,n
Nicol-Fleming model K,k
Johns model Ac.kf, n, K
Film-diff. with Lang. isot. Ac.kf, b, K
Dixon model k1, k2, K
The model parameters presented in Table 4 were found by non-linear regression
method. For each month, the model parameters and R2 values were determined, thus it
would be possible to determine the best fit model(s) for the CIP plants.
Furthermore, after model parameters were found, the plant tc and Mc values can be
determined to obtain desired Q and C values by using model parameters. Besides, for
different tonnage Mg/h ore feedings, the tc and Mc can be re-calculated to obtain the
Modeling of the carbon in pulp (CIP) process in gold cyanide leaching plants… 847
same Q, C. Thus, optimization of the CIP plants would be possible after finding the
model parameters by using the real plant data.
Results and discussion
The model parameters and the regression coefficient (R2) values for each models were
calculated by nonlinear regression method and these R2 values obtained by each
models were compared to determine the nearest values to “1”, thus, to find the best fit
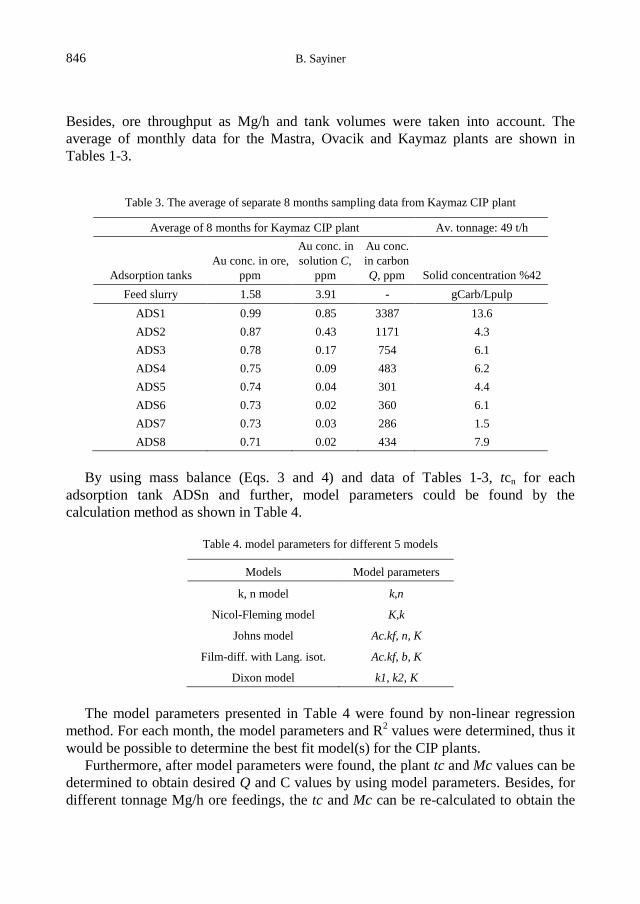
model for these three CIP plants. The R2 values vs months were presented in Figs. 2-4.
0
1
1 6 11 16 21 26 31 36
months
R2
Film Diffusionwith FreundlichIsotherm (johns)
Dixon
Nicol-Fleming
Film Diffusionwith LangmuirIsotherm
kn
Fig. 2. Regression coefficient (R2) values for different models for Ovacik CIP plant data
As shown in Fig. 2, the best fit model for Ovacik CIP plant is film diffusion model
with Langmuir isotherm as its R2 value is nearest to 1. For the Ovacik CIP plant using
film diffusion model for optimization study, more reliable predictions would be
performed such as carbon amount in each tank for the desired final carbon gold
loading and final solution gold content for a different plant feed ore tonnage and thus
for different slurry flow rates.
B. Sayiner 848
0
1
1 2 3 4 5 6 7 8
months
R2
Film Diffusionwith FreundlichIsotherm (Johns)
Dixon
Nicol-Fleming
Film Diffusionwith LangmuirIsotherm
kn
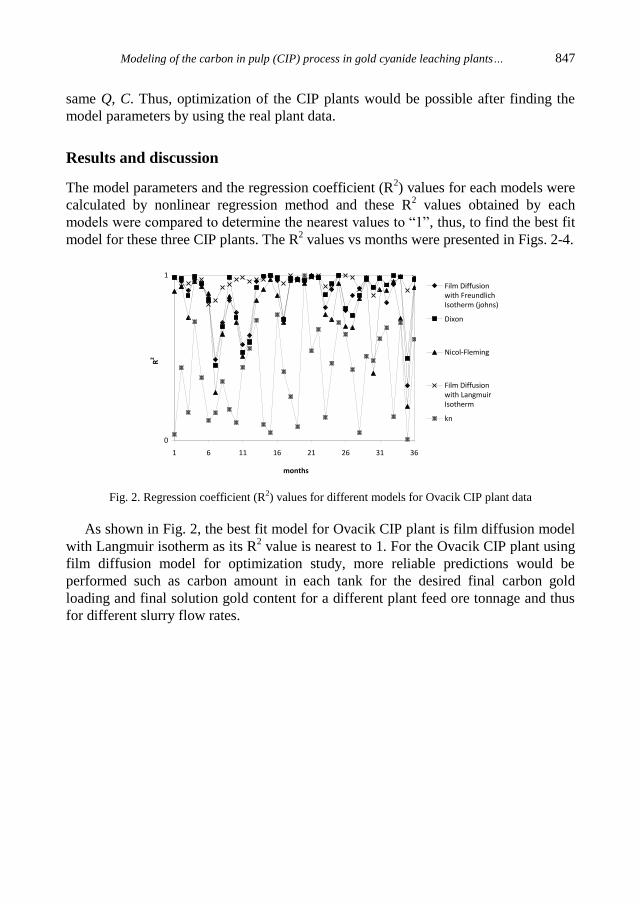
Fig. 3. Regression coefficient (R2) values for different models for Mastra CIP plant data
As presented in Fig. 3, the Film diffusion and Dixon models are better (R2 values
are closed to 1) than the k,n and Nicol-Fleming models. Thus, for the Mastra plant the
Film diffusion models and Dixon model would supply most realistic predictions for
the selected CIP model parameters as carbon amount in each tank and desired final
carbon gold concentrations.
0
1
1 2 3 4 5 6 7 8
months
R2
Film Diffusion withFreundlich Isotherm(Johns)
Dixon
Nicol-Fleming
Film Diffusion withLangmuir Isotherm
kn
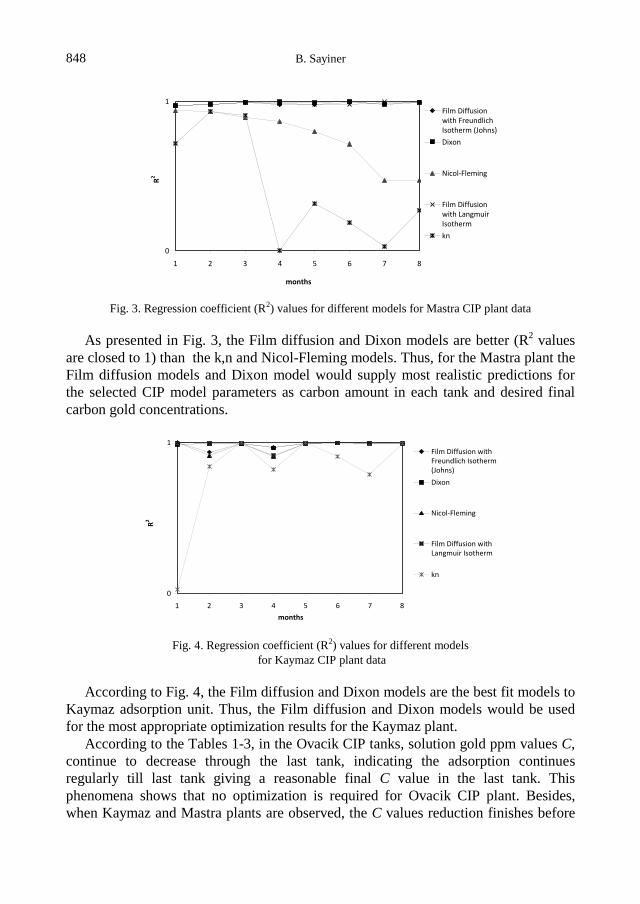
Fig. 4. Regression coefficient (R2) values for different models
for Kaymaz CIP plant data
According to Fig. 4, the Film diffusion and Dixon models are the best fit models to
Kaymaz adsorption unit. Thus, the Film diffusion and Dixon models would be used
for the most appropriate optimization results for the Kaymaz plant.
According to the Tables 1-3, in the Ovacik CIP tanks, solution gold ppm values C,
continue to decrease through the last tank, indicating the adsorption continues
regularly till last tank giving a reasonable final C value in the last tank. This
phenomena shows that no optimization is required for Ovacik CIP plant. Besides,
when Kaymaz and Mastra plants are observed, the C values reduction finishes before
Modeling of the carbon in pulp (CIP) process in gold cyanide leaching plants… 849
the last tank, indicating that optimization would be beneficial for these two plants.
This may be the reason that three models best fit for the Kaymaz and Mastra CIP
plants. However, when the Ovacik plant was investigated, the models show different
fitting results. Thus, the Film diffusion model with Langmuir isotherm is the best fit
model for Ovacik and this model will be taken into account for the optimization
processes of the plants since this model fits well all the three CIP plants.
Optimization of Kaymaz CIP Plant
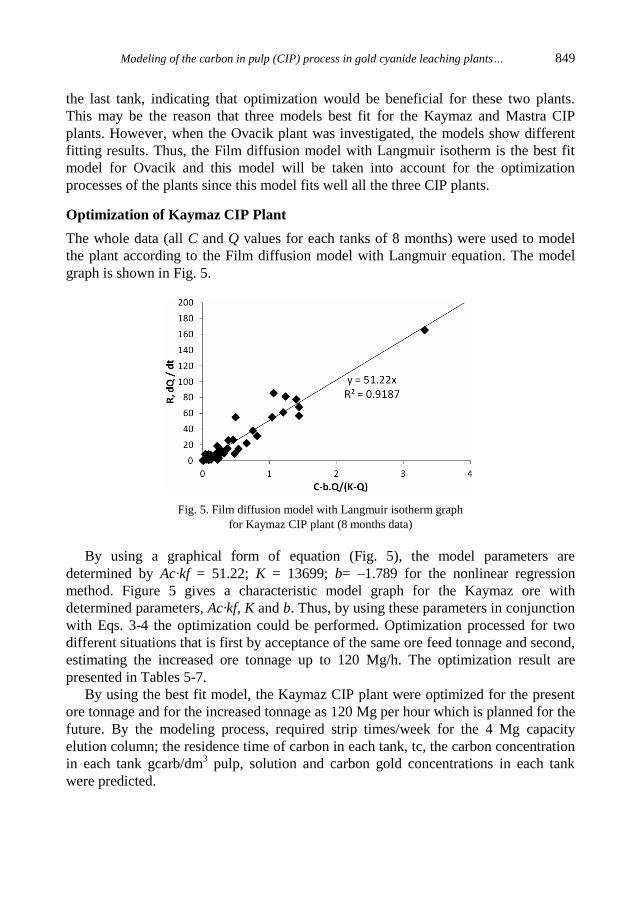
The whole data (all C and Q values for each tanks of 8 months) were used to model
the plant according to the Film diffusion model with Langmuir equation. The model
graph is shown in Fig. 5.
Fig. 5. Film diffusion model with Langmuir isotherm graph
for Kaymaz CIP plant (8 months data)
By using a graphical form of equation (Fig. 5), the model parameters are
determined by Ac·kf = 51.22; K = 13699; b= –1.789 for the nonlinear regression
method. Figure 5 gives a characteristic model graph for the Kaymaz ore with
determined parameters, Ac·kf, K and b. Thus, by using these parameters in conjunction
with Eqs. 3-4 the optimization could be performed. Optimization processed for two
different situations that is first by acceptance of the same ore feed tonnage and second,
estimating the increased ore tonnage up to 120 Mg/h. The optimization result are
presented in Tables 5-7.
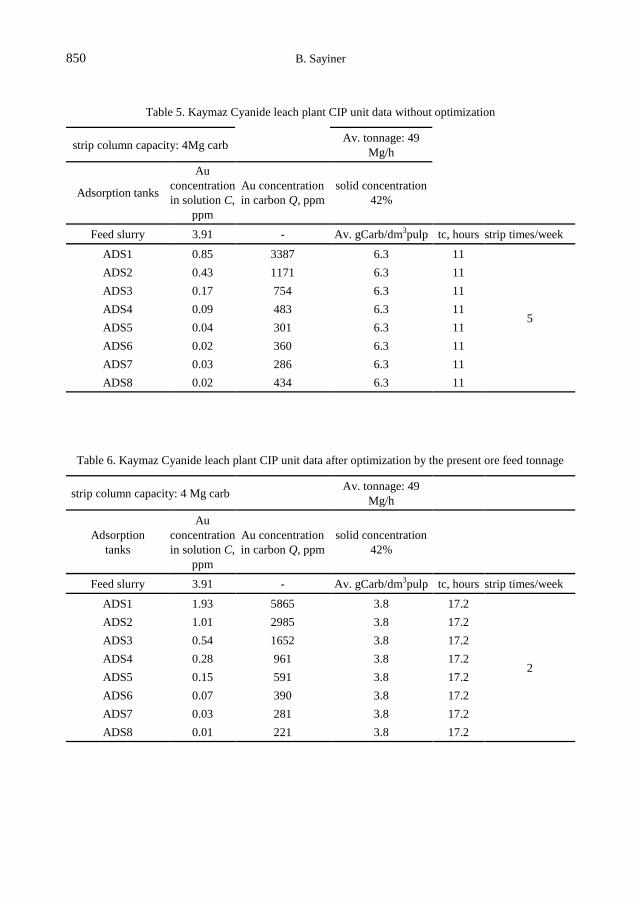
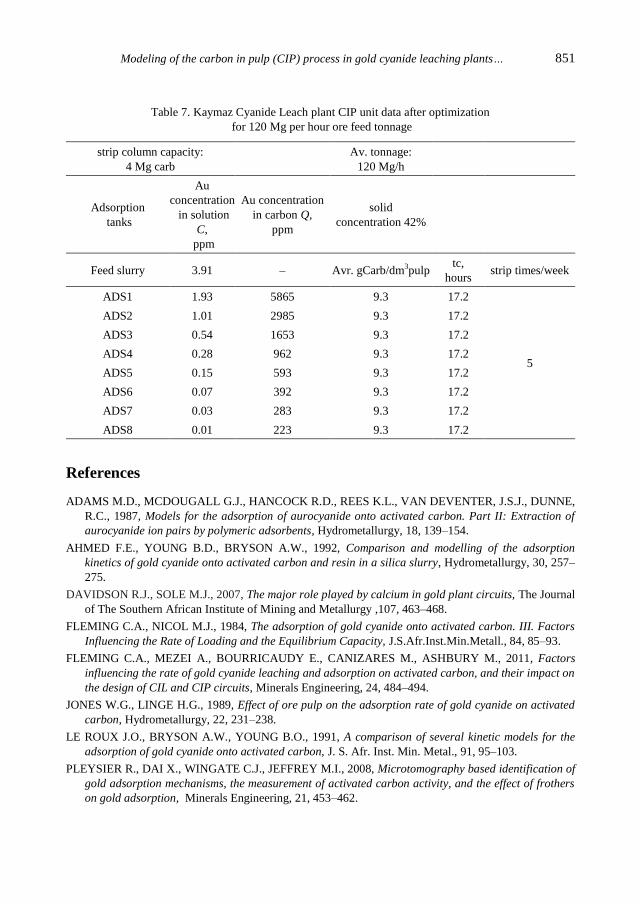
By using the best fit model, the Kaymaz CIP plant were optimized for the present
ore tonnage and for the increased tonnage as 120 Mg per hour which is planned for the
future. By the modeling process, required strip times/week for the 4 Mg capacity
elution column; the residence time of carbon in each tank, tc, the carbon concentration
in each tank gcarb/dm3 pulp, solution and carbon gold concentrations in each tank
were predicted.
B. Sayiner 850
Table 5. Kaymaz Cyanide leach plant CIP unit data without optimization
strip column capacity: 4Mg carb Av. tonnage: 49
Mg/h
Adsorption tanks
Au
concentration
in solution C,
ppm
Au concentration
in carbon Q, ppm
solid concentration
42%
Feed slurry 3.91 - Av. gCarb/dm3pulp tc, hours strip times/week
ADS1 0.85 3387 6.3 11
5
ADS2 0.43 1171 6.3 11
ADS3 0.17 754 6.3 11
ADS4 0.09 483 6.3 11
ADS5 0.04 301 6.3 11
ADS6 0.02 360 6.3 11
ADS7 0.03 286 6.3 11
ADS8 0.02 434 6.3 11
Table 6. Kaymaz Cyanide leach plant CIP unit data after optimization by the present ore feed tonnage
strip column capacity: 4 Mg carb Av. tonnage: 49
Mg/h
Adsorption
tanks
Au
concentration
in solution C,
ppm
Au concentration
in carbon Q, ppm
solid concentration
42%
Feed slurry 3.91 - Av. gCarb/dm3pulp tc, hours strip times/week
ADS1 1.93 5865 3.8 17.2
2
ADS2 1.01 2985 3.8 17.2
ADS3 0.54 1652 3.8 17.2
ADS4 0.28 961 3.8 17.2
ADS5 0.15 591 3.8 17.2
ADS6 0.07 390 3.8 17.2
ADS7 0.03 281 3.8 17.2
ADS8 0.01 221 3.8 17.2
Modeling of the carbon in pulp (CIP) process in gold cyanide leaching plants… 851
Table 7. Kaymaz Cyanide Leach plant CIP unit data after optimization
for 120 Mg per hour ore feed tonnage
strip column capacity:
4 Mg carb
Av. tonnage:
120 Mg/h
Adsorption
tanks
Au
concentration
in solution
C,
ppm
Au concentration
in carbon Q,
ppm
solid
concentration 42%
Feed slurry 3.91 – Avr. gCarb/dm3pulp tc,
hours strip times/week
ADS1 1.93 5865 9.3 17.2
5
ADS2 1.01 2985 9.3 17.2
ADS3 0.54 1653 9.3 17.2
ADS4 0.28 962 9.3 17.2
ADS5 0.15 593 9.3 17.2
ADS6 0.07 392 9.3 17.2
ADS7 0.03 283 9.3 17.2
ADS8 0.01 223 9.3 17.2
References
ADAMS M.D., MCDOUGALL G.J., HANCOCK R.D., REES K.L., VAN DEVENTER, J.S.J., DUNNE,
R.C., 1987, Models for the adsorption of aurocyanide onto activated carbon. Part II: Extraction of
aurocyanide ion pairs by polymeric adsorbents, Hydrometallurgy, 18, 139–154.
AHMED F.E., YOUNG B.D., BRYSON A.W., 1992, Comparison and modelling of the adsorption
kinetics of gold cyanide onto activated carbon and resin in a silica slurry, Hydrometallurgy, 30, 257–
275.
DAVIDSON R.J., SOLE M.J., 2007, The major role played by calcium in gold plant circuits, The Journal
of The Southern African Institute of Mining and Metallurgy ,107, 463–468.
FLEMING C.A., NICOL M.J., 1984, The adsorption of gold cyanide onto activated carbon. III. Factors
Influencing the Rate of Loading and the Equilibrium Capacity, J.S.Afr.Inst.Min.Metall., 84, 85–93.
FLEMING C.A., MEZEI A., BOURRICAUDY E., CANIZARES M., ASHBURY M., 2011, Factors
influencing the rate of gold cyanide leaching and adsorption on activated carbon, and their impact on
the design of CIL and CIP circuits, Minerals Engineering, 24, 484–494.
JONES W.G., LINGE H.G., 1989, Effect of ore pulp on the adsorption rate of gold cyanide on activated
carbon, Hydrometallurgy, 22, 231–238.
LE ROUX J.O., BRYSON A.W., YOUNG B.O., 1991, A comparison of several kinetic models for the
adsorption of gold cyanide onto activated carbon, J. S. Afr. Inst. Min. Metal., 91, 95–103.
PLEYSIER R., DAI X., WINGATE C.J., JEFFREY M.I., 2008, Microtomography based identification of
gold adsorption mechanisms, the measurement of activated carbon activity, and the effect of frothers
on gold adsorption, Minerals Engineering, 21, 453–462.

B. Sayiner 852
REES K.L, VAN DEVENTER J.S.J, 2001, Gold process modelling. I. Batch modelling of the processes
of leaching, preg-robbing and adsorption onto activated carbon, Minerals Engineering, 14, 753-773.
SYNA N., VALIX M., 2003, Modelling of gold (I) cyanide adsorption based on the properties of
activated bagasse, Minerals Engineering,16, 421–427.