modeling of sorption of eu, mo, nb, ni, pa, se, sn, th … · (parkhurst & appelo 1999) and the...
TRANSCRIPT

October 2013
Working Reports contain information on work in progress
or pending completion.
The conclusions and viewpoints presented in the report
are those of author(s) and do not necessarily
coincide with those of Posiva.
Heini Ervanne, Esa Puukko, Martt i Hakanen
University of Helsinki
Department of Chemistry
Laboratory of Radiochemistry
Working Report 2013-31
Modeling of Sorption of Eu, Mo, Nb, Ni, Pa, Se,Sn, Th and U on Kaolinite and Illite
in Olkiluoto Groundwater Simulants


1
MODELING OF SORPTION OF Ni, Se, Nb, Mo, Sn, Eu, Pa, Th AND U ON KAOLINITE AND ILLITE IN OLKILUOTO GROUNDWATER SIMULANTS
ABSTRACT Sorption parameters for Olkiluoto far-field conditions for the safety case were derived from source sorption values using conversion factors due to differences in water compositions, pH and the speciation of nuclides in the source data conditions and the reference waters. Estimation of sorption in evolving geochemical conditions urges for thermodynamical sorption models and their parameter to enable calculation of sorption. To start the developing of sorption models, in this report, the experimentally determined sorption of molybdenum, niobium, protactinium, selenium, tin, thorium and uranium on the illite and kaolinite in the groundwater simulants is modeled. In addition, the sorption of Eu and Ni on kaolinite in electrolyte solutions is modeled. The non-electrostatic approach to surface complexation was adopted for the sake of simplicity. The basic parameters of the solids needed were in-house values or adopted from literature. The surface complexation reactions and the cation exchange reaction selectivities of the main groundwater cations given in literature for illite and kaolinite were applied. Keywords: Sorption, radionuclides, far-field, Olkiluoto, modelling.

2
3
RADIONUKLIDIEN (Ni, Se, Nb, Mo, Sn, Eu, Pa, Th, U) SORPTION MALLINNUS KAOLINIITTIIN JA ILLIITTIIN OLKILUODON POHJAVESI SIMULANTEISSA
TIIVISTELMÄ Radionuklidien sorptioparametrit Olkiluodon kaukoalueelle arvioitiin loppusijoituk-sen turvallisuusperusteluihin käyttäen muunnoskertoimia huomioimaan käytettyjen koe-olosuhteiden ja referenssivesien eroista aiheutuvat erot sorptiossa. Kehittyvissä pohjavesiolosuhteissa tapahtuvan sorption arvioimiseksi tarvitaan termodynaamisia sorptiomalleja, joilla olosuhteet voidaan suoraan huomioida laskennallisesti. Mallien kehitystyön aloittamiseksi tässä raportissa on mallitettu referenssipohjavesien simu-lanteissa kokeellisesti määritetty molybdeenin, niobiumin, protaktiniumin seleenin, tinan, toriumin ja uraanin sorptio illiittiin ja kaoliniittiin. Lisäksi on mallitettu europiumin ja nikkelin sorptio elektrolyyttiliuoksissa. Sorptiomalliksi valittiin yksin-kertaisuuden vuoksi non-electrostatic pintakompleksaatiomallin ja kationinvaihdon sisältävä malli. Kiinteiden materiaalien perusparametrien arvoiksi valittiin radio-kemian laboratorion määrittämä arvo tai kirjallisuudesta saatu arvo. Nuklidien pintakompleksaatioreaktioiden valinta ja pohjavesien pääkationien kationinvaihto-reaktioiden selektiivisyyskertoimien valinta tehtiin kirjallisuustietoon perustuen. Avainsanat: Sorptio, radionuklidit, kaukoalue, Olkiluoto, mallinnus

4

5
PREFACE This study has been carried out to initiate thermodynamic sorption modeling of waste nuclides in Olkiluoto far field conditions. The report was prepared at the University of Helsinki, Department of Chemistry, Laboratory of Radiochemistry under contract with Posiva Oy. The contact person was Marja Vuorio at Posiva Oy and Martti Hakanen, Heini Ervanne and Esa Puukko at the Laboratory of Radiochemistry.

6

1
TABLE OF CONTENTS ABSTRACT TIIVISTELMÄ PREFACE 1 INTRODUCTION ................................................................................................. 3
REFERENCES .................................................................................................... 3
2 MATERIALS AND METHODS ............................................................................. 5
2.1. Clays............................................................................................................ 5
2.2. Waters ......................................................................................................... 6
2.3. Experimental methods ................................................................................. 7
2.4. Modeling ...................................................................................................... 8
REFERENCES .................................................................................................... 9
3 RESULTS .......................................................................................................... 11
3.1. NICKEL...................................................................................................... 11
3.1.1. Experimental description ................................................................ 11
3.1.2. Speciation of Nickel ....................................................................... 11
3.1.3. Modelling sorption of Ni on kaolinite .............................................. 13
REFERENCES .................................................................................................. 17
3.2. SELENIUM ................................................................................................ 18
3.2.1. Experimental description ................................................................ 18
3.2.2. Speciation of Selenium ................................................................. 18
3.2.3. Modeling sorption of Se on kaolinite .............................................. 21
3.2.4. Modeling sorption of Se on illite ..................................................... 24
REFERENCES .................................................................................................. 26
3.3. NIOBIUM ................................................................................................... 27
3.3.1. Experimental description ................................................................ 27
3.3.2. Speciation of Niobium .................................................................... 27
3.3.3. Modeling sorption of Nb on kaolinite .............................................. 29
3.3.4. Modeling sorption of Nb on illite ..................................................... 33
REFERENCES .................................................................................................. 37
3.4. MOLYBDENUM ......................................................................................... 38
3.4.1. Experimental description ................................................................ 38
3.4.2. Speciation of Molybdenum ............................................................. 38
3.4.3. Modeling sorption of Mo on kaolinite ............................................. 39
3.4.4. Modeling sorption of Mo on illite .................................................... 41
REFERENCES .................................................................................................. 42
3.5. TIN ............................................................................................................. 43

2
3.5.1. Experimental description ................................................................ 43
3.5.2. Speciation of Tin ............................................................................ 43
3.5.3. Modelling sorption of Sn on kaolinite ............................................. 44
3.5.4. Modelling sorption of Sn on illite .................................................... 44
REFERENCES .................................................................................................. 45
3.6. EUROPIUM ............................................................................................... 46
3.6.1. Experimental description ................................................................ 46
3.6.2. Speciation of Europium .................................................................. 46
3.6.3. Modelling sorption of Eu on kaolinite ............................................. 48
REFERENCES .................................................................................................. 50
3.7. PROTACTINIUM ......................................................................................... 51
3.7.1. Experimental description ................................................................ 51
3.7.2. Speciation of Protactinium ............................................................. 51
3.7.3. Modeling sorption on kaolinite ....................................................... 53
3.7.4. Modeling sorption of Pa on illite ..................................................... 54
REFERENCES .................................................................................................. 56
3.8. THORIUM .................................................................................................. 57
3.8.1. Experimental description ................................................................ 57
3.8.2. Speciation of Thorium .................................................................... 57
3.8.3. Modeling sorption of Th on kaolinite .............................................. 60
3.8.4. Modeling sorption of Th on illite ..................................................... 63
REFERENCES .................................................................................................. 66
3.9. URANIUM .................................................................................................. 67
3.9.1. Experimental description ................................................................ 67
3.9.2. Speciation of Uranium .................................................................... 67
3.9.3. Modeling sorption of U on kaolinite ................................................ 69
3.9.4. Modeling sorption of U on illite ....................................................... 71
REFERENCES .................................................................................................. 73
4 SUMMARY ........................................................................................................ 75

3
1 INTRODUCTION Sorption parameters, Kd values have been estimated for nuclides in spent fuel for the far field sorption database in Olkiluoto (Hakanen et al. 2012). The reference conditions comprised of four types of groundwaters the compositions of the waters varying from low salinity glacial water to reducing saline groundwater. The source sorption data consisted of sorption values for nuclides on Olkiluoto rocks and it was determined mainly during the site investigation period of Posiva. These sorption values were mainly single pH-point sorption values in groundwater simulants and to a smaller extent in natural Olkiluoto groundwaters. This older sorption source data set was complemented by experiments on the sorption of Se, Mo, Nb, Sn, Th, U and Pa on crushed reference rocks and on illite and kaolinite in simulants of the reference groundwaters. The speciation of the nuclides was calculated by using the PHREEQC program (Parkhurst & Appelo 1999) and the ThermoChimie database (ANDRA 2009). Conversion of the experimental sorption values to the sorption in the reference waters was made by using the ratio of proportions of sorptive species in the experimental water and in the reference water as the conversion factor. Sorption of complexes of the nuclides present only in the reference water and pH dependency of sorption of the nuclides having only single point pH sorption source value was estimated using relevant literature data when available. In many cases several conversion factors were needed. A more convenient way of estimation of sorption of a nuclide in varying groundwater conditions is to use a thermochemical sorption model (NEA 2012). In this report, the sorption of Se, Mo, Nb, Pa, Se, Sn, Th and U determined for the illite and kaolinite (Hakanen et al. 2012) is modeled. In addition, the sorption of Eu and Ni on kaolinite in electrolyte solutions (Puukko & Hakanen 1998, 2004) is modeled. The non-electrostatic approach to surface complexation was adopted for the sake of simplicity. The basic parameters of the solids needed, the CEC, the surface site density or sorption capacity were adopted from literature. The surface complexation reactions and the cation exchange selectivities of the main groundwater cations given in literature for illite and kaolinite were applied. A review of models, model parameters, sorption reactions and their equilibrium constants for the nuclides modeled in this report helped during this work. The review will be complemented to include all nuclides of the far field sorption report and is published later.
REFERENCES ANDRA 2009. ThermoChimie Version 7b, C.RP.ASTR.O4.0032. Hakanen, M., Ervanne, H., Puukko, E. 2012. Far-field geochemical database for the Olkiluoto site: Distribution coefficients for sorption of Radionuclides in the Olkiluoto geosphere. Posiva Working report 2012-XX. NEA 2012. Thermodynamic sorption modeling in support of radioactive waste disposal safety cases. NEA Sorption project phase III. OECD Nuclear energy agency No 6914.

4
Parkhurst, D.L. & Appelo, C.A.J., 1999. User's guide to PHREEQC (version 2)--A computer program for speciation, batch-reaction, one-dimensional transport, and inverse geochemical calculations: U.S. Geological Survey Water-Resources Investigations Report 99-4259, 312 p. Puukko, E. & Hakanen, M. 1998. Characterisation of kaolinite and the sorption of nickel on kaolinite. Posiva Working report 98-60, Posiva Oy, Helsinki, Finland. Puukko E. & Hakanen M. 2004. Sorption of europium on Kaolinite KGa-1b. Posiva Working Report 2004-59, Posiva Oy, Olkiluoto, Finland.

5
2 MATERIALS AND METHODS 2.1 Clays The clays used in the sorption experiments were source and reference clays kaolinite KGa-1b and illite IMt-1 from the U.S. Clay Minerals Society. The composition of the clays is presented in Table 2-1. Table 2-1. Composition of kaolinite and illite (http://www.clays.org). Kaolinite KGa-1b
(low-defect) Illite IMt-1
Origin Tuscaloosa, County of Washington, State of Georgia, USA
Silver Hill, Montana, USA
Chemical composition (%) Chemical composition (%)SiO2 44.2 49.3 Al2O3 39.7 24.25 TiO2 1.39 0.55 Fe2O3 0.13 7.32 FeO 0.08 0.55 MnO 0.002 0.03 MgO 0.03 2.56 CaO n.d. 0.43 Na2O 0.013 0 K2O 0.05 7.83 F 0.013 - P2O5 0.034 0.08 CEC (meq/100g) 2.0 17.0* SA(N2) (m
2/g) 10.05 +/- 0.0211.1 -11.6***
11* 6.4***
*O’Loughlin, E.J., Traina, S.J., Sims, G.K. 2000. Effects of sorption on the biodegradation of 2-methylpyridine in aqueous suspensions of reference clay minerals. Environ.Toxicol. Chem. 19, 2168–2174. **Brandt, F., Bosbach, D., Krawczyk-Barsch, E., Arnold, T., Bernhard, G. 2003. Chlorite dissolution in the acid pH-range: a combined microscopic and macroscopic approach. Geochim. Cosmochim. Acta. 67, 1451-1461. ***In-house data.

6
2.2 Waters The composition of reference waters used in the sorption experiments are described in Table 2-2. The amounts of chemicals used in the preparation of OLGA and OLBA are in Tables 2-3 and 2-4. Table 2-2. Composition of reference waters fresh groundwater ALLMR, saline groundwater OLSR, glacial meltwater OLGA and brackish groundwater OLBA (Vuorinen & Snellman 1998).
(mM) ALLMR OLSR OLBA OLGA HCO3
- 1.1 - - 1.6 SiO2 0.03 - 0.002 0.07 Na+ 2.3 208.8 0.03 76.0 K+ 0.10 0.54 0.015 17.8 Ca2+ 0.13 100 0.01 0.70 Mg2+ 0.03 2.3 0.01 6.2 Sr+2 - 0.40 - 0.01 B3+ - 0.08 - 0.06 SO4
2- 0.10 0.044 0.0021 4.7 Cl- 1.4 412.7 0.086 78.9 F- - 0.063 - 0.016 Br- - 1.31 - 0.163 I- - 0.007 - - NH4
+ - - - 0.018 pHcal 8.8 8.3 5.8 7.6
Table 2-3. Chemicals used in preparation of the glacial meltwater reference OLGA.
Composition Chemicals mg/L mg/L Na 0.60 NaCl 1.3307 K 0.60 KCl 0.8337 Ca 0.52 CaCl2·2H2O 1.9075 Mg 0.30 MgCl2·6H2O 2.5094 SiO2 0.10 Na2SiO3·9H2O 0.4730 Cl 3.06 SO4 0.20 K2SO4 0.7256 HCO3 0.196 * pH 5.8
*) Not added to the anoxic water.

7
Table 2-4. Chemicals used in preparation of the brackish reference water OLBA. At pH 10 the concentration of Ca and carbonate concentration was diluted to 1/10.
Composition Chemicals mg/L mg/L Na 1750 NaCl 3777 K 18.9 KCl 22.62 Ca 84.5 CaCl2·2H2O 310.0 Mg 26.5 MgCl2·6H2O 221.3 Cl 2530 SO4 458 Na2SO4 676.8 Br 13.1 KBr 19.56 F 0.30 KF 0.91 Sr 0.10 SrCl2·6H2O 0.30 NH4 0.33 NH4Cl 0.98 SiO2 6.1 Na2SiO3·9H2O 28.92 B 0.62 H3BO3 3.55 HCO3 111* NaHCO3 152.8 pH 7.6
*) value corresponds to 1.82 mmol/L.
2.3 Experimental methods Waters In batch sorption experiments, synthetic reference groundwater solutions (OLGA, ALLMR, OLBA, OLSR) were used. All solutions were prepared to deionised water (Milli-Q) and pro analysis grade reagents. The oxygen-free solutions were prepared under a nitrogen or argon atmosphere. The water was degassed by boiling followed with nitrogen gas flow before transferring it to a glove-box. The experiments were run inside the anaerobic glove-box (MBraun 150MB-GH-B) or in-house made glove-box (argon), to prevent the interference of atmospheric carbon dioxide as well, especially in the alkaline solutions. The oxygen gas content was monitored during the experiment (MBraun). In addition to the reference pH of the water, the pH of solutions was adjusted between 5.8 and 10. A solution with pH 10 corresponds to the effect of the cement plume. The pH was adjusted with diluted HCl and NaOH (Merck, Titrisol). OLBA water could not be prepared below pH 8. In addition, the carbonate and calcium concentration had to be reduced to one tenth when preparing the pH 10 solution due to possible carbonate precipitation. The buffers MES, MOPS, TRIS and CHES were used to regulate the pH during some sorption experiments (Perrin & Dempsey 1974). Their concentration was 10-3 M in sample solution. The 0.1 M sodium and calcium perchlorate solutions were prepared of

8
solid NaClO4·H2O and Ca(ClO4)2·4H20 (Sigma-Aldrich, p.a.) in deionised water (Milli-Q). The studied pH range was adjusted using buffer solutions 4 to 10. Solids The used clay minerals were illite IMT-1 obtained from the American Clay Minerals Society Source Clays Repository and kaolinite KGa-1b from the reference clays of the American Clay Minerals Society. The minerals were pre-treated to remove possible interferences during the sorption experiments, according to the method by Tournassat et al. (2007). Batch sorption method Samples were weighed in polyethylene vessels using a digital weighing balance with accuracy ± 0.0005. Mineral samples and crushed rock were immersed in solution for one day before adding the tracer to condition the solid material with the solution. In the experiments, polyethylene vessels were used. When the sample size allowed, the solution was changed once before adding the tracer. At least two parallel samples were made. The experiments were mainly carried out in an N2- or Ar-atmosphere, few under ambient atmospheric conditions. After tracer (and carrier) addition, the pH was adjusted using diluted carbonate-free HCl or NaOH solutions when necessary. The samples were stored in an end-over-end rotator during the experiment. After completing the experiment, the pH was measured. The contact time varied from three (minerals) to seven (rocks) days. All experiments were made at room temperature. Pipetting of solutions was performed with calibrated pipettes using good laboratory practice. The solid material was separated by centrifugation (3000 g, 10 min) and filtration (0.22 µm Millex-GV Durapore). An aliquot for the radioactivity measurement was taken. 2.4 Modeling The speciation of individual nuclides and modeling the sorption results was calculated by a computer program PHREEQC (Parkhurst & Appelo 2003), using ANDRA’s Thermo_Chimie Version 7b database (ANDRA 2009). The non electrostatic diffuse layer model was used in calculations. Table 2-5 describes the surface parameters of the kaolinite KGa-1b and illite IMt-1. In Table 2-6 are the hydrolyzing reactions and log k values of kaolinite KGa-1b and illite IMt-1.

9
Table 2-5. Surface parameters of kaolinite KGa-1b and illite IMt-1.
Parameter Kaolinite KGa-1b Illite IMt-1 SA (m2/g) 11.6 ** 97 *
Sorption sites (sites/nm2) 1.89 *** 2.3**
Sorption sites 3.64E-5 (mol/g) 2E-3 mol/kg ** (Ss=OH) 4E-2 mol/kg ** (Sw=OH)
CEC (meq/kg) 4 ** 225 *
SA: surface area CEC: cation exchange capacity (Ss=OH) strong sites (Sw=OH) weak sites * Bradbury & Baeyens (2009) ** Olin et al. 2007 Table 2-6. Hydrolyzing reactions and log k values of kaolinite KGa-1b and illite IMt-1.
Kaolinite KGa-1b Illite IMt-1 Reaction log k Reaction log k
X_sOH + H+ = X_sOH2+ 4.55 * X_sOH + H+ = X_sOH2
+ 4.0 ** X_sOH = X_sO- + H+ -9.01 * X_sOH = X_sO- + H+ -6.2 ** X_wOH + H+ = X_wOH2
+ 4.0 ** X_wOH = X_wO- + H+ -6.2 ** * values from database REST (Brendler 2006) and converted to correspond the 2.3 sites/nm2 according to method presented in Kulik (2002) ** Bradbury & Baeyens (2009)
REFERENCES ANDRA 2009. ThermoChimie Version 7b, C.RP.ASTR.O4.0032. Bradbury, M.H. & Baeyens, B. 2009. Sorption modelling on illite Part I: Titration measurements and the sorption of Ni, Co, Eu and Sn, Geochim. Cosmochim. Acta 73. Brendler, V. 2006. RES3T - The Rossendorf Expert System for Surface and Sorption Thermodynamics. Version 2 beta. FZ Rossendorf, Germany. Kulik, D.A. 2002. Sorption modeling by Gibbs energy minimization: towards a uniform thermodynamic database for surface complexes of radionuclide. Radiochim. Acta 90, 815-832. Olin M., Puhakka E., Lehikoinen J., Puukko E., Hakanen M., Lindberg A. 2007. Characterisation of Kaolinite and Adsorption of Europium on Kaolinite, Posiva Working Report 2007-82, Posiva Oy, Olkiluoto, Finland.

10
Parkhurst, D.L. & Appelo, C.A.J. 1999. User's guide to PHREEQC (Version 2) - A computer program for speciation, batch reaction, one-dimensional transport, and inverse geochemical calculations. U.S. Geological Survey Water-Resources Investigations. Report 99-4259. Tournassat, C., Gailhanou, H., Crouzet, C., Braibant, G., Gautier, A., Lassin, A., Blanc, P., Gaucher, E.C. 2007. Geochim. Cosmochim. Acta 71, 1098–1114. Vuorinen, U. & Snellman, M. 1998. Finnish reference waters for solubility, sorption and diffusion studies. POSIVA Working Report 1998-61, Posiva Oy, Helsinki, Finland.
11
3 RESULTS 3.1 NICKEL 3.1.1 Experimental description The sorption of nickel on natural kaolinite KGa-1b and on purified KGa-1b was studied in pH buffered 0.001 M, 0.01 M and 0.1 M NaN03 solutions. (Puukko & Hakanen 1998). Organic buffers of MES, MOPS, TRIS and CHES were used to buffer the solutions. The buffer concentration was 1·10-3 M and pH was adjusted with 0.1 M HCl or NaOH (Merck, Titrisol) according to Perrin & Dempsey (1974). 3.1.2 Speciation of Nickel The speciation of nickel was calculated with PHREEQC program (Parkhurst & Appelo 2003) using ThermoChimie (ANDRA 2009) data base. The speciation reactions and their equilibrium constants used are listed in Table Ni-1. Figures Ni-1, Ni-2 and Ni-3 present the speciation of Ni in 0.001 M, 0.01 M and 0.1 M NaN03 solutions. Table Ni-1. Speciation reactions and their equilibrium constants of nickel (ANDRA 2009). Speciation reaction log k No Ni+2 = Ni+2 0 1 Ni+2 + H2O = Ni(OH)+ + H+ -9.54 2 Ni+2 + 2H2O = Ni(OH)2 +2H+ -18 3 Ni+2 + 3H2O = Ni(OH)3
- +3H+ -29.38 4 Ni+2 + NO3
- = Ni(NO3)+ 0.5 5
Ni+2 + 2NO3- = Ni(NO3)2 -0.6 6

12
Figure Ni-1. Aqueous speciation of nickel (1·10-6M) in 0.001 M NaNO3 solution. The speciation reactions are taken from Table Ni-1. The contribution of individual Ni (II) species are shown by curves: (1) Ni+2; (2) Ni(OH)+; (3) Ni(OH)2 ; (4);Ni(OH)3
- (5) Ni(NO3)
+. The modeled curves were calculated by PHREEQC and ThermoChimie database (Parkhurts & Appelo 1999, ANDRA 2009).
Figure Ni-2. Aqueous speciation of nickel (1·10-6M) in 0.01 M NaNO3 solution. The speciation reactions are taken from Table Ni-1. The contribution of individual Ni (II) species are shown by curves: (1) Ni+2; (2) Ni(OH)+; (3) Ni(OH)2 ; (4);Ni(OH)3
- (5) Ni(NO3)
+; (6) Ni(NO3)2. The modeled curves were calculated by PHREEQC and ThermoChimie database (Parkhurts & Appelo 1999, ANDRA 2009).
1
23 4
5
1.E-12
1.E-11
1.E-10
1.E-09
1.E-08
1.E-07
1.E-06
1.E-05
1.E-04
1.E-03
4 5 6 7 8 9 10
m (m
ol/k
gw)
pH
Ni speciation in 0.001 M NaNO3
1
2 3 4
5
6
1.E-12
1.E-11
1.E-10
1.E-09
1.E-08
1.E-07
1.E-06
1.E-05
1.E-04
1.E-03
4 5 6 7 8 9 10
m (m
ol/k
gw)
pH
Ni speciation in 0.01 M NaNO3
13
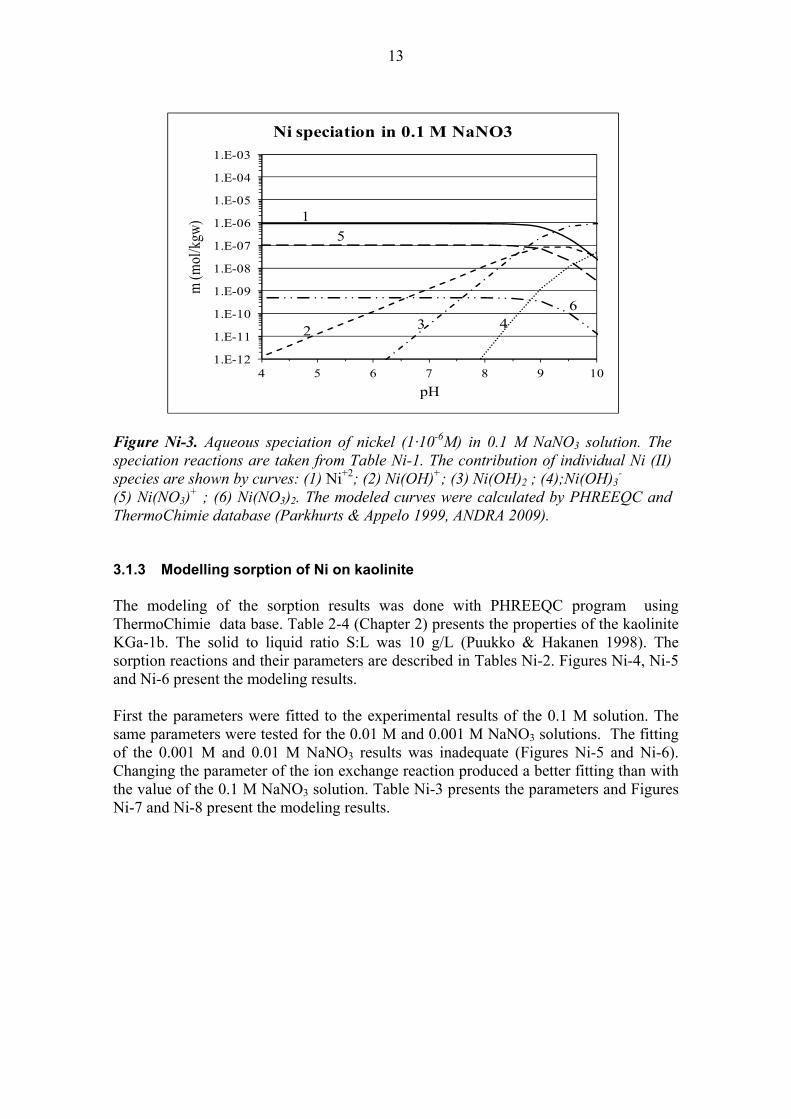
Figure Ni-3. Aqueous speciation of nickel (1·10-6M) in 0.1 M NaNO3 solution. The speciation reactions are taken from Table Ni-1. The contribution of individual Ni (II) species are shown by curves: (1) Ni+2; (2) Ni(OH)+; (3) Ni(OH)2 ; (4);Ni(OH)3
- (5) Ni(NO3)
+ ; (6) Ni(NO3)2. The modeled curves were calculated by PHREEQC and ThermoChimie database (Parkhurts & Appelo 1999, ANDRA 2009). 3.1.3 Modelling sorption of Ni on kaolinite The modeling of the sorption results was done with PHREEQC program using ThermoChimie data base. Table 2-4 (Chapter 2) presents the properties of the kaolinite KGa-1b. The solid to liquid ratio S:L was 10 g/L (Puukko & Hakanen 1998). The sorption reactions and their parameters are described in Tables Ni-2. Figures Ni-4, Ni-5 and Ni-6 present the modeling results. First the parameters were fitted to the experimental results of the 0.1 M solution. The same parameters were tested for the 0.01 M and 0.001 M NaNO3 solutions. The fitting of the 0.001 M and 0.01 M NaNO3 results was inadequate (Figures Ni-5 and Ni-6). Changing the parameter of the ion exchange reaction produced a better fitting than with the value of the 0.1 M NaNO3 solution. Table Ni-3 presents the parameters and Figures Ni-7 and Ni-8 present the modeling results.
1
2 3 4
5
6
1.E-12
1.E-11
1.E-10
1.E-09
1.E-08
1.E-07
1.E-06
1.E-05
1.E-04
1.E-03
4 5 6 7 8 9 10
m (m
ol/k
gw)
pH
Ni speciation in 0.1 M NaNO3

14
Table Ni-2. The sorption reactions and log k values for the sorption of Ni on kaolinite KGa-1b in 0.1 M NaNO3 solution.
Ion exchange reaction log k No Na+ + Z- = NaZ 0.0 Z- + H+ = HZ 0.0 2Z- + Ni+2 = NiZ2 1.3 1 Surface complexation reaction log k No X_sOH + Ni+2 = X_sONi+ + H+ -2.5 2 X_sOH + Ni+2 + H2O = X_sONi(OH) -10.5 3
Figure Ni-4. Sorption of nickel on kaolinite in 0.1 M NaNO3 solution. The contribution of individual Ni (II) surface species are shown by curves: (1) NiZ2 ; (2) X_sONi+ ;(3) X_sONi(OH). The modeled curves were calculated by PHREEQC and ThermoChimie database (Parkhurst & Appelo 1999, ANDRA 2009). The parameters are given in Table Ni-2.
1
2 31.E-04
1.E-03
1.E-02
1.E-01
1.E+00
1.E+01
1.E+02
4 5 6 7 8 9 10
Rd
(m3/
kg)
pH
Ni kaolinite KGa-1b in 0.1 M NaNO3

15
Figure Ni-5. Sorption of nickel on kaolinite in 0.01 M NaNO3 solution. The contribution of individual Ni (II) surface species are shown by curves: (1) NiZ2 ; (2) X_sONi+ ;(3) X_sONi(OH). The modeled curves were calculated by PHREEQC and ThermoChimie database (Parkhurst & Appelo 1999, ANDRA 2009). The parameters are given in Table Ni-2.
Figure Ni-6. Sorption of nickel on kaolinite in 0.001 M NaNO3 solution. The contribution of individual Ni (II) surface species are shown by curves: (1) NiZ2 ; (2) X_sONi+ ;(3) X_sONi(OH). The modeled curves were calculated by PHREEQC and ThermoChimie database (Parkhurst & Appelo 1999, ANDRA 2009). The parameters are given in Table Ni-2.
1
2
3
1.E-04
1.E-03
1.E-02
1.E-01
1.E+00
1.E+01
1.E+02
4 5 6 7 8 9 10
Rd
(m3/
kg)
pH
Ni kaolinite KGa-1b in 0.01 M NaNO3
1
2
3
1.E-04
1.E-03
1.E-02
1.E-01
1.E+00
1.E+01
1.E+02
4 5 6 7 8 9 10
Rd
(m3/
kg)
pH
Ni kaolinite KGa-1b in 0.001 M NaNO3

16
Table Ni-3. The sorption reactions and log k values for the sorption of Ni on kaolinite KGa-1b in 0.01 M NaNO3 and 0.001 M NaNO3 solutions.
0.01 M 0.001 M Ion exchange reaction log k log k Na+ + Z- = NaZ 0.0 0.0 Z- + H+ = HZ 0.0 0.0 2Z- + Ni+2 = NiZ2 1.0 -0.7 Surface complexation reaction log k log k X_sOH + Ni+2 = X_sONi+ + H+ -2.5 0.1 X_sOH + Ni+2 + H2O = X_sONi(OH) -10.5 1.0
Figure Ni-7. Sorption of nickel on kaolinite in 0.01 M NaNO3 solution. The contribution of individual Ni (II) surface species are shown by curves: (1) NiZ2 ; (2) X_sONi+ ;(3) X_sONi(OH). The modeled curves were calculated by PHREEQC and ThermoChimie database (Parkhurst & Appelo 1999, ANDRA 2009). The parameters are given in Table Ni-3.
1
2
3
1.E-04
1.E-03
1.E-02
1.E-01
1.E+00
1.E+01
1.E+02
4 5 6 7 8 9 10
Rd
(m3/
kg)
pH
Ni kaolinite KGa-1b in 0.01 M NaNO3

17
Figure Ni-8. Sorption of nickel on kaolinite in 0.001 M NaNO3 solution. The contribution of individual Ni (II) surface species are shown by curves: (1) NiZ2 ; (2) X_sONi+ ;(3) X_sONi(OH). The modeled curves were calculated by PHREEQC and ThermoChimie database (Parkhurst & Appelo 1999, ANDRA 2009). The parameters are given in Table Ni-3.
REFERENCES ANDRA 2009. ThermoChimie Version 7b, C.RP.ASTR.O4.0032. Bradbury M.H. & Baeyens B. 2009. Sorption modelling on illite Part I: Titration measurements and the sorption of Ni, Co, Eu and Sn, Geochim. Cosmochim. Acta 73. Parkhurst, D.L. & Appelo, C.A.J. 1999. User's guide to PHREEQC (Version 2) - A computer program for speciation, batch reaction, one-dimensional transport, and inverse geochemical calculations. U.S. Geological Survey Water-Resources Investigations. Report 99-4259. Perrin, D.D. & Dempsey, B. 1974. Buffers for pH and metal ion control, Chapman & Hall, London. Puukko E. & Hakanen M. 1998. Characterisation of kaolinite and the sorption of nickel on kaolinite, Posiva Working Report 98-60, Posiva Oy, Helsinki, Finland.
1 2
3
1.E-04
1.E-02
1.E+00
1.E+02
1.E+04
1.E+06
1.E+08
1.E+10
4 5 6 7 8 9 10
Rd
(m3/
kg)
pH
Ni kaolinite KGa-1b in 0.001 M NaNO3

18
3.2 SELENIUM 3.2.1 Experimental description The sorption experiments were performed by a batch sorption method (Hakanen et al. 2012). The used minerals were illite IMt-1 and kaolinite KGa-1b (see Chapter 2.1). In the experiments, synthetic reference groundwater solutions (OLSR, ALLMR, OLBA, OLGA) were used (see Chapter 2.2). The pH was measured using an Aquapro combination glass electrode. In calibration pH buffer solutions 4, 7 and 10 were used. The experiments were run inside the anaerobic glove-box to prevent the interference of atmospheric carbon dioxide as well, especially in the alkaline solutions (see Chapter 2.3). The radioactive tracer used was Se-75 (T½ = 119.78d). The radioactivity was assayed by Wizard 3” 1480. The tracer concentration was based on speciation and dissolution calculations by PHREEQC using ThermoChimie database so as not to exceed the solubility of the element and avoid tracer precipitation before the experiment (Parkhurst & Appelo 1999, ANDRA 2009). The selenium concentration was 3.2·10-6 M in all waters.
Mineral samples were immersed in water for one day before adding the tracer to condition the solid material with the solution (0.4:20 g/mL). After the tracer addition, the pH was adjusted using diluted carbonate-free HCl or NaOH solutions when necessary. The samples were stored in an end-over-end rotator during the experiment. The contact time was three days. After completing the experiment, the pH was measured. The solid material was separated by centrifugation and filtration. An aliquot for the radioactivity measurement was taken and the mass distribution coefficient Rd (m3/kg) was determined. 3.2.2 Speciation of Selenium Selenium speciation in waters was modeled by PHREEQC using ThermoChimie database (Parkhurst & Appelo 2003, ANDRA 2009). The speciation reactions and their equilibrium constants used are listed in Table Se-1. At higher pH, the carbonate concentration in the calculation was limited by allowing the precipitation of calcite. Modeling gave for the main selenium species SeO3
-2 and HSeO3-2 for all waters when
the redox conditions were fixed by hydrogen partial pressure to -25. In these redox conditions the selenate species do not exist. In the acid waters, H2SeO3 species gave some contribution to overall speciation. Species CaSeO4 and MgSeO4 are minor species in all waters. The ratio of HSeO3
-2/SeO3-2 changes slightly with pH for saline and fresh
waters. This indicates only small differences in sorption between the waters since both species are sorbed about the same strength. The modeling results for different waters are seen in Figures Se-1-4.

19
Figure Se-1. Aqueous speciation of selenium (3.2·10-6M) in OLSR reference water. The speciation reactions are taken from Table Se-1. The contribution of individual Se (IV) species are shown by curves: (1) SeO3
-; (2) HSeO3-; (3) H2SeO3; (4) CaSeO4; (5)
MgSeO4. The modeled curves were calculated by PHREEQC and ThermoChimie database (Parkhurts & Appelo 1999, ANDRA 2009).
Figure Se-2. Aqueous speciation of selenium (3.2·10-6M) in ALLMR reference water. The speciation reactions are taken from Table Se-1. The contribution of individual Se (IV) species are shown by curves: (1) SeO3
-2; (2) HSeO3-; (3) H2SeO3; (5) MgSeO4. The
modeled curves were calculated by PHREEQC and ThermoChimie database (Parkhurst & Appelo 1999, ANDRA 2009).

20
Figure Se-3. Aqueous speciation of selenium (3.2·10-6M) in OLBA reference water. The speciation reactions are taken from Table Se-1. The contribution of individual Se (IV) species are shown by curves: (1) SeO3
-2; (2) HSeO3-; (3) H2SeO3; (5) MgSeO4. The
modeled curves were calculated by PHREEQC and ThermoChimie database (Parkhurst & Appelo 1999, ANDRA 2009).
Figure Se-4. Aqueous speciation of selenium (3.2·10-6M) in OLGA reference water. The speciation reactions are taken from Table Se-1. The contribution of individual Se (IV) species are shown by curves: (1) SeO3
-2; (2) HSeO3-; (3) H2SeO3; (5) MgSeO4. The
modeled curves were calculated by PHREEQC and ThermoChimie database (Parkhurst & Appelo 1999, ANDRA 2009).
1 2
35
1E-13
1E-12
1E-11
1E-10
1E-9
1E-8
1E-7
1E-6
1E-5
1E-4
6 7 8 9 10 11
m(m
ol/k
gw)
pH
Se speciation in OLBA
1 2
3 5
1E-13
1E-12
1E-11
1E-10
1E-9
1E-8
1E-7
1E-6
1E-5
1E-4
6 7 8 9 10 11
m(m
ol/k
gw)
pH
Se speciation in OLGA

21
Table Se-1. Speciation reactions and their equilibrium constants of selenium (ANDRA 2009). Speciation reaction log k No SeO3
-2 + H+ = HSeO3- 8.54 1
SeO3-2 + 2H+ = H2SeO3 11.24 3
Ca+2 + SeO4-2 = CaSeO4 2.0 4
Mg+2 + SeO4-2 = MgSeO 2.2 5
HSe- + H+ = H2Se 3.80 6 HSe- = Se-2 + H+ -14.00 7 SeO4
-2 + H+ = HSeO4- 1.80 8
SeO4-2 + 2H+ = H2SeO4 -0.21 9
3.2.3 Modeling sorption of Se on kaolinite The parameter data for surface sites and their densities were obtained from RES3T database and converted to correspond the used site density (Brendler 2006, see Chapter 2.4). The non electrostatic diffuse layer model was chosen to describe the sorption behavior of selenium. The modeling was started from selenium surface reactions reported by Missana et al. (2009) and applied to OLSR. However their surface reactions and parameters did not fit well in data points. Therefore other surface reactions were tried. The best fit was achieved with three surface species X_wOH2SeO3
-, X_wOHSeO3-2 and X_wOH2HSeO3
(Figure Se-5). The obtained equilibrium constants are listed in Table Se-2. The best fit from OLSR was applied to other waters (Figures Se-6-8). For OLGA the model predicted slightly too low values compared with the experimental values. The speciation modeling does not explain the difference. In addition the fit failed at the highest experimental pH. This discrepancy has been observed previously (Missana et al. 2009). Recently Montavon et al. (2009) explained similar phenomena in bentonite by formation of ternary surface complexes involving calcium and magnesium ions. Table Se-2. Surface reactions and their equilibrium constants of selenium for kaolinite. Surface reaction log k No X_wOH2
+ + SeO3-2 = X_wOH2SeO3
- 11.0 1 X_wOH + SeO3
-2 = X_wOHSeO3-2 3.5 2
X_wOH + H+ + HSeO3- = X_wOH2HSeO3 10.0 3

22
Figure Se-5. Sorption of selenium on kaolinite in OLSR reference water. The contribution of individual Se (IV) surface species are shown by curves: (1) X_wOH2SeO3
-; (2) X_wOH2HSeO3; (3) X_wOHSeO3-2. The modeled curves were
calculated by PHREEQC and ThermoChimie database (Parkhurst & Appelo 1999, ANDRA 2009). The parameters are given in Table Se-2.
Figure Se-6. Sorption of selenium on kaolinite in ALLMR reference water. The contribution of individual Se (IV) surface species are shown by curves: (1) X_wOH2SeO3
-; (2) X_wOH2HSeO3; (3) X_wOHSeO3-2. The modeled curves were
calculated by PHREEQC and ThermoChimie database (Parkhurst & Appelo 1999, ANDRA 2009). The parameters are given in Table Se-2.
1
2
3
1E-6
1E-5
1E-4
1E-3
1E-2
1E-1
1E+0
1E+1
6 7 8 9 10 11
Rd(
m3 /
kg)
pH
Se kaolinite in OLSR
123
1E-6
1E-5
1E-4
1E-3
1E-2
1E-1
1E+0
1E+1
6 7 8 9 10 11
Rd(
m3 /
kg)
pH
Se kaolinite in ALLMR

23
Figure Se-7. Sorption of selenium on kaolinite in OLBA reference water. The contribution of individual Se (IV) surface species are shown by curves: (1) X_wOH2SeO3
-; (2) X_wOH2HSeO3; (3) X_wOHSeO3-2. The modeled curves were
calculated by PHREEQC and ThermoChimie database (Parkhurst & Appelo 1999, ANDRA 2009). The parameters are given in Table Se-2.
Figure Se-8. Sorption of selenium on kaolinite in OLGA reference water. The contribution of individual Se (IV) surface species are shown by curves: (1) X_wOH2SeO3
-; (2) X_wOH2HSeO3; (3) X_wOHSeO3-2. The modeled curves were
calculated by PHREEQC and ThermoChimie database (Parkhurst & Appelo 1999, ANDRA 2009). The parameters are given in Table Se-2.
1
2
3
1E-6
1E-5
1E-4
1E-3
1E-2
1E-1
1E+0
1E+1
6 7 8 9 10 11
Rd(
m3 /
kg)
pH
Se kaolinite in OLBA
12
3
1E-6
1E-5
1E-4
1E-3
1E-2
1E-1
1E+0
1E+1
5 6 7 8 9 10 11
Rd(
m3 /
kg)
pH
Se kaolinite in OLGA

24
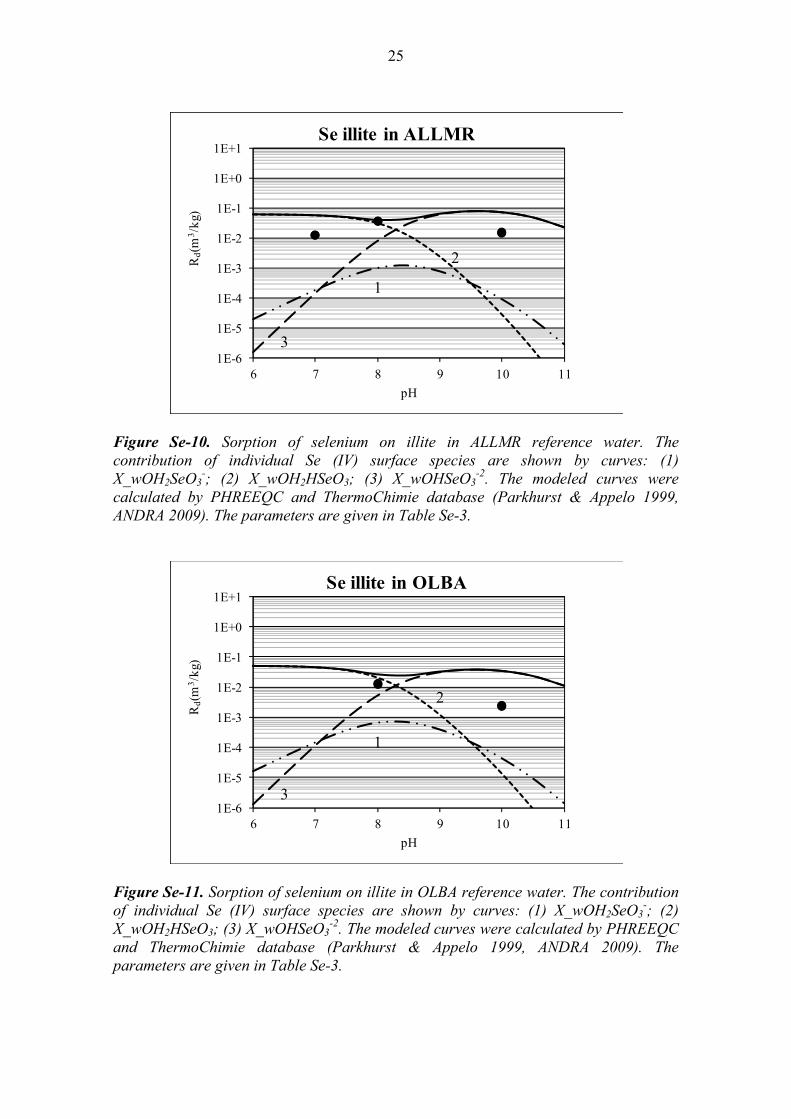
3.2.4 Modeling sorption of Se on illite The starting data for surface sites and their densities were obtained from Missana et al. (2009) originally from Bradbury and Baeyens (2009) (see Chapter 2.4). The non-electrostatic diffuse layer model was chosen to describe the sorption behavior of selenium. The modeling was started from selenium surface reactions obtained from modeling kaolinite and applied to OLSR. However the parameters did not fit well in data points. Therefore the parameters were optimized for illite. The best fit was achieved with three surface species X_wOH2SeO3
-, X_wOHSeO3-2 and X_wOH2HSeO3 (Figure Se-9). The
obtained equilibrium constants are listed in Table Se-3. The best fit from OLSR was applied to other waters (Figures Se-10-12). For ALLMR and OLBA the model predicted the experimental data reasonably. For OLGA, the model gave clearly too high values compared with the experimental values. The speciation modeling does not explain the difference. The fit failed at the highest pH as in the case of kaolinite. Table Se-3. Surface reactions and their equilibrium constants of selenium for illite.
Surface reaction log k No X_wOH2
+ + SeO3-2 = X_wOH2SeO3
- 11.40 1 X_wOH + SeO3
-2 = X_wOHSeO3-2 4.3 2
X_wOH + H+ + HSeO3- = X_wOH2HSeO3 12.53 3
Figure Se-9. Sorption of selenium on illite in OLSR reference water. The contribution of individual Se (IV) surface species are shown by curves: (1) X_wOH2SeO3
-; (2) X_wOH2HSeO3; (3) X_wOHSeO3
-2. The modeled curves were calculated by PHREEQC and ThermoChimie database (Parkhurst & Appelo 1999, ANDRA 2009). The parameters are given in Table Se-3.
1
2
3
1E-6
1E-5
1E-4
1E-3
1E-2
1E-1
1E+0
1E+1
6 7 8 9 10 11
Rd(
m3 /
kg)
pH
Se illite in OLSR
25
Figure Se-10. Sorption of selenium on illite in ALLMR reference water. The contribution of individual Se (IV) surface species are shown by curves: (1) X_wOH2SeO3
-; (2) X_wOH2HSeO3; (3) X_wOHSeO3-2. The modeled curves were
calculated by PHREEQC and ThermoChimie database (Parkhurst & Appelo 1999, ANDRA 2009). The parameters are given in Table Se-3.
Figure Se-11. Sorption of selenium on illite in OLBA reference water. The contribution of individual Se (IV) surface species are shown by curves: (1) X_wOH2SeO3
-; (2) X_wOH2HSeO3; (3) X_wOHSeO3
-2. The modeled curves were calculated by PHREEQC and ThermoChimie database (Parkhurst & Appelo 1999, ANDRA 2009). The parameters are given in Table Se-3.
1
2
31E-6
1E-5
1E-4
1E-3
1E-2
1E-1
1E+0
1E+1
6 7 8 9 10 11
Rd(
m3 /
kg)
pH
Se illite in ALLMR
1
2
31E-6
1E-5
1E-4
1E-3
1E-2
1E-1
1E+0
1E+1
6 7 8 9 10 11
Rd(
m3 /
kg)
pH
Se illite in OLBA

26
Figure Se-12. Sorption of selenium on illite in OLGA reference water. The contribution of individual Se (IV) surface species are shown by curves: (1) X_wOH2SeO3
-; (2) X_wOH2HSeO3; (3) X_wOHSeO3
-2. The modeled curves were calculated by PHREEQC and ThermoChimie database (Parkhurst & Appelo 1999, ANDRA 2009). The parameters are given in Table Se-3.
REFERENCES ANDRA 2009. ThermoChimie Version 7b, C.RP.ASTR.O4.0032. Bradbury, M.H. & Baeyens, B. 2009. Sorption modeling on illite. Part II actinide sorption and linear free energy relationships. Geochim. Cosmochim. Acta 73, 1004-1013. Brendler, V. 2006. RES3T – The Rossendorf Expert System for Surface and Sorption Thermodynamics. Version 2 beta. FZ Rossendorf. Hakanen, M., Ervanne, H., Puukko, E. 2012. Far-field geochemical database for the Olkiluoto site: Distribution coefficients for sorption of Radionuclides in the Olkiluoto geosphere. Posiva Working report 2012-XX. Missana, T., Alonso, U., García-Gutiérrez, M. 2009. Experimental study and modelling of selenite sorption onto illite and smectite clays. J. Coll. Int. Sci. 334,132-138. Montavon, G., Guo, Z., Lutzenkirchen, J., Alhajji, E., Kedziorek, M.A.M. 2009. Interaction of selenite with MX-80 bentonite: Effect of minor phases, pH, selenite loading, solution composition and compaction. Coll. Surf. A 332, 71-77. Parkhurst, D.L. & Appelo, C.A.J., 1999. User's guide to PHREEQC (version 2)--A computer program for speciation, batch-reaction, one-dimensional transport, and inverse geochemical calculations: U.S. Geological Survey Water-Resources Investigations Report 99-4259, 312 p.
1
2
31E-6
1E-5
1E-4
1E-3
1E-2
1E-1
1E+0
1E+1
5 6 7 8 9 10 11
Rd(
m3 /
kg)
pH
Se illite in OLGA

27
3.3 NIOBIUM
3.3.1 Experimental description The sorption experiments were performed by a batch sorption method (Hakanen et al. 2012). The used minerals were illite IMt-1 and kaolinite KGa-1b (see Chapter 2.1). In the experiments, synthetic reference groundwater solutions (OLSR, ALLMR, OLBA, OLGA) were used (see Chapter 2.2). The pH was measured using an Aquapro combination glass electrode. In calibration pH buffer solutions 4, 7 and 10 were used. The experiments were run inside the anaerobic glove-box to prevent the interference of atmospheric carbon dioxide as well, especially in the alkaline solutions (see Chapter 2.3). In addition the experiments were performed in 0.1 M NaClO4 and Ca(ClO4)2
solutions at the pH range 3 to 11 using buffer solutions. The radioactive tracer used was 95Nb (T1/2 = 34.97d). The radioactivity was assayed by Wizard 3” 1480. The tracer concentration was based on speciation and dissolution calculations by PHREEQC using ThermoChimie database so as not to exceed the solubility of the element and avoid tracer precipitation before the experiment (Parkhurst & Appelo 1999, ANDRA 2009). The niobium concentration was 10-8 M in groundwaters and 6.6·10-9 M in perchlorate solutions. Mineral samples were immersed in solution for one day before adding the tracer to condition the solid material with the solution (0.02:20 g/mL). After the tracer addition, the pH was adjusted using diluted carbonate-free HCl or NaOH solutions when necessary. The samples were stored in an end-over-end rotator during the experiment. The contact time was three days. After completing the experiment, the pH was measured. The solid material was separated by centrifugation and filtration. An aliquot for the radioactivity measurement was taken and the mass distribution coefficient Rd (m3/kg) was determined. 3.3.2 Speciation of Niobium Niobium speciation in waters was modeled by PHREEQC using ThermoChimie database (Parkhurts & Appelo 1999, ANDRA 2009). The speciation reactions and their equilibrium constants used are listed in Table Nb-1. At higher pH, the carbonate concentration in the calculation was limited by allowing the precipitation of calcite. Modeling gave for the main niobium species Nb(OH)5
-2, Nb(OH)6- and Nb(OH)7
-2 for all waters. In the acid waters, Nb(OH)4
+ and Nb(OH)3
+2species are minor species. The modeling results for OLSR water is seen in Figure Nb-1. The speciation in other waters is similar and therefore not presented. The speciation in 0.1 M NaClO4 is seen in Figure Nb-2. The speciation is similar to OLSR but includes the acid region. Since there is not any Ca-Nb species in the database, the speciation does not change for Ca(ClO4)2
solution.

28
Table Nb-1. Speciation reactions and their equilibrium constants of niobium (ANDRA 2009). Speciation reaction log k No Nb(OH)6
- + 2H+ = Nb(OH)4+ + 2H2O 6.64 1
Nb(OH)6- + H+ = Nb(OH)5 + H2O 5.08 2
Nb(OH)6- + H2O = Nb(OH)7
-2 + H+ -8.88 4 Nb(OH)6
- + 3H+ = Nb(OH)3+2 + 3H2O 7.50 5
Figure Nb-1. Aqueous speciation of niobium (10-8M) in OLSR reference water. The speciation reactions are taken from Table Nb-1. The contribution of individual Nb species are shown by curves: (1) Nb(OH)4
+; (2) Nb(OH)5; (3) Nb(OH)6-; (4) Nb(OH)7
-2. The modeled curves were calculated by PHREEQC and ThermoChimie database (Parkhurst & Appelo 1999, ANDRA 2009). The similar speciation is modeled for ALLMR, OLBA and OLGA.

29
Figure Nb-2. Aqueous speciation of niobium (6.6·10-9M) in NaClO4 solution. The speciation reactions are taken from Table Nb-1. The contribution of individual Nb species are shown by curves: (1) Nb(OH)4
+; (2) Nb(OH)5; (3) Nb(OH)6-; (4) Nb(OH)7
-2; (5) Nb(OH)3
+2. The modeled curves were calculated by PHREEQC and ThermoChimie database (Parkhurst & Appelo 1999, ANDRA 2009). The similar speciation is modeled for Ca(ClO4)2.
3.3.3 Modeling sorption of Nb on kaolinite The starting data for surface sites and their densities were obtained from RES3T database (Brendler 2006) (see Chapter 2.4). The non-electrostatic diffuse layer model was chosen Since previously modeled niobium results has not been presented in literature, modeling was started from niobium surface species X_wONb(OH)5
- and applied to OLSR. However this surface reaction did not fit well in data points at the whole pH range. Therefore other surface reactions were tried, namely X_wONb(OH)4 and X_wONb(OH)6
-2. The best fit was achieved with these three surface species (Figure Nb-3). The obtained equilibrium constants are listed in Table Nb-2. The modeling, however, is not still good at the whole pH range. The main problem is that with the species in the database it is not possible to modeled any better. The database needs new niobium species. Since the species are the same for all waters it is not possible to model the differences observed in the sorption results. The best fit from OLSR was applied to other waters (Figures Nb-4-6). Since the speciation in other waters is similar and the modeling results are the same as for OLSR, the other modeling results are not presented. The model differed mostly for OLGA, only at pH 7 the modeling gave similar values to the experimental ones. The speciation modeling does not explain the difference. Recently Bradbury et al. (2010) have also reported difficulties in modeling niobium sorption. There are two suggestions for new kind of niobium species to be taken account: Ca-niobates or niobium carbonates.
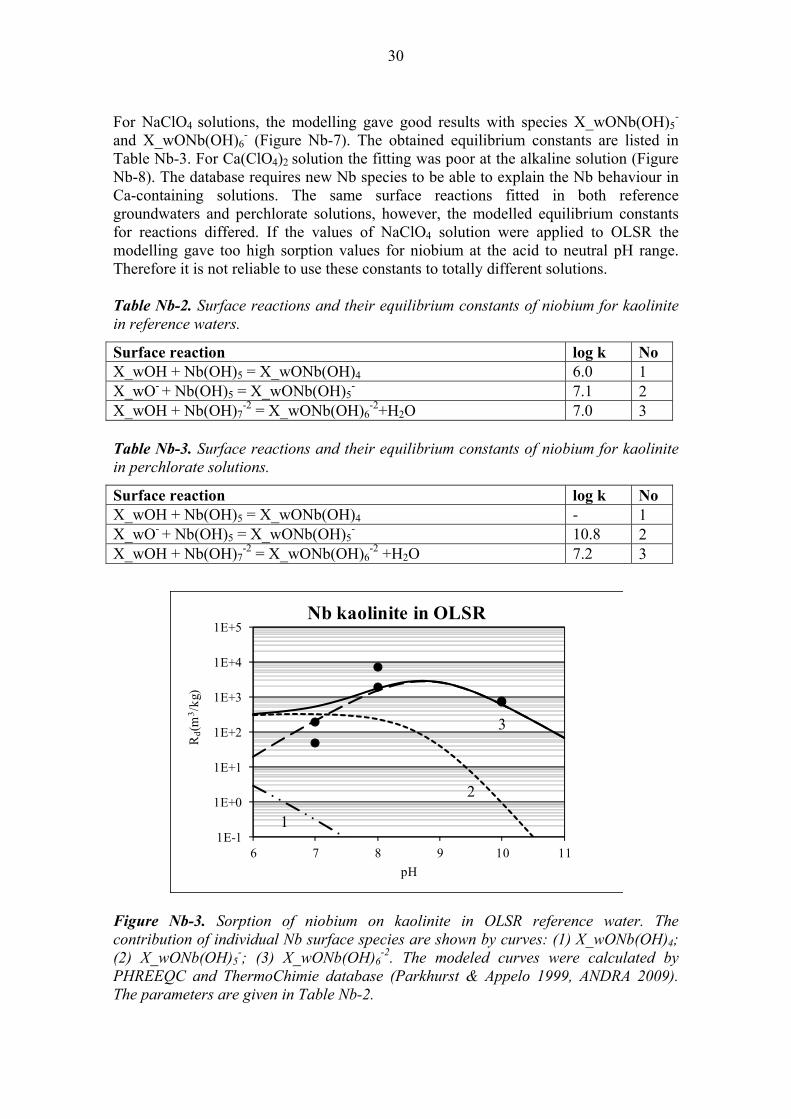
30
For NaClO4 solutions, the modelling gave good results with species X_wONb(OH)5
- and X_wONb(OH)6
- (Figure Nb-7). The obtained equilibrium constants are listed in Table Nb-3. For Ca(ClO4)2
solution the fitting was poor at the alkaline solution (Figure Nb-8). The database requires new Nb species to be able to explain the Nb behaviour in Ca-containing solutions. The same surface reactions fitted in both reference groundwaters and perchlorate solutions, however, the modelled equilibrium constants for reactions differed. If the values of NaClO4 solution were applied to OLSR the modelling gave too high sorption values for niobium at the acid to neutral pH range. Therefore it is not reliable to use these constants to totally different solutions. Table Nb-2. Surface reactions and their equilibrium constants of niobium for kaolinite in reference waters.
Surface reaction log k No X_wOH + Nb(OH)5 = X_wONb(OH)4 6.0 1 X_wO- + Nb(OH)5 = X_wONb(OH)5
- 7.1 2 X_wOH + Nb(OH)7
-2 = X_wONb(OH)6-2+H2O 7.0 3
Table Nb-3. Surface reactions and their equilibrium constants of niobium for kaolinite in perchlorate solutions.
Surface reaction log k No X_wOH + Nb(OH)5 = X_wONb(OH)4 - 1 X_wO- + Nb(OH)5 = X_wONb(OH)5
- 10.8 2 X_wOH + Nb(OH)7
-2 = X_wONb(OH)6-2 +H2O 7.2 3
Figure Nb-3. Sorption of niobium on kaolinite in OLSR reference water. The contribution of individual Nb surface species are shown by curves: (1) X_wONb(OH)4; (2) X_wONb(OH)5
-; (3) X_wONb(OH)6-2. The modeled curves were calculated by
PHREEQC and ThermoChimie database (Parkhurst & Appelo 1999, ANDRA 2009). The parameters are given in Table Nb-2.
1
2
3
1E-1
1E+0
1E+1
1E+2
1E+3
1E+4
1E+5
6 7 8 9 10 11
Rd(
m3 /
kg)
pH
Nb kaolinite in OLSR

31
Figure Nb-4. Sorption of niobium on kaolinite in ALLMR reference water. The contribution of individual Nb surface species are shown by curves: (1) X_wONb(OH)4; (2) X_wONb(OH)5
-; (3) X_wONb(OH)6-2. The modeled curves were calculated by
PHREEQC and ThermoChimie database (Parkhurst & Appelo 1999, ANDRA 2009). The parameters are given in Table Nb-2.
Figure Nb-5. Sorption of niobium on kaolinite in OLBA reference water. The contribution of individual Nb surface species are shown by curves: (1) X_wONb(OH)4; (2) X_wONb(OH)5
-; (3) X_wONb(OH)6-2. The modeled curves were calculated by
PHREEQC and ThermoChimie database (Parkhurst & Appelo 1999, ANDRA 2009). The parameters are given in Table Nb-2.
1
2
3
1E-1
1E+0
1E+1
1E+2
1E+3
1E+4
1E+5
6 7 8 9 10 11
Rd(
m3 /
kg)
pH
Nb kaolinite in ALLMR
1
2
3
1E-1
1E+0
1E+1
1E+2
1E+3
1E+4
1E+5
6 7 8 9 10 11
Rd(
m3 /
kg)
pH
Nb kaolinite in OLBA

32
Figure Nb-6. Sorption of niobium on kaolinite in OLGA reference water. The contribution of individual Nb surface species are shown by curves: (1) X_wONb(OH)4; (2) X_wONb(OH)5
-; (3) X_wONb(OH)6-2. The modeled curves were calculated by
PHREEQC and ThermoChimie database (Parkhurts & Appelo 1999, ANDRA 2009). The parameters are given in Table Nb-2.
Figure Nb-7. Sorption of niobium on kaolinite in NaClO4 solution. The contribution of individual Nb surface species are shown by curves: (2) X_wONb(OH)5
-; (3) X_wONb(OH)6
-2. The modeled curves were calculated by PHREEQC and ThermoChimie database (Parkhurst & Appelo 1999, ANDRA 2009). The parameters are given in Table Nb-3.
1
2
3
1E-1
1E+0
1E+1
1E+2
1E+3
1E+4
1E+5
6 7 8 9 10 11
Rd(
m3 /
kg)
pH
Nb kaolinite in OLGA
23
1E-4
1E-3
1E-2
1E-1
1E+0
1E+1
1E+2
1E+3
1E+4
4 5 6 7 8 9 10 11
Rd(
m3 /
kg)
pH
Nb kaolinite in NaClO4

33
Figure Nb-8. Sorption of niobium on kaolinite in Ca(ClO4)2 solution. The contribution of individual Nb surface species are shown by curves: (2) X_wONb(OH)5
-; (3) X_wONb(OH)6
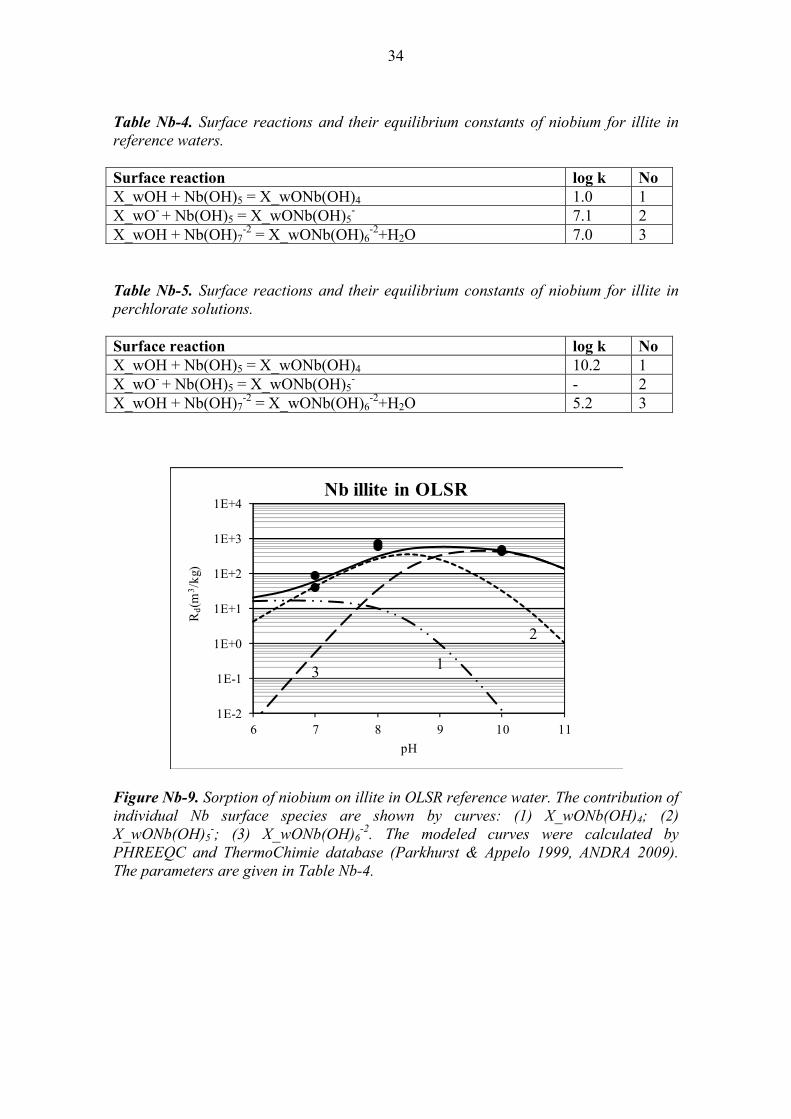
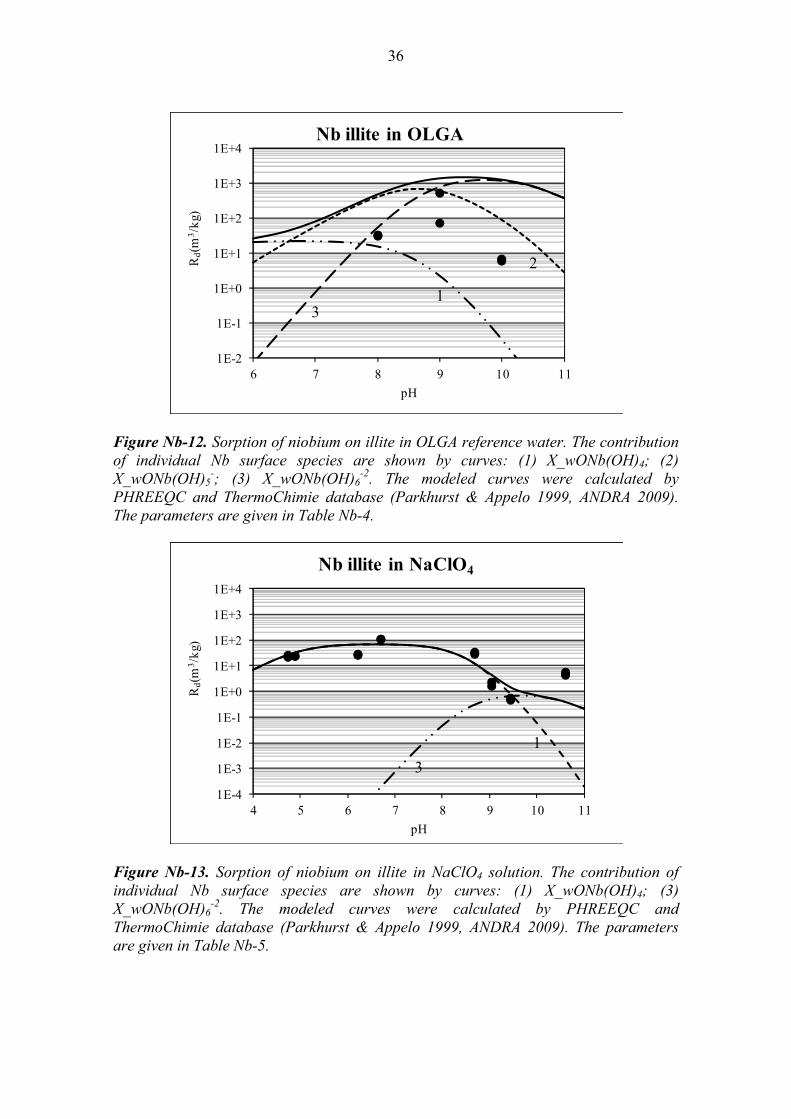
-2. The modeled curves were calculated by PHREEQC and ThermoChimie database (Parkhurts & Appelo 1999, ANDRA 2009). The parameters are given in Table Nb-3. 3.3.4 Modeling sorption of Nb on illite The starting data for surface sites and their densities were obtained from Bradbury and Baeyens (2009) (see Chapter 2.4). The non-electrostatic diffuse layer model was chosen The modeling was started from niobium surface reactions obtained from modeling kaolinite and applied to OLSR. The parameters were reoptimized for illite and good fit was obtained (Figure Nb-9). The obtained equilibrium constants are listed in Table Nb-4. The best fit from OLSR was applied to other waters (Figures Nb-10-12). However for the other waters the fitting did not succeed. Since the speciation in other waters is similar and the modeling results are the same as for OLSR, the other modeling results are not presented. The model gave clearly too high values compared with the experimental values. The speciation modeling does not explain the difference as for kaolinite. For NaClO4
solutions, the modelling gave good results (Figure Nb-13). The obtained equilibrium constants are listed in Table Nb-5. For Ca(ClO4)2
solution the fitting was poor at the alkaline solution (Figure Nb-14). The database requires new Nb species to be able to explain the Nb behaviour in Ca-containing solutions.
23
1E-2
1E-1
1E+0
1E+1
1E+2
1E+3
1E+4
4 5 6 7 8 9 10 11
Rd(
m3 /
kg)
pH
Nb kaolinite in Ca(ClO4)2
34
Table Nb-4. Surface reactions and their equilibrium constants of niobium for illite in reference waters. Surface reaction log k No X_wOH + Nb(OH)5 = X_wONb(OH)4 1.0 1 X_wO- + Nb(OH)5 = X_wONb(OH)5
- 7.1 2 X_wOH + Nb(OH)7
-2 = X_wONb(OH)6-2+H2O 7.0 3
Table Nb-5. Surface reactions and their equilibrium constants of niobium for illite in perchlorate solutions. Surface reaction log k No X_wOH + Nb(OH)5 = X_wONb(OH)4 10.2 1 X_wO- + Nb(OH)5 = X_wONb(OH)5
- - 2 X_wOH + Nb(OH)7
-2 = X_wONb(OH)6-2+H2O 5.2 3
Figure Nb-9. Sorption of niobium on illite in OLSR reference water. The contribution of individual Nb surface species are shown by curves: (1) X_wONb(OH)4; (2) X_wONb(OH)5
-; (3) X_wONb(OH)6-2. The modeled curves were calculated by
PHREEQC and ThermoChimie database (Parkhurst & Appelo 1999, ANDRA 2009). The parameters are given in Table Nb-4.
1
2
3
1E-2
1E-1
1E+0
1E+1
1E+2
1E+3
1E+4
6 7 8 9 10 11
Rd(
m3 /
kg)
pH
Nb illite in OLSR

35
Figure Nb-10. Sorption of niobium on illite in ALLMR reference water. The contribution of individual Nb surface species are shown by curves: (1) X_wONb(OH)4; (2) X_wONb(OH)5
-; (3) X_wONb(OH)6-2. The modeled curves were calculated by
PHREEQC and ThermoChimie database (Parkhurst & Appelo 1999, ANDRA 2009). The parameters are given in Table Nb-4.
Figure Nb-11. Sorption of niobium on illite in OLBA reference water. The contribution of individual Nb surface species are shown by curves: (1) X_wONb(OH)4; (2) X_wONb(OH)5
-; (3) X_wONb(OH)6-2. The modeled curves were calculated by
PHREEQC and ThermoChimie database (Parkhurst & Appelo 1999, ANDRA 2009). The parameters are given in Table Nb-4.
1
2
3
1E-2
1E-1
1E+0
1E+1
1E+2
1E+3
1E+4
6 7 8 9 10 11
Rd(
m3 /
kg)
pH
Nb illite in ALLMR
2
3
1E-2
1E-1
1E+0
1E+1
1E+2
1E+3
1E+4
6 7 8 9 10 11
Rd(
m3 /
kg)
pH
Nb illite in OLBA
36
Figure Nb-12. Sorption of niobium on illite in OLGA reference water. The contribution of individual Nb surface species are shown by curves: (1) X_wONb(OH)4; (2) X_wONb(OH)5
-; (3) X_wONb(OH)6-2. The modeled curves were calculated by
PHREEQC and ThermoChimie database (Parkhurst & Appelo 1999, ANDRA 2009). The parameters are given in Table Nb-4.
Figure Nb-13. Sorption of niobium on illite in NaClO4 solution. The contribution of individual Nb surface species are shown by curves: (1) X_wONb(OH)4; (3) X_wONb(OH)6
-2. The modeled curves were calculated by PHREEQC and ThermoChimie database (Parkhurst & Appelo 1999, ANDRA 2009). The parameters are given in Table Nb-5.
1
2
3
1E-2
1E-1
1E+0
1E+1
1E+2
1E+3
1E+4
6 7 8 9 10 11
Rd(
m3 /
kg)
pH
Nb illite in OLGA
1
3
1E-4
1E-3
1E-2
1E-1
1E+0
1E+1
1E+2
1E+3
1E+4
4 5 6 7 8 9 10 11
Rd(
m3 /
kg)
pH
Nb illite in NaClO4

37
Figure Nb-14. Sorption of niobium on illite in Ca(ClO4)2 solution. The contribution of individual Nb surface species are shown by curves: (1) X_wONb(OH)4; (3) X_wONb(OH)6
-2. The modeled curves were calculated by PHREEQC and ThermoChimie database (Parkhurst & Appelo 1999, ANDRA 2009). The parameters are given in Table Nb-6.
REFERENCES ANDRA 2009. ThermoChimie Version 7b, C.RP.ASTR.O4.0032. Bradbury, M.H. & Baeyens, B. 2009. Sorption modeling on illite. Part II actinide sorption and linear free energy relationships. Geochim. Cosmochim. Acta 73, 1004-1013. Bradbury, M.H., Baeyens, B, Thoenen, T. 2010. Sorption Data Bases for Generic Swiss Argillaceous Rock Systems. PSI Technical Report 09-03, Paul Scherrer Institut, Villigen, Switzerland. Brendler, V. 2006. RES3T – The Rossendorf Expert System for Surface and Sorption Thermodynamics. Version 2 beta. FZ Rossendorf, Germany. Hakanen, M., Ervanne, H., Puukko, E. 2012. Far-field geochemical database for the Olkiluoto site: Distribution coefficients for sorption of Radionuclides in the Olkiluoto geosphere. Posiva Working report 2012-XX. Parkhurst, D.L. & Appelo, C.A.J., 1999. User's guide to PHREEQC (version 2)--A computer program for speciation, batch-reaction, one-dimensional transport, and inverse geochemical calculations: U.S. Geological Survey Water-Resources Investigations Report 99-4259, 312 p.
1
3
1E-2
1E-1
1E+0
1E+1
1E+2
1E+3
1E+4
4 5 6 7 8 9 10 11
Rd(
m3 /
kg)
pH
Nb illite in Ca(ClO4)2

38
3.4 MOLYBDENUM 3.4.1 Experimental description The sorption of molybdenum on kaolinite KGa-1b and illite IMt-1 was studied in synthetic groundwater solutions. They represented fresh slightly reducing granitic groundwater (ALLMR) and saline reducing groundwater (OLSR). Organic buffers of MES, MOPS, TRIS and CHES were used to buffer the solutions. The buffer concentration was 1·10-3 M and pH was adjusted with 0.1 M HCl or NaOH (Merck, Titrisol) according to Perrin & Dempsey (1974). All experiments were carried out under argon atmosphere at room temperature. 3.4.2 Speciation of Molybdenum Molybdenum exists as a solute in the form of the molybdate ion, MoO4
2-, in the pH and redox conditions of the rock-groundwater conditions (Hakanen et al., 2012). The molybdate ion is not complexed in groundwater conditions. In this study, Mo is assumed to exist solely as MoO4
2- in the synthetic solutions. The speciation reactions and their equilibrium constants used are listed in Table Mo-1. The calculation was done with PHREEQC program (Parkhurst & Appelo 2003) using ThermoChimie (ANDRA 2009) data base. The speciation of molybdenum in saline OLSR water is presented in Figure Mo-1. The speciation of Mo in fresh ALLMR water is same as in OLSR and the figure is thus omitted. Table Mo-1. Speciation reactions and their equilibrium constants of molybdenum (ANDRA 2009).
Speciation reaction log k No MoO4
-2 = MoO4-2 0 1
H+ + MoO4-2 = HMoO4
- 4.11 2 2H+ + MoO4
-2 = H2MoO4 8.15 3

39
Figure Mo-1. Aqueous speciation of molybdenum (5.0·10-5 M) in OLSR reference water. The speciation reactions are taken from Table Mo-1. The contribution of individual Mo (VII) species are shown by curves: (1)MoO4
-2 ; (2)HMoO4- ;
(3) H2MoO4. The modeled curves were calculated by PHREEQC and ThermoChimie database (Parkhurts & Appelo 1999, ANDRA 2009). 3.4.3 Modeling sorption of Mo on kaolinite The modeling of the sorption results was done with PHREEQC (Parkhurst & Appelo 2003) program using ThermoChimie (ANDRA 2009) data base. The only sorbing species of molybdenum were HMoO4
- and MoO42- , which gave the same sorbed
species. Table 2-4 (Chapter 2) presents the properties of the kaolinite KGa-1b. The sorption reactions and their parameters are described in Table Mo-2. Figures Mo-2 and Mo-3 present the modeling results. The sorption of molybdenum on kaolinite KGa-1b decreases as the pH increases like in the experiments with illite IMt-1. First the parameters were fitted to the experimental results of the saline OLSR reference water. The same parameters were used for the fresh ALLMR water. The trend of experimental points was fitted better in the case of ALLMR than OLSR water. Table Mo-2. The sorption reactions and log k values for the sorption of Mo on kaolinite KGa-1b in reference waters.
Surface complexation reactions log k No X_sOH + MoO4
-2 + H+ = X_sOH2MoO4- 12.0 1
X_sOH + HMoO4- = X_sOH2MoO4
- 8.0 2
1
2
31.E-18
1.E-16
1.E-14
1.E-12
1.E-10
6 7 8 9 10
m (m
ol/k
gw)
pH
Mo speciation in OLSR

40
Figure Mo-2. Sorption of molybdenum on kaolinite in OLSR reference water. The contribution of individual Mo (VII) surface species are shown by curves: (1) X_sOH2MoO4
- ; (2) X_sOH2MoO4-. The modeled curves were calculated by
PHREEQC and ThermoChimie database (Parkhurst & Appelo 1999, ANDRA 2009). The parameters are given in Table Mo-2.
Figure Mo-3. Sorption of molybdenum on kaolinite in ALLMR reference water. The contribution of individual Mo (VII) surface species are shown by curves: (1) X_sOH2MoO4
- ; (2) X_sOH2MoO4-. The modeled curves were calculated by
PHREEQC and ThermoChimie database (Parkhurst & Appelo 1999, ANDRA 2009). The parameters are given in Table Mo-2.
1+2
1.E-10
1.E-08
1.E-06
1.E-04
1.E-02
1.E+00
6 7 8 9 10
Rd
(m3/
kg)
pH
Mo kaolinite KGa-1b in OLSR
1+2
1.E-10
1.E-08
1.E-06
1.E-04
1.E-02
1.E+00
6 7 8 9 10
Rd
(m3/
kg)
pH
Mo kaolinite KGa-1b in ALLMR

41
3.4.4 Modeling sorption of Mo on illite The modeling of the sorption results was done with PHREEQC (Parkhurst & Appelo 1999) program using ThermoChimie (ANDRA 2009) data base. The only sorbing species of molybdenum were HMoO4
- and MoO42- , which gave the same sorbed
species. Table 2-4 (Chapter 2) presents the surface properties and the hydrolyzing reactions of the illite IMt-1. The sorption reactions and their parameters are described in Table Mo-3. Figures Mo-4 and Mo-5 present the modeling results. The sorption of molybdenum decreases as the pH increases. The model shows a more steeper curve than the experimental values. The parameters were first fitted to the experimental values of saline OLSR water. Then the same parameters were used in the modeling of the fresh ALLMR water. In the case of ALLMR the model curve is above the experimental points. The trend is same in both cases. Table Mo-3. The sorption reactions and log k values for the sorption of Mo on illite IMt-1 in reference waters.
Surface complexation reactions log k X_sOH + MoO4
-2 + H+ = X_sOH2MoO4- 12.0
X_sOH + HMoO4- = X_sOH2MoO4
- 11.0
Figure Mo-4. Sorption of molybdenum on illite in OLSR reference water. The contribution of individual Mo (VII) surface species are shown by curves: (1) X_sOH2MoO4
- ; (2) X_sOH2MoO4-. The modeled curves were calculated by
PHREEQC and ThermoChimie database (Parkhurst & Appelo 1999, ANDRA 2009). The parameters are given in Table Mo-3.
1+2
1.E-10
1.E-08
1.E-06
1.E-04
1.E-02
1.E+00
6 7 8 9 10
Rd
(m3/
kg)
pH
Mo illite IMt-1 in OLSR

42
Figure Mo-5. Sorption of molybdenum on illite in ALLMR reference water. The contribution of individual Mo (VII) surface species are shown by curves: (1) X_sOH2MoO4
- ; (2) X_sOH2MoO4-. The modeled curves were calculated by
PHREEQC and ThermoChimie database (Parkhurst & Appelo 1999, ANDRA 2009). The parameters are given in Table Mo-3.
REFERENCES ANDRA 2009. ThermoChimie Version 7b, C.RP.ASTR.O4.0032. Bradbury M.H. & Baeyens B., 2009. Sorption modelling on illite Part I: Titration measurements and the sorption of Ni, Co, Eu and Sn, Geochim. Cosmochim. Acta 73. Brendler, V. 2006 RES3T - The Rossendorf Expert System for Surface and Sorption Thermodynamics. Version 2 beta. FZ Rossendorf, Germany. Hakanen, M., Ervanne, H., Puukko, E. 2012. Far-field geochemical database for the Olkiluoto site: Distribution coefficients for sorption of Radionuclides in the Olkiluoto geosphere. Posiva Working report 2012-XX. Parkhurst, D.L. & Appelo, C.A.J. 1999. User's guide to PHREEQC (Version 2) - A computer program for speciation, batch reaction, one-dimensional transport, and inverse geochemical calculations. U.S. Geological Survey Water-Resources Investigations. Report 99-4259. Perrin, D.D. & Dempsey, B. 1974. Buffers for pH and metal ion control, Chapman & Hall, London.
1+2
1.E-10
1.E-08
1.E-06
1.E-04
1.E-02
1.E+00
6 7 8 9 10
Rd
(m3/
kg)
pH
Mo illite IMt-1 in ALLMR

43
3.5 TIN 3.5.1 Experimental description The sorption experiments of tin on kaolinite KGa-1b and illite IMt-1 were performed in fresh ALLMR reference water. Organic buffers of MES, MOPS, TRIS and CHES were used to buffer the solutions. The buffer concentration was 1·10-3 M and pH was adjusted with 0.1 M HCl or NaOH (Merck, Titrisol) according to Perrin & Dempsey (1974). The solid to liquid ratio S:L was 1 g/L. All experiments were carried out under Ar atmosphere at room temperature (Hakanen et al. 2012). 3.5.2 Speciation of Tin Speciation of tin in ALLMR reference water was modeled by PHREEQC using ThermoChimie database (Parkhurst & Appelo 1999, ANDRA 2009). The speciation reactions and their equilibrium constants used are listed in Table Sn-1. Figure Sn-1 presents the speciation of tin. Table Sn-1. Speciation reactions and their equilibrium constants of tin (ANDRA 2009).
Speciation reaction log k No Sn+4 + 4OH- = Sn(OH)4 -0.49 1 Sn+4 + 5OH- = Sn(OH)5
- -8.46 2 Sn+4 + 6OH- = Sn(OH)6
-2 -18.88 3
Figure Sn-1. Aqueous speciation of tin (8.0·10-7 M) in ALLMR reference water. The speciation reactions are taken from Table Sn-1. The contribution of individual Sn (IV) species are shown by curves: (1) Sn(OH)4 ; (2) Sn(OH)5
- ; (3) Sn(OH)6-2. The
modeled curves were calculated by PHREEQC and ThermoChimie database (Parkhurts & Appelo 1999, ANDRA 2009).
1
2
3
1.E-15
1.E-13
1.E-11
1.E-09
1.E-07
1.E-05
1.E-03
4 5 6 7 8 9 10
m (m
ol/L
)
pH
Speciation of tin in ALLMR
44
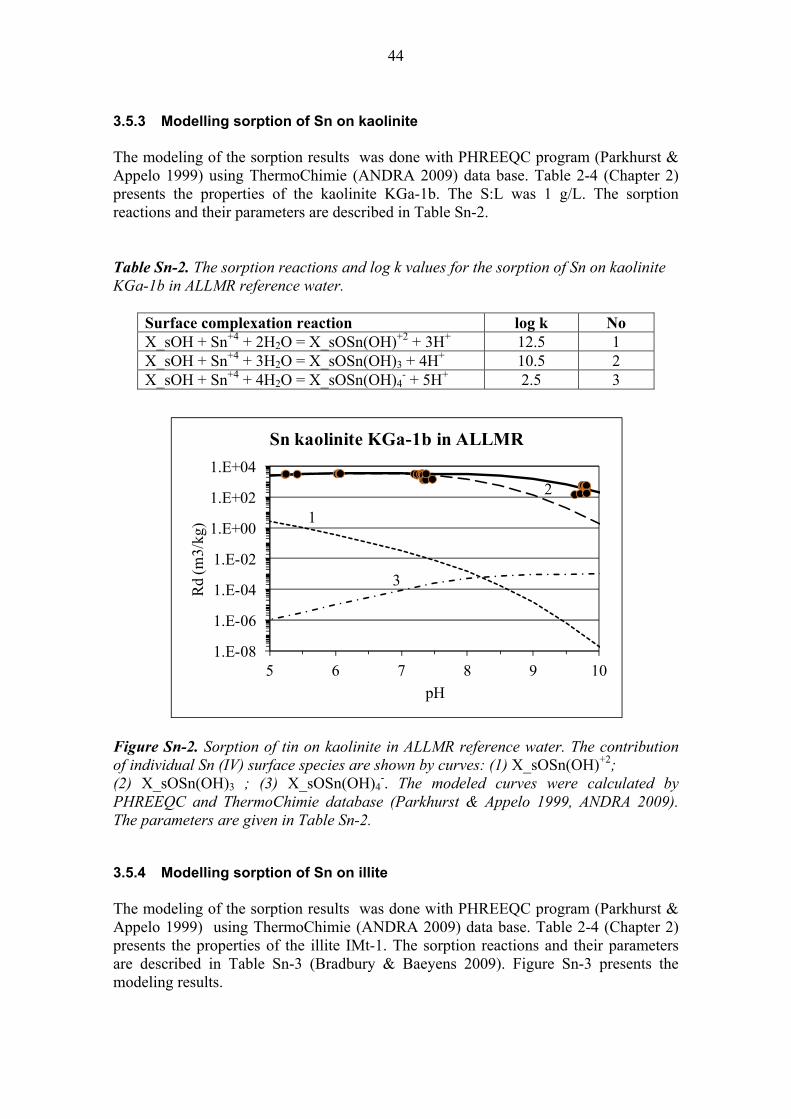
3.5.3 Modelling sorption of Sn on kaolinite The modeling of the sorption results was done with PHREEQC program (Parkhurst & Appelo 1999) using ThermoChimie (ANDRA 2009) data base. Table 2-4 (Chapter 2) presents the properties of the kaolinite KGa-1b. The S:L was 1 g/L. The sorption reactions and their parameters are described in Table Sn-2. Table Sn-2. The sorption reactions and log k values for the sorption of Sn on kaolinite KGa-1b in ALLMR reference water.
Surface complexation reaction log k No X_sOH + Sn+4 + 2H2O = X_sOSn(OH)+2 + 3H+ 12.5 1 X_sOH + Sn+4 + 3H2O = X_sOSn(OH)3 + 4H+ 10.5 2 X_sOH + Sn+4 + 4H2O = X_sOSn(OH)4
- + 5H+ 2.5 3
Figure Sn-2. Sorption of tin on kaolinite in ALLMR reference water. The contribution of individual Sn (IV) surface species are shown by curves: (1) X_sOSn(OH)+2; (2) X_sOSn(OH)3 ; (3) X_sOSn(OH)4
-. The modeled curves were calculated by PHREEQC and ThermoChimie database (Parkhurst & Appelo 1999, ANDRA 2009). The parameters are given in Table Sn-2. 3.5.4 Modelling sorption of Sn on illite The modeling of the sorption results was done with PHREEQC program (Parkhurst & Appelo 1999) using ThermoChimie (ANDRA 2009) data base. Table 2-4 (Chapter 2) presents the properties of the illite IMt-1. The sorption reactions and their parameters are described in Table Sn-3 (Bradbury & Baeyens 2009). Figure Sn-3 presents the modeling results.
1
2
3
1.E-08
1.E-06
1.E-04
1.E-02
1.E+00
1.E+02
1.E+04
5 6 7 8 9 10
Rd
(m3/
kg)
pH
Sn kaolinite KGa-1b in ALLMR
45
Table Sn-3. The sorption reactions and log k values for the sorption of Sn on illite IMt-1 in ALLMR reference water.
Surface complexation reaction log k No X_sOH + Sn+4 + 2H2O = X_sOSn(OH)+2 + 3H+ 12.5 1 X_sOH + Sn+4 + 3H2O = X_sOSn(OH)3 + 4H+ 7.0 2 X_sOH + Sn+4 + 4H2O = X_sOSn(OH)4
- + 5H+ 5.5 3
Figure Sn-3. Sorption of tin on illite in ALLMR reference water. The contribution of individual Sn (IV) surface species are shown by curves: (1) X_sOSn(OH)+2; (2) X_sOSn(OH)3 ; (3) X_sOSn(OH)4
-. The modeled curves were calculated by PHREEQC and ThermoChimie database (Parkhurst & Appelo 1999, ANDRA 2009). The parameters are given in Table Sn-3.
REFERENCES ANDRA 2009. ThermoChimie Version 7b, C.RP.ASTR.O4.0032.
Bradbury M.H. & Baeyens B. 2009. Sorption modelling on illite Part I: Titration measurements and the sorption of Ni, Co, Eu and Sn, Geochim. Cosmochim. Acta 73.
Hakanen, M., Ervanne, H., Puukko, E. 2012. Far-field geochemical database for the Olkiluoto site: Distribution coefficients for sorption of Radionuclides in the Olkiluoto geosphere. Posiva Working report 2012-XX.
Parkhurst, D.L. & Appelo, C.A.J. 1999. User's guide to PHREEQC (Version 2) - A computer program for speciation, batch reaction, one-dimensional transport, and inverse geochemical calculations. U.S. Geological Survey Water-Resources Investigations. Report 99-4259.
Perrin, D.D. & Dempsey, B. 1974. Buffers for pH and metal ion control, Chapman & Hall, London.
12
3
1.E-08
1.E-06
1.E-04
1.E-02
1.E+00
1.E+02
1.E+04
7 8 9 10
Rd
(m3/
kg)
pH
Sn illite IMt-1 in ALLMR

46
3.6 EUROPIUM
3.6.1 Experimental description The experimental data were from sorption of europium on kaolinite KGa-1b in 0.05 M, 0.1 M and 0.5 M NaNO3 solutions (Puukko & Hakanen, 2004). The solid to liquid ratio S:L was 2 g/L. The experiments were made in a glove box under argon atmosphere to minimize the effects of carbon dioxide on the experimental conditions. 3.6.2 Speciation of Europium The speciation of europium in 0.05 M, 0.1 M and 0.5 M NaNO3 solutions was modeled by PHREEQC using ThermoChimie database (Parkhurst & Appelo 1999, ANDRA 2009). The speciation reactions and their equilibrium constants used are listed in Table Eu-1. Figures Eu-1, Eu-2 and Eu-3 present the speciation of Eu. Table Eu-1. Speciation reactions and their equilibrium constants of europium (ANDRA 2009).
Speciation reaction log k No Eu+3 = Eu+3 0 1 Eu+3 + OH- = Eu(OH)+2 -7.8 2 Eu+3 + 2OH- = Eu(OH)2
+ -26.2 3 Eu+3 + 3OH- = Eu(OH)3 -15.7 4 Eu+3 + NO3
- = Eu(NO3)+2 0.8 5
Figure Eu-1. Aqueous speciation of europium (1.0·10-8M) in 0.05 M NaNO3 solution. The speciation reactions are taken from Table Eu-1. The contribution of individual Eu (III) species are shown by curves: (1) Eu+3 ; (2) Eu(OH)+2 ; (3) Eu(OH)2
+ ; (4) Eu(OH)3 ; (5) Eu(NO3)
+2. The modeled curves were calculated by PHREEQC and ThermoChimie database (Parkhurts & Appelo 1999, ANDRA 2009).
1
2 3 4
5
1.E-14
1.E-13
1.E-12
1.E-11
1.E-10
1.E-09
1.E-08
1.E-07
1.E-06
3 4 5 6 7 8 9
m (m
ol/k
gw)
pH
Eu speciation in 0.05 M NaNO3

47
Figure Eu-2. Aqueous speciation of europium (1.0·10-8M) in 0.1 M NaNO3 solution. The speciation reactions are taken from Table Eu-1. The contribution of individual Eu (III) species are shown by curves: (1) Eu+3 ; (2) Eu(OH)+2 ; (3) Eu(OH)2
+ ; (4) Eu(OH)3 ; (5) Eu(NO3)
+2. The modeled curves were calculated by PHREEQC and ThermoChimie database (Parkhurts & Appelo 1999, ANDRA 2009).
Figure Eu-3. Aqueous speciation of europium (1.0·10-8M) in 0.5 M NaNO3 solution. The speciation reactions are taken from Table Eu-1. The contribution of individual Eu (III) species are shown by curves: (1) Eu+3 ; (2) Eu(OH)+2 ; (3) Eu(OH)2
+ ; (4) Eu(OH)3 ; (5) Eu(NO3)
+2. The modeled curves were calculated by PHREEQC and ThermoChimie database (Parkhurts & Appelo 1999, ANDRA 2009).
1
2 3 4
5
1.E-14
1.E-13
1.E-12
1.E-11
1.E-10
1.E-09
1.E-08
1.E-07
1.E-06
3 4 5 6 7 8 9
m (m
ol/k
gw)
pH
Eu speciation in 0.1 M NaNO3
1
2 3 4
5
1.E-14
1.E-13
1.E-12
1.E-11
1.E-10
1.E-09
1.E-08
1.E-07
1.E-06
3 4 5 6 7 8 9
m (m
ol/k
gw)
pH
Eu speciation in 0.5 M NaNO3

48
3.6.3 Modelling sorption of Eu on kaolinite The modeling of the sorption results was done with PHREEQC (Parkhurst & Appelo 1999) program using ThermoChimie (ANDRA 2009) data base. Table 2-4 (Chapter 2) presents the properties of the kaolinite KGa-1b. The parameters for sorption model were adjusted using the data from the highest ionic strength 0.5 M NaNO3. For the two lower ionic strengths 0.1 M and 0.05 M the parameters had to be readjusted in order fit the experimental results. The sorption reactions and the corresponding log k values are presented in Table Eu-2. Table Eu-2. The sorption reactions and log k values for the sorption of Eu on kaolinite KGa-1b.
log k Ion exchange reaction 0.5 M 0.1 M 0.05 M No Na+ + Z- = NaZ 0 0 0 Z- + H+ = HZ 0 0 0 3Z- + Eu+3 = EuZ3 4.0 2.5 2.0 1 Surface complexation reactions 0.5 M 0.1 M 0.05 M No X_sOH + Eu+3 = X_sOEu+2 + H+ 0.5 0.5 1.3 2 X_sOH + Eu+3 + H2O = X_sOEu(OH)+ + 2H+ -7.0 -7.0 -6.5 3 X_sOH + Eu+3 + 2H2O = X_sOEu(OH)2 + 3H+ -20.0 -20.0 -18.0 4
Figure Eu-4. Sorption of europium on kaolinite in 0.5 M NaNO3 solution. The contribution of individual Eu (III) surface species are shown by curves: (1) EuZ3 ; (2) X_sOEu+2 ; (3) X_sOEu(OH)+ ; (4) X_sOEu(OH)2. The modeled curves were calculated by PHREEQC and ThermoChimie database (Parkhurst & Appelo 1999, ANDRA 2009). The parameters are given in Table Eu-2.
1
2
34
1.E-04
1.E-03
1.E-02
1.E-01
1.E+00
1.E+01
1.E+02
1.E+03
1.E+04
2 4 6 8 10
Rd
(m3/
kg)
pH
Eu kaolinite KGa-1b in 0.5 M NaNO3

49
Figure Eu-5. Sorption of europium on kaolinite in 0.1 M NaNO3 solution. The contribution of individual Eu (III) surface species are shown by curves: (1) EuZ3 ; (2) X_sOEu+2 ; (3) X_sOEu(OH)+ ; (4) X_sOEu(OH)2. The modeled curves were calculated by PHREEQC and ThermoChimie database (Parkhurst & Appelo 1999, ANDRA 2009). The parameters are given in Table Eu-2.
Figure Eu-6. Sorption of europium on kaolinite in 0.05 M NaNO3 solution. The contribution of individual Eu (III) surface species are shown by curves: (1) EuZ3 ; (2) X_sOEu+2 ; (3) X_sOEu(OH)+ ; (4) X_sOEu(OH)2. The modeled curves were calculated by PHREEQC and ThermoChimie database (Parkhurst & Appelo 1999, ANDRA 2009). The parameters are given in Table Eu-2.
1
2
3
4
1.E-04
1.E-03
1.E-02
1.E-01
1.E+00
1.E+01
1.E+02
1.E+03
1.E+04
2 4 6 8 10
Rd
(m3/
kg)
pH
Eu kaolinite KGa-1b in 0.1 M NaNO3
1
2
3 4
1.E-04
1.E-03
1.E-02
1.E-01
1.E+00
1.E+01
1.E+02
1.E+03
1.E+04
2 4 6 8 10
Rd
(m3/
kg)
pH
Eu kaolinite KGa-1b in 0.05 M NaNO3

50
REFERENCES ANDRA 2009. ThermoChimie Version 7b, C.RP.ASTR.O4.0032. Parkhurst, D.L. & Appelo, C.A.J. 1999. User's guide to PHREEQC (Version 2) - A computer program for speciation, batch reaction, one-dimensional transport, and inverse geochemical calculations. U.S. Geological Survey Water-Resources Investigations. Report 99-4259. Puukko E. & Hakanen M. 2004. Sorption of europium on Kaolinite KGa-1b. Posiva Working Report 2004-59, Posiva Oy, Olkiluoto, Finland.

51
3.7 PROTACTINIUM 3.7.1 Experimental description The sorption of protactinium on kaolinite KGa-1b and illite IMt-1 was studied in reference waters. They represented fresh slightly reducing granitic groundwater (ALLMR) and saline reducing groundwater (OLSR). Organic buffers of MES, MOPS, TRIS and CHES (Table 3) were used to buffer the solutions. The buffer concentration was 1·10-3 M and pH was adjusted with 0.1 M HCl or NaOH (Merck, Titrisol) according to Perrin & Dempsey (1974). All experiments were carried out under argon atmosphere at room temperature. The tracer isotope was Pa-233 (T1/2= 24 d), which was separated from Np-237 by solvent extraction. The Pa-233 is in a radioactive equilibrium with the Np-237. The calculated maximum concentration of Pa in the sample solutions was 4 · 10-11 M. 3.7.2 Speciation of Protactinium The knowledge of complexation chemistry of protactinium in groundwaters in literature is scarse. Pa(V) is assumed to be the oxidation state in bedrock conditions. According to the present knowledge, the chemistry is dominated by the hydrolysis reactions of Pa(V) (Hakanen et al., 2012). Speciation of protactinium in reference waters ALLMR and OLSR was calculated by PHREEQC using ThermoChimie database (Parkhurst & Appelo 1999, ANDRA 2009). The speciation reactions and their equilibrium constants used are listed in Table Pa-1. Figures Pa-1 and Pa-2 present the speciation of Pa in ALLMR and OLSR waters. Table Pa-1. Speciation reactions and their equilibrium constants of protactinium (ANDRA 2009).
Speciation reaction log k No PaO2
+ = PaO2+ 0 1
PaO2+ + OH- = PaO2(OH) -7 2
PaO2+ + 2OH- = PaO2(OH)2
- -16.4 3 PaO2
+ + H+ = PaO(OH)+2 1.25 4

52
Figure Pa-1. Aqueous speciation of protactinium (4.0·10-8M) in reference water ALLMR. The speciation reactions are taken from Table Pa-1. The contribution of individual PaO2
+(V) species are shown by curves: (1) PaO2+ ; (2) PaO2(OH) ;
(3) PaO2(OH)2- ; (4) PaO(OH)+2. The modeled curves were calculated by PHREEQC
and ThermoChimie database (Parkhurts & Appelo 1999, ANDRA 2009).
Figure Pa-2. Aqueous speciation of protactinium (4.0·10-8M) in reference water OLSR. The speciation reactions are taken from Table Pa-1. The contribution of individual PaO2
+(V) species are shown by curves: (1) PaO2+ ; (2) PaO2(OH) ;
(3) PaO2(OH)2- ; (4) PaO(OH)+2. The modeled curves were calculated by PHREEQC
and ThermoChimie database (Parkhurts & Appelo 1999, ANDRA 2009).
1 2
3
41.E-16
1.E-15
1.E-14
1.E-13
1.E-12
1.E-11
1.E-10
1.E-09
1.E-08
6 7 8 9 10
m (
mol
/kgw
)
pH
Pa speciation in ALLMR
1 2
3
41.E-16
1.E-15
1.E-14
1.E-13
1.E-12
1.E-11
1.E-10
1.E-09
1.E-08
6 7 8 9 10
m (
mol
/kgw
)
pH
Pa speciation in OLSR

53
3.7.3 Modeling sorption on kaolinite The modeling of the sorption results was done with PHREEQC program (Parkhurst & Appelo 1999) using ThermoChimie (ANDRA 2009) data base. The experimental results were from the Posiva report (Hakanen et al., 2012). Table 2-4 (Chapter 2) presents the surface properties and the hydrolyzing reactions of the kaolinite KGa-1b. The sorption reactions and their parameters are described in Table Pa-2. First the parameters were adjusted for the saline OLSR reference water. Then the fresh ALLMR water was modeled using the same parameters. All the experimental results of sorption of Pa in ALLMR water were below the detection limit. The modeled sorption curve is below the experimental results. The parameters were not readjusted for ALLMR for this reason. Figures Pa-3 and Pa-4 present the modeling results. Table Pa-2. The sorption reactions and log k values for the sorption of Pa on kaolinite KGa-1b in reference waters.
Surface complexation reactions log k No X_sOH + PaO(OH)+2 = X_sOPaO2 + 2H+ 0.5 1 X_sOH + PaO(OH)+2 = X_sOPaO(OH)+ + H+ 7.5 2 X_sOH + PaO(OH)+2 + H2O = X_sOPaO2(OH)- + 3H+ -10.0 3
Figure Pa-3. Sorption of protactinium on kaolinite in OLSR reference water. The contribution of individual Pa surface species are shown by curves: (1) X_sOPaO2 ; (2) X_sOPaO(OH)+ ; (3) X_sOPaO2(OH)-. The modeled curves were calculated by PHREEQC and ThermoChimie database (Parkhurst & Appelo 1999, ANDRA 2009). The parameters are given in Table Pa-2.
1 2
3
1.E-05
1.E-04
1.E-03
1.E-02
1.E-01
1.E+00
1.E+01
1.E+02
1.E+03
6 7 8 9 10
Rd
(m3/
kg)
pH
Pa kaolinite KGa-1b in OLSR

54
Figure Pa-4. Sorption of protactinium on kaolinite in ALLMR reference water. The contribution of individual Pa surface species are shown by curves: (1) X_sOPaO2 ; (2) X_sOPaO(OH)+ ; (3) X_sOPaO2(OH)-. The modeled curves were calculated by PHREEQC and ThermoChimie database (Parkhurst & Appelo 1999, ANDRA 2009). The parameters are given in Table Pa-2. 3.7.4 Modeling sorption of Pa on illite The modeling of the sorption results was done with PHREEQC program (Parkhurst & Appelo 1999) using ThermoChimie (ANDRA 2009) data base. Table 2-4 (Chapter 2) presents the surface properties and the hydrolyzing reactions of the illite IMt-1. The sorption reactions and their parameters are described in Table Pa-3. Figures Pa-5 and Pa-6 present the modeling results. The parameters were at first adjusted for the saline OLSR water. Then the ALLMR water was modeled using the same parameters. The calculated points were below the experimental points at pH 9-10 in OLSR water. A better fit to the experimental points was achieved in ALLMR than in OLSR. Table Pa-3. The sorption reactions and log k values for the sorption of Pa on illite IMt-1 in reference waters.
Surface complexation reactions log k No X_sOH + PaO(OH)+2 = X_sOPaO2 + 2H+ 1.5 1 X_sOH + PaO(OH)+2 = X_sOPaO(OH)+ + H+ 10.0 2 X_sOH + PaO(OH)+2 + H2O = X_sOPaO2(OH)- + 3H+ -4.5 3
12
3
1.E-05
1.E-04
1.E-03
1.E-02
1.E-01
1.E+00
1.E+01
1.E+02
1.E+03
6 7 8 9 10
Rd
(m3/
kg)
pH
Pa kaolinite KGa-1b in ALLMR

55
Figure Pa-5. Sorption of protactinium on illite in OLSR reference water. The contribution of individual Pa surface species are shown by curves: (1) X_sOPaO2 ; (2) X_sOPaO(OH)+ ; (3) X_sOPaO2(OH)-. The modeled curves were calculated by PHREEQC and ThermoChimie database (Parkhurst & Appelo 1999, ANDRA 2009). The parameters are given in Table Pa-3.
Figure Pa-6. Sorption of protactinium on illite in ALLMR reference water. The contribution of individual Pa surface species are shown by curves: (1) X_sOPaO2 ; (2) X_sOPaO(OH)+ ; (3) X_sOPaO2(OH)-. The modeled curves were calculated by PHREEQC and ThermoChimie database (Parkhurst & Appelo 1999, ANDRA 2009). The parameters are given in Table Pa-3.
1 2
3
1.E-05
1.E-04
1.E-03
1.E-02
1.E-01
1.E+00
1.E+01
1.E+02
1.E+03
6 7 8 9 10
Rd
(m3/
kg)
pH
Pa illite IMt-1 in OLSR
1 2
3
1.E-05
1.E-04
1.E-03
1.E-02
1.E-01
1.E+00
1.E+01
1.E+02
1.E+03
6 7 8 9 10
Rd
(m3/
kg)
pH
Pa illite IMt-1 in ALLMR

56
REFERENCES ANDRA 2009. ThermoChimie Version 7b, C.RP.ASTR.O4.0032. Hakanen, M., Ervanne, H., Puukko, E. 2012. Far-field geochemical database for the Olkiluoto site: Distribution coefficients for sorption of Radionuclides in the Olkiluoto geosphere. Posiva Working report 2012-XX. Parkhurst, D.L. & Appelo, C.A.J. 1999. User's guide to PHREEQC (Version 2) - A computer program for speciation, batch reaction, one-dimensional transport, and inverse geochemical calculations. U.S. Geological Survey Water-Resources Investigations. Report 99-4259. Perrin, D.D. & Dempsey, B. 1974. Buffers for pH and metal ion control, Chapman & Hall, London.

57
3.8 THORIUM
3.8.1 Experimental description The sorption experiments were performed by a batch sorption method (Hakanen et al. 2012). The used minerals were illite IMt-1 and kaolinite KGa-1b (see Chapter 2.1). In the experiments, synthetic reference groundwater solutions (OLSR, ALLMR, OLBA, OLGA) were used (see Chapter 2.2). The pH was measured using an Aquapro combination glass electrode. In calibration pH buffer solutions 4, 7 and 10 were used. The experiments were run inside the anaerobic glove-box to prevent the interference of atmospheric carbon dioxide as well, especially in the alkaline solutions (see Chapter 2.3). The radioactive tracer used was 234Th (T1/2 = 24.2d) with 232Th carrier. The radioactivity was assayed through Cerenkov radiation by LSC Quantulus 1220. The tracer concentration was based on speciation and dissolution calculations by PHREEQC using ThermoChimie database so as not to exceed the solubility of the element and avoid tracer precipitation before the experiment (Parkhurst & Appelo 1999, ANDRA 2009). The thorium concentration was 10-10 M in all waters. Mineral samples were immersed in water for one day before adding the tracer to condition the solid material with the solution (0.01:20 g/mL). After The tracer addition, the pH was adjusted using diluted carbonate-free HCl or NaOH solutions when necessary. The samples were stored in an end-over-end rotator during the experiment. The contact time was three days. After completing the experiment, the pH was measured. The solid material was separated by centrifugation and filtration. An aliquot for the radioactivity measurement was taken and the mass distribution coefficient Rd (m3/kg) was determined. 3.8.2 Speciation of Thorium Thorium speciation in waters was modeled by PHREEQC using ThermoChimie database (Parkhurts & Appelo 1999, ANDRA 2009). The speciation reactions and their equilibrium constants used are listed in Table Th-1. At higher pH, the carbonate concentration in the calculation was limited by allowing the precipitation of calcite. Speciation modeling gave Th(OH)4
0 as the main thorium species Th(OH)40 for all
waters (Figure Th-1-4). In OLSR, the contribution of other thorium hydroxo complexes decreases with increasing pH. The contribution of Th(OH)3
+ and Th(OH)2+2 species is
relevant at pH <7. In other waters, the concentration of hydroxo species is smaller than in OLSR while the concentration of thorium hydroxo carbonato species such as Th(OH)(CO3)2
-2 and Th(OH)3(CO3)- is higher. In OLBA and OLGA in the acid pH, the
contribution of thorium sulphate complexes increases with decreasing pH.

58
Table Th-1. Speciation reactions and their equilibrium constants of thorium (ANDRA 2009). Speciation reaction log k No Th+4 + 4H2O = Th(OH)4 + 4H+ -17.50 1 Th+4 + 3H2O = Th(OH)3
+ + 3H+ -11.00 2 Th+4 + 2H2O = Th(OH)2
+2 + 2H+ -6.00 3 Th+4 + H2O = Th(OH)+3 + H+ -2.20 4 Th+4 + 2F- = ThF2
+2 13.36 5 Th+4 + F- = ThF+3 7.64 6 Th+4 + 3F- = ThF3
+ 17.54 7 Th+4 + CO3
-2 + 2H2O = Th(OH)2(CO3) + 2H+ 2.7 8 Th+4 + CO3
-2 + 3H2O = Th(OH)3(CO3)- + 3H+ -3.5 9
Th+4 + 2CO3-2 + 2H2O = Th(OH)3(CO3)2
-2 + 2H+ 9.0 10 Th+4 + CO3
-2 + 4H2O = Th(OH)4(CO3)-2 + 4H+ -15.4 11
Th+4 + SO4-2 = Th(SO4)
+2 7.89 13 Th+4 + 2SO4
-2 = Th(SO4)2 11.82 14 Th+4 + CO3
-2 + H2O = Th(OH)(CO3)4-5+H+ 21.8 12
Figure Th-1. Aqueous speciation of thorium (10-10M) in OLSR reference water. The speciation reactions are taken from Table Th-1. The contribution of individual Th species are shown by curves: (1) Th(OH)4; (2) Th(OH)3
+; (3) Th(OH)2+2; (4) Th(OH)+3;
(5) ThF2+2; (6) ThF+3; (7) ThF3
+. The modeled curves were calculated by PHREEQC and ThermoChimie database (Parkhurst & Appelo 1999, ANDRA 2009).
59
Figure Th-2. Aqueous speciation of niobium (10-10M) in ALLMR reference water. The speciation reactions are taken from Table Th-1. The contribution of individual Th species are shown by curves: (1) Th(OH)4; (2) Th(OH)3
+; (3) Th(OH)2+2; (4) Th(OH)+3;
(8) Th(OH)2(CO3); (9) Th(OH)3(CO3)-; (10) Th(OH)2(CO3)2
-2; (11) Th(OH)4(CO3)-2;
(12) Th(OH)(CO3)4-5. The modeled curves were calculated by PHREEQC and
ThermoChimie database (Parkhurst & Appelo 1999, ANDRA 2009).
Figure Th-3. Aqueous speciation of thorium (10-10M) in OLBA reference water. The speciation reactions are taken from Table Th-1. The contribution of individual Th species are shown by curves: (1) Th(OH)4; (2) Th(OH)3
+; (8) Th(OH)2(CO3); (9) Th(OH)3(CO3)
-; (13) Th(SO4)+2; (14) Th(SO4)2. The modeled curves were calculated by
PHREEQC and ThermoChimie database (Parkhurst & Appelo 1999, ANDRA 2009).
60
Figure Th-4. Aqueous speciation of thorium (10-10M) in OLGA reference water. The speciation reactions are taken from Table Th-1. The contribution of individual Th species are shown by curves: (1) Th(OH)4; (2) Th(OH)3
+; (3) Th(OH)2+2; (4) Th(OH)+3;
(8) Th(OH)2(CO3); (9) Th(OH)3(CO3)-; (10) Th(OH)2(CO3)2
-2; (11) Th(OH)4(CO3)-2;
(12) Th(SO4)+2. The modeled curves were calculated by PHREEQC and ThermoChimie
database (Parkhurst & Appelo 1999, ANDRA 2009). 3.8.3 Modeling sorption of Th on kaolinite The parameter data for surface sites and their densities were obtained from RES3T database (Brendler 2006) and converted to correspond the used site density (see Chapter 2.4). The non-electrostatic diffuse layer model was chosen to describe the sorption behavior of thorium. The modeling was started from thorium surface reactions 1 to 3 in Table Th-2 and was first applied to OLSR (Figure Th-5). The other surface species X_ sOTh(OH)2
+ and X_ sOTh(OH)(CO3)2
-2 were tried but they did not necessary to produce better fit. These reactions are reported by Bradbury and Baeyens (2011). They also reported other surface species, X_sOTh+3 and X_sThOH+2, but these species are relevant only at more acid conditions than considered here. For OLSR, water which did not contain carbonato species, the reactions 1 to 3 where relevant. For other waters it was necessary to fit thorium hydroxo carbonato species. The parameters and surface species of best fit from OLSR were applied to other waters (Figures Th-6-8).

61
Table Th-2. Surface reactions and their equilibrium constants of thorium for kaolinite in reference waters. Surface reaction log k No X_sOH + Th+4 + 2H2O = X_ sOTh(OH)2
+ + 3H+ -4.5 1 X_sOH + Th+4 + 3H2O = X_ sOTh(OH)3
0 + 4H+ -9.8 2 X_sOH + Th+4 + 4H2O = X_ sOTh(OH)4
- + 5H+ -17.8 3 X_sOH + Th+4 + CO3
-2 + 2H2O = X_ sOTh(OH)2(CO3)- + 3H+ 5.1 4
Figure Th-5. Sorption of thorium on kaolinite in OLSR reference water. The contribution of individual Th surface species are shown by curves: (1) X_sOTh(OH)2
+; (2) X_sOTh(OH)3; (3) X_sOTh(OH)4
-. The modeled curves were calculated by PHREEQC and ThermoChimie database (Parkhurst & Appelo 1999, ANDRA 2009). The parameters are given in Table Th-2.
1
2
3
1E-4
1E-3
1E-2
1E-1
1E+0
1E+1
1E+2
1E+3
1E+4
6 7 8 9 10 11
Rd(
m3 /
kg)
pH
Th kaolinite in OLSR

62
Figure Th-6. Sorption of thorium on kaolinite in ALLMR reference water. The contribution of individual Th surface species are shown by curves: (1) X_sOTh(OH)2
+; (2) X_sOTh(OH)3; (3) X_sOTh(OH)4
-; (4) X_sOTh(OH)2(CO3)-. The modeled curves
were calculated by PHREEQC and ThermoChimie database (Parkhurst & Appelo 1999, ANDRA 2009). The parameters are given in Table Th-2.
Figure Th-7. Sorption of thorium on kaolinite in OLBA reference water. The contribution of individual Th surface species are shown by curves: (1) X_sOTh(OH)2
+; (2) X_sOTh(OH)3; (3) X_sOTh(OH)4
-; (4) X_sOTh(OH)2(CO3)-. The modeled curves
were calculated by PHREEQC and ThermoChimie database (Parkhurst & Appelo 1999, ANDRA 2009). The parameters are given in Table Th-2.
1
2
3
4
1E-4
1E-3
1E-2
1E-1
1E+0
1E+1
1E+2
1E+3
1E+4
6 7 8 9 10 11
Rd(
m3 /
kg)
pH
Th kaolinite in ALLMR
2
3
1
4
1E-4
1E-3
1E-2
1E-1
1E+0
1E+1
1E+2
1E+3
1E+4
6 7 8 9 10 11
Rd(
m3 /
kg)
pH
Th kaolinite in OLBA

63
Figure Th-8. Sorption of thorium on kaolinite in OLGA reference water. The contribution of individual Th surface species are shown by curves: (1) X_sOTh(OH)2
+; (2) X_sOTh(OH)3; (3) X_sOTh(OH)4
-; (4) X_sOTh(OH)2(CO3)-. The modeled curves
were calculated by PHREEQC and ThermoChimie database (Parkhurst & Appelo 1999, ANDRA 2009). The parameters are given in Table Th-2. 3.8.4 Modeling sorption of Th on illite There are some differences between Nagra (Hummel et al. 2002) and ThermoChimie databases major being solubility constant of thorium dioxide, hydroxo carbonato species and their constants. Therefore the model parameters from Bradbury and Baeyens (2009) did not give the best fit using the ThermoChimie database. New parameters were tried for the thorium surface reactions while the basic protolysis reaction and site parameters were taken from Bradbury and Baeyens (2009) (see Chapter 2.4). The non electrostatic diffuse layer model was chosen to describe the sorption behavior of thorium. The modeling was started from thorium surface reactions obtained from modeling kaolinite and applied to OLSR. The parameters were reoptimized for illite and reasonably good fit was obtained (Figure Th-9). The obtained equilibrium constants are listed in Table Th-3. The parameters and surface species of best fit from OLSR were applied to other waters (Figures Th-10-12). The modeled results fit well except for ALLMR at the high pH.
2
31
4
1E-4
1E-3
1E-2
1E-1
1E+0
1E+1
1E+2
1E+3
1E+4
5 6 7 8 9 10 11
Rd(
m3 /
kg)
pH
Th kaolinite in OLGA

64
Table Th-3. Surface reactions and their equilibrium constants of thorium for illite in reference waters. Surface reaction log k No X_sOH + Th+4 + 2H2O = X_ sOTh(OH)2
+ + 3H+ -3.0 1 X_sOH + Th+4 + 3H2O = X_ sOTh(OH)3
0 + 4H+ -8.0 2 X_sOH + Th+4 + 4H2O = X_ sOTh(OH)4
- + 5H+ -13.4 3 X_sOH + Th+4 + CO3
-2 + 2H2O = X_ sOTh(OH)2(CO3)- + 3H+ 5.3 4
Figure Th-9. Sorption of thorium on illite in OLSR reference water. The contribution of individual Th surface species are shown by curves: (1) X_sOTh(OH)2
+; (2) X_sOTh(OH)3; (3) X_sOTh(OH)4
-. The modeled curves were calculated by PHREEQC and ThermoChimie database (Parkhurst & Appelo 1999, ANDRA 2009). The parameters are given in Table Th-3.
2
3
1
1E-4
1E-3
1E-2
1E-1
1E+0
1E+1
1E+2
1E+3
1E+4
6 7 8 9 10 11
Rd(
m3 /
kg)
pH
Th illite in OLSR

65
Figure Th-10. Sorption of thorium on illite in ALLMR reference water. The contribution of individual Th surface species are shown by curves: (1) X_sOTh(OH)2
+; (2) X_sOTh(OH)3; (3) X_sOTh(OH)4
-; (4) X_sOTh(OH)2(CO3)-. The modeled curves
were calculated by PHREEQC and ThermoChimie database (Parkhurst & Appelo 1999, ANDRA 2009). The parameters are given in Table Th-3.
Figure Th-11. Sorption of thorium on illite in OLBA reference water. The contribution of individual Th surface species are shown by curves: (1) X_sOTh(OH)2
+; (2) X_sOTh(OH)3; (3) X_sOTh(OH)4
-; (4) X_sOTh(OH)2(CO3)-. The modeled curves were
calculated by PHREEQC and ThermoChimie database (Parkhurst & Appelo 1999, ANDRA 2009). The parameters are given in Table Th-3.
2
3
1
4
1E-4
1E-3
1E-2
1E-1
1E+0
1E+1
1E+2
1E+3
1E+4
6 7 8 9 10 11
Rd(
m3 /
kg)
pH
Th illite in ALLMR
2
3
14
1E-4
1E-3
1E-2
1E-1
1E+0
1E+1
1E+2
1E+3
1E+4
6 7 8 9 10 11
Rd(
m3 /
kg)
pH
Th illite in OLBA

66
Figure Th-12. Sorption of thorium on illite in OLGA reference water. The contribution of individual Th surface species are shown by curves: (1) X_sOTh(OH)2
+; (2) X_sOTh(OH)3; (3) X_sOTh(OH)4
-; (4) X_sOTh(OH)2(CO3)-. The modeled curves were
calculated by PHREEQC and ThermoChimie database (Parkhurst & Appelo 1999, ANDRA 2009). The parameters are given in Table Th-3.
REFERENCES
ANDRA 2009. ThermoChimie Version 7b, C.RP.ASTR.O4.0032.
Bradbury, M.H. & Baeyens, B. 2009. Sorption modeling on illite. Part II actinide sorption and linear free energy relationships. Geochim. Cosmochim. Acta 73, 1004-1013.
Bradbury, M.H. & Baeyens, B. 2011. Predictive sorption modeling of Ni(II), Co(II), Eu(III), Th(IV) and U(VI) on MX-80 bentonite and Opalinus Clay: A “bottom-up”-approach. Appl. Clay Sci. 52, 27-33.
Brendler, V. 2006. RES3T – The Rossendorf Expert System for Surface and Sorption Thermodynamics. Version 2 beta. FZ Rossendorf, Germany.
Hakanen, M., Ervanne, H., Puukko, E. 2012. Far-field geochemical database for the Olkiluoto site: Distribution coefficients for sorption of Radionuclides in the Olkiluoto geosphere. Posiva Working report 2012-XX.
Hummel W., Berner U., Curti E., Pearson F.J., Thoenen T. 2002. Nagra/PSI Chemical Thermodynamic Data Base 01/01. Universal Publishers.
Parkhurst, D.L. & Appelo, C.A.J., 1999. User's guide to PHREEQC (version 2)--A computer program for speciation, batch-reaction, one-dimensional transport, and inverse geochemical calculations: U.S. Geological Survey Water-Resources Investigations Report 99-4259, 312 p.
2
3
1
4
1E-4
1E-3
1E-2
1E-1
1E+0
1E+1
1E+2
1E+3
1E+4
5 6 7 8 9 10 11
Rd(m
3/k
g)
pH
Th illite in OLGA
67
3.9 URANIUM 3.9.1 Experimental description The sorption experiments were performed by a batch sorption method (Hakanen et al. 2012). The used minerals were illite IMt-1 and kaolinite KGa-1b (see Chapter 2.1). In the experiments, synthetic reference groundwater solutions (OLSR, ALLMR) were used (see Chapter 2.2). The pH was measured using an Aquapro combination glass electrode. In calibration pH buffer solutions 4, 7 and 10 were used. The experiments were run inside the anaerobic glove-box to prevent the interference of atmospheric carbon dioxide as well, especially in the alkaline solutions (see Chapter 2.3). The radioactive tracer used was 233U (T1/2 = 1.6·105a). The radioactivity was assayed by LSC Quantulus 1220. The tracer concentration was based on speciation and dissolution calculations by PHREEQC using ThermoChimie database so as not to exceed the solubility of the element and avoid tracer precipitation before the experiment (Parkhurst & Appelo 1999, ANDRA 2009). The uranium concentration was 10-8 M in all waters. Mineral samples were immersed in water for one day before adding the tracer to condition the solid material with the solution (0.05:20 g/mL). After the tracer addition, the pH was adjusted using diluted carbonate-free HCl or NaOH solutions when necessary. The samples were stored in an end-over-end rotator during the experiment. The contact time was three days. After completing the experiment, the pH was measured. The solid material was separated by centrifugation and filtration. An aliquot for the radioactivity measurement was taken and the mass distribution coefficient Rd (m3/kg) was determined. 3.9.2 Speciation of Uranium Uranium (VI) speciation in waters was modeled by PHREEQC using ThermoChimie database (Parkhurts & Appelo 1999, ANDRA 2009). The speciation reactions and their equilibrium constants used are listed in Table U-1. The ThermoChimie database was complemented by the addition of the formation constants of U(VI) alkaline earth carbonato complexes reported by Dong & Brooks (2006, 2008). At higher pH, the carbonate concentration in the calculation was limited by allowing the precipitation of calcite. The speciation of uranium (VI) is highly affected by carbonate concentration. Modeling gave several uranium species for both waters (Figures U-1-2). For OLSR, the main species are the hydroxo complexes. In the acid waters, the contribution of uranium fluorido complexes increases with decreasing pH. In ALLMR, the major species at the neutral pH are the calcium uranyl hydroxo carbonato complexes CaUO2(CO3)3
-2and Ca2UO2(CO3)3.

68
Table U-1. Speciation reactions and their equilibrium constants of uranium. Reactions 1 to 6 are in ThermoChimie database (ANDRA 2009). Reactions 7 to 10 are from Dong and Brooks (2006, 2008). Speciation reaction log k No UO2
+2 + H2O = UO2OH+ + H+ -5.25 1
UO2+2 +F- = UO2F
+ 5.16 2 UO2
+2 + 2H2O = UO2(OH)2
0 + 2H+ -12.15 4 UO2
+2 +2F- = UO2F2 8.83 5 UO2
+2 +Cl- = UO2Cl+ 0.17 6 UO2
+2 + 3H2O = UO2(OH)3- + 3H+ -20.25 7
2UO2+2
+ 2H2O = (UO2)2(OH)2+2 + 2H+ -5.62 8
UO2+2
+ 4H2O = UO2(OH)4-2 + 4H+ -32.4 9
3UO2+2
+ 5H2O = (UO2)3(OH)5+ + 5H+ -15.55 10
UO2+2
+ CO3-2 = UO2(CO3) 9.94 11
UO2+2
+ 2CO3-2 = UO2(CO3)2
-2 16.61 12 UO2
+2 + 3CO3
-2 = UO2(CO3)3-4 21.84 13
UO2+2 +3CO3
-2 + Ca+2 = CaUO2(CO3)3-2 27.18 14
UO2+2 +3CO3
-2 +2Ca+2 = Ca2UO2(CO3)3 30.70 15 UO2
+2 +3CO3-2 +Mg+2 = MgUO2(CO3)3
-2 26.11 16 UO2
+2 +3CO3-2 +Sr+2 = SrUO2(CO3)3
-2 26.86 17
Figure U-1. Aqueous speciation of uranium (10-8M) in OLSR reference water. The speciation reactions are taken from Table U-1. The contribution of individual U(VI) species are shown by curves: (1) UO2(OH)+; (2) UO2F
+; (3) UO2+2; (4) UO2(OH)2
0; (5) UO2F2; (6) UO2Cl+; (7) UO2(OH)3
-; (8) (UO2)(OH)2+2; (9) UO2(OH)4
-2; (10) (UO2)3(OH)5
+. The modeled curves were calculated by PHREEQC and ThermoChimie database (Parkhurst & Appelo 1999, ANDRA 2009).

69
Figure U-2. Aqueous speciation of uranium (10-8M) in ALLMR reference water. The speciation reactions are taken from Table Th-1. The contribution of individual U(VI) species are shown by curves: (1) UO2(OH)+; (3) UO2
+2; (4) UO2(OH)20; (7) UO2(OH)3
-
; (8) UO2(SO4), (11) UO2(CO3); (12) UO2(CO3)2-2; (13) UO2(CO3)3
-4; (14) CaUO2(CO3)3
-2; (15) Ca2UO2(CO3)3; (16) MgUO2(CO3)3-2. The modeled curves were
calculated by PHREEQC and ThermoChimie database (Parkhurst & Appelo 1999, ANDRA 2009). 3.9.3 Modeling sorption of U on kaolinite The parameter data for surface sites and their densities were obtained from RES3T database (Brendler 2006) and converted to correspond the used sorption site density (see Chapter 2.4). The non electrostatic diffuse layer model was chosen to describe the sorption behavior of uranium. The modeling was started from uranium surface reactions 1 to 4 in Table U-2 and was first applied to OLSR (Figure U-3). These reactions are reported by Bradbury and Baeyens (2011). They also reported other surface species, X_wOUO2
+ and X_wUO2OH0, but these species did not improve the fit. In OLSR, the data point at pH 7 was low in comparison with the other values in OLSR and ALLMR. Also it was low in comparison with the values observed for illite. Therefore in the modeling, this value was not considered relevant. The parameters and surface species of best fit from OLSR were applied to ALLMR water (Figures U-4). The UO2
+2 cation exchange was not considered because the study was at the pH range 7 to 10 and its contribution is found to be negligent by Bradbury and Baeyens (2009) in their study. It could be taken account in OLGA water at pH 5.8, but this water was not selected for the experiments.
1
93
411
12
7
1314
15
16
1E-13
1E-12
1E-11
1E-10
1E-9
1E-8
1E-7
6 7 8 9 10 11
m(m
ol/k
gw)
pH
U speciation in ALLMR
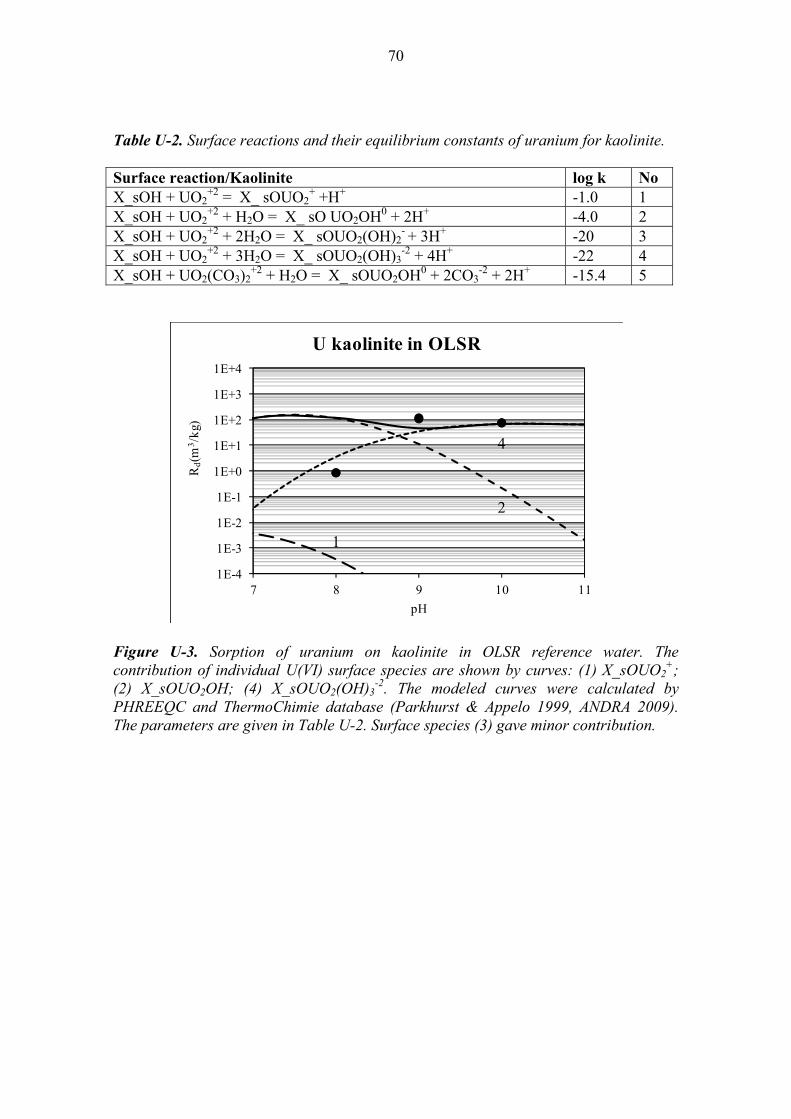
70
Table U-2. Surface reactions and their equilibrium constants of uranium for kaolinite. Surface reaction/Kaolinite log k No X_sOH + UO2
+2 = X_ sOUO2+ +H+ -1.0 1
X_sOH + UO2+2 + H2O = X_ sO UO2OH0 + 2H+ -4.0 2
X_sOH + UO2+2 + 2H2O = X_ sOUO2(OH)2
- + 3H+ -20 3 X_sOH + UO2
+2 + 3H2O = X_ sOUO2(OH)3-2 + 4H+ -22 4
X_sOH + UO2(CO3)2+2 + H2O = X_ sOUO2OH0 + 2CO3
-2 + 2H+ -15.4 5
Figure U-3. Sorption of uranium on kaolinite in OLSR reference water. The contribution of individual U(VI) surface species are shown by curves: (1) X_sOUO2
+; (2) X_sOUO2OH; (4) X_sOUO2(OH)3
-2. The modeled curves were calculated by PHREEQC and ThermoChimie database (Parkhurst & Appelo 1999, ANDRA 2009). The parameters are given in Table U-2. Surface species (3) gave minor contribution.
1
2
4
1E-4
1E-3
1E-2
1E-1
1E+0
1E+1
1E+2
1E+3
1E+4
7 8 9 10 11
Rd(
m3 /
kg)
pH
U kaolinite in OLSR
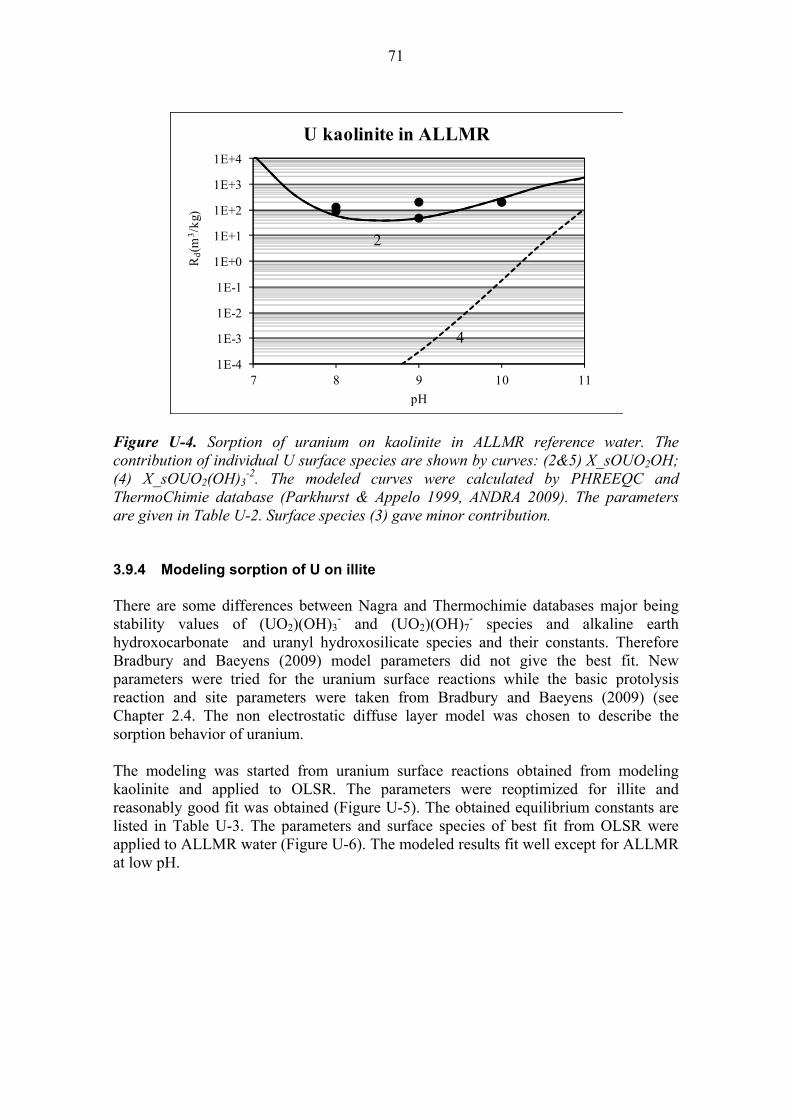
71
Figure U-4. Sorption of uranium on kaolinite in ALLMR reference water. The contribution of individual U surface species are shown by curves: (2&5) X_sOUO2OH; (4) X_sOUO2(OH)3
-2. The modeled curves were calculated by PHREEQC and ThermoChimie database (Parkhurst & Appelo 1999, ANDRA 2009). The parameters are given in Table U-2. Surface species (3) gave minor contribution. 3.9.4 Modeling sorption of U on illite There are some differences between Nagra and Thermochimie databases major being stability values of (UO2)(OH)3
- and (UO2)(OH)7- species and alkaline earth
hydroxocarbonate and uranyl hydroxosilicate species and their constants. Therefore Bradbury and Baeyens (2009) model parameters did not give the best fit. New parameters were tried for the uranium surface reactions while the basic protolysis reaction and site parameters were taken from Bradbury and Baeyens (2009) (see Chapter 2.4. The non electrostatic diffuse layer model was chosen to describe the sorption behavior of uranium. The modeling was started from uranium surface reactions obtained from modeling kaolinite and applied to OLSR. The parameters were reoptimized for illite and reasonably good fit was obtained (Figure U-5). The obtained equilibrium constants are listed in Table U-3. The parameters and surface species of best fit from OLSR were applied to ALLMR water (Figure U-6). The modeled results fit well except for ALLMR at low pH.
2
4
1E-4
1E-3
1E-2
1E-1
1E+0
1E+1
1E+2
1E+3
1E+4
7 8 9 10 11
Rd(
m3 /
kg)
pH
U kaolinite in ALLMR
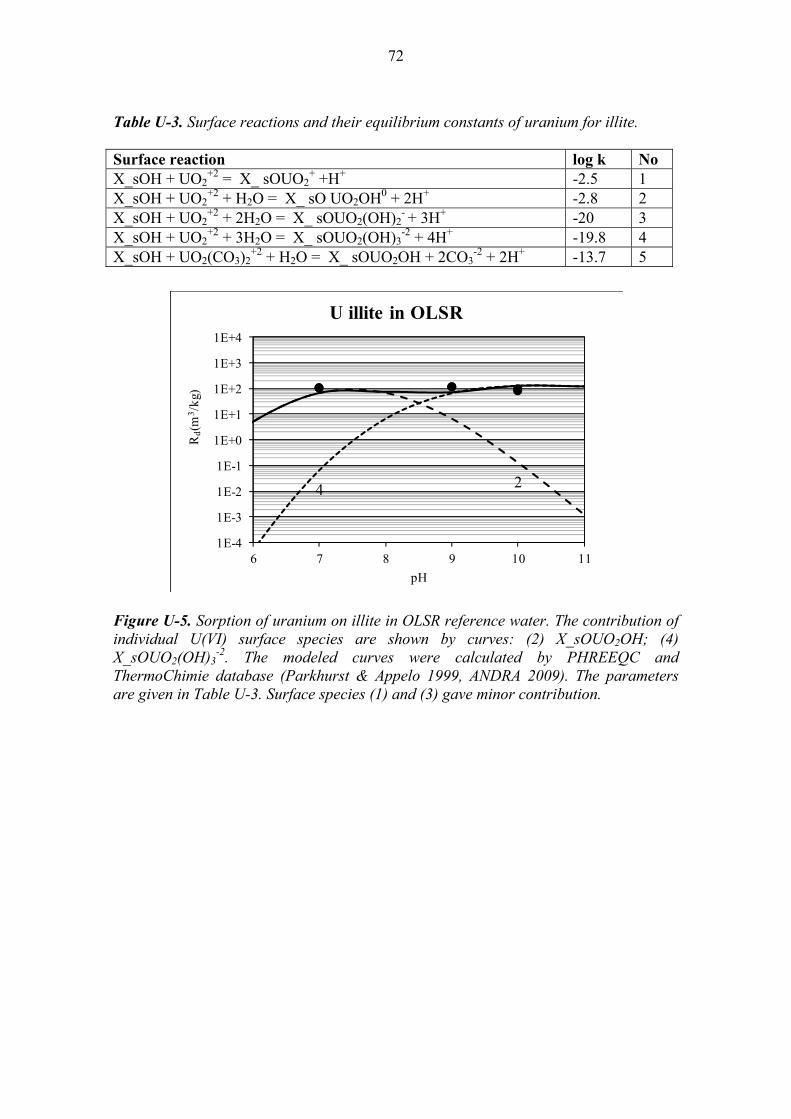
72
Table U-3. Surface reactions and their equilibrium constants of uranium for illite. Surface reaction log k No X_sOH + UO2
+2 = X_ sOUO2+ +H+ -2.5 1
X_sOH + UO2+2 + H2O = X_ sO UO2OH0 + 2H+ -2.8 2
X_sOH + UO2+2 + 2H2O = X_ sOUO2(OH)2
- + 3H+ -20 3 X_sOH + UO2
+2 + 3H2O = X_ sOUO2(OH)3-2 + 4H+ -19.8 4
X_sOH + UO2(CO3)2+2 + H2O = X_ sOUO2OH + 2CO3
-2 + 2H+ -13.7 5
Figure U-5. Sorption of uranium on illite in OLSR reference water. The contribution of individual U(VI) surface species are shown by curves: (2) X_sOUO2OH; (4) X_sOUO2(OH)3
-2. The modeled curves were calculated by PHREEQC and ThermoChimie database (Parkhurst & Appelo 1999, ANDRA 2009). The parameters are given in Table U-3. Surface species (1) and (3) gave minor contribution.
24
1E-4
1E-3
1E-2
1E-1
1E+0
1E+1
1E+2
1E+3
1E+4
6 7 8 9 10 11
Rd(
m3 /
kg)
pH
U illite in OLSR

73
Figure U-6. Sorption of uranium on illite in ALLMR reference water. The contribution of individual U surface species are shown by curves: (2&5) X_sOUO2OH; (4) X_sOUO2(OH)3
-2. The modeled curves were calculated by PHREEQC and ThermoChimie database (Parkhurst & Appelo 1999, ANDRA 2009). The parameters are given in Table U-3. Surface species (1) and (3) gave minor contribution.
REFERENCES ANDRA 2009. ThermoChimie Version 7b, C.RP.ASTR.O4.0032. Bradbury, M.H. & Baeyens, B. 2009. Sorption modeling on illite. Part II actinide sorption and linear free energy relationships. Geochim. Cosmochim. Acta 73, 1004-1013. Bradbury, M.H. & Baeyens, B. 2011. Predictive sorption modeling of Ni(II), Co(II), Eu(III), Th(IV) and U(VI) on MX-80 bentonite and Opalinus Clay: A “bottom-up”-approach. Appl. Clay Sci. 52, 27-33. Brendler, V. 2006. RES3T – The Rossendorf Expert System for Surface and Sorption Thermodynamics. Version 2 beta. FZ Rossendorf, Germany. Dong, W. & Brooks, S.C. 2006. Determination of the formation constants of ternary complexes of uranyl and carbonate with alkaline earth metals (Mg2+, Ca2+, Sr2+, and Ba2+) using anion exchange method. Environ. Sci. Technol. 40, 4689-4695. Dong, W. & Brooks, S.C. 2008. Formation of aqueous MgUO2(CO3)3
2- complex and uranium anion exchange mechanism onto an exchange resin. Environ. Sci. Technol. 42, 1979-1983.
24
1E-4
1E-3
1E-2
1E-1
1E+0
1E+1
1E+2
1E+3
1E+4
6 7 8 9 10 11
Rd(
m3 /
kg)
pH
U illite in ALLMR

74
Hakanen, M., Ervanne, H., Puukko, E. 2012. Far-field geochemical database for the Olkiluoto site: Distribution coefficients for sorption of Radionuclides in the Olkiluoto geosphere. Posiva Working report 2012-XX. Parkhurst, D.L. & Appelo, C.A.J., 1999. User's guide to PHREEQC (version 2)--A computer program for speciation, batch-reaction, one-dimensional transport, and inverse geochemical calculations: U.S. Geological Survey Water-Resources Investigations Report 99-4259, 312 p.

75
4 SUMMARY In the report of far-field sorption data base in Olkiluoto bedrock (Hakanen et al. 2012) experimental results were presented of sorption of selenium, molybdenum, niobium, tin, thorium, uranium and protactinium on common fracture coating clays kaolinite and illite. In the experiments simulants were used for low salinity glacial water (OLGA), granitic fresh groundwater (ALLMR), brackish groundwater (OLBA) and saline reducing groundwater (OLSR). In this report, the sorption of these radionuclides determined for the illite and kaolinite is modeled. In addition, the sorption of Ni and Eu on kaolinite in electrolyte solutions (Puukko and Hakanen 1998, 2004) is modeled. Also Nb on kaolinite and illite in perchlorate solutions is modeled. The non-electrostatic approach to surface complexation was adopted for the sake of simplicity. The basic parameters of the solids, the cation exchange capacity (CEC), the sorption site density or sorption capacity were adopted from literature. The surface complexation reactions and the cation exchange selectivities of the main groundwater cations given in literature for illite and kaolinite were applied. The difference between modeled and experimental results are collected in Table 4-1 – 4-3. The values are grouped in categories by the difference of 0.5 log unit.

76
Table 4-1. Difference between experimental and modeled results of Se, Nb, Mo, Sn, Pa, U, Th sorption in reference waters. Values are presented in log units.
Kaolinite pH6 pH7 pH8 pH9 pH10 Se OLSR - ≤0.2 ≤0.2 - 1.5 ALLMR - ≤0.2 ≤0.2 - 1 OLBA - - ≤0.2 - 0.5 OLGA ≤0.2 ≤0.2 0.5 - 1 Nb OLSR - 0.5 ≤0.2 - ≤0.2 ALLMR - ≤0.2 0.5 - ≤0.2 OLBA - - 1 - - OLGA - 0.5 1 - 1 Mo OLSR 1 1.5 - 2 - ALLMR 1 2 - - - Sn ALLMR ≤0.2 ≤0.2 - - 0.5 Pa OLSR - ≤0.2 0.5 2 - ALLMR - 0.5 - 2 - U OLSR - - 2 ≤0.2 ≤0.2 ALLMR - - ≤0.2 ≤0.2 ≤0.2 Th OLSR - ≤0.2 ≤0.2 - ≤0.2 ALLMR - 0.5 0.5 - 0.5 OLBA - - ≤0.2 - ≤0.2 OLGA ≤0.2 ≤0.2 ≤0.2 - ≤0.2 Illite pH6 pH7 pH8 pH9 pH10 Se OLSR - ≤0.2 0.5 - ≤0.2 ALLMR - 0.5 ≤0.2 - 0.5 OLBA - - ≤0.2 - 1 OLGA 0.5 2 0.5 - 3 Nb OLSR - ≤0.2 ≤0.2 - ≤0.2 ALLMR - 1 - 2 1.5 OLBA - - 1.5 - - OLGA - - 1 1 2 Mo OLSR 1 ≤0.2 - 3 - ALLMR 1 0.5 - - - Sn ALLMR - 0.5 0.5 ≤0.2 -
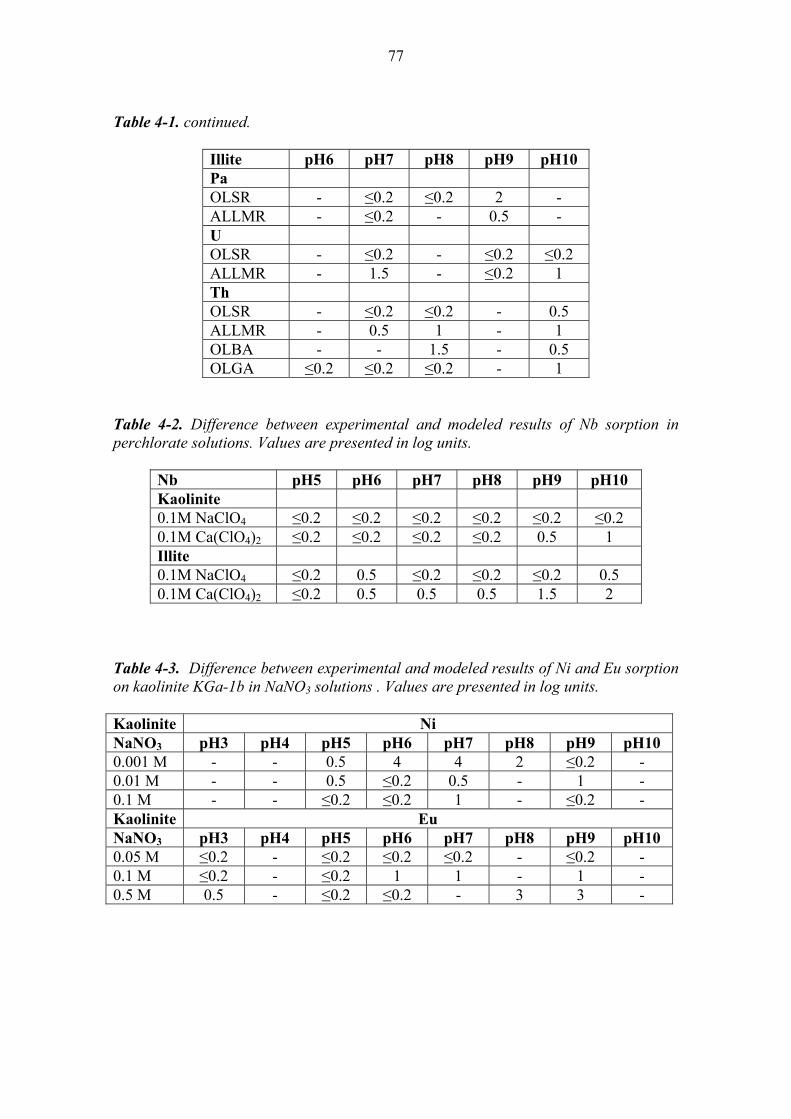
77
Table 4-1. continued.
Illite pH6 pH7 pH8 pH9 pH10 Pa OLSR - ≤0.2 ≤0.2 2 - ALLMR - ≤0.2 - 0.5 - U OLSR - ≤0.2 - ≤0.2 ≤0.2 ALLMR - 1.5 - ≤0.2 1 Th OLSR - ≤0.2 ≤0.2 - 0.5 ALLMR - 0.5 1 - 1 OLBA - - 1.5 - 0.5 OLGA ≤0.2 ≤0.2 ≤0.2 - 1
Table 4-2. Difference between experimental and modeled results of Nb sorption in perchlorate solutions. Values are presented in log units.
Nb pH5 pH6 pH7 pH8 pH9 pH10 Kaolinite 0.1M NaClO4 ≤0.2 ≤0.2 ≤0.2 ≤0.2 ≤0.2 ≤0.2 0.1M Ca(ClO4)2 ≤0.2 ≤0.2 ≤0.2 ≤0.2 0.5 1 Illite 0.1M NaClO4 ≤0.2 0.5 ≤0.2 ≤0.2 ≤0.2 0.5 0.1M Ca(ClO4)2 ≤0.2 0.5 0.5 0.5 1.5 2
Table 4-3. Difference between experimental and modeled results of Ni and Eu sorption on kaolinite KGa-1b in NaNO3 solutions . Values are presented in log units. Kaolinite Ni NaNO3 pH3 pH4 pH5 pH6 pH7 pH8 pH9 pH10 0.001 M - - 0.5 4 4 2 ≤0.2 - 0.01 M - - 0.5 ≤0.2 0.5 - 1 - 0.1 M - - ≤0.2 ≤0.2 1 - ≤0.2 - Kaolinite Eu NaNO3 pH3 pH4 pH5 pH6 pH7 pH8 pH9 pH10 0.05 M ≤0.2 - ≤0.2 ≤0.2 ≤0.2 - ≤0.2 - 0.1 M ≤0.2 - ≤0.2 1 1 - 1 - 0.5 M 0.5 - ≤0.2 ≤0.2 - 3 3 -

78