modeling of industrial air compressor system energy
TRANSCRIPT

MODELING OF INDUSTRIAL AIR COMPRESSOR SYSTEM ENERGY
CONSUMPTION AND EFFECTIVENESS OF VARIOUS ENERGY SAVING ON
THE SYSTEM
A Thesis
Submitted to the Faculty
of
Purdue University
by
Abdul Hadi Mahmoud Ayoub
In Partial Fulfillment of the
Requirements for the Degree
of
Masters of Science in Mechanical Engineering
December 2018
Purdue University
Indianapolis, Indiana

ii
THE PURDUE UNIVERSITY GRADUATE SCHOOL
STATEMENT OF COMMITTEE APPROVAL
Dr. Ali Razban
Department of Mechanical and Energy Engineering
Dr. Jie Chen
Department of Mechanical and Energy Engineering
Dr. David W. Goodman
Department of Electrical and Computer Engineering Technology
Approved by:
Dr. Jie Chen
Head of the Graduate Program

iii
I want to thank God for guiding me to the finish line. I am grateful to my parents
and family for all the endless love and support that they showed me throughout this
journey. Special thanks to my friends who believed in me the most when I doubted
myself. None of this would have been possible without every single one of you.

iv
ACKNOWLEDGMENTS
I would like to thank Dr. Jie Chen, Dr. Ali Razban and Dr. David Goodman
for their endless support and patience. I appreciate every chance you have given me.
You have been amazing mentors throughout these years. I am happy that I had the
chance to work with you and develop a special relationship with each one of you. I
will always be thankful for all the opportunities you have provided me, that made me
the person I am today. I want to thank Allen Wu, Amin Amini and Babak Bahrami
for their support and guidance during this research. Finally, thanks to Dr. Chu and
Grant for their technical help.

v
TABLE OF CONTENTS
Page
LIST OF TABLES . . . . . . . . . . . . . . . . . . . . . . . . . . . . . . . . . . vii
LIST OF FIGURES . . . . . . . . . . . . . . . . . . . . . . . . . . . . . . . . . viii
SYMBOLS . . . . . . . . . . . . . . . . . . . . . . . . . . . . . . . . . . . . . . ix
ABSTRACT . . . . . . . . . . . . . . . . . . . . . . . . . . . . . . . . . . . . . x
1 INTRODUCTION . . . . . . . . . . . . . . . . . . . . . . . . . . . . . . . . 1
1.1 Problem Overview . . . . . . . . . . . . . . . . . . . . . . . . . . . . . 1
1.2 System Diagram . . . . . . . . . . . . . . . . . . . . . . . . . . . . . . 2
1.3 Components . . . . . . . . . . . . . . . . . . . . . . . . . . . . . . . . . 3
1.3.1 Air Compressors . . . . . . . . . . . . . . . . . . . . . . . . . . 3
1.3.2 Air Dryers . . . . . . . . . . . . . . . . . . . . . . . . . . . . . . 5
1.3.3 Air Receivers . . . . . . . . . . . . . . . . . . . . . . . . . . . . 7
1.3.4 Pressure/Flow Controller . . . . . . . . . . . . . . . . . . . . . . 8
1.3.5 Air Inlet Filters . . . . . . . . . . . . . . . . . . . . . . . . . . . 9
1.3.6 Aftercoolers . . . . . . . . . . . . . . . . . . . . . . . . . . . . . 9
1.4 Literature survey . . . . . . . . . . . . . . . . . . . . . . . . . . . . . . 9
1.5 Research Needs . . . . . . . . . . . . . . . . . . . . . . . . . . . . . . . 16
1.6 Research Goals . . . . . . . . . . . . . . . . . . . . . . . . . . . . . . . 17
1.7 Research Boundaries . . . . . . . . . . . . . . . . . . . . . . . . . . . . 18
2 METHODOLOGY . . . . . . . . . . . . . . . . . . . . . . . . . . . . . . . . 19
3 TERMINOLOGY . . . . . . . . . . . . . . . . . . . . . . . . . . . . . . . . . 22
3.1 Pressure Loss Models . . . . . . . . . . . . . . . . . . . . . . . . . . . . 23
3.1.1 Aftercooler . . . . . . . . . . . . . . . . . . . . . . . . . . . . . 23
3.1.2 Refrigerant Air Dryer . . . . . . . . . . . . . . . . . . . . . . . . 23
3.1.3 Filter . . . . . . . . . . . . . . . . . . . . . . . . . . . . . . . . . 24

vi
Page
3.1.4 Pipe Pressure Loss . . . . . . . . . . . . . . . . . . . . . . . . . 25
3.2 Efficiency . . . . . . . . . . . . . . . . . . . . . . . . . . . . . . . . . . 26
3.3 Effectiveness . . . . . . . . . . . . . . . . . . . . . . . . . . . . . . . . . 30
3.3.1 Reduce Compressor Set Pressure . . . . . . . . . . . . . . . . . 31
3.3.2 Using Outside Air for Air Compressor Intake . . . . . . . . . . . 32
4 RESULTS VALIDATION . . . . . . . . . . . . . . . . . . . . . . . . . . . . 37
4.1 First Case Study . . . . . . . . . . . . . . . . . . . . . . . . . . . . . . 37
4.2 Second Case Study . . . . . . . . . . . . . . . . . . . . . . . . . . . . . 41
4.3 Third Case Study . . . . . . . . . . . . . . . . . . . . . . . . . . . . . . 41
5 DISCUSSION . . . . . . . . . . . . . . . . . . . . . . . . . . . . . . . . . . . 43
6 CONCLUSION . . . . . . . . . . . . . . . . . . . . . . . . . . . . . . . . . . 46
6.1 Future Work . . . . . . . . . . . . . . . . . . . . . . . . . . . . . . . . . 47
REFERENCES . . . . . . . . . . . . . . . . . . . . . . . . . . . . . . . . . . . . 48

vii
LIST OF TABLES
Table Page
1.1 Compressors Data Sheets Information [6]. . . . . . . . . . . . . . . . . . . 5
1.2 Advantages and Disadvantages for Various Types of Air Dryers. . . . . . . 6
2.1 Parameter Changes in Components for Ideal Model. . . . . . . . . . . . . . 19
2.2 Parameter Changes in Components for Real Model. . . . . . . . . . . . . . 20
3.1 Estimated Pressure Drop in an Air Filter. . . . . . . . . . . . . . . . . . . 24
3.2 Pressure Loss for Different Pipe Types at Different Pipe Sizes at a Pressureof 50 psi (344,738 Pa) and Pipe Length of 100 ft (30.5 m). . . . . . . . . . 26
3.3 Pressure Loss for Different Pipe Types at Different Pipe Sizes at a Pressureof 100 psi (689,476 Pa) and Pipe Length of 100 ft (30.5 m). . . . . . . . . . 26
3.4 Pressure Loss for Different Pipe Types at Different Pipe Sizes at a Pressureof 150 psi (1,034,214 Pa) and Pipe Length of 100 ft (30.5 m). . . . . . . . . 27
3.5 Assumptions for Calculation of Ideal and Real Models. . . . . . . . . . . . 27
3.6 Ideal Model Results at a Set Pressure 105 psi (723,950 Pa). . . . . . . . . . 28
3.7 Real Model Results at a Set Pressure 105 psi (723,950 Pa). . . . . . . . . . 29
3.8 Ideal vs Real Models and Each Stage Efficiency. . . . . . . . . . . . . . . . 30
3.9 Model Results for a Set Pressure 90 psi (620,528Pa) . . . . . . . . . . . . . 33
3.10 Results for Different Air Intake Temperatures with a Base Temperatureof 293 K . . . . . . . . . . . . . . . . . . . . . . . . . . . . . . . . . . . . . 35
4.1 Air Compressors Data Sheet Information. . . . . . . . . . . . . . . . . . . 38
4.2 Case Studies Summary. . . . . . . . . . . . . . . . . . . . . . . . . . . . . . 42

viii
LIST OF FIGURES
Figure Page
1.1 Typical Lifetime Compressed Air Costs [2]. . . . . . . . . . . . . . . . . . . 2
1.2 Compressed Air System Diagram. . . . . . . . . . . . . . . . . . . . . . . . 3
1.3 Types of Air Compressors [1]. . . . . . . . . . . . . . . . . . . . . . . . . . 4
1.4 Rotary-Screw Air Compressor [5]. . . . . . . . . . . . . . . . . . . . . . . . 4
1.5 Computer Analysis Flow Diagram Example [17]. . . . . . . . . . . . . . . . 14
2.1 Energy Flow Diagram of a Compressed Air System. . . . . . . . . . . . . . 20
3.1 Pressure Drop Model for Aftercooler. . . . . . . . . . . . . . . . . . . . . . 24
3.2 Pressure Drop Model for Refrigerant Air Dryer. . . . . . . . . . . . . . . . 25
3.3 Compressed Air Sub-System Block Diagram and Estimated Energy Con-sumption Percentage. . . . . . . . . . . . . . . . . . . . . . . . . . . . . . . 31
3.4 Reducing Set Pressure Effectiveness. . . . . . . . . . . . . . . . . . . . . . 33
3.5 Energy Savings (kWh) vs Pressure Drop (PSI). . . . . . . . . . . . . . . . 34
3.6 Outside Air Compressor Air Intake Effectiveness. . . . . . . . . . . . . . . 35
4.1 Compressed Air System Layout. . . . . . . . . . . . . . . . . . . . . . . . . 38
4.2 Air Compressors Name Plate Information. . . . . . . . . . . . . . . . . . . 39
4.3 Air Dryers Name Plate Information. . . . . . . . . . . . . . . . . . . . . . 40

ix
SYMBOLS
D pipe diameter, mm
E air power, J/s
L pipe length, m
P absolute pressure of compressed air, Pa, psi
Q volumetric flow rate of compressed air, m3/s , cfm
T temperature, K,◦R
TI average temperature of inside air, K
TO annual average outside air temperature, K, ◦R
V volume of compressed air, m3
W theoretical adiabatic compression power, J/s
WI work of compressor with inside air, hp
WO work of compressor with outside air, hp
WR work reduction
Subscripts
a: the atmospheric state
1: the input of air power
2: the output of air power
Greek symbols
ρ air density, kg/m3 (1.225 kg/m3)
κ airs adiabatic index
ε effectiveness
η efficiency

x
ABSTRACT
Ayoub, Abdul Hadi Mahmoud. M.S.M.E., Purdue University, December 2018. Mod-eling of Industrial Air Compressor System Energy Consumption and Effectiveness ofVarious Energy Saving on the System. Major Professor: Ali Razban.
The purpose of this research is to analyze the overall energy consumption of an
industrial compressed air system, and identify the impact of various energy saving
of individual subsystem on the overall system. Two parameters are introduced for
energy consumption evaluation and potential energy saving: energy efficiency (η) and
process effectiveness (ε). An analytical energy model for air compression of the overall
system was created taking into consideration the modeling of individual sub-system
components: air compressor, after-cooler, filter, dryer and receiver. The analytical
energy model for each subsystem included energy consumption evolution using the
theoretical thermodynamic approach. Furthermore, pressure loss models of individual
components along with pipe friction loss were included in the system overall efficiency
calculation.
The efficiency analysis methods and effectiveness approach discussed in this study
were used to optimize energy consumption and quantify energy savings. The method
was tested through a case study on a plant of a die-casting manufacturing company.
The experimental system efficiency was 76.2% vs. 89.3% theoretical efficiency. This
showed model uncertainty at ∼ 15%. The effectiveness of reducing the set pressure in-
creases as the difference in pressure increase. The effectiveness of using outside air for
compressors intake is close to the compressors work reduction percentage. However, it
becomes more effective when the temperature difference increase. This is mainly due
to extra heat loss. There is potential room of improvement of the various component
using the efficiency and effectiveness methods. These components include compres-

xi
sor, intercooler and dryer. Temperature is a crucial parameter that determines the
energy consumption applied by these components. If optimum temperature can be
determined, plenty of energy savings will be realized.

1
1. INTRODUCTION
1.1 Problem Overview
Compressed air systems are very popular and widely used in industrial facilities.
They are used for providing compressed air to the systems, such as machines, pneu-
matics, tools, and transportation. Compressed air usage varies depending on the
type of industry. Compressed air systems are known to be one of the biggest energy
consumer systems in a facility, usually 10% - 30% of the electricity consumption [1].
Thus, to lower the energy consumption of the plant, it is important to understand the
energy consumption of this Significant Energy Use (SEU) equipment, which is critical
for compressor optimization for increasing its efficiency. Figure 1.1 below shows the
typical lifetime compressed air cost, 76% of the total cost is on energy consumption,
while 12% for both implementation and maintenance each.
Many factors, such as equipment age, dirt, and component conditions, may lower
the compressor system efficiency [3]. To quantify the effects, models are needed to
relate the factors to the energy consumptions. These models are used to estimate
the efficiency of each individual component in the system, and how air is reacting
between stages, which affects energy consumption. This will help in identifying prob-
lems within the system and thus improving the overall system efficiency. Another
important aspect that needs to be discussed is the effectiveness of various energy sav-
ing recommendations on the system. There is a difference between how much energy
you can save, and what the impact on each component is. [4]

2
Fig. 1.1. Typical Lifetime Compressed Air Costs [2].
1.2 System Diagram
Figure 1.2 shows a typical air compressor system diagram. The fresh air intake
flows into a filter before entering the compressor. Many of the industrial air com-
pressors come in a closure that will include multiple components such as compressor,
motor, aftercooler and a separator. Then, air flows into a wet receiving tank. The
wet receiving tank helps store the air and drain any liquid and solid particulate that
was not removed by the separator. A common practice is to place a filter between
the receiver and air dryer. Refrigerant air dryers come in closures similar to air com-
pressors. These closures include the main component of a refrigerant cycle, and that
would be a heat exchanger, evaporator, condenser, and a compressor. Finally, air will
flow through an optional filter before being stored in a dryer receiver tank. Pressure
Flow Controller plays an important role in distributing the air to the plant side based
on the required air demand. It is discussed furthermore in section 1.3.6.

3
Fig. 1.2. Compressed Air System Diagram.
1.3 Components
1.3.1 Air Compressors
The air compressor is the basic element that makes up a compressed air system.
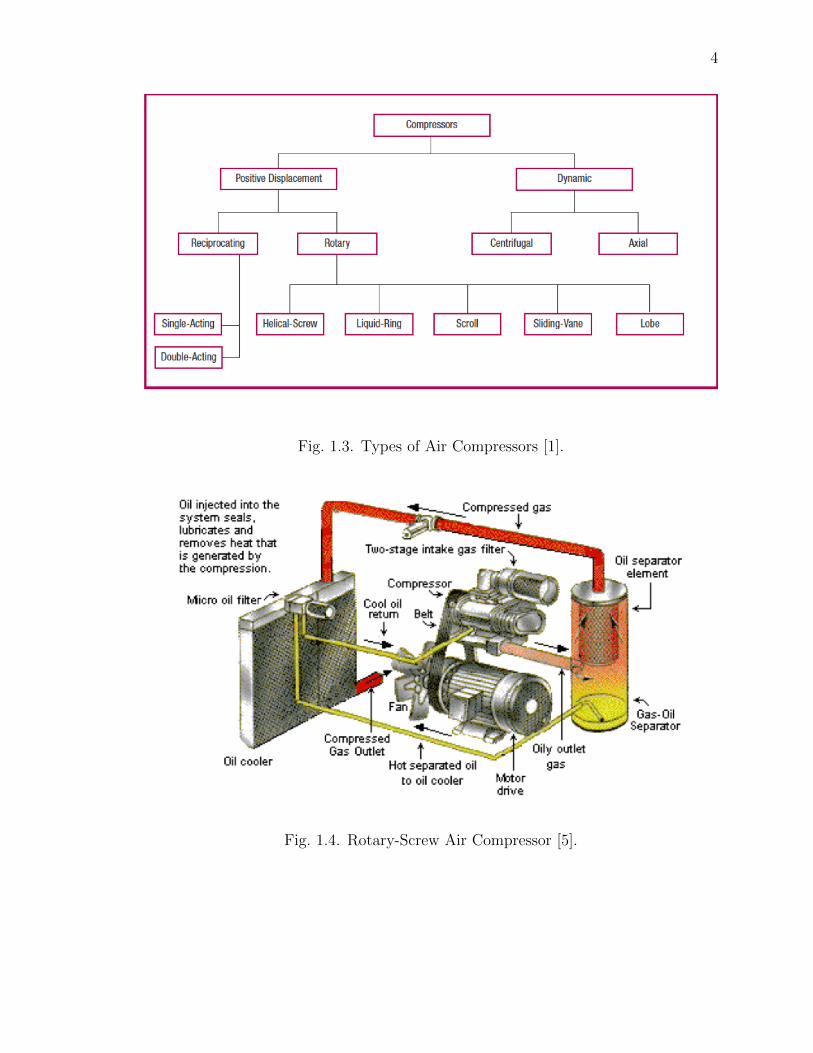
Air compressors come in many different types and sizes. Figure 1.3 below shows the
categories and subcategories of different types of air compressors.
Some are reciprocating and rotary which falls under the positive displacement
compressors category. Other types are centrifugal and axial which falls under the
dynamic compressors category. However, the most common type that is used in the
industry is the rotary screw air compressor.
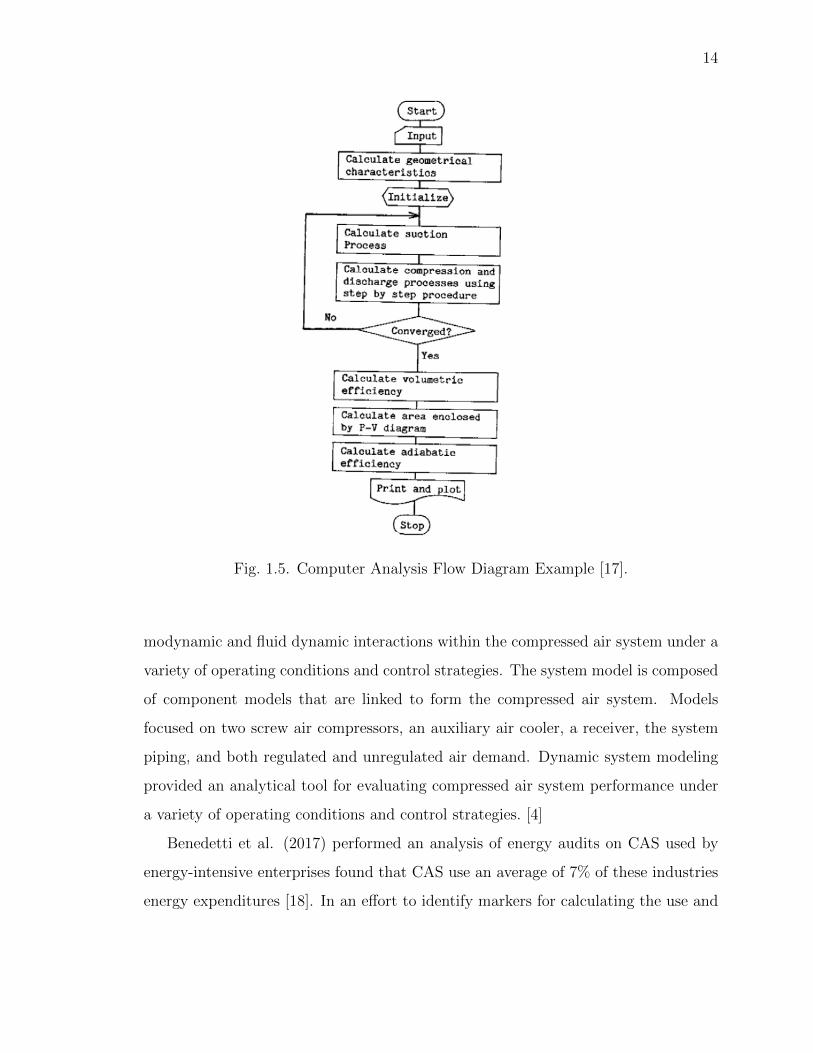
A rotary-screw compressor is a type positive displacement machines. It uses two
rotating helical screws, which captures the air between them. Figure 1.4 below shows
different compressor parts, and how air is flowing from one part to the other. The
space in which the air is trapped becomes smaller as it moves down the axis of the
screw. The compressed air is then discharged from the opposite end. This type of
4
Fig. 1.3. Types of Air Compressors [1].
Fig. 1.4. Rotary-Screw Air Compressor [5].

5
compressor can be usually used to power air tools, pneumatics, and transportation
in industrial applications. Sizes may vary from 5 five horsepower to 600 horsepower.
Table 1.1 below shows, on average, rotary air compressors produce a ratio of 4
CFM to 1 HP based on data extracted from CAGI data sheets collected for different
air compressor models and sizes.
Table 1.1.Compressors Data Sheets Information [6].
1.3.2 Air Dryers
Air dryers are one of the most common methods used to modify air quality. Their
main purpose is to convert air into a form that can be used for different applications.
Compressed air must be kept free of moisture. Without air dryers, wet compressed
air running through the system would negatively impact the machines. Parts of the
machines would rust and tear due to the wetness of the air passing through. However,
excessively dry compressed air would result in unnecessary energy and costs. Table
1.2 lists some advantages and disadvantages for various types of air dyers. There
is no best air dryer type. Application and setting help determine compatibility and
choosing the ideal components [1].

6
Table 1.2.Advantages and Disadvantages for Various Types of Air Dryers.
Various types of dryers are:
1. Refrigerant (cycling and non-cycling): does not offer a very low dew point as
other types and it is most commonly used in industry. However, it is not
recommended for operation in sub-freezing ambient temperatures. Filtration
is recommended even though the oil in air stream does not damage the dryer.
This type has many advantages such as low initial capital cost, operating cost,
and maintenance costs.
2. Regenerative-desiccant: uses a porous desiccant that adsorbs the moisture by
collecting it in its myriad pores, allowing large quantities of water to be retained
by a relatively small quantity of desiccant. The moisture can be reduced with

7
regeneration process by applying purge air and heat. It has very low dew point
and moderate cost of operation. However, the initial cost is relatively high.
3. Deliquescent: use a drying medium that absorbs, rather than adsorbs, the mois-
ture in the compressed air. This type of dryer does not require electricity for
operation.
4. Membrane: water vapor passes through hollow fibers of specially designed mem-
branes faster than air. This process reduces the amount of water vapor in the
air stream at the outlet of the dryer, suppressing the dew point.
1.3.3 Air Receivers
Air receivers, or compressed air storage tanks, is a crucial part in compressed
air systems. They are used as temporary storage for compressed air to meet peak
demand from systems and optimizes the efficiency of the plant. It also helps control
the system pressure by controlling the rate of change in a system. Receivers should
be properly sized to meet the required demand. There are several factors that should
be considered when sizing a receiver. These factors are: minimizing pressure fluctua-
tions/drops, meeting short term peak air demands, energy considerations, and safety
considerations.
There are two types of storage tanks, wet and dry. A receiver before a dryer is
filled with saturated air. A sudden demand for air exceeding the dryer rating, may
result in overloading the dryer and a higher downstream dew point. A receiver placed
after the dryer will be filled with air already dried and can satisfy a sudden demand
without impacting the dryer performance and pressure dew point.
After defining air receivers and discussing their importance/functionality in a
compressed air system, it will just be reasonable to utilize in every system. Air
receivers are commonly used in industrial sectors, especially intensive compressed-air
user facilities. However, there are still plenty of industrial plants that still do not

8
take advantage of this great component. This could be due to lack of knowledge,
poor design capabilities, and cutting capital cost.
Compressed air storage is an essential component of compressed air systems.
Abel’s and Kissock’s study discussed methods to properly size compressed air stor-
age tank to reduce system energy use. Mathematical equations were created using
thermodynamic equations. These equations addressed storage, pressure, and air flow.
Next, these relations were used to calculate the relationship between the volume of
storage and cycle time in load-unload compressors. The study explained the effect
of pressure drop between the compressor system and storage tank on cycle time.
The authors developed guidelines for compressed air storage that minimize energy
consumption. [7]
1.3.4 Pressure/Flow Controller
A pressure/flow controller is a device that serves to separate the supply side of a
compressed air system from the demand side. Most plant air systems have an ever
changing fluctuation of demand, and changes in plant air pressure. Peak air demands
will draw from the air system, and tend to disrupt the air capacity. These changes
inevitably lead to inconsistent production, poor product quality, and wasted energy.
The system will utilize the supply-side storage tank installed with the compressors
operating at an appropriately set control pressure, and the controller will deliver
the desired plant air pressure set point. Peak air consumptions will be drawn from
storage, and less compressor horsepower is required for peak events.
A pressure/flow controller is used to:
• Stabilize of the plant production quality by stabilizing the compressed air.
• Optimize operations of the Air Compressors.
• Make constant adjustments to stabilize the system air pressure in responses to
the ever-changing fluctuations of demand.

9
• Minimize waste through air leak reduction.
• Reduce compressor energy consumption.
• Improve compressor controls and response to changing air requirements.
1.3.5 Air Inlet Filters
An air inlet filter protects the compressor from any atmospheric particles such as
dust and dirt. It is the most important filter on the compressor. It will prevent the
dust from getting sucked into the oil, oil filter, and oil separator. Any of these issues
could lower the compressors performance and increase both maintenance costs and
energy bills. Filtration only to the level required by each compressed air application
will minimize pressure drop and resultant energy consumption.
1.3.6 Aftercoolers
Aftercoolers are installed to cool the discharge from the compressor. They also
reduce the moisture and water vapor in the compressed air system. Aftercoolers are
placed after the final stage of the air compression. The air is cooled below its dew
point converting the water vapor into liquid and drained from the system.
1.4 Literature survey
Air compressor systems may come in various designs. However, the systems usu-
ally consists of six sub-system which are crucial in establishing the proper design
since the system revolves around its operating principles. The air compressor’s key
function is to produce required air capacity at a desired pressure. These are various
compressor types, such as reciprocating compressors, centrifugal compressors and fi-
nally the packaged rotary air compressor. Rotary air compressor is widely utilized in
the small/mid-sized industrial sector, and thus will be used in the modeling of the

10
air compressor system in this research. One of the main component of the system
is the air cooler, which is found in two different locations serving generally the same
purpose. One is the intercooler is inside the compressor and the other being the
after-cooler, located right after outlet of the air compressor. The air cooler just likes
the filter and dryer is used to treat the air as it flows through the system to acquire
preferred characteristics of the air before reaching the end users. However, rather
than cooling like the air coolers, the filters and dryers are used to remove impurities
and monitor after compression. To assist in achieving the required cooled compressed
air, the system is equipped with an air receiver (storage) tank or a tank reservoir that
exclusively functions to store and cool the excess compressed air and releasing it at
times of need. To achieve the desired flow, the distribution system utilizes pipes and
valves that will coordinate the flow of compressed air. In the distribution, parameters
like isolation and ventilation are a major concern.
Industrial Air Compressors provide a mean of delivering enough compressed air
at a demanded pressure to drive tools, machines and processes. Demand on such an
operating system is high and often found but not exclusively at Automotive, Furni-
ture, General Manufacturing, Metals Fabrication, Petroleum and Rubber Industries.
Functions of air compressor systems aim to achieve clamping, tool powering, controls
and actuators, blending, stamping, spraying, forming, Assembly station powering or
many more. Since the demand on air compressors is high, the mathematical modeling
would help in process optimization for improving the overall efficiency [8].
Many machine applications require compressed air to operate. This process con-
sumes a large amount of energy. Heat loss generates as a by-product. The amount
of heat loss indicates whether energy-consuming cooling is required or not. Zust pre-
sented a theoretical approach to quantify the energy equivalent of compressed air and
its by-products. A model-based method is set up to describe the required physical re-
lationships for the compressor and its peripheral components. On-site measurements
were collected and used to validate the results of the theoretical approach. This

11
study resulted in a general method for the theoretical energy equivalent calculation,
including the compressor and treatment of heat loss, is possible. [9]
In 2007, China’s compressor electricity consumption reached 200 billion kWh
which amounted to approximately 9.4% of the national total electricity consump-
tion [10]. Taking into consideration that compressors amounted to a high percentage
of the electric consumption, an elevated concern with research in improving compres-
sor efficiency embarked. A practice to analyze the overall energy of compressed air
systems by the school of automation science and electrical engineering in Beijing,
China describes efficiency analysis methods used for the lubricant-injected rotary
screw compressor and the after-cooler. The research aims to assist in the develop-
ment of a more precise data collection of the system to find its efficiency, allowing
a better energy saving equipment selection to go with the system design. Such a
selection is achieved by comparing the output pressure of the compressed air versus
the overall efficiency. The method of improvements was initiated by factoring out the
losses in the compressor and the after-cooler. Taking into consideration the efficiency
of the electric motor powering the compressor and then improving it by VFDs. The
motor and VFD efficiencies were factored in alongside the efficiency of the compres-
sor to compare with ideal systems and overall energy efficiency of the air compressor
system [10].
Regardless whatever air compressors were installed the compressor system will
cause energy loss of more than 80%. The study found that the energy loss was
due to unoptimized air compressor system operation and air leakage. The paper
also suggested investing in air compressor systems as the investment could be cost-
effective. If companies invest $84,000 in air compressors to improve efficiency, the
payback period is about six months. [11]
The paper presents a new control method for the compressed air system. The con-
trol method helps to improve energy management of electrically driven compressors
through Real-Time Physical System. The System allows a real-time scheduling algo-

12
rithm to generate the sequence of opening/closing action. The result, as presented in
the paper, shows about 6% energy savings. [12]
Mousavi et al. Air compressor systems have a significant impact on the energy
consumption and efficiency of industrial operations. Systems can consist of one or
more air compressors networked together. Compressors with constant or variable
speed systems have dynamic energy consumption profiles. Also, they require an
algorithm to control multiple compressors. The control system reacts to the air
flow rate and pressure parameters that determine the load/unload sequence. The
study provided an overview of techniques to model energy consumption as well as
various approaches used to control the air compressor system. A state-based modeling
technique is used to develop a simulation model that includes both fixed and variable
speed drive compressors. Mousavi’s method was applied to analyze different control
system strategies. An industrial case study was used to validate the model. [13]
This study reviewed common types of compressor control for reciprocating and
rotary air compressors. Relations were derived for estimating compressed air output
as a function of the type of control and motor loading. A method was developed to
estimate the ratio of compressed air output to energy input. This method was based
on input power to the compressor. [14]
Saidur et al. defined a comprehensive literature review about compressed air
energy use, savings, and the payback period of energy efficient strategies. Previous
studies in this area showed that for an electric motor used in an air compressor system,
a large amount of energy consumption and utility cost could be saved using high-
efficiency motors and applying VSDs in matching speed requirements. In addition,
notable amounts of energy and emission are reducible through various energy-saving
strategies. Payback periods for different energy savings measures have been identified
and found to be economically viable in most cases. [9]
Gopalakrishnan et al. conducted an experimental study study was done on an au-
tomotive facility type. Several dianostic tools and methods were reviewed to detemine
energy saving measures on the air compressor system. These measures included air

13
leak reduction, reducing set pressure and heat recover. The goal was to have a data
driven approach to monitor and improve compressed air systems in the manufacturing
facilities using different tools and equipment. It was possible that total compressed
air energy consumption can be significantly reduced. [15]
To fully comprehend and analyze the performance of an engineered air compres-
sor system, one must not rely solely on the scientific standards and engineering for-
mulations that make up the system. Compressed air process description is the best
portrayed through the use of mathematical modeling and so is the case in the air com-
pressor system. The resulting mathematical modeling of a system proves dividend
while simulating the system process. The biggest benefit is the ease of descriptive in-
formation transfer. This information, once simulated, will unfold the required results
of the variables in interest [16].
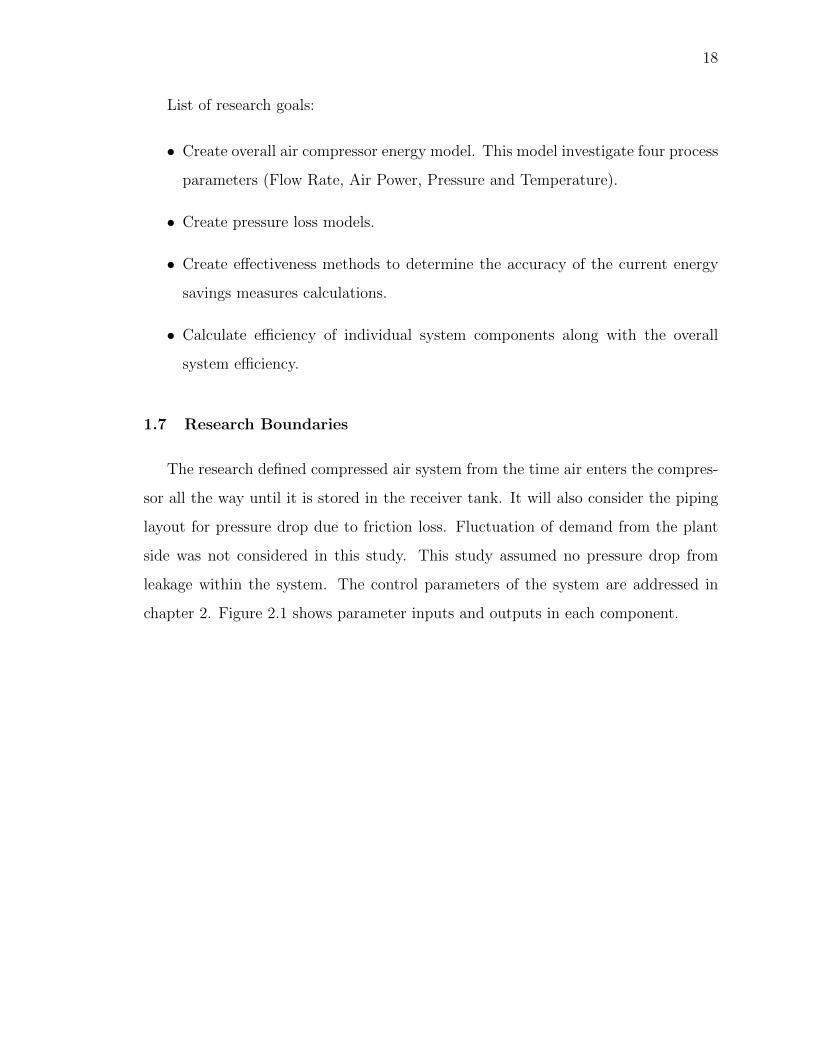
The use of computer modeling to analyze the performance of rotary screw com-
pressors has been discussed [17]. The authors start by stating the importance of
computer modeling and the factors that will decide the preferred approach. The au-
thors used a simulation software to analyze the performance data from the model
since experimental analysis is expensive and impractical. The research aimed to cre-
ate a computer model based analysis program which can effectively analyze general
types of compressors. In the complex shape of the compressor volume curve calcula-
tions were simplified by the principle of virtual work. The screw rotors were designed
according to the volumes. Finally, they applied the compression cycle equations to
evaluate energy consumption. Inlet velocities, Temperature, Pressure Drop across the
inlet port and heat flow from gas and oil were kept constant. The modeling method’s
key concern was the leakage flow rate of the screw compressor. Leakage flow rate
values were used to calculate the efficiency of the system. In comparison to the ideal
efficiency of the software calculated air compressed system efficiency and performance
ratings [17]. This process is further described in Figure 1.5:
Maxwell et al. presented a study on a dynamic compressed air system simulation
model that was developed using MATLAB/SIMULINK. The model considered ther-
14
Fig. 1.5. Computer Analysis Flow Diagram Example [17].
modynamic and fluid dynamic interactions within the compressed air system under a
variety of operating conditions and control strategies. The system model is composed
of component models that are linked to form the compressed air system. Models
focused on two screw air compressors, an auxiliary air cooler, a receiver, the system
piping, and both regulated and unregulated air demand. Dynamic system modeling
provided an analytical tool for evaluating compressed air system performance under
a variety of operating conditions and control strategies. [4]
Benedetti et al. (2017) performed an analysis of energy audits on CAS used by
energy-intensive enterprises found that CAS use an average of 7% of these industries
energy expenditures [18]. In an effort to identify markers for calculating the use and

15
efficiency of CAS, they found that the kWhe CAS/m3 can be used as a cross-sectional
indicator of energy efficiency in the production of compressed air. Dindorf (2012)
highlighted that several other specific basic markers for calculating the performance
of CAS are specific power, annual energy cost, cost of compressed air, compressed air
leaks, and pressure drops in the system [19]. Qin and McKane from Shanghai Energy
Conservation Service Center compiled over 50 energy audits completed and found the
potential for energy saving was up to 50% [20]. They illustrated that this saving can
be accomplished by limiting the use of compressed air to only applications that do
not have more economical source, minimizing leaks as they account for up to 30% of
output, pressure control to control rapid drops thus saving energy expenditure, and
optimizing the settings and configuration of each individual CAS.
This paper introduces the modeling and control of a new type of compressed air
energy storage system (CAES) for wind turbines. The system captures excess power
before it is generated, allowing it to reduce the size of electrical components based on
demand rather than supply. Energy is stored in a high-pressure two-chamber liquid
compressed air storage vessel. It utilizes the power density and aerodynamic energy
density of the hydraulic system in the ”open accumulator” architecture. In order
to realize accumulator pressure regulation and generator power tracking, a nonlin-
ear controller based on energy based Lyapunov function is designed. The nonlinear
controller is then modified to distribute control between hydraulic and pneumatic
components according to its bandwidth capability. As a result, the liquid-piston air
compressor/expander will loosely maintain the accumulator pressure ratio while the
down-tower hydraulic pump/motor accurately tracks the required generator power.
The control scheme also allows the accumulator to be used as a damper of the stor-
age system by absorbing the power disturbance in the hydraulic path generated by
the gusting wind. A set of simulation case studies demonstrate the operation of the
combined system with nonlinear controllers and demonstrate how the system can be
used for load balancing, minimizing electrical systems and maximizing benefits. [21]

16
1.5 Research Needs
In general, every industrial facility is unique in its way. Whether it is the facility
type, size, and the type of equipment it has. However, majority of these facilities
include a compressed air system. This shows how much the system is utilized, and
that any potential improvement could have a high impact on the entire sector. To
have a better understanding of this system, more in-depth analysis needs to be done.
It is important to know what makes up the air compressor system, what components
are involved and are dominant energy consumers. The other thing to consider is the
type of parameters that affect the energy system energy consumption. By answering
these questions, one would be able to identify potential improvement opportunities.
Multiple energy saving measures are identified to address air compressor systems,
and provide means to cut back the energy usage. For example, reducing pressure
set point and utilizing outside air intake in colder temperatures are two common
recommendations. Facilities tend to set the air compressor higher than what the
plant demand requirement is. This could be due safety factors, lack of knowledge, or
not realizing the set pressure impact on the system. Utilizing outside air intake in
colder temperatures is a great of way of reducing the compressor work. Since colder
air is denser, it will require less work to compress. These two recommendations are
common, but they are currently addressed in a way that only consider the work
reduction by the air compressor. What if they have more impact on the rest of the
system? Will this be realizing more energy savings? How is it affecting the other
system components? And is it worth looking into?
Many papers and textbooks have been published in the area of compressed air
modeling. This includes modeling of air power, air consumption, and energy con-
sumption. However, none of these focus on the individual components of the system.
This is an important gap because different system losses are happening at these com-
ponents such as pressure loss and heat loss. By knowing such information, one would
be able to see what component is a major energy contributor. This will draw a better

17
picture on how the system is operating, what parameter inputs are essential. The
other area that will need to be investigated is the impact on different energy sav-
ing recommendations on the air compressor system as a whole, including all of its
components. This could result in realizing higher energy savings.
In this research, modeling of the individual component is done, which would help
to optimize overall system energy consumption. The model evaluates the system from
the moment ambient air is entered, till it gets stored in a receiver tank. By identifying
and investigating four process parameters, the energy efficiency of individual compo-
nents, along with the overall system, were calculated. Also, effectiveness method was
created. This targeted the two energy savings measures discussed earlier, with the
ability to explore more measures.
1.6 Research Goals
The goal of this research is to optimize the energy consumption of an air com-
pressor system by using models of various elements of the compression system. The
models are based on various parameters such as pressure, temperature, and flow
rate. It focuses on rotary screw compressors and refrigerant dryers since these are
the most common types used in industrial sector. The system considered only one
air compressor, with a capability of future expansion. The model was created using
Excel file that will allow the user to input various data and show the total energy
consumption of the system. The models considered both ideal and real cases. Ideal
case was defined as the energy consumption of the system without considering any
system losses such as pressure loss. Real case was defined as the energy consumption
of the system including pressure and heat loss. Four process parameters including
Air Power, Pressure, Temperature and Flow Rate were addressed in each case. The
value of these parameter was calculated at each component stage.
18
List of research goals:
• Create overall air compressor energy model. This model investigate four process
parameters (Flow Rate, Air Power, Pressure and Temperature).
• Create pressure loss models.
• Create effectiveness methods to determine the accuracy of the current energy
savings measures calculations.
• Calculate efficiency of individual system components along with the overall
system efficiency.
1.7 Research Boundaries
The research defined compressed air system from the time air enters the compres-
sor all the way until it is stored in the receiver tank. It will also consider the piping
layout for pressure drop due to friction loss. Fluctuation of demand from the plant
side was not considered in this study. This study assumed no pressure drop from
leakage within the system. The control parameters of the system are addressed in
chapter 2. Figure 2.1 shows parameter inputs and outputs in each component.

19
2. METHODOLOGY
Figure 2.1 displays the various components in the compressed air system that were
considered in the model, including inputs and outputs. The models focused on four
main process parameters: Volumetric Flow Rate (Q), Pressure (P ), Temperature
(T ), and Air Power (E). These are the main four parameters that impact the energy
consumption and identifies air quality. The input parameters were labeled with a
number (1, 2, 3, 4, 5), and the output were labeled with a number prime (1′, 2′, 3′, 4′)
for each component. The compressor and refrigerant dryer required work inputs
W1,W2.H1, H2, H3 which represented the heat loss in the process due to temper-
ature changes. Tables 2.1 and 2.2 list the parameter changes in each component,
whether it increases, decrease, or stays constant.
Table 2.1.Parameter Changes in Components for Ideal Model.
Air compression in the lubricant-injected rotary screw compressor is actually rapid
and this makes it near an adiabatic process [10]. The theoretical work by the com-
pressor shaft (W1) was calculated using Equation 2.1 [10]:
W1 = (i+1)k(k−1) × QmRTa((
PPa
)k−1
(i+1)k − 1) (2.1)

20
Table 2.2.Parameter Changes in Components for Real Model.
Fig. 2.1. Energy Flow Diagram of a Compressed Air System.
R-22 was considered as refrigerant dryer work is calculated using Equation 2.2.
W2 = Qm(h2 − h1) (2.2)
Air power is the available energy rate of compressed air, which is a relative energy
compared with the energy of uncompressed air at the atmospheric state. When the

21
temperature of compressed air is not equal to the atmospheric temperature, air power
was calculated using Equation 2.3, [10].
E = PaQa(lnP
Pa
+k
k − 1(T − TaTa
− ln TTa
)) (2.3)
Considering air as an ideal gas (PV = mRT , PaQa = QmRTa) the Equation 2.3
can be written in terms of mass flow rate as shown in Equation 2.4 [22],
E = QmRTa(lnP
Pa
+k
k − 1(T − TaTa
− ln TTa
))) (2.4)
In the adiabatic process there is no heat loss and the isotonic equation [10] was
used for volumetric flow rate calculation as shown in Equation 2.5:
Qout
Tout=Qin
Tin(2.5)

22
3. TERMINOLOGY
Efficiency and effectiveness parameters were used to evaluate the effect of the indi-
vidual subsystem on overall system energy performance. Efficiency (η) is the overall
efficiency of a system and is defined in Equation 3.1, which is equal to the energy
consumption of the entire system (real) divide by the total energy consumption of
the system (ideal).
η =Ereal
Eideal
(3.1)
”Ereal” is the total system energy consumption based on data which is summa-
tion of ideal case plus energy losses through system. This value was obtained using
theoretical energy equations for each component to find the total energy output, plus
considering efficiency of the motors and the pressure drops of the different compo-
nents. ”Eideal” is the total system energy consumption based on rated data and using
theoretical energy equations for each component to find the total energy output.
A new parameter called Effectiveness (ε) was introduced for evaluation of the sys-
tem. Effectiveness is the potential amount of energy saving for each recommendation
of the system and it is given in Equation 3.2. For example, reducing set pressure, this
will calculate the proposed total energy consumption considering the pressure losses.
The larger the effectiveness value, more impact it has on the overall system.
ε = 1− Eproposed
Ereal
(3.2)
where ”Eproposed” is proposed energy consumption of the energy saving recommen-
dation following ”Ereal”. The effect of potential recommendations using thermody-
namics modeling are discussed in the following sections.

23
3.1 Pressure Loss Models
The pressure drop models were created using experimental data from the com-
ponents manufacturers provided in the data sheets. Specific type of after-cooler, air
dryer, and filter were chosen to complete the models.
3.1.1 Aftercooler
Figure 3.1 shows the pressure drop model for an after-cooler. These are experi-
mental data points from the after-coolers manufacturer [23]. Equations 3.3 and 3.4
shows the linear regression equation of this set of points for SI and English units
respectively.
dP = 8× 10⁻⁵Q+ 1.586 (3.3)
dP = 1163.5×Q+ 10935 (3.4)
3.1.2 Refrigerant Air Dryer
Figure 3.2 shows the pressure drop model for a refrigerant air dryer. These are
experimental data points from the refrigerant air dryers manufacturer [24]. Equations
3.5 and 3.6 shows the linear equation of this set of points for SI and English units
respectively.
dP = 0.0004×Q+ 2.336 (3.5)
dP = 5637.15×Q+ 16106 (3.6)

24
Fig. 3.1. Pressure Drop Model for Aftercooler.
3.1.3 Filter
Table 3.1 shows various grades of air filters with the estimated dry and wet pressure
drop in each [25].
Table 3.1.Estimated Pressure Drop in an Air Filter.

25
Fig. 3.2. Pressure Drop Model for Refrigerant Air Dryer.
3.1.4 Pipe Pressure Loss
A pressure drop theoretical analysis was created considering Blasius and Prandtl
formulations, Equation 3.7 [26]. A pressure drop study was conducted for several pipe
types including Schedule 40 Steel, Type K Copper, Type L Copper, and Schedule 10
Stainless Steel. Table 3.2, 3.3, and 3.4 show the ranges of pressure loss of various
pipe material for common pipe sizes using Equation 3.7. Since pipe diameter size
vary among systems, nine diameter sizes were considered. The pipe length is set at
100 ft (30.5 m) and nominal pressure at 50 psi (344,738 Pa), 100 psi (689,476 Pa)
and 150 psi (1,034,214 Pa) which are common in industry. In these tables, a pressure
drop above 15 psi (103,421 Pa) is in general not relevant in industry and the formula
may not be valid.
dP = 7.57×Q1.85 × L× 104
D5 × 0.01P(3.7)

26
Table 3.2.Pressure Loss for Different Pipe Types at Different Pipe Sizes at aPressure of 50 psi (344,738 Pa) and Pipe Length of 100 ft (30.5 m).
Table 3.3.Pressure Loss for Different Pipe Types at Different Pipe Sizes at aPressure of 100 psi (689,476 Pa) and Pipe Length of 100 ft (30.5 m).
3.2 Efficiency
In compressed air system energy analysis, usually just the motor efficiency of the
air compressor is considered and the other components of the system are neglected.
So, to be able to find out the efficiency of the entire system, one needs to examine
each individual component and find out how the other sub-system affecting the work

27
Table 3.4.Pressure Loss for Different Pipe Types at Different Pipe Sizes at aPressure of 150 psi (1,034,214 Pa) and Pipe Length of 100 ft (30.5m).
done by the system. Using the modeling Equations 2.1-2.5, and assumption listed in
Table 3.5, Table 3.6 was generated for ideal model using k = 1.4. It is the ideal model
in which no losses were taken into account. Every variable is calculated at different
states (refer to Figure 2.1). The set pressure for this model was 105 psi (729,950 Pa).
Table 3.5.Assumptions for Calculation of Ideal and Real Models.

28
a : T1 = 513.9K using T = Ta(PPa
)( k−1k
derived from adiabatic equation
b : T1′ = 328K For the isotonic process, the air is typically cooled by 50 ∼ 60◦C
from the atmospheric temperature (0◦C). For this application, 55◦C is assumed
(55+273 = 328 K) [27]
c : T2′ = 301.3K [28]
Table 3.6.Ideal Model Results at a Set Pressure 105 psi (723,950 Pa).
In this model, the atmospheric temperature was calculated using experimental
data, while flow rate used compressor data sheet. For the other states, the rest values
were calculated using thermodynamic equations.
To calculate the Real case, similar approach was made including the pressure drop
models for after-cooler, filter, dryer along with the pressure drop due to pipe friction
loss and k = 1.383 [28] as shown in Table 3.7. The total pressure drop is the sum
of all the pressure drops in the system, which is equal to 5.3 psi (1.6+0.7+2.4+0.6)
(36542 Pa). The pressure drop in the pipe was considered to be 0.6 psi which is for
500 ft pipe (152.4 m) with diameter of 2′′. Therefore, is equal to 120,891 J/s when
considering the total pressure drop and motor efficiency. The rate of work, W2 (dryer)
is equal to 532.6 J/s by using the enthalpy values and the mass flow rate of 0.0578
m3/s, and a motor efficiency of 95%.

29
In table 3.8 represent the ideal and real models with efficiency at each stage. The
Real part has lower air power than the Ideal, which means there was less energy
stored in the air. This is logical since the Real part considers pressure drops, motor
efficiency, and lower air index. This is true for all components except between stages
1′ and 2, where air exits the first inter-cooler. The reason for higher air power in the
Real part for these two stages (1′ and 2) is lower air index (k) values which are 1.383
and 1.4 respectively. Furthermore, real part efficiency is 95.9% due to considering
motor efficiency and a lower air index (k). When considering losses due to pressure
drop, the compressors work efficiency drops down to 92.9%.
Table 3.7.Real Model Results at a Set Pressure 105 psi (723,950 Pa).
The total theoretical efficiency of the system is equal to:
ηelec=95.9%
ηmech = η1× η1′ × η2× η2′ × η3× η3′ × η4× η4′ = 93.2%
ηtotal = ηelec × ηmech = 89.3%
Figure 3.3 shows a block diagram of the compressing air sub-systems and the
estimated energy consumption of each component. The ambient air enters the com-
pressor where the most of energy is being consumed. Then, it cools down using an

30
Table 3.8.Ideal vs Real Models and Each Stage Efficiency.
inter-cooler. As we can see, a big portion of energy is being transferred as heat loss
due to temperature drop. Air continues to flow through a second cooling medium
(after-cooler). Then, after being filtered, it flows through a refrigerant dryer to en-
sure a specific dew point. The final stage is the receiver tank, where it gets stored for
future use. Figure 3.3 states the estimated energy consumption at each component.
As shown, majority of the energy consumption is happening at the compressor and in-
tercooler. At the compressor, the pressure and temperature are increasing drastically,
thus high energy consumption is required. In the after cooler, there is a temperature
drop of 50◦C to 60◦C. The rest of the components affect the energy stored in the air
minimally, and thus might not have a big room of potential improvement.
3.3 Effectiveness
Effectiveness is another parameter used for evaluation of air compressor sub system
energy consumption. Each energy saving recommendation has an effectiveness on the
compressed air system, not just the air compressor, but each individual component
of the entire air compressor system. This will be explored further in the following

31
Fig. 3.3. Compressed Air Sub-System Block Diagram and EstimatedEnergy Consumption Percentage.
section, by looking at various energy saving recommendations including: reducing set
pressure and using outside air temperature for compressor intake.
3.3.1 Reduce Compressor Set Pressure
Having a set pressure higher than the required demand pressure is very common
in facilities. This action usually happens to avoid any issues with not having enough
pressure for the machines, or simply because the plant is not aware of its actual
requirements. Thus, reducing the air compressors set pressure based on the required
demand is a typical energy saving recommendation. The reduction of the compressors
operating pressure reduces its load and operating horsepower, otherwise known as
brake horse power. The cost penalty for operating the system at a high pressure was
found using fractional savings.
The fractional savings for operating the compressor at a reduced upper activation
pressure, Pl2, compared to a high upper activation pressure, Ph2, when the inlet air
pressure is P1, can be calculated using Equation 3.8 [29]:
Fractional Savings =(Ph2
P1)0.286 − (Pl2
P1)0.286
(Ph2
P1)0.286 − 1
(3.8)

32
In this case, we will be consider a set pressure of 105 psi, and a proposed pressure
of 90 psi. Fractional savings after reducing the air compressor discharge pressure from
105 psi to 90 psi would be:
Fractional Savings =(105+14.7
14.7)0.286 − (90+14.7
14.7)0.286
(105+14.714.7
)0.286 − 1= 8.33%
So, there is a saving of 8.33% in current energy consumption by lowering the
set pressure to desired value. However, this only considers work done by the air
compressor. In fact, the effectiveness will be higher than these savings if we consider
the Real model created.
Table 3.9 is similar to table 8 which is generated for real model at pressure of
90 psi (620,528Pa). Work proposed is equal to 109,689 J/s when considering the
pressure drop in components. If the flow rate is increased, the pressure drop would
also increase in the after-cooler and dryer since the pressure drop models for these
two components is the function of flow rate. Therefore, effectiveness is equal to:
ε = 1− EProposed
EReal
= 1− WProposed
WReal
= 1− 109, 689
120, 891= 9.3%
This shows that the effectiveness of this recommendation is higher on the system than
just calculating the energy savings when looking at each individual component. This
was tested for multiple set pressures drop as shown in Figure 3.4.
Based on Figure 3.4, taking this specific case, Figure 3.5 shows the effectiveness
of reducing the set pressure and impact on annual energy consumption by the air
compressor system.
3.3.2 Using Outside Air for Air Compressor Intake
Outside air is cooler and denser than indoor air during cooling degree days (CDD).
By utilizing the outside air as the air compressor intake, the energy requirement can
be reduced. Thus, the work required to reach a certain operating pressure decreases,
i.e. less energy to produce the same operating pressure. Due to the excess heat

33
Table 3.9.Model Results for a Set Pressure 90 psi (620,528Pa)
Fig. 3.4. Reducing Set Pressure Effectiveness.

34
Fig. 3.5. Energy Savings (kWh) vs Pressure Drop (PSI).
produced from within the plant, it would be beneficial to use outside during CDD.
The compressor work for the usual operating conditions in manufacturing plants
is proportional to the absolute temperature of the intake air. Thus, the fractional
reduction in compressor work, WR, resulting from lowering the intake air temperature
is estimated using equations (14-15) [1]:
WR = WI − WO
WI(3.9)
WR =TI − TO
TI(3.10)
The range of air intake temperature was tested for both work reduction, and
compared to the model which the results were close since this action mainly affects
the work done by the air compressor.

35
Table 3.10.Results for Different Air Intake Temperatures with a Base Temperature of 293 K
Fig. 3.6. Outside Air Compressor Air Intake Effectiveness.

36
This will determine the air discharge temperature from the air compressor. How-
ever, the slight difference in the model is due to the heat loss in each component.
The effectiveness was calculated using air power, E in the final stage at the receiver
tank. Table 3.10 and Figure 3.6 show the results of each proposed intake air temper-
ature, and the difference between the work reduction and model effectiveness. Thus,
higher the temperature difference would result to higher effectiveness due to heat
losses among components.

37
4. RESULTS VALIDATION
To validate the model, the Ideal case was compared to the Real case for three different
case studies. The goal was to collect experimental data that will to validate the model
and determine model accuracy. The temperature and pressure parameters were ad-
dressed. The expectation was to have model parameters match these measurements.
Data was collected using current, temperature and pressure sensors. Current (amps)
data was used to calculate the Demand Draw, while temperature and pressure values
were used as inputs in the model. The actual air compressors work was compared
to the Real case model. This identified the experimental efficiency of the system.
Theoretical and experimental efficiencies were calculated to find the uncertainty. The
uncertainty indicated model accuracy.
4.1 First Case Study
The first case study was performed at a die casting company. The current and
pressure were measured for a 200 HP air compressor. Current sensors were connected
to the air compressor and air dryer to calculate Demand Draw. Pressure sensors were
connected at the receiver tank and down the line to collect pressure data. Figure
4.1 shows the compressed air system layout at a die casting company. It also shows
exactly where the different sensors are connected. The temperature and relative
humidity sensor (T, RH) was placed next to the compressors air intake. Current
transducers (CT) were connected to the air compressor and refrigerant dryer. Pressure
transducers (PT) were connected at the line before the air entered the first receiver
tank, and down the line next to a second receiver tank.
Table 4.1 states the data sheet information of the air compressor. This was ob-
tained using CAGI data sheets. The data is included to give a better understanding

38
Fig. 4.1. Compressed Air System Layout.
on the compressor ratings. Figure 4.2 is the actual nameplate of the compressor, to
prove the values in Table 4.1. Finally, Figure 4.3 is the nameplate associated with
the air dryer.
Table 4.1.Air Compressors Data Sheet Information.
The sensors were connected on December 8th, 2016. The data was extracted on
Feb 3rd and July 20th of 2017. Results are described below.

39
Fig. 4.2. Air Compressors Name Plate Information.
Results:
Average Compressors Current: 234.2 A
Average Dryers Current: 3.6 A
Average Temperature: 68◦F
Average Relative Humidity: 32%
First Average Pressure: 105 PSI
Second Average Pressure: 97 PSI
The set pressure is 105 psi (723,950 Pa) and the average current draw was 234
amps. The demand draw of the air compressor can be calculated using the Equation
4.1:
Demand Draw =I × V ×
√3× PF
1000= 158.6kW (4.1)

40
Fig. 4.3. Air Dryers Name Plate Information.
By comparing the collected data to the Real model results (Wreal = 120.9kW ),
we get:
Efficiency of the System =120.9kW
158.6kW= 76.2% (4.2)
Using values from Table 3.8, the total theoretical efficiency of the system is equal
to: ηelec=95.9%
ηmech = η1× η1′ × η2× η2′ × η3× η3′ × η4× η4′ = 93.2%
ηtotal = ηelec × ηmech = 89.3%
When the theoretical efficiency (89.3%) and experimental efficiency (76.2%) are
compared, the model accuracy is equal to the ratio of experimental efficiency and
theoretical efficiency which is 85.3%. This means the model has uncertainty ∼ 15%.

41
4.2 Second Case Study
The second case study is a metal parts manufacturer. The current and pressure
were measured for a 100 HP air compressor. The set pressure was 115 psi. The
average current draw was 90.3 amps. The demand draw of the air compressor is 74.6
kW. By comparing the collected data to the Real model results (Wreal = 66.7 kW),
the efficiency of the system was calculated.
Efficiency of the System =66.7kW
74.6kW= 89.4% (4.3)
When the theoretical efficiency (90.5%) and experimental efficiency (89.4%) are
compared, the model accuracy is 98.7%. This means the model has uncertainty ∼ 1%.
4.3 Third Case Study
The third case study is a metal parts manufacturer. The current and pressure
were measured for a 75 HP air compressor. The set pressure is 115 psi. The average
current draw was 75.3 amps. The demand draw of the air compressor is 53.2 kW.
By comparing the collected data to the Real model results (Wreal = 49.5 kW), the
efficiency of the system was calculated.
Efficiency of the System =49.5.7kW
52.3kW= 94.6% (4.4)
When the theoretical efficiency (90.5%) and experimental efficiency (94.6%) are
compared, the model accuracy is 95.6%. This means the model has uncertainty ∼ 4%.
Table 4.2 show the results summary of the three different case studies. Demand
Draw was calculated using the average current (amps) value that was collected using
current sensor. This sensor was connected directly to the air compressor. The voltage
and power factor values were set at 460V and 0.85 respectively. The model uncertainty
ranged from ∼ 1% to ∼ 15%. Multiple reasons could have caused this wide range

42
Table 4.2.Case Studies Summary.
such as compressor capacity, facility type, and the compressor load while the sensor
data was collected.

43
5. DISCUSSION
The compressed air system is such a unique and complicated system. So many factors
affect the quality and outcome of this system. It is difficult to track down what is
causing system losses. The energy model developed in this research provides the tool
to dissect each component and study the parameters that have the highest impact
on the system. These process parameters include Air Power, Pressure, Tempera-
ture and Flow Rate. The model was created based on rotary screw compressor and
refrigerant air dryer. These are common among small/mid-sized industrial sector.
Process parameters (Air Power, Flow Rate, Temperature, and Pressure) are common
across other types of compressors and dryers. However, model might have a higher
uncertainty of other compressor and dryer types are used. By applying the Ideal and
Real cases, efficiency was calculated for individual components as well as the overall
system. Theoretical and experimental efficiency were looked into to identify model
accuracy. Part of the energy model was based on the pressure loss models for dif-
ferent components including aftercooler, filter, dryer and pipe losses. The flow rate
was the indicating variable to find out what are the system pressure losses in the
components. There were no pipe pressure loss between the components due to the
short pipe length. It will only be effective to consider pipe loss when looking into pipe
length greater than 500 ft. Three different case studies were investigated to validate
the models. The first case study was the main focus in this project. Some of the
challenges regarding this case were:
1. Three air compressors and two air dryers connected in one system, and they
alternated based on the air demand. This caused some fluctuation in the data.
The focus was on just one air compressors and one air dryer to avoid complica-
tions.

44
2. It was impossible to implement pressure and temperature sensors after each
component (aftercooler, filter, and air dryer), so this caused some inaccuracy in
the model especially when calculating the output pressures and temperatures.
Assumptions had to be made based on literature and alternative case studies.
Assumptions included input atmospheric flow rate and change in temperature
within the intercooler and aftercooler.
3. Some changes in the plant happened during the data collection phase.
4. The facility did not have any information regarding the system except an audit
report that was done 5 years ago.
These challenges slowed down the data collection process and caused some mathe-
matical errors. To improve results and model accuracy, experimental data need to be
collected after each component by addressing main process parameters such as pres-
sure, temperature and flow rate. Other parameter that could be explored would be
humidity. Humidity plays role in air quality, the more humid the air flowing through
the system is, and the higher the pressure drop will be occurring.
Results for the three case studies proved model uncertainty varying from 1%
to 15%. This gave a close illustration of the system performance. However, more
experimental data at specific system terminal would result and in a more accurate
model.
Finally, effectiveness method created was applied on two major energy conser-
vation measures. The first being reducing system set pressure. This proved that
fractional savings methodology used by the Department of Energy to quantify such
savings only account for compressor work savings. In fact, this measure impact the
rest of the system and results in higher energy savings due pressure and heat loss. In
this method, it was assumed that there was no system leakage. The second energy
saving measure investigated was using outside air for compressor intake. The work
reduction methodology used by the U.S. Department of Energy to quantify savings
proved to be overestimating the savings. Effectiveness method provides more accu-

45
racy on quantifying energy savings, and thus more realistic. In future, the goal is
to see if we can predict more accurate savings for different energy saving measures.
This will help the industry build the confidence in investing in such energy saving
techniques.
To sum up, it has been great working on this research since I was able to get a
better understanding of the air compressor system as whole. Being able to investi-
gate individual components and deciding what parameters are affecting the energy
consumption. Inputs and outputs of each component illustrates a good picture of
the change process inside the component. Looking at efficiency values helped realize
what components should be focused on for potential room of improvement. Hav-
ing the ideal case and experimental data was the best way to validate the model.
Measurements reflect real scenarios. Real applications can widely vary from ideal
cases. Real applications are case-specific. So models created can perform better from
case to another. The most important thing is to truly understand the concept and
basis of what this model was built in. This topic proved that there will always be
future work that can be done to enhance the research. Identifying and realizing these
opportunities is one step closer to an ideal application.

46
6. CONCLUSION
Compressed air systems are major energy consumers in industrial plants. It is con-
sidered to be a complicated system due to many outside factors that have a big effect
on its efficiency. It is important to know how much energy this system is estimated
to consume and how much it is actually being consumed. The model discussed in
this thesis allows the user to calculate the Ideal energy consumption of the system,
and compare it to the Real case taking into account pressure drops and heat loss
within individual components. Having the air power change data due to different
inputs and output within components helps in pointing out the potential problems
and optimizing the overall system efficiency. The model results proved to be 85%
- 97.8% accurate when tested for three case studies. Real system applications are
usually less efficient due to factors such as equipment age, dirt, and heat loss. The
best way to validate this model is to have sensors that would monitor all the parame-
ters entering and exiting each component. The efficiency of each component is based
on the input and output air power. In this study, the efficiency of the compressor,
intercooler, aftercooler, filter, and air dryer were 95.9%, 100%, 99.2%, 98.9%, and
97.7% respectively. Potential improvement can be made on the compressor and dryer
components. This is reasonable since these two components apply motor work.
The effectiveness of two energy saving recommendations was calculated to show
the impact on the entire system not just the air compressor. Effectiveness showed
that more energy could be saved than what is usually calculated in Reducing Set Pres-
sure recommendation. Also, effectiveness showed that the Work Reduction method
to calculate percent savings in Using Outside Air Intake recommendation is over es-
timating work reduction percentage. This means that there is actually less energy
savings than what was calculated in the Word Reduction method.

47
6.1 Future Work
For the future, pressure and temperature sensors should be implemented after
each component such as aftercooler and air dryer, to get more readings throughout
the system that would result in a higher accuracy model.
Second, expanding project boundaries by including distribution line and individual
end-users. This will lead into exploring pressure losses at the pipe level, fittings, and
air leaks. Also, different compressor and air dryer types should be explored.
Finally, the effectiveness of other recommendations could be looked at such as:
1. Installing local air receivers for end-users with higher and frequent demands.
Air volume could decrease and pressure could drop especially in the end-user is
located towards the end of the pressure line. This will require the compressor to
work more to make up for these losses and thus have higher energy consumption.
Installing local air receiver will help eliminate this problem.
2. Providing additional compressed air receiving tank capacity to reduce frequent
compressor cycling.
3. Providing wet compressed air receiving tank before the dry tank. This will help
the improving air quality, removing moisture and lubricants, and thus reducing
the work on air dryer. This will also help reducing pressure drop at different
system components.
4. Upgrading to premium efficiency electric motors. Increasing motor efficiency
should help reducing the compressor work.
5. Installing a dehumidifier at compressor intake. This will help improving air
quality before entering the air compressor, and thus require less work by the
compressor to reach the desired air pressure.

REFERENCES
48
REFERENCES
[1] C. Beals, J. Ghislain, H. Kemp et al., “Improving compressed air system perfor-mance,” US Department of Energy, 2003.
[2] U.S Department of Energy Energy Star, Determine the Cost ofCompressed Air for Your Plant, 2016 (accessed October 9, 2016),https://www.energystar.gov/ia/business/industry/compressed air1.pdf.
[3] R. Prakash and R. Singh, “Mathematical modeling and simulation of refrigerat-ing compressors,” International Compressor Engineering Conference, pp. 274–285, 1974.
[4] G. Maxwell, “Dynamic simulation of compressed air systems,” ACEEE SummerStudy on Energy Efficiency in Industry, pp. 146–156, 2003.
[5] Rotary Screw Air Compressors, 2016 (accessed November 12, 2016),https://en.wikipedia.org/wiki/Rotary-screw compressorcite note-3.
[6] CAGI. Preformance Verification: Data Sheets, 2017 (accessed March 13, 2017),http://www.cagi.org/performance-verification/data-sheets.aspx.
[7] B. J. Abels and K. Kissock, “Optimizing compressed air storage for energy ef-ficiency,” SAE International Journal of Materials and Manufacturing, vol. 4,no. 1, pp. 477–485, 2011.
[8] J. Tuhovcak, J. Hejcık, M. Jıcha, and L. Snajdarek, “Experimental validation ofmathematical model for small air compressor,” in EPJ Web of Conferences, vol.143. EDP Sciences, 2017, p. 02133.
[9] R. Saidur, N. Rahim, and M. Hasanuzzaman, “A review on compressed-air en-ergy use and energy savings,” Renewable and Sustainable Energy Reviews, vol. 14,no. 4, pp. 1135–1153, 2010.
[10] Y. Zhang, M. Cai, and D. Kong, “Overall energy efficiency of lubricant-injectedrotary screw compressors and aftercoolers,” in Power and Energy EngineeringConference, 2009. APPEEC 2009. Asia-Pacific. IEEE, 2009, pp. 1–5.
[11] M. Yang, “Air compressor efficiency in a vietnamese enterprise,” Energy Policy,vol. 37, no. 6, pp. 2327–2337, 2009.
[12] G. Quartarone, N. Anglani, and T. Facchinetti, “Improving energy managementof electrically driven air compressors through real-time scheduling techniques,”in IECON 2011-37th Annual Conference on IEEE Industrial Electronics Society.IEEE, 2011, pp. 2780–2785.
[13] S. Mousavi, S. Kara, and B. Kornfeld, “Energy efficiency of compressed air sys-tems,” Procedia Cirp, vol. 15, pp. 313–318, 2014.

49
[14] C. Schmidt and J. K. Kissock, “Power characteristics of industrial air compres-sors,” Texas A&M University, pp. 1–2, 2003.
[15] B. Gopalakrishnan, D. Gupta, Y. Mardikar, S. Chaudhari, and J. Jadeja, “Di-agnostics for developing energy efficiency measures in compressed air systems,”SAE Technical Paper, Tech. Rep., 2007.
[16] M. Fujiwara, K. Kasuya, T. Matsunaga, and M. Watanabe, “Computer modelingfor performance analysis of rotary screw compressor,” International CompressorEngineering Conference, pp. 536–543, 1984.
[17] R. G. Kent, “Application of basic thermodynamics to compressor cycle analysis,”International Compressor Engineering Conference, pp. 291–296, 1974.
[18] M. Benedetti, I. Bertini, F. Bonfa, S. Ferrari, V. Introna, D. Santino, and S. Uber-tini, “Assessing and improving compressed air systems energy efficiency in pro-duction and use: findings from an explorative study in large and energy-intensiveindustrial firms,” Energy Procedia, vol. 105, pp. 3112–3117, 2017.
[19] R. Dindorf, “Estimating potential energy savings in compressed air systems,”Procedia Engineering, vol. 39, pp. 204–211, 2012.
[20] A. McKane, “Improving energy efficiency of compressed air system based onsystem audit,” Lawrence Berkeley National Laboratory, pp. 1–2, 2008.
[21] M. Saadat, F. A. Shirazi, and P. Y. Li, “Modeling and control of an open accu-mulator compressed air energy storage (caes) system for wind turbines,” AppliedEnergy, vol. 137, pp. 603–616, 2015.
[22] A. Ayoub, A. Razban, and J. Chen, “Modeling of industrial air compressorsystem energy consumption and effectiveness of various energy saving on thesystem,” Proceedings of ECOS 2018 -The 31Th International Conference on ef-ficiency, optimization, simulation and environmental impact of energy systems,Guimaraes, Portugal, pp. 4–5, 2018.
[23] Ingersoll-Rand, Air and Water Cooled Aftercoolers, 2017 (accessed February 17,2017), http://www.ingersoll-rand.gr/downloads/aftercoolers.pdf.
[24] iCP. iDRY, Premium Refrigerated Air Dryer, 2017 (accessed February 17, 2017),http://www.icpcompressors.com/idry prd.php.
[25] iCP, Threaded Coalescing and Particulate Filters, 2017 (accessed February 17,2017), http://icpcompressors.com/cmsfiles/brochures/2015 Brochure ICP%20iPUR%20Threaded%20Filters Tech.pdf.
[26] M. Carello, A. Ivanov, and L. Mazza, “Pressure drop in pipe lines for compressedair: comparison between experimental and theoretical analysis,” WIT Transac-tions on Engineering Sciences, vol. 18, 1970.
[27] S. Nowacki, “Aftercooler temperature balance for air compressors in plant airservice,” International Compressor Engineering Conference, pp. 341–347, 1976.
[28] Ingersoll-Rand Company and A. Loomis, Compressed air and gas data. TheCompany, 1980.

50
[29] K. Kissock, “Modeling and simulation of air compressor energy use,” in ACEEESummer Study on Energy Efficiency in Industry, vol. 1, no. 13, 2005, pp. 131–142.