modeling of flow-induced crystallization of colored...
TRANSCRIPT

Korea-Australia Rheology Journal September 2010 Vol. 22, No. 3 151
Korea-Australia Rheology JournalVol. 22, No. 3, September 2010 pp. 151-162
Modeling of flow-induced crystallization of colored polypropylene in injection molding
Rong Zheng1,*, R. I. Tanner
1, D. Lee Wo
1, Xi-jun Fan
1, C. Hadinata
2, F.S. Costa
2,
P.K. Kennedy3, P. Zhu
4 and G. Edward
4
1School of Aerospace, Mechanical and Mechatronic Engineering, The University of Sydney, NSW 2006, Australia2Autodesk Pty Ltd., 259-261 Colchester Road, Kilsyth, Melbourne, VIC 3137,Australia
395 Ormond Road, Elwood, VIC 3148, Australia4Department of Materials Engineering, Monash University, Clayton, VIC 3800, Australia
(Received November 19, 2009; final revision received February 8, 2010; accepted May 28, 2010)
Abstract
We present a study on flow-induced crystallization of an injection-molded isotactic polypropylene (iPP)mixed with colorant additives. Two types of blue colorants were used in the study: one is the ultramarineBlue composed of Sodium Alumino Sulpho Silicate (UB) and the other is the PV Fast Blue composed ofCu-Phthalocyanine (CuPc). The CuPc colorant exhibits increased nucleation of both quiescent and flow-induced crystallization, and results in more oriented microstructures, causing a high degree of anisotropyin material properties and shrinkage of the injection molded parts. In contrast, the nucleating effect of theUB colorant is negligible under the quiescent condition, but becomes notable in the case of short-term sheartreatment at high shear rates. The UB colorant does not significantly increase the degree of anisotropy ascompared with the virgin iPP. A flow-induced crystallization kinetic model is used in the numerical sim-ulation for the injection molding process, and predicted the colorant effects as observed in experiments.
Keywords : crystallization, colorants, injection molding, shrinkage, morphology
1. Introduction
In the last two decades, significant progress has been
made in the development of computer- aided engineering
analysis for injection molding. Recent efforts have focused
on linking the flow-induced crystallization (FIC) of semi-
crystalline materials to the processing and the resulting
material properties. In injection molding of semi-crystal-
line polymers, the molten polymer flow accelerates crys-
tallization and may induce an oriented “shish-kebab”
semicrystalline structure in the high shear rate regions
(Eder and Janeschitz-Kriegl 1997; Zuidema, et al., 2001).
Typically, the enhancement in polymer crystallization rate
crucially changes the flow and solidification behavior, and
the oriented microstructure leads to a local anisotropy in
thermal and mechanical properties, which can further
cause anisotropic shrinkage and hence enhanced warpage
of the injection-molded parts.
Most injection molding simulations use data obtained for
virgin materials, but to mould the parts, various colors are
typically added and these are known to affect the rheo-
logical and crystallization behavior of the processed poly-
mer, as reported by Silberman (1995), Hadinata et al.
(2008), Zheng et al. (2008) and Zhu et al. (2009). There is
still a lack of theory and methods for predicting these
effects.
It is generally believed that the colorants, as foreign par-
ticles, promote the heterogeneous crystallization of poly-
mers. Heterogeneous crystallization is activated on the
surface of the foreign particles, while the effectiveness of
the crystallization process depends on the surface patterns,
pigment sizes and degree of aggregation and dispersion.
Pigment particles come in a variety of forms, with primary
particle sizes in the range 0.01mm to 1mm and with vary-
ing degrees of combination into aggregates or agglomer-
ates, where the tightly packed aggregates reduce the
pigment surface area for a given loading, whereas the
loosely packed agglomerates do not affect the surface area
exposed when compared to that of the primary particles.
Given the vast variety of colorants, both in chemical and
physical properties, and in shape and geometrical arrange-
ment, to include all the details in the numerical modeling
is not straightforward, if not impossible. However, in a
practical computation, the basic kinetic model for materials
with and without colorants can remain the same, but the
model parameters should be carefully determined for each
colored polymer such that the nucleation and growth trends
are correlated with the colorant effects. We will use this
approach here. *Corresponding author: [email protected]© 2010 by The Korean Society of Rheology

Rong Zheng, R. I. Tanner, D. Lee Wo, Xi-jun Fan, C. Hadinata, F.S. Costa, P.K. Kennedy, P. Zhu and G. Edward
152 Korea-Australia Rheology Journal
2. Theory
2.1. Flow-induced crystallization kineticsFollowing the work of Kolmogoroff (1937) we first con-
sider an unrestricted growth of crystals and calculate a fictive
volume fraction. Let G denote the rate of growth of the spher-
ulite radius as a function of time. The volume of a phantom
spherulite, nucleated at the instant s and grown up to the
instant t, is given by . The shish-
kebab structure is represented by a cylindrical geometry. It is
assumed by Eder and Janeschitz-Kriegl (1997) that the lateral
growth rate is the same as the spherulite radial growth rate G,
unaffected by flow. Its volume is ,
where is the length of the shish at time t. Denoting the
number density of the quiescent nuclei by Nq and the flow-
induced nuclei number density by Nf , the unrestricted total
volume fraction of phantom crystals at time t is then given by
(1)
Here the first integral term on the right-hand side of the
equation is the quiescent contribution. The second integral
term is the contribution of the flow-induced crystallization,
where we introduce a two-value weight function ω:
if (2)
otherwise .
In Eq. (2), η is the shear viscosity, is the generalized shear
rate defined as , with
being the rate-of-deformation tensor, is the longest
Rouse time in the melt, is the shearing time, the inte-
gration gives the specific work done on the sheared poly-
mer, and is the critical specific work. Related to this is
the observation of Mykhaylyk et al. (2008) that the tran-
sition from isotropic spherulites to oriented shish-kebabs
takes place at a critical amount of work. The magnitude of
can be estimated by (Doi and Edwards 1986)
, where M is the molecular weight of the
high molecular weight chains, is the entanglement
molecular weight, and is the equilibration time. Lit-
erature data for and are available for iPP (van
Meerveld 2004): and s at T
=463 K, and time-temperature superposition is applied to
shift to other temperatures. Literature data for are
also summarized by van Meerveld et al. (2004)
In order to account for impingement, the fictive volume
fraction should be converted to the actual relative crys-
tallinity, α, which is also called the degree of space filling,
defined as the ratio of crystallized volume at a given time
to the total crystallizable volume. According to Kolmog-
oroff (1937) and Avrami (1939),
(3)
The growth rate of the spherulite radius G is calculated
by applying Hoffman-Lauritzen theory (Lauritzen and
Hoffman 1960)
(4)
where and are constants that can be determined by
experiments under quiescent conditions, is the acti-
vation energy of motion, often taken as a generic value of
6270 J/mol for iPP (e.g., Koscher and Fulchiron 2002),
is the gas constant, where is the glass tran-
sition temperature and is the degree of super-
cooling with being the equilibrium melting temperature
which is assumed to depend on pressure. The pressure
dependence is represented by a polynomial function as
(5)
where ai, are constants and can be determined
from the Pressure-Volume-Temperature diagram (Fulchi-
ron et al., 2001), and P is the pressure.
The quiescent nuclei number is assumed to take the form
, with H(t) being the Heaviside unit step func-
tion, zero for and unity for . In the isothermal case,
one has , with being the Dirac delta func-
tion concentrated at . Under quiescent and isothermal
conditions, Eqs. (1) and (3) lead to the familiar Avrami
equation:
(6)
According to Koscher and Fulchiron (2002), the value of
N0 has an exponential dependence on the degree of super-
cooling ∆T:
(7)
where aN and bN are constants to be determined experi-
mentally.
The flow-induced nuclei number takes the form:
(8)
where λN is a nucleation relaxation time which, according
to Eder and Janeschitz-Kriegl (1997), has a large value and
may vary with temperature, and f is a function of flow vari-
ables. Several expressions for the function f have been pro-
posed by different authors based on different assumptions
about the driving force for the enhancement of nucleation
(see, for example, Eder and Janeschitz-Kriegl, 1997;
Zuidema, 2001; Coppola et al., 2001; Koscher and Fulchi-
ron, 2002; Zheng and Kennedy, 2004; Dai et al., 2006).
Tanner and Qi (2005) and Pantani et al. (2005) have
reviewed various theories. This study follows the previous
work of Zheng and Kennedy, taking f as a function of the
flow-induced change in the dumbbell free energy, , via
υ1 s t,( ) 4π 3⁄( ) G u( ) uds
t
∫[ ]3
=
υ2 s t,( ) πls G u( ) uds
t
∫[ ]2
=
ls
ϕ t( ) N·q s( )υ1 s t,( ) s N
·f s( ) ωυ1 s t,( ) 1 ω–( )υ2 s t,( )+[ ] sd
0
t
∫+d0
t
∫=
ω 0= γ· 1 λR and ηγ2·
0
ts
∫⁄ dt wc>>
ω 1=
γ·
γ· 2DijDij= Dij 1 2⁄( ) ∂ui ∂xj ∂uj ∂xi⁄+⁄( )=
λR
ts
wc
λR
λR λe M Me⁄( )2=
Me
λe
Me λe
Me 4.4kg mol⁄= λe 3.54 108–×=
λe M Me⁄
α 1 exp ϕ–( )–=
G T( ) G0
U∗Rg T T∞–( )------------------------–
Kg T Tm
0+( )
2T2T∆
------------------------–expexp=
G0 Kg
U∗
Rg
T∞ Tg 30–= Tg
T∆ Tm
0T–=
Tm
0
Tm
0P( ) a0 a1P a2P
2+ +=
i 0 1 2, ,{ }∈
Nq N0H t( )=
t 0< t 0≥N·q N0δ t( )= δ t( )
t 0=
α t( ) 14π3
------N0G3t3
–⎝ ⎠⎛ ⎞exp–=
N0ln aN T bN+∆=
N·f
1
λN
-----Nf+ f=
Ff∆

Modeling of flow-induced crystallization of colored polypropylene in injection molding
Korea-Australia Rheology Journal September 2010 Vol. 22, No. 3 153
the conformation tensor , where H is the
spring elastic constant and Q is the end-to-end vector of a
FENE-P dumbbell, and kB is Boltzmann’s constant. The
reader is referred to the original paper for the model for-
mulations. It is instructive to recall the asymptotic behavior
of the driving force at the shearing flow. For low shear
rates, the change in free energy due to flow is
(9)
and for high shear rate, one has
(10)
where n0 is the number density of the molecules (a quantity
normally thought as being folded into a shear modulus that
can be estimated or measured), b is the FENE-P model
parameter (Detailed discussions on the parameter can be
found in Fan (1985). In this work we use b=5 for all cases),
and is the Weissenberg number, i.e., the generalized
shear rate multiplied by the polymer relaxation time.
The number density of active nuclei (Na) at the end of the
crystallization process can be estimated by
(11)
where N is the sum of the quiescent nuclei number density
and the flow-induced nuclei number density, i.e.,
(12)
and the final average volume of the spherulites and shish-
kebabs is
(13)
2.2. Effect of crystallinity on rheology Injection molding flows are dominated by viscometric
flow. The choice of different types of constitutive equa-
tions has only a minor influence on the flow kinematics
(with exceptions near corners, at the flow front, and in
regions of the mold with abrupt thickness variation), pro-
vided the shear viscosity is accurately described. In this
study we choose to use the generalized Newtonian fluid
constitutive model with a crystallinity-dependent viscosity,
η. The extra stress tensor is given by
(14)
Here we assume that the way crystallization affects rheol-
ogy can be described by the suspension theory, following the
idea of Tanner (2003). We express the viscosity ratio η/ηa by
(15)
where ηa is the viscosity of the amorphous phase, β and β1
are the fitting parameters, A is set to 0.44, corresponding to
rough and compact inclusions.
The resulting kinematics from the generalized Newto-
nian fluid will be used subsequently in a combination of a
FENE-P fluid model and a rigid dumbbell model to cal-
culate flow-induced free energy change, residual stresses
and orientation.
2.3. Effect of crystallinity on pressure- volume-tem-perature behavior
In the simulation of injection molding, understanding and
modeling of the pressure-volume-temperature (PVT) behav-
ior of the material is essential. The PVT behavior is usually
expressed in terms of the specific volume v as a function
of temperature T and pressure P. The particularity of PVT
behavior for semi-crystalline polymer is that the transition
region between the liquid and the solid states is strongly
influenced by the crystallization, thus the specific volume
should also be a function of the relative crystallinity. The
specific volume can be written as
(16)
where is the specific volume of the amorphous
phase, is the specific volume of the solid
semi-crystalline polymer, and is the ultimate absolute
crystallinity at the end of the solidification. Let denote
the specific volume of the pure crystalline phase, the spe-
cific volume of the solid polymer can be expressed by
(17)
As can be determined from the available PVT data,
the value of does not need to be used in this calculation.
The specific volumes and can be described by the
Tait equation,
(18)
where represents either or , C=0.0894 is a uni-
versal constant, and is given by
(19)
and is given by
(20)
2.4. Effect of crystallinity on thermal conductivityIn classical Fourier theory, thermal conductivity is
assumed to be constant or dependant on the temperature
alone. However, the theory is inadequate to describe the
heat conduction in deformed molten polymer, where the
thermal conductivity may depend on cooling rate and can
c H QQ kBT><=
Ff1
2---n0kBT
b
b 3+----------⎝ ⎠⎛ ⎞
2
Wi( )2≈∆
Ff1
3---n0kBT b 2–( ) Wi( )ln≈∆
Wi
Na N·t( ) 1 α t( )–[ ] td
0
ten d
∫=
N Nq Nf+=
VαNa
-----=
τij 2η γ· T P α, , ,( )Dij=
η γ· T P α, , ,( )ηa γ· T P, ,( )
---------------------------- 1α A⁄( )
β1
1 α A⁄–( )β------------------------ a A<,+=
v T P α, ,( )
v 1 α–( )va1–
αvs1–
+[ ]1–
=
va va T P,( )=
vs vs T P χ∞, ,( )=
χ∞
vc
vs 1 χ∞–( )va1–
χ∞vc1–
+[ ]1–
=
vsχ∞
va vs
vx v0 T( ) 1 C 1P
B T( )-----------+⎝ ⎠
⎛ ⎞ln–=
vx va vsv0 T( )
v0 T( )b1
a( )b2
a( )T b5–( ) for vx,+ va=
b1
s( )b2
s( )T b5–( ) for vx,+ vs=⎩
⎨⎧
=
B T( )
B T( )b3
a( )b4
a( )T b5–( )–[ ] for vx,exp va=
b3
s( )b4
s( )T b5–( )–[ ] for vx,exp vs=⎩
⎨⎧
=

Rong Zheng, R. I. Tanner, D. Lee Wo, Xi-jun Fan, C. Hadinata, F.S. Costa, P.K. Kennedy, P. Zhu and G. Edward
154 Korea-Australia Rheology Journal
also become anisotropic since the heat transport along the
polymer back chain is considered to be more efficient than
between neighboring chains. Moreover, the final conduc-
tivity may depend on the morphology after processing.
Thus one has to consider the non-Fourier law (Huilgol et
al., 1992). To account for anisotropy, the thermal con-
ductivity must be in tensor form as
(21)
where q (qi) is the heat flux and k (kij) is the thermal con-
ductivity tensor. Van den Brule (1989) suggested that, for
amorphous polymers, there might be the following con-
nection between the thermal conductivity tensor k and the
total stress tensor σ ( ):
(22)
where k0 is the equilibrium scalar thermal conductivity,
is the unit tensor, and Ct is the stress-thermal coefficient.
Dai and Tanner (2006) suggested that the same theory may
be used for sheared semi-crystalline materials, with an
enhanced value of Ct depending on the increased crys-
tallinity. The idea of Dai and Tanner was implemented by
Zheng and Kennedy (2006) in an injection molding sim-
ulation, but they also consider the dependence of k0 on
crystallinity. The following simple expression is assumed:
(23)
where α is the relative crystallinity, the superscripts (s) and
(a) denote the solid state and the liquid amorphous state,
respectively. The equilibrium scalar thermal conductivity at
the solid state and the liquid amorphous state, both as a
function of temperature can be measured experimentally.
The component of the thermal conductivity tensor in the
gap-wise direction, k33, decreases with increasing shear
stresses according to the original van den Brule theory.
However, the experiments for the iPP in this study showed
an increase of k33 with increasing shear stresses. The latter
effect could be due to the changed microstructure. The
modified van den Brule formulation, with the crystallinity-
dependent Ct and k0, is able to describe the experimentally
observed phenomenon mentioned above.
2.5. Governing equations for injection molding
modellingFor injection molding modeling, we use the two-dimen-
sional Hele-Shaw equation and the three-dimensional
energy equation as described by Kennedy (1995), but with
crystallinity-dependent viscosity, density and thermal prop-
erties. The effect of latent heat of fusion on temperature
due to crystallization is also considered.
In order to predict dimension and shape of the final prod-
ucts, one also needs to calculate residual stresses. There are
two sources of residual stresses. One is the flow-induced
stresses, which are built up during the filling stage and later
locked into the frozen layer due to the rapid increased
relaxation time during crystallization. The frozen-in
stresses can be calculated by subsequently solving a com-
bined equation of a viscoelastic model and a rigid dumb-
bell model as mentioned above (such a “two-phase” model
was originally proposed by Doufas et al., 1999, 2000 and
followed by Zheng and Kennedy 2004). The flow-induced
stresses are relatively small, but they contribute to orien-
tation which influences the thermal and mechanical prop-
erties, and hence the shrinkage and warpage behavior of
the molded parts. The second source of the residual
stresses is the thermally and pressure-induced stresses,
which arise during the packing and cooling stages, and
make the main contribution to the total residual stresses.
Details of the thermally and pressure-induced stress equa-
tions and numerical solution schemes for their calculation
have been described by Zheng et al. (1999). However, one
also needs to incorporate the predicted processing-induced
morphology and crystallinity into the calculation to
achieve anisotropic thermal and mechanical properties. To
do this, we use the Mori-Tanaka model and treat the spher-
ulites and shish-kebabs as inclusions embedded in an
amorphous matrix. For a review of several micromechan-
ical models, the reader is referred to Tucker and Liang
(1999).
3. Material and Experiments
3.1. Material selectionA primary aspect of this work is focused on modeling the
influence of colorants on the crystallization kinetics and
anisotropic shrinkage of the injection-molded parts. We
have chosen to use an iPP (grade HD601CF, supplied by
Borealis) as the virgin material and two different types of
blue colorants as additives. The virgin material is trans-
parent and its properties are given in Table 1.
The two types of blue colorants are Sodium Alumino Sul-
pho Silicate (commercial name: Ultramarine Blue) and Cu-
Phthalocyanine (commercial name: PV Fast Blue), both sup-
plied by Clariant Australia. We denote them as UB colorant
and CuPc colorant, respectively. The UB colorant is inor-
ganic, having a light blue color and a spherical surface full
of holes of a uniform size, while the CuPc-colorant is organic,
having a dark blue color and a flat surface full of narrow
cracks of nonuniform sizes. Each colorant was pre-mixed
with the base material in a blender at room temperature and
then in a twin screw extruder at 220oC, with a concentration
of 0.8% by weight. The extruded strands were immediately
quenched into water and then cut into pellets. The samples
were labelled as PP, PP+08U, and PP+08P, where PP stands
for the virgin material, “08” stands for the concentration of
qi kij∂T∂xj------=
σij
kij1
3---kkkδij– Ctk0 σij
1
3---σkkδij–⎝ ⎠
⎛ ⎞=
δij
1
k0 α T,( )------------------
α
k0s( )T( )
--------------1 α–
k0a( )T( )
---------------+=

Modeling of flow-induced crystallization of colored polypropylene in injection molding
Korea-Australia Rheology Journal September 2010 Vol. 22, No. 3 155
0.8% , and “U” and “P” stand for the UB colorant and the
CuPc colorant, respectively.
3.2. Quiescent crystallization parameters
3.2.1. Equilibrium melting temperature
Differential scanning calorimetry (DSC) was used to
determine the equilibrium melting temperature, , by the
Hoffman-Weeks extrapolation method (Hoffman and
Weeks 1962). The value of corresponds to the inter-
section of the experimental line and the first diag-
onal , where is the melt point obtained by
heating the sample at a rate of 10oC/min, after the sample
was isothermally crystallized at a constant temperature .
As an example, Fig. 1 shows the determination of the equi-
librium melting temperature for the virgin iPP. Melting
point data ( ) were obtained on the samples isothermally
crystallized at temperatures ranging from 120.4oC to
153.4oC. Despite the fact that one might regard the equi-
librium melting temperature as an intrinsic parameter of the
polymer crystal, our experimental measurements (Table 2)
show some variation with additives.
In an independent experiment for the same materials,
Zhu et. al. (2009) obtained for both PP and
PP+08U, and for PP+08P. Considering that the
two independent experiments were done by different
experimenters with different DSC apparatuses, the dis-
crepancies between the two sets of experimental results are
not very large.
3.2.2. Half crystallization time
For measuring the quiescent half crystallization time (t1/2),
again the DSC was used. The sample was melted and
maintained at 210oC for 5 minutes to remove crystalliza-
tion and pre-processing history, then was cooled at a rate of
30oC/min to a desired crystallization temperature, . At
this temperature, the sample was held until sufficiently
crystallized. The time-dependent relative crystallinity was
calculated by integrating the area inside the DSC crys-
tallization curve. Then the half crystallization time corre-
sponding to temperature was obtained for a relative
crystallinity . Fig. 2 shows an example for sample
PP for = 128, 132, 136, and 140oC.
Experimental results for the three samples are plotted in
Tm
0
Tm
0
Tm f Tc( )=
Tm Tc= Tm
Tc
Tm
Tm
0205 C
o
=
Tm
0179 C
o
=
Tc
Tc
α 0.5=
Tc
Table 1. Material properties of Borealis HD601CF IPP
Parameter Symbol Value
Molecular weight (weight average) Mw 367 kg/mol
Molecular weight distribution Mw/Mn 4.96
Melt Flow Rate (230oC, 2.16 kg) MFR 8 g/10 min
Glass transition temperature Tg 264 K
Table 2. Equilibrium melting temperatures for three samples.
PP PP+08U PP+08P
206oC 189oC 177oC
Tm
0
Fig. 1. Determination of equilibrium melting temperature for
sample PP by the Hoffman-Weeks extrapolation method.
Fig. 2. Determination of the half crystallization time at different
temperatures for the virgin iPP.
Fig. 3. Half crystallization time vs. crystallization temperature for
three samples.
Rong Zheng, R. I. Tanner, D. Lee Wo, Xi-jun Fan, C. Hadinata, F.S. Costa, P.K. Kennedy, P. Zhu and G. Edward
156 Korea-Australia Rheology Journal
Fig. 3. The results show that the crystallization speed is
slightly influenced by the UB colorant but dramatically
enhanced by the CuPc-colorant. The half crystallization
times of the CuPc-colored material are smaller by one
order of magnitude than the corresponding half crystalli-
zation times of both the virgin iPP and the UB-colored
material.
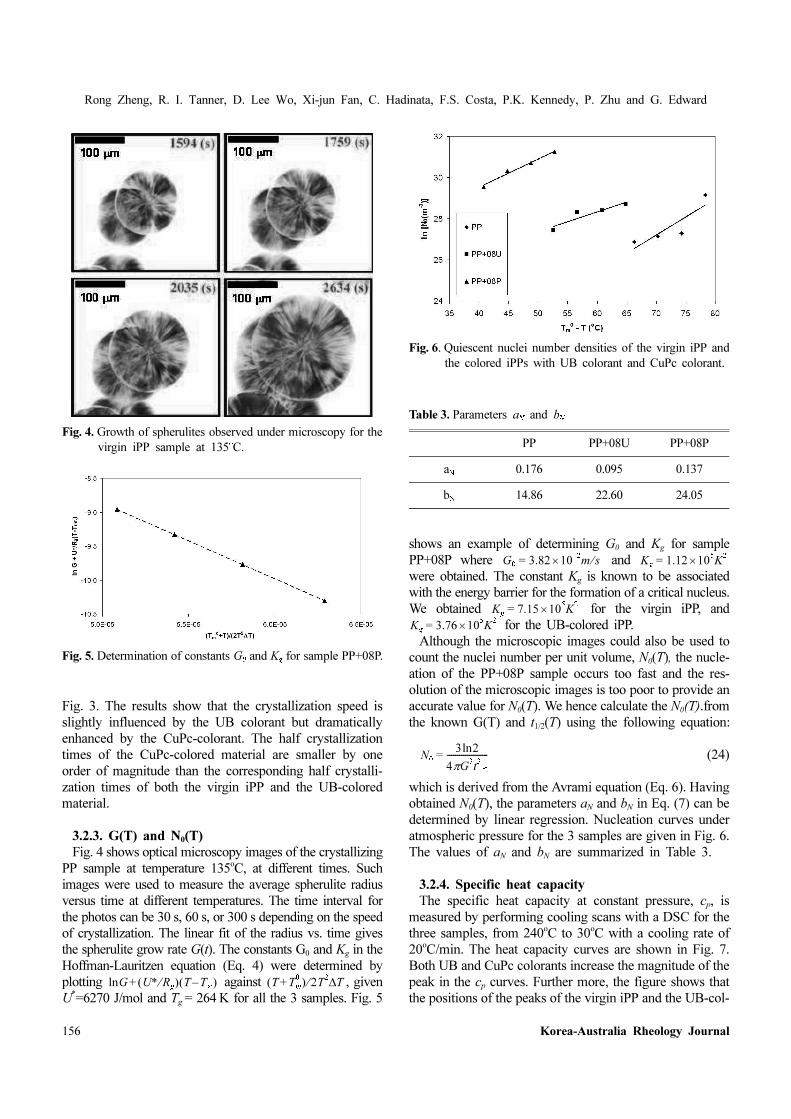
3.2.3. G(T) and N0(T)
Fig. 4 shows optical microscopy images of the crystallizing
PP sample at temperature 135oC, at different times. Such
images were used to measure the average spherulite radius
versus time at different temperatures. The time interval for
the photos can be 30 s, 60 s, or 300 s depending on the speed
of crystallization. The linear fit of the radius vs. time gives
the spherulite grow rate G(t). The constants G0 and Kg in the
Hoffman-Lauritzen equation (Eq. 4) were determined by
plotting against , given
U*=6270 J/mol and Tg = 264 K for all the 3 samples. Fig. 5
shows an example of determining G0 and Kg for sample
PP+08P where and
were obtained. The constant Kg is known to be associated
with the energy barrier for the formation of a critical nucleus.
We obtained for the virgin iPP, and
for the UB-colored iPP.
Although the microscopic images could also be used to
count the nuclei number per unit volume, N0(T), the nucle-
ation of the PP+08P sample occurs too fast and the res-
olution of the microscopic images is too poor to provide an
accurate value for N0(T). We hence calculate the N0(T).from
the known G(T) and t1/2(T) using the following equation:
(24)
which is derived from the Avrami equation (Eq. 6). Having
obtained N0(T), the parameters aN and bN in Eq. (7) can be
determined by linear regression. Nucleation curves under
atmospheric pressure for the 3 samples are given in Fig. 6.
The values of aN and bN are summarized in Table 3.
3.2.4. Specific heat capacity
The specific heat capacity at constant pressure, cp, is
measured by performing cooling scans with a DSC for the
three samples, from 240oC to 30oC with a cooling rate of
20oC/min. The heat capacity curves are shown in Fig. 7.
Both UB and CuPc colorants increase the magnitude of the
peak in the cp curves. Further more, the figure shows that
the positions of the peaks of the virgin iPP and the UB-col-
G U∗ Rg⁄( ) T T∞–( )+ln T Tm
0+( ) 2T
2T∆⁄
G0 3.82 102–m s⁄×= Kg 1.12 10
5K
2×=
Kg 7.15 105× K
2=
Kg 3.76 105K
2×=
N0
3 2ln
4πG3t1 2⁄
3--------------------=
Fig. 4. Growth of spherulites observed under microscopy for the
virgin iPP sample at 135oC.
Fig. 5. Determination of constants G0 and Kg for sample PP+08P.
Fig. 6. Quiescent nuclei number densities of the virgin iPP and
the colored iPPs with UB colorant and CuPc colorant.
Table 3. Parameters aN and bN
PP PP+08U PP+08P
aN 0.176 0.095 0.137
bN 14.86 22.60 24.05

Modeling of flow-induced crystallization of colored polypropylene in injection molding
Korea-Australia Rheology Journal September 2010 Vol. 22, No. 3 157
ored iPP vary by 5oC. However the CuPc colored sample
has a peak 16oC above that of the uncolored iPP and so sig-
nificantly reduces the degree of supercooling.
The crystallization latent heat can be estimated from the
area under the peak; the values are listed in Table 4.
3.2.5. Ultimate absolute crystallinity
The Ultimate absolute crystallinity ( ) estimated from
WAXS results are 0.53, 0.58 and 0.66 for PP, PP+08U and
PP+08P, respectively. We take an approximate value of
for all the three samples in the numerical sim-
ulations.
3.3. Flow-induced crystallization parametersA Linkam shearing hot stage combined with microscope
and light intensity reader was used to determine the half
crystallization time after shear. The experimental proce-
dure can be summarized as follows:
1. The sample is put into the Linkam Cell, melted, and
pressed to a thickness of 0.1 mm.
2. The sample is annealed at 210oC for 5 minutes.
3. The sample is cooled to the desired crystallization
temperature with a cooling rate of 30oC/min.
4. As soon as the temperature is reached, a step shear is
applied for a short period, denoted by ts, and at different
shear rates ranging from 0~100 s-1.
5. The change in polarized light intensity with time is
recorded, and the experiment is finished when the intensity
reaches a stable value, indicating that crystallization is com-
pleted. From the change in intensity, the half crystallization
time as a function of shear rate can be determined.
It is thus possible to use the experimental data to deter-
mine the parameters associated with the flow-induced crys-
tallization model.
We have noted that a careful choice of the experimental
crystallization temperature is essential. If the temperature is
too high, the crystallization process will be too slow and
make the experiment impractical. On the other hand, if the
chosen crystallization temperature is too low, then the crys-
tallization induction time will be too short and make the
measurement of the intensity of the transmitted light dif-
ficult or inaccurate, We chose two crystallization temper-
atures, and in the experiments for the
virgin and the UB-colored iPP. This range of crystallization
temperatures allowed convenient experimental times for
the two samples. However we had to choose higher tem-
peratures for the CuPc-colored iPP, because it crystallized
too fast at low temperatures. The temperatures chosen for
the CuPc-colored sample were and .
Experimental results will be reported later together with
modeling results.
3.4. Viscosity Steady shear experiments with a parallel plate rheometer
were performed to monitor the effect of crystallization
kinetics on viscosity. More details on the experiments were
reported elsewhere by Lee Wo and Tanner (2010). In this
study we fit Eq. (15) to the experimental data to determine
the model parameters β and β1 for using in simulations.
Fig. 8 shows an example of the model fitting. The model
parameters obtained are given in Table 5.
χ∞
χ∞ 0.6=
Tc 132oC= 136
oC
Tc 144oC= 148
oC
Fig. 7. Specific heat capacity of three samples.
Table 4. Latent heat of crystallization for three samples.
PP PP+08U PP+08P
∆Hc (J/kg) 95000 99295 103925
Fig. 8. Experimental and modeled viscosity ratios for three sam-
ples in steady shear at Tc=140°C and s-1.γ· 0.1=
Table 5. Parameters β and β1 in Eq. (15) (A=0.44)
PP PP+08U PP+08P
b 3.7 3.7 12
β1 1 1 1

Rong Zheng, R. I. Tanner, D. Lee Wo, Xi-jun Fan, C. Hadinata, F.S. Costa, P.K. Kennedy, P. Zhu and G. Edward
158 Korea-Australia Rheology Journal
There was a difficulty in the experiments when the sam-
ple solidified. In this case the sample tends to shrink and
may detach from the wall of the plates of the rheometer,
indicated by a sudden drop or an oscillation in the vis-
cosity-time curve. This usually occurs when (the
upturn in viscosity has already taken place) and hence has
little influence on the determination of β and β1.
3.5. Shrinkage measurementExperimental shrinkage data are required for inves-
tigating effects of the colorants on the properties of the final
products, and also for experimental validation of numerical
simulations. The injection-molded samples are fan-gated
rectangular plates, 200 mm long and 40 mm wide. The
thickness of the samples are 1.7 mm, 2 mm, 3 mm and
5 mm. We applied a set of 28 processing conditions to mold
each sample. The set of processing conditions include
different combinations of sample thickness, melt tempera-
ture, mold temperature, flow rate, holding pressure,
holding time and cooling time, These were described by
Kennedy and Zheng (2006) in more detail. The molded
plates were stored for 10 days at room temperature to reach
their final level of crystallinity and stable geometry of the
moldings. In-plane shrinkages of the parts were then
measured in two directions, one along the direction parallel
to flow, and the other perpendicular to the flow direction.
4. Results and Discussions
4.1. Enhancement of crystallization speed Figs. 9, 10 and 11 show the experimental and simulated
half crystallization times after shear as a function of the
shear rate at different temperatures for PP, PP+08U and
PP+08P, respectively. The figures demonstrate the ability
of the FIC model to describe correct trends for both the
influences of shear rate and temperature, and for materials
with and without colorants.
As mentioned in the previous section, in the Linkam shear-
ing experiment, we had to test the sample PP+08P in the
higher temperatures compared to those used for PP and
PP+08U. This raises a difficulty for comparison. However,
the FIC kinetic model can be used to predict at the same
η ηa 10>⁄
t1 2⁄
Fig. 9. Experimental and simulated half crystallization time ver-
sus short-term shear rate for the virgin iPP at two crys-
tallization temperatures and a fixed shearing time of 1 sec.
Fig. 10. Experimental and simulated half crystallization time ver-
sus short-term shear rate for the UB-colored iPP at two
crystallization temperatures and a fixed shearing time of
1 sec.
Fig. 11. Experimental and simulated half crystallization time ver-
sus short-term shear rate for the CuPc-colored iPP at two
crystallization temperatures and a fixed shearing time of
1 sec.
Fig. 12. A comparison of simulated half crystallization times ver-
sus short-term shear rate for the three samples at
and .Tc 132oC= ts 1s<

Modeling of flow-induced crystallization of colored polypropylene in injection molding
Korea-Australia Rheology Journal September 2010 Vol. 22, No. 3 159
temperature for all three samples. Fig. 12 shows the predicted
results for all samples at . One can see that the
nucleating effect of the UB colorant is negligible for qui-
escent and low shear-rate ( ) crystallization, but
becomes significant for flow-induced crystallization at higher
shear rates. Thus, the UB colorant tends to increase the sen-
sitivity of crystallization to shear. Compared to the UB col-
orant, the CuPc colorant is highly effective as a nucleating
agent even in the quiescent state.
As the UB colorant has negligible influence on the qui-
escent crystallinity of the iPP, its influence on the flow-
induced crystallization was somewhat unexpected. This
phenomenon may be attributed to the local shear rate con-
centration. Although the virgin iPP and the UB-colored iPP
have similar level of half crystallization times in quiescent
conditions, we did observe from the microscopy that the
two samples have quite different morphology, especially in
the nuclei distribution and the nuclei number density (see
Lee Wo and Tanner 2010). Therefore, when the samples
are sheared, the local effective shear rates in the two sam-
ples will be different for the same applied shear rate.
4.2. Cavity pressure in injection moldingIn this study, cavity pressure evolution is measured for the
previously mentioned fan-gated rectangular parts for the
experimental validation of numerical predictions. Pressure
profiles were measured at two points as shown in Fig. 13.
As an example, we show here the part with 2 mm thick-
ness. For all three materials, the melt was injected with a
constant flow rate of at 202oC, and the mold
temperature was set to 41oC. The packing pressure at the
nozzle was maintained at 30.5 MPa for a holding time of
20 s before it dropped to zero, then followed by a cooling
time of 10 s.
A finite element method was employed to solve a two-
dimensional pressure equation using a mid-plane mesh,
while a finite difference scheme was used to solve the
three-dimensional temperature field. This method, often
referred to as 2.5D analysis, was documented in detail by
Kennedy (1995).
Experimental and predicted pressure profiles are shown
in Figs.14, 15, and 16 for the PP, PP+08U and PP+08P
samples, respectively. The pressure measured just down-
stream from the gate (Point 1) can give an indication about
the solidification evolution at the gate. The beginning of
the pressure decay is due to the gate freezing and is an
indicator of effective temperature and viscosity modeling.
From the figures, we found that the CuPc colorant causes
the pressure to decay earlier; this phenomenon is consistent
with its effect on speeding up crystallization.
The cavity pressure prediction is sensitive to variations
Tc 132oC=
γ· 1s1–
<
3.7 105–m
3× s⁄
Fig. 13. Finite element mesh of the fan-gated rectangular part and
the pressure measurement points. Fig. 14. Measured and predicted pressure profiles for the virgin
iPP.
Fig. 15. Measured and predicted pressure profiles for PP+08U.
Fig. 16. Measured and predicted pressure profiles for PP+08P.

Rong Zheng, R. I. Tanner, D. Lee Wo, Xi-jun Fan, C. Hadinata, F.S. Costa, P.K. Kennedy, P. Zhu and G. Edward
160 Korea-Australia Rheology Journal
of thermal diffusivity , which is a function of crys-
tallinity. Higher values of diffusivity will speed up the
pressure decay. Viscosity upturn due to crystallization also
greatly changes the pressure transmission and evolution.
Flow-induced crystalline orientation has little effect on the
pressure profile but significantly affects shrinkage results.
In addition, it is also known that the mold deformation and
the heat transfer coefficient at the polymer/mold interface
also influence the agreement of the predictions with mea-
surements.
4.3. Orientation factorThe Herman’s orientation factor fc is often used as a quan-
titative measure of uniaxial orientation. The value of fc can
be calculated in injection molding simulation and it gives us
information about the distribution of microstructure, either
oriented or isotropic. In particular, fc = 0 corresponds to a
random orientation and an isotropic microstructure, fc = 1
indicates a highly oriented structure which is perfectly
aligned in the flow direction, and fc = -0.5 signifies an ori-
entation perpendicular to the flow direction.
Fig. 17 shows the predicted gap-wise profiles of the ori-
entation factor fc, for the 2 mm-thick plates as used above
for the pressure calculations. The molding conditions were
also the same as described above. Results for the three
materials were all taken from the element located at the
center of the plate. A typical layered structure is observed.
The first layer is at the polymer/metal interface, where a
nearly zero fc is predicted. Moving inward from the sur-
face, there is a highly oriented layer, where the material
experienced high shear-rate flow action and then froze due
to rapid crystallization that preserved the orientation in the
flow direction. When the cavity is full, the flow rate gen-
erated by packing is much lower than in the filling stage,
and the shear stresses in the molten polymer layer decay
quickly. Therefore, further inward from the high shear
region, there is a minimum in the crystalline orientation
function, which is followed by a second hump. The second
hump was developed during the post-filling stage. As the
solid/melt interface moves inward, a small flow rate in a
narrower channel may still result in a considerable defor-
mation. Moreover, due to the decreasing temperature with
time (which leads to higher viscosity and relaxation time),
even small shear rates may still introduce high stresses and
lead to oriented structures. Finally, around the symmetry
plane, where the shear rate is approximately zero, the ori-
entation factor drops to zero as expected, implying iso-
tropic spherulitical structures in the core region of the part.
Such kinds of five-layered structure have been observed in
experiments by Mendoza et al. (2003).
4.4. ShrinkageMeasured and predicted shrinkages (parallel and per-
pendicular to flow direction) are shown in Figs. 18 to 20,
respectively, for the three samples. The undulation of the
data reflects the influence of the processing conditions on
the shrinkage of the moldings. For a few processing con-
ditions, the agreement between the experimental data and
numerical prediction is not entirely satisfactory in mag-
nitude, but nevertheless the predicted results match the
experimental trends and in most cases the magnitudes.
k ρcp⁄
Fig. 17. Gap-wise Orientation factor profiles for PP, PP+08U and
PP+08P.
Fig. 18. Experimental and predicted parallel and perpendicular
shrinkage for the virgin iPP.
Fig. 19. Experimental and predicted parallel and perpendicular
shrinkage for the iPP colored by UB colorant.

Modeling of flow-induced crystallization of colored polypropylene in injection molding
Korea-Australia Rheology Journal September 2010 Vol. 22, No. 3 161
Comparing the three figures, of particular note is the higher
degree of anisotropy exhibited by the CuPc-colored iPP,
which was correctly predicted by the present model.
5. Conclusions
In this study, we perform experiments and numerical
simulations to investigate the effects of two colorants on
flow-induced crystallization and anisotropic properties of
injection molded parts. The two colorants have different
particle geometries and surface patterns. The CuPc colo-
rant with flat surfaces has shown to be a very effective
nucleating agent in both quiescent and flow conditions.
Moreover, it results in a higher degree of anisotropy in
shrinkage. The UB colorant with spherical surface is not
effective in the quiescent conditions but increases the sen-
sitivity to pre-shear effects. It does not lead to anisotropic
shrinkage. A basic FIC model with the parameters deter-
mined separately for different samples gave a good pre-
diction of the colorant effects observed in experiments.
Acknowledgements
We acknowledge gratefully the (Australian) Polymer
Cooperative Research Centre for the financial support,
Borealis GmbH, Linz, Austria for the supply of material,
Moldflow Plastics Laboratory of Autodesk Pty. Ltd., Mel-
bourne for providing experimental apparatus and material
characterization.
References
Avrami, M., 1939, Kinetics of phase change, I. General theory, J.
Chem. Phys. 7, 1103-1112.
Dai, S.C., F. Qi. and R.I. Tanner, 2006, Strain and Strain-Rate
Formulation for Flow-Induced Crystallization, Polym. Eng.
Sci. 46, 659-669.
Dai, S.C. and R.I. Tanner, 2006, Anisotropic thermal conductvity
in sheared polypropylene, Rheol. Acta, 45, 228-238.
Doi, M. and S.F. Edwards, 1986, The Theory of Polymer
Dynamics. Clarendon Press, Oxford.
Doufas, A.K., I. S. Dairanieh and A. J. McHugh, 1999, A con-
tinuum model for flow-induced crystallization of polymer
melts, J. Rheol. 43, 85-109.
Doufas, A.K., A. J. McHugh and C. Miller, 2000, Simulation of
melt spinning including flow-induced crystallization, Part I.
Model development and predictions, J. Non-Newtonian Fluid
Mech. 92, 27-66.
Eder, G. and H. Janeschitz-Kriegl., 1997, Crystallization, in Mate-
rials Science and Technology, Vol. 18, Processing of Polymers
(H. E. H. Meijer, ed.), Wiley-VCH, New York.
Fan X-J., 1985, Viscosity, first normal-stress coefficient and
molecular stretching in dilute polymer solutions, J. Non-New-
tonian Fluid Mech. 17, 125-144..
Fulchiron, R., E. Koscher, G. Poutot, D. Delaunay and G. Regnier,
2001, Analysis of the Pressure Effect on the Crystallization
Kinetics, Dilatometric Measurements and Thermal Gradient
Modelling. J. Macromolecular Science – Physics 40, 297-314.
Hadinata, C., R. Zheng, P.K. Kennedy, P. Zhu, G. Edward, D. Lee
Wo and R. I. Tanner, 2008, The effects of additives on material
properties and shrinkage characteristics, Proc. PPS-24 Salerno.
Hoffman, J. D. and J. J. Weeks, 1962, Melting process and the
equilibrium melting temperature of polychlorotrifluoroethyl-
ene, J. Res. Natl. Bur. Stand 66A, 13-28.
Housmans, J.W., M. Gahleitner, G.W.M. Peters and H.E.H.
Meijer, 2009, Structure-property relations in molded, nucleated
isotactic polypropylene, Polymer 50, 2304-2319.
Huilgol, R.R., N. Phan-Thien and R. Zheng, 1992, A theoretical
and numerical study of non-Fourier effects in viscometric and
extensional flows of incompressible simple fluid, J. Non-Newt.
Fluid Mech. 43, 83-102.
Kennedy, P.K., Flow Analysis of Injection Molds, Hanser, Munich,
(1995).
Kennedy, P.K. and R. Zheng, 2006, Shrinkage of injection
molded material, in Precision Injection Molding: Process,
Materials, and Applications, edited by Jehuda Greener and
Reinhold Wimberger-Friedl, Hanser, 105-135.
Kolmogoroff, A. N., 1937, On a statistical theory of crystal-
lization of melts, Bull, Akad. Sci. USSR, Class Sci., Math. Nat.
1, 355-359.
Koscher, E. and R. Fulchiron., 2002, Influence of shear on
polypropylene crystallization: morphology development and
kinetics, Polymer 43, 6931-6942.
Lauritzen, S.I. and J. D. Hoffman, 1960, Theory of formation of
polymer crystals with folded chains in dilute solution, J. Res.
Natl. Bur. Stand. 64A, 73-102.
Lee Wo, D. and R.I. Tanner, 2010, The impact of blue organic
and inorganic pigments on the crystallization and rheological
properties of isotactic polypropylene, Rheol. Acta 49, 75-88.
Mendoza, R., G. Régnier, W. Seiler and J.L. Lebrun., 2003, Spa-
tial distribution of molecular orientation in injection molded
iPP: influence of processing conditions, Polymer 44, 3363-
3373.
Mykhaylyk, O.O., P. Chambon, R.S. Graham, J. Patrick, A. Fair-
clough, P.D. Olmsted and A. J. Ryan, 2008, The Specific Work
of Flow as a Criterion for Orientation in Polymer Crystal-
Fig. 20. Experimental and predicted parallel and perpendicular
shrinkage for PP colored by CuPc colorant.
Rong Zheng, R. I. Tanner, D. Lee Wo, Xi-jun Fan, C. Hadinata, F.S. Costa, P.K. Kennedy, P. Zhu and G. Edward
162 Korea-Australia Rheology Journal
lization, Macromolecules 41, 1901-1904.
Pantani, R., I. Coccorullo, V. Speranza and G. Titomanlio, 2005.
Modeling of morphology evolution in the injection molding
process of thermoplastic polymers, Prog. Polym. Sci. 30, 1185-
1122.
Silberman, A., E. Raninson, I. Dolgopolsky and S. Kenig, 1995,
The effect of pigments on the crystallization and properties of
polypropylene, Polymers for Advanced Technologies 6, 643-
652.
Tanner, R. I., 2003, On the flow of crystallizing polymers, I. Lin-
ear regime, J. Non-Newtonian Fluid Mech. 112, 251-268.
Tanner, R.I. and F. Qi, 2005, A comparison of some models for
describing polymer crystallization at low deformation rates. J
Non-Newton Fluid Mech. 127, 131-141.
Tucker, III C.L. and E. Liang, 1999, Stiffness predictions for uni-
directional short-fiber composites: Review and evaluation.
Comp Sci Technol. 59, 655-671.
Vanden Brule, B.H.A.A., 1989, A network theory for the thermal
conductivity of an amorphous polymeric material, Rheol. Acta,
28, 257-266.
Van Meerveld, J. 2004, A method to extract the monomer friction
coefficient from the linear viscoelastic behavior of linear,
entangled polymer melts, Rheol. Acta 43, 615-623.
Van Meerveld, J., G., W. M. Peters and M. Hütter, 2004, Towards
a rheological classification of flow induced crystallization exper-
iments of polymer melts, Rheol. Acta 44, 119-134.
Zheng, R. C. Hadinata and P. Kennedy, 2008, Numerical study
on the impact of additives on shrinkage of injection molded
polypropylene, The XV International Congress on Rheology,
Monterey, AIP Conf. Proc. 1027, 45-47.
Zheng, R. and P. K. Kennedy, 2004, A model for post-flow
induced crystallization: general equation and predictions,” J.
Rheol. 48, 823-842.
Zheng, R. and P.K. Kennedy, 2006, Anisotropic thermal con-
duction in injection molding, Proc. 22nd Annual Conference of
the Polymer Processing Society, Yamagata, Japan.
Zheng, R., P.K. Kennedy, N. Phan-Thien and X.J. Fan, 1999,
Thermoviscoelastic simulation of thermally and pressure
induced stresses in injection molding for the prediction of
shrinkage and warpage for fibre-reinforced thermoplastics, J.
Non-Newtonian Fluid Mech. 84, 159-190.
Zhu, P., A. Phillips and G. Edward, 2009, Experimental obser-
vation of effects of seeds on polymer crystallization, Physical
Review E. 80, 051801.
Zuidema, H., G.W.M. Peters and H.E.H. Meijer, 2001, Devel-
opment and validation of a recoverable strain based model for
flow-induced crystallization of polymers, Macromol. Theory
Simul. 10, 447-460.