modeling of electrical conductivity and piezoresistivity
TRANSCRIPT

Modeling of Electrical Conductivity and Piezoresistivity of Carbon Nanotube Based Polymer
Nanocomposites
WEIQING FANG
A THESIS SUBMITTED TO THE FACULTY OF GRADUATE STUDIES
IN PARTIAL FULFILLMENT OF THE REQUIREMENTS
FOR THE DEGREE OF MASTER OF SCIENCE
Graduate Program in
EARTH AND SPACE SCIENCE
York University
Toronto, Ontario
November 2015
© WEIQING FANG, 2015

II | P a g e
Abstract
Superior electrical, thermal, and mechanical properties of carbon nanotubes (CNTs)
have made them effective filler for multifunctional polymer nanocomposites (PNCs). In this
thesis work, an improved model has been developed to describe the CNT networks inside
polymer matrix and thereby evaluated the PNCs’ ϕc and σ. The new model accounts for the
electrical conductance contributed by the continued CNT network across the boundary of
adjacent representative volume elements. It more realistically represents the
interconnectivity among CNTs and enhances the evaluation of the structure-to-property
relationship of PNCs’ σ. Furthermore, comprehensive investigations on the piezoresistive
behaviour of PNCs have been conducted using developed modeling framework. Quantitative
analyses have revealed that piezoresistivity of PNCs is predominantly governed by the three
mechanisms related to the strain-induced morphological evolution of the CNT network
embedded in the polymer matrix.

III | P a g e
Acknowledgement
I would like to give my gratitude to my supervisor, Professor Siu Ning Leung for his
generous guidance for my thesis research. Being your first graduate student, it is a great
experience to remember.
Special thanks to Yanting Guo, Hao Ding, and the fellow lab members from
Multifunctional Materials | Micro-and-Nanostructing Laboratory who kindly provide their
help on my works.
Lastly, I would like to dedicate this work to my parents for their great support,
motivation and encouragement.

IV | P a g e
Table of Contents Abstract ......................................................................................................................................................... II
Acknowledgement ....................................................................................................................................... III
Table of Contents ………………………………………………………………………………………………………………………………….IV
List of Tables ............................................................................................................................................... VII
List of Figures ............................................................................................................................................. VIII
List of Abbreviations ..................................................................................................................................... X
CHAPTER 1 Introduction ......................................................................................................................... 1
1.1 Electrical conductivity and piezoresistivity of PNCs ........................................................................ 1
1.2 Thesis objectives ............................................................................................................................. 4
1.3 Thesis organization ......................................................................................................................... 4
CHAPTER 2 Background and Literature Review...................................................................................... 5
2.1 Electrical conductivity of PNCs ........................................................................................................ 5
2.1.1 Percolation phenomenon of electrically conductive PNCs .................................................. 5
2.1.2 Modeling electrical conductivity of PNCs. ........................................................................... 8
2.1.3 Intrinsic conductivity of CNTs ............................................................................................ 11
2.1.4 Tunneling effect of two contacting CNTs ........................................................................... 12
2.1.5 Characterization of CNT length distribution ...................................................................... 13
2.1.6 Effects of CNT alignment on PNCs' electrical properties. .................................................. 15
2.2 Piezoresistivity of PNCs ................................................................................................................. 17
2.2.1 Piezoresistive behaviour of electrically conductive PNCs .................................................. 17
2.2.2 Modeling piezoresistivity of PNCs. ..................................................................................... 19
2.2.3 Fiber reorientation model .................................................................................................. 21

V | P a g e
2.3 Summary ....................................................................................................................................... 22
CHAPTER 3 Electrical Conductivity of PNCs .......................................................................................... 23
3.1 Theoretical framework ............................................................................................................... 23
3.1.1 Cuboid representative volume element (RVE) of electrically conductive PNCs ....... 23
3.1.2 Electrical conductivity of PNCs represented by an individual cuboid RVE ............... 25
3.1.3 Electrical conductivity of PNCs by considering the interconnectivity of CNTs across
the RVEs’ boundary surfaces .................................................................................................... 27
3.2 Results and discussion ................................................................................................................ 31
3.2.1 Effects of RVE’s dimensions on the simulation results of electrical conductivity ..... 32
3.2.2 Model validation and comparison with experimental works and other models ...... 35
3.2.3 Effect of the distance between two electrodes in a RVE on percolation threshold ... 40
3.2.4 Effect of CNTs’ alignment on PNCs’ percolation thresholds and electrical
conductivity ............................................................................................................................... 42
3.3 Concluding Remarks ................................................................................................................... 45
CHAPTER 4 Piezoresistivity of PNCs ...................................................................................................... 47
4.1 Theoretical framework ............................................................................................................... 47
4.1.1 Transformation of the CNT network in a PNC under applied strain .......................... 48
4.1.2 Mechanisms contributed to the piezoresistivity of PNCs filled with CNTs ................ 50
4.2 Results and discussion ................................................................................................................ 53
4.2.1 Validation of the 3D model and the simulation scheme .............................................. 53
4.2.2 Key governing factors to PNCs’ piezoresistivity .......................................................... 55
4.2.3 Effects of CNT loadings on PNCs’ piezoresistive behaviours ...................................... 57
4.2.4 Effects of CNT alignment on PNCs’ piezoresistivity ..................................................... 58
4.3 Concluding Remarks ................................................................................................................... 63

VI | P a g e
CHAPTER 5 Concluding Remarks ...................................................................................................... 65
5.1 Summary of Conclusions ............................................................................................................ 65
5.2 Summary of Contributions ......................................................................................................... 68
5.3 Scholarly Publications ................................................................................................................. 69
List of References ...................................................................................................................................... 70

VII | P a g e
List of Tables
Table 3.1 Physical Parameters used in simulation ................................................................................................ 34
Table 4.2 Morphological parameters related to PNCs’ piezoresistivity........................................................ 54
Table 4.2 Changes in morphological parameters under the three types of mechanisms....................... 54

VIII | P a g e
List of Figures
Figure 2.1 Electrical conductivity of PNCs at varying filler loading, where “I, II, and III” denote the
different states as PNCs transiting form insulator to conductor........................................................................... 8
Figure 2.2 Schematics of the percolation process in PNCs (i.e., the formation of conductive paths in
polymer matrices)..................................................................................................................................................................... 8
Figure 2.3 3D representative element of CNT (i.e., "soft-core" capped cylinder) with length of L and
diameter of D............................................................................................................................................................................. 11
Figure 3.1 A schematic of CNTs randomly dispersed in a representative volume element.................. 25
Figure 3.2 A schematic of CNTs' interconnection.................................................................................................... 27
Figure 3.3 A schematic of interconnectivity of CNTs across the boundary surface of adjacent
RVEs............................................................................................................................................................................................... 30
Figure 3.4 CNTs distributed in a rectangular cuboid (note: CNTs penetrating across the boundary
surface are highlighted)........................................................................................................................................................ 31
Figure 3.5 Simulation results of PNC's adj at different CNT loadings based on (a) cubic RVEs with
different dimensions; (b) cuboid RVEs with fixed Lx (i.e., 1.5 × LCNT) but varying Ly and Lz; (c) cuboid
RVEs with fixed Ly and Lz (i.e., 1.5 × LCNT) but varying Lx; and (d) relative difference of simulated adj
and with varying Ly and Lz............................................................................................................................................... 35
Figure 3.6 Comparison of simulation times per run using different lengths of Ly and Lz (note: Lx is
fixed at 4 × LCNT)........................................................................................................................................................................37
Figure 3.7 Comparison of simulation results of PNCs’ adj with existing experimental data obtained
by: (a) Y. Ono et al., N. Hu et al., and NCT Co. Ltd.; and (b) B. Krause et al...................................................... 39
Figure 3.8 Comparison of simulation results with other numerical studies: (a) N. Hu et al., (b) W. S.
Bao et al., based on the 3D resistor network model................................................................................................. 40
Figure 3.9 Calculated percolation threshold using different RVEs, cuboid RVEs with fixed Ly and Lz
(i.e., 1.5 × LCNT) but varying Lx; and cuboid RVEs with fixed Lx (i.e., 1.5 × LCNT) but varying Ly and
Lz......................................................................................................................................................................................................43
Figure 3.10 Calculated electrical properties of PNCs at different CNTs alignment, (a) electrical
conductivity vs. volume fraction at different max; (b) electrical conductivity vs. max at different
volume fraction; (c) percolation threshold vs. max...................................................................................................46
Figure 4.1 An overview of the Monte Carlo simulation procedures................................................................ 49

IX | P a g e
Figure 4.2 Mechanisms of strain-induced PNC’s morphological change: (a) breakage of a complex
conductive path into two or more simpler paths (Type I); (b) breakage of a conductive path (Type II);
and (c) alternation of a conductive path without breakage (Type III)..................................................... 52
Figure 4.3 Comparison of simulation results of PNCs’ piezoresistivity with existing experimental
data reported by (a) Park et al. and (b) Fernberg et al........................................................................................... 57
Figure 4.4 Strain-induced relative changes in quantifiable parameters at (a) 0.56 and (b) 0.80 vol.%
of MWNTs....................................................................................................................................................................................58
Figure 4.5 Strain-induced relative changes in different morphological parameters of the conductive
network at (a) 0.56 and (b) 0.80 vol.% of MWNTs....................................................................................................59
Figures 4.6 Effects of CNT alignment on (a) Electrical conductivity and (b) piezoresistivity of PNCs
at 0.56 and 0.80 vol.% of MWNTs..................................................................................................................................... 62
Figures 4.7 Effects of CNT alignment on the relative changes of (a) Npath, (b) lavg, (c) NCNT, and (d) rate
of relative changes in these parameters, at 0.56 vol.% MWNTs loading............................................... 63
Figure 4.8 Effects of CNT alignment on the relative changes of (a) Npath, (b) lavg, (c) NCNT, and (d) rate
of relative changes in these parameters, at 0.80 vol.% MWNTs loading......................................................... 64

X | P a g e
List of Abbreviations
A = cross-sectional area of the RVE
AFM = atomic force microscope
a = scale parameter of Weibull distribution
b = shape parameter of Weibull distribution
CNT = carbon nanotube
D = diameter of CNT
d = shortest distance between two CNTs
davg = average CNT-to-CNT distance at junctions
dcutoff = cut-off distance
dtunnel = tunneling characteristic length
dvdw = van der Waals separation distance
e = electron charge
FWHM = full width at half maximum
Gadj = electrical conductance with considering the additional conductance contributed by the
interconnecting CNTs across the boundary surfaces of the RVE
Gboundary = additional electrical conductance in the boundary surfaces of the RVE
GRVE = electrical conductance of the RVE
Grect = electrical conductance of the rectangular cuboid
GRVE,top = electrical conductance of the top RVE
GRVE,bottom = electrical conductance of the bottom RVE
h = Planck’s constant
kB = Boltzmann constant
L = average length of CNT
l = distance between the left and right boundary surfaces of the RVE
XI | P a g e
lavg = average junction-to-junction distance along a CNT in conductive paths
lkl = distance between two contacting nodes
Lx, Ly, Lz = dimensions of the RVE
M = number of conduction channels of MWNTs
MWNT = multi-walled carbon nanotube
me = mass of an electron
NCNT = total number of CNTs in the conductive network
Npath = total number of independent conductive paths in the CNT network
Nodek, Nodel = contacting nodes
P3OT = Poly(3-octylthiohpene)
PBT = Polybutylene terephthalate
PEO = polyethylene oxide
PET = Polyethylene terephthalate
PNC = polymer nanocomposites
Rcontact = contact resistance between two CNTs
Rcontact,avg = average contact resistance at CNT junctions
Rintrinsic = intrinsic resistance along an individual CNT
Rintrinsic,avg = average intrinsic resistance along a CNT between two junctions
R' = resistance of RVE with applied strain
RVE = representative volume element
SEM = scanning electron microscopy
SWNT = single-walled carbon nanotube
T = respective temperature
t = critical exponent in percolation theory

XII | P a g e
TEM = transmission electron microscopy
xc,i, yc,i, zc,i = center point of CNTi
x'c,i, y'c,i, z'c,i = center point of CNTi with applied strain
xi,1, yi,1, zi,1 = starting point of CNTi
xi,2, yi,2, zi,2 = ending point of CNTi
= strain ratio of CNT to polymer
electrical conductivity
= physical parameter in percolation theory
adj = electrical conductivity after accounting for the contribution of the interconnecting
CNTs across the boundary surfaces of the RVE
CNT = intrinsic electrical conductivity
'CNT = intrinsic electrical conductivity with applied strain
T = transimission probability
avg = average polar angle of CNTs
i = polar angle of CNTi
'i = polar angle of CNTi with applied strain
max = maximum alignment angle of CNT
= volume fraction of the fillers
c = percolation threshold
i = azimuthal angle of CNTi
'i = azimuthal angle of CNTi with applied strain
poly = applied strain
= Poisson’s ratio of PNC
E = height of the potential barrier

XIII | P a g e
∆R = change in the resistance of RVE with applied strain

1 | P a g e
CHAPTER 1 Introduction
1.1 Electrical conductivity and piezoresistivity of PNCs
Various nano-scale carbon fillers, such as carbon nanotubes (CNTs), are promising
for superior mechanical (Dalton 2003, Shtogun 2010), electrical (Ebbesen 1996), and
thermal (Hou 2006) properties. Such relatively new class of fillers has led to great potential
in fabricating multifunctional polymer nanocomposites (PNCs), which are considered as
realistic alternatives to conventional smart materials in photogating transistor (Marcus
2006), electron field emission (Matsubara 2008), magnetic nanomaterials (Glenis 2010), and
resistance-type strain sensors of high sensitivity (Alamusi 2011). Especially in the field of
resistance-type strain sensor, it was guaranteed that integrating nano-scale carbon fillers
into polymers would open up great opportunities in fabrication of PNCs with tailored
piezoresistivity (i.e., the strain-induced change in resistance). Due to its outstanding static
and low-frequency dynamic responses, this type of strain sensors, based on piezoresistive
PNCs, has great potential for its implementation on structural health monitoring, wearable
sensor, impact events monitoring, and delamination in laminates.
The distinguished mechanical and intrinsic electrical properties of CNTs make them
the ideal reinforcing agents for the fabrication of multifunctional PNCs. It is possible to
embed only a small amount of CNTs in a polymer matrix to achieve significant enhancement
in the electrical conductivity (), due to the exceptionally high intrinsic electrical
conductivity and extremely high aspect ratio of CNTs. Meanwhile, small filler loadings also
allow PNCs to maintain the favorable properties of polymers, including low density, high

2 | P a g e
chemical resistance, and good processability. Based on the percolation theory (Kirkpatrick
1973), there exists a critical concentration of conductive fillers, namely percolation
threshold (c), over which further increase in filler loading would generate a conductive
percolation network and make the PNCs to transit from electrical insulator to conductor.
Once the filler contents achieved percolation threshold, the electrical conductivity of PNCs
will be enhanced by several orders of magnitude.
Experimental studies have been conducted by many researchers to explore the effects of
various morphological factors of CNT network (i.e., dispersion, alignment, and aspect ratio)
on PNCs’ electrical properties. Meanwhile, theoretical and numerical works have been
performed to investigate the morphology-property relations. Researchers have performed
Monte Carlo simulation to model the conductive network inside PNCs. The 2D, multi-2D
layers, or 3D random resistor network can be generated in finite-size representative volume
elements (RVEs). Such RVEs was assumed to be periodically repeated to represent the PNCs.
In earlier simulation work (Hu 2008a). Generally, RVEs is chosen as a cube, where electric
current will propagate along the conductive path generated by CNTs from one boundary
surface to the opposite surface. The periodic configuration of CNTs is considered in their
work such that the portion of CNTs, which extended outside the boundary surface, was
relocated into the cube, pointing into the cell from the opposite boundary surface. However,
this method discounted the CNTs’ interconnectivity through the boundary surface, and
thereby their contribution to the RVE’s effective conductance. A sufficiently large
representative cell and high computation cost were required to obtain accurate simulation
results, such that the error caused by the ignorance of these continuous CNTs would reduce.

3 | P a g e
Thus, an advanced model is required to obtain more realistic results and to promote the
calculation efficiency.
PNCs with improved electrical conductivity can further be modified for applications
as highly sensitive strain sensors, due to their strain-induced resistivity change (Alamusi
2011). In recent experimental studies, linear relationship between the applied external
strain and the relative change in PNC specimen’s resistance were observed. It is revealed
that the piezoresistive behaviour of PNCs was qualitatively attributed to following
mechanisms: (i) reconfiguration of CNTs conductive network in the PNC; (ii) change in
tunneling resistance at CNTs junctions; and (iii) change in the intrinsic electrical resistance
of CNTs. However, fundamental understanding and quantitatively systematical analysis of
the mechanisms contributed to the piezoresistive behaviours in PNCs filled with CNTs have
yet been elucidated. Thus, a new model is required to realistically simulate the strain-
induced morphology evolution of the conductive network and the resultant macroscopic
piezoresistive behaviours of PNCs. Such model can help to reveal the underlying mechanism
of PNCs’ piezoresistive behaviours and derive the structure-to-property relationship.
In this thesis research, a new random resistor network model in 3D dimension has been
developed to simulate the electrical conductivity of the PNCs. In this new model, the
interconnectivity of those CNTs crossing the boundary surfaces of the representative volume
element is considered. This would lead to more accurate simulation results while
maintaining high calculation efficiency. Systematically and quantitative investigation of the
governing factors of PNC's electrical conductivity were performed using the developed
model. Subsequently, the new model has been extended to simulate the piezoresistivity (i.e.,

4 | P a g e
strain-induced relative change in resistance) of PNCs filled with CNTs. The strain-induced
evolution in conductive network has been realistically simulated in the improved model.
Consequently, the underlying mechanisms of the piezoresistivity have been discovered.
1.2 Thesis objectives
The long-term goal of the research is to develop polymer nanocomposites with tailored
electrical and piezoresistive properties, and eventually for thermal energy harvesting
application. During the course of my Master’s studies, the thesis research aims to investigate
the morphology-property relationship and develop a new approach to elucidate the
governing factors of these properties in PNCs. In this thesis, an improved 3D random resister
network model has been developed to theoretically study the effects on electrical and
piezoresistive properties of PNCs.
1.3 Thesis organization
The main body of this thesis consists of five chapters. The extensive and systematical
literature review is presented in Chapter 2 Background and Literature Review. Chapter 3
Electrical Conductivity of PNCs reports the development of a new model that describes the
electrically conductive CNT network in a polymer matrix, and subsequently the uses of this
model to numerically study the structure-to-property relationship in CNT-polymer
nanocomposites. In Chapter 4 Piezoresistivity of PNCs, the modeling work of piezoresistivity
is presented. It also reports quantitative investigations on the governing factors of PNC's
piezoresistive behaviours. Chapter 5 provides the concluding remarks of the thesis research.
5 | P a g e
CHAPTER 2 Background and Literature Review
2.1 Electrical conductivity of PNCs
Recently, great attention has been paid to the fabrication of electrically conductive
polymer nanocomposites (PNCs) with the use of various conductive fillers. In particular,
carbon nanotubes (CNTs), including single-walled carbon nanotubes (SWNTs) and multi-
walled carbon nanotubes (MWNTs), are considered to be powerful and effective fillers for
enhancing the electrical conductivity of PNCs. In recent decade, experimental and numerical
studies on the electrical conductivity of nanocomposites made from insulating polymers
filled by CNTs have been carried out. This section describes the percolation phenomena,
which represents the insulator-to-conductor transition, of PNCs. Moreover, the recent
modeling schemes for PNCs’ electrical conductivity; the recent studies on the effects of
intrinsic conductivity of CNTs, tunneling of contacting CNTs, distribution of CNT length, and
degree of CNT alignment are systematically reviewed.
2.1.1 Percolation phenomenon of electrically conductive PNCs
Due to the exceptional electrical properties and extremely high aspect ratio of CNTs,
it is possible to embed only a small amount of CNTs in polymer matrix to achieve significant
enhancement in the electrical conductivity of PNCs (Dalton 2003). Generally, by gradually
increasing the loading of the conductive fillers (e.g, CNTs) inside the insulating polymer
matrix, the evolution of the conductive network, the percolating phenomenon, has been
divided into three stages by Alamusi et al. (Alamusi 2011). As shown in Figure 2.1, in the first
stage (i.e., state "I"), the electrical conductivity of PNCs is close to that of the neat polymer,
since the amount of CNTs is not sufficient to generate a conductive path inside the polymer
6 | P a g e
matrices, as shown in Figure 2.2(a). As the CNT loading increased, some large clusters
connected by CNTs are gradually formed, which meant that the tunneling effects among
these neighboring CNTs become more significant. The electrical conductivity of composites
increases gradually, though the conductive path is not well established by CNTs. In the
second stage, state "II" in Figure 2.1, a preliminary conductive path is completed, as the
highlighted path in Figure 2.2(b). The electrical conductivity of PNCs increased dramatically,
since the critical concentration of CNTs, namely percolation threshold, is reached.
Consequently, the PNC transited from electrical insulator to conductor due to its electrical
conductivity has been enhanced by several orders of magnitude. In the final stage, state "III"
in Figure 2.1, with further addition of CNTs into polymer matrices, the electrical conductivity
increased gradually. At this stage, the electrically conductive network within a lot of paths is
well established inside polymer matrices, as shown in Figure 2.2(c). Based on such
percolating phenomenon, Kirkpatrick developed the percolation theory to describe such
dependence of PNCs' electrical properties on CNT loading (Kirkpatrick 1973). The theory
can be mathematically represented by Equation (2.1).
( )t
0 c for c (2.1)
where is a physical parameter commonly attributed to the intrinsic conductivity of CNTs;
t is the critical exponent, which is known to be dominated by the dimensionality of the
system; is the volume fraction of the fillers; andc is known as the percolation threshold.

7 | P a g e
Figure 2.1 Electrical conductivity of PNCs at varying filler loading, where “I, II, and III”
denote the different states as PNCs transiting form insulator to conductor.
Figure 2.2 Schematics of the percolation process in PNCs (i.e., the formation of conductive
paths in polymer matrices).
The aforementioned percolation phenomenon was demonstrated in many previously
published experimental results using various types of CNTs, such as SWNTs and MWNTs.
The electrical conductivity of SWNT/Poly(3-octylthiohpene) (P3OT) was investigated by

8 | P a g e
Kymakis et al. (Kymakis 2002). The reported percolation threshold was around 11 wt.%. In
their study, the doping of a polymer (i.e., P3OT) with SWNTs formed a conductive composite
and thereby increased the electrical conductivity by five orders of magnitude. Lower
percolation threshold, 4 wt.%, was achieved in their later work (Kymakis 2006) using
purified SWNTs. Nogales et al. reported that the preparation of SWNT/Polybutylene
terephthalate (PBT) nanocomposites using in situ polycondenstaion led to much lower
percolation threshold (Nogales 2004). It was revealed that the intense dispersion process
by ultra-sonication and ultrahigh-speed stirring of SWNTs in PBT and the subsequent in situ
polycondensation process significantly decreased the percolation threshold. For MWNTs, Hu
et al. fabricated MWNT/Polyethylene terephthalate (PET) nanocomposites using
coagulation process (Hu 2006). Transmission electron microscopy (TEM) and scanning
electron microscopy (SEM) were used to confirm the uniform dispersion of MWNTs
throughout polymer matrix.
2.1.2 Modeling electrical conductivity of PNCs.
In the Monte-Carlo simulation that determines the macroscopic electrical
conductivity of PNCs using a microscopic representative volume element (RVE), it is
assumed that CNT are uniformly dispersed in polymer matrices. Generally in the 3D
modeling, a 3D resistor network model would be constructed inside a RVE to predict the
macroscopic electrical conductivity of nanocomposites (Alamusi 2011). In previous works
(Bao 2011, Hu 2008a), the RVE was assumed to be periodically repeated to represent the
macroscopic behaviours of the PNC, due to the aforementioned uniform distribution of CNTs
inside the polymer matrices. The individual CNT was represented as a "soft-core" capped
9 | P a g e
cylinder with length of L and diameter of D shown in Figure 2.3. The highlighted dash line is
its axle. Such CNTs were randomly distributed in the RVE where periodic boundary
conditions were adopted for CNT configurations. Hu et al. considered the CNTs extruding
through the RVE’s boundary surface to be part of the adjacent RVE by cutting the extruding
portion and relocating it onto the opposite boundary surface (Hu 2008a). However, such
approach overlooked the interconnectivity of CNTs across the boundary surface. Thus, it
required a RVE of large volume, where the boundary condition was negligible, in order to
achieve numerical convergence. Although the large RVE will significantly increase the
computation cost (i.e., running time and memory), a RVE that was sufficiently large (i.e., the
dimension of the cuboid RVEs were chosen as five times the length of CNTs) were chosen in
their numerical work. Bao et al. developed a modeling scheme by considering periodically
connective paths on opposite surfaces of the RVE. It permitted the simulations using a
relatively small RVE. Nevertheless, there were still some possible cases of interconnecting
CNTs across the boundary surfaces of adjacent RVEs that were disregarded under this
approach (Bao 2011). In their work, converged simulation results using RVE with various
sizes were obtained at high CNT loading (i.e., >1.0 vol.%). However, the difference in the
simulation results using various RVE at low CNT loading (i.e., <1.0 vol.%) was obvious.
Furthermore, the “cut-and-relocate” approach, which adopted in both studies to handle
CNTs extruding out of the RVE, would lead to immediate decrease in the length of those cut
CNTs, and thereby generated unnecessary bias on the length distribution of CNTs.

10 | P a g e
Figure 2.3 3D representative element of CNT (i.e., "soft-core" capped cylinder) with length
of L and diameter of D.
In general, if considering the sites inside the RVE occupied by CNTs as conductors
with electrical conductivity equals to the intrinsic conductivity of CNTs and the sites not
occupied by CNTs as insulators with electrical conductivity equals to zero, the determination
of the PNCs' electrical conductivity requires the identification of the interconnectivity among
CNTs. In the numerical work by Hu et al., the shortest distance d (i.e., the length of the
common perpendicular to axial lines of CNTs) between two CNTs were determined. If d was
smaller than the diameter of the CNTs, the two CNTs were identified as in the state of contact
(Hu 2008a). In this numerical work, the contact resistances were ignored. In the later work
by Bao et al., the contact resistances, which were caused by the electron ballistic tunneling
through the contact junction between two CNTs, were considered in generation of
conductive network (Bao 2011). The formulas used in the calculation of contact resistance
will be discussed in detail in later section. Thus, two types of resistances in such conductive
network were considered, namely the intrinsic resistance along CNTs and contact resistance
between two interacting CNTs. After identifying the percolating conductive network of CNTs
inside RVE as well as calculating the two types of resistances, Kirchhoff's circuit laws were
applied to calculate the effective electrical conductivity of the percolating network. In both
of the 3D modeling works by Hu et al. and Bao et al., Monte Carlo simulation scheme was

11 | P a g e
applied to obtain a converged average value of simulated conductivity which represented
the macroscopic electrical conductivity of PNCs.
2.1.3 Intrinsic conductivity of CNTs
Compact physical model was developed for the intrinsic conductivity of CNTs by
Naeemi et al. (Naeemi 2009). In their work, they investigated the conduction mechanism of
SWNTs and MWNTs. The relationship between intrinsic conductivity of CNTs and their
dimensions (i.e., length and diameter) were systematically revealed.
Diameters of CNTs, in particular MWNTs, may vary from few nanometers to hundreds
of nanometers. Meanwhile, their number of shells may vary from a few to many. Initially,
most experiments indicated that only the outer shell in a MWNT conducts. Recently, however,
it has been confirmed that all shell are also contributive to electrical conductivity (Li 2005).
In the numerical work by Naeemi et al., they assumed that the shells have random chirality,
and statistically one third of the shells were going to be metallic while the rest are
semiconducting (Naeemi 2009). Based on this concept, Naeemi et al. systematically
investigated the linear dependence of average number of channels per shell on shells
diameters. Furthermore, the intrinsic conductivity of MWNTs with various diameters was
studied systematically in their work. The intrinsic conductivity with different dimensions
(i.e., diameter and length) can be extracted from the plots of electrical conductivity of
MWNTs with various diameter and length.

12 | P a g e
2.1.4 Tunneling effect of two contacting CNTs
For the dispersion of CNTs in a polymer matrix, due to the high surface-to-mass ratio
of CNTs, molecular scale forces and interactions should be considered among CNTs.
Specifically, van der Waals forces usually promote flocculation of CNTs, whilst electrostatic
charges or steric effects lead to a stabilization of the dispersion through repulsive forces (Hu
2006). In the work by Hu et al., it was reported that CNTs dispersed inside polymer matrices
were coated or encapsulated with a thin insulating polymer layer, due to the interaction
between CNTs and the polymer. The contact region between two CNTs was at the nano-scale,
the dimension of which would be less than the momentum relaxation length and Fermi
wavelength (Venema 1999, Rubio 1999). In the work by Bao et al., the electron tunneling
through the contact junction was reported in the ballistic transport range (Bao 2014), which
can be described in Equation 2.2.
2 22
1
21 ln ln 1)
6(
contact
B
V hR
I e k TM
E
T T T
(2.2)
where h is Planck’s constant, e is electron charge, M is the number of conduction channels,
T is transimission probability for the electron to tunnel through the polymer obstacle
between CNTs, kB is Boltzmann constant, T is the respective temperature, and E is the
height of the potential barrier which is the difference of the work functions between the CNT
(Shiraishi 2011) and polymer (Davis 1969). At room temperature (i.e., T = 300K), the
temperature effect on Rcontact can be ignored, since kBT = 0.026 eV is much smaller than E =
1~5 eV (Li 2007, Hu 2008b). Thus, the formula can be adopted as Equation 2.3.

13 | P a g e
2
1
2contact
V hR
I e M
T (2.3)
The tunneling effect contributes significantly to the conductive network of CNTs,
especially around the percolation threshold. Thus, it is necessary that the resistances due to
the tunneling effect of two contacting CNTs are considered in 3D modeling for electrical
conductivity of PNCs along with intrinsic conductivity of CNTs as described in the previous
section.
2.1.5 Characterization of CNT length distribution
For molecular particles, the physicochemical properties such as molecular weight,
chemical composition, purity, solubility, and stability are usually necessary to analyze. These
properties can be investigated using some well-established techniques, such as gas
chromatography, infrared spectroscopy, nuclear magnetic resonance, mass spectrometry,
and ultraviolet-visible spectroscopy. However, for CNTs dispersing in polymer matrices, it is
challenging to characterize these properties (i.e., the length of CNTs). Experimental evidence
on the effect of CNT length on the thermal, electrical and mechanical properties of PNCs were
observed by Wang et al. (Wang 2013). Thus, characterization of nanotube length is a key step
in both experimental and numerical modelling. Experimental studies have been conducted
to investigate the length distribution of CNTs, including SWNTs (Wang 2006) and MWNTs
(Cheng 2011). Some progress has been made with in situ techniques, which typically only
give an average length and little information about the distribution (Zhou 2004, Kukovecz
2005). On the other hand, direct imaging techniques are more time consuming but typically

14 | P a g e
give more information. In particular, atomic force microscope (AFM) appears to be the most
useful technique among different imaging approaches.
In the experimental work by Wang et al. (Wang 2006), they developed a simple and
efficient means of quantifying a large population of CNT lengths (i.e., sample size n = 651)
using AFM and SIMAGIS software. The length analysis module SIMAGIS provided automatic
analysis AFM images of CNT and precise measurements of CNT length. In their work, the
lengths were extracted and plotted in a histogram. It was obtained that the overall shape of
the histogram could be characterized with either Weibull or log-normal distribution. The
probability plots were generated for these two competing distributions to identify the one
provided the better fit of the measured CNT length. Wang et al. provided the probability plots
of Weibull and log-normal distribution for comparison. The Weibull probability plot
generated a much straighter line than the log-normal plot with a negligible amount of points
deviating very little from the straight line. In other words, only a few measurements
departed from the specified distribution (i.e., Weibull distribution). Thus, the Weibull
distribution, as in Equation 2.4, was used in order to realistically describe the length
distribution of CNTs.
( )bb-1 -axf x abx e (2.4)
where a is the scale parameter and b is the shape parameter. Both of these parameters can
be estimated by maximum likelihood estimation.

15 | P a g e
2.1.6 Effects of CNT alignment on PNCs' electrical properties.
Recent experimental studies have shown that the alignment of CNTs was a crucial
morphology parameter affecting the electrical properties of PNCs. In general, the alignment
of CNTs in polymer matrices can be controlled at different stages of the fabrication process.
Firstly, an isotropic alignment of CNTs can be achieved by growing homogeneous CNT arrays
on substrates using chemical vapor deposition before the fabrication of PNCs. On the other
hand, it was reported that the CNTs dispersed in polymer matrices were aligned by applying
magnetic/electrical fields (Oliva-Aviles 2011) or mechanical stretching and compression of
polymers (Akima 2006) during fabrication of PNCs. In addition to these techniques, other
approaches achieved tailored alignment of CNTs in polymers by adjusting draw ratio in
stretching process (Zamora-Ledezma) or field strength and curing time (Moaseri 2014).
In the work by Du et al., the degree of CNT alignment satisfy the Lorentz distribution,
which is characterized by the full width at half maximum, namely FWHM, (Du 2005). More
specifically, they characterized the degree of CNT alignment using small-angle x-ray
scattering fiber diagram. The parameter, FWHM, was introduced in their work to describe
the CNT alignment quantitatively. Increasing FWHM from 0O (perfectly aligned) to 180O
(isotropic) corresponded to decreasing the degree of CNT alignment. Interestingly, at fixed
2 wt.% CNT loading, the electrical conductivity of PNCs showed a sharp increment with
respect to the degree of CNT alignment. It was observed that the electrical conductivity
increased dramatically, from 6.5×10⁻¹¹ to 4.4×10⁻⁶ S/cm, as the FWHM varied from 20O to
36O. The hypothetical explanation was provided by Du et al.. When the CNTs were highly
aligned, they rarely touch each other and thus did not form conductive path at small loading
16 | P a g e
(<3 wt.%). Consequently, the electrical conductivity was relatively low, comparing to the
cases with lower degree of CNT alignment, when CNTs were highly aligned at small loading.
Upon decreasing the degree of alignment (i.e., increasing FWHM), the CNTs started to contact
each other, until the FWHM approached a critical value where the CNTs formed the
conductive paths. Such percolation phenomenon of increasing FWHM was similar to the
aforementioned percolation phenomenon when increasing the CNT loading. From the study
conducted by Du et al., the electrical conductivity showed a non-monotonic dependence on
the extent of CNT alignment and reached a maximum at a specific orientation (Du 2005).
Besides experimental work, numerical works were also conducted using two-
dimensional (Du 2005), pseudo three-dimensional (Behnam 2007), and three-dimensional
models (White 2009, Bao 2011), in attempt to determine the effect of CNT alignment on the
electrical conductivity of PNCs. In particular, Bao et al. used a 3D random resistor network
model with consideration of both intrinsic and contact resistances. The CNT alignment was
controlled by setting the maximum alignment angle max. As shown in Equations 2.5, the
azimuthal angle i and polar angle i were generated randomly within their own range [0,
2] and [-max, max], respectively.
2i
rand (2.5a)
cos (1 cos ) cosi max max
rand (2.5b)
The effects of CNT alignment were investigated in the work conducted by Bao et al.
qualitatively (Bao 2011). Firstly, parallel or almost parallel CNTs were less likely to contact
each other and thereby difficult to form the connective paths (i.e., less conductive paths),

17 | P a g e
which was consistence with the aforementioned experimental study by Du et al.. On the other
hand, reducing the degree of CNT alignment would lead to increment in the length of the
conductive paths (i.e., longer conductive paths). Consequently, these two mechanisms had
counter effects on electrical conductivity of PNCs. Maximum electrical conductivity was
obtained in an optimal degree of CNT alignment.
2.2 Piezoresistivity of PNCs
PNCs with improved electrical conductivity are considered as emerging materials for
highly sensitive strain sensor, due to the strain-induced resistivity change behaviour, namely
piezoresistivity (Alamusi 2011). Recently, there have been experimental and numerical
studies on the piezoresistivity of PNCs. In this section, the piezoresistive behaviour of PNCs
will be first discussed, followed by the recent modeling schemes for PNCs’ piezoresistivity.
Then, the modeling on the fiber reorientation model is reviewed.
2.2.1 Piezoresistive behaviour of electrically conductive PNCs
The electrically conductive PNCs were increasingly being considered as promising
alternatives to conventional smart materials. Recent experimental studies have been
conducted to investigate the strain-induced changes in the resistance of PNC (i.e.,
Piezoresistivity).
Park et al. investigated the change in electrical resistances of polyethylene oxide
(PEO)/multi-walled carbon nanotubes (MWNTs) nanocomposites subjected to different
levels of strain at different MWNTs loadings (i.e., 0.56 vol.% and 1.44 vol.%). Linear
relationship between the PNC’s resistance and applied strain was reported (Park 2008). The
18 | P a g e
unique and repeatable strain-induced electrical resistance changes were observed at
different loading of MWNTs. The overall pattern of electrical resistance change versus
applied strain for the specimens of different volume fraction of MWNTs consisted of a linear
region followed by nonlinear behaviour. In the linear region, it was hypothesized that the
contact of MWNTs inside polymer matrix was maintained during stretching of the film (i.e.,
applying the external strain). However, after passing the critical strain, the contact of
MWNTs was hypothesized to be broken down in non-linear region; and electron tunneling
played a dominant role within this region. Park et al. concluded that such linear relationship
between applied strain and the electrical resistance changes of PEO/MWNT specimens
permitted these materials to be used as strain sensors in many applications.
Similarly, Fernberg et al. revealed that the electrical resistance of CNTs doped epoxy
depended linearly on the applied strain (Fernberg 2009). In their work, the electrical
resistivity of PNC with 0.5wt.% MWNT loading linearly increased with increasing strain,
until ultimate failure of the specimen which occurred at the loading above 1.6% strain.
Furthermore, they identified three different mechanisms contributing to the strain-induced
resistance changes of the specimen, which are (a) geometrical changes of the specimen, (b)
piezoresistive material response, and (c) microstructural damage.
Extensive experimental studies, including but not limited to the aforementioned
studies, have been conducted to study PNCs’ piezoresistivity and they provided invaluable
insights in the piezoresistive behaviours of PNCs. In general, the measured piezoresistivity
of PNCs were qualitatively attributed to three hypothetical mechanisms: (i) reconfiguration
of CNTs conductive network in the PNC; (ii) change in tunneling resistance at CNTs junctions;

19 | P a g e
and (iii) change in the intrinsic electrical resistance of CNTs (Alamusi 2011). However,
fundamental understanding of the governing mechanisms contributed to the piezoresistive
behaviours in PNCs filled with CNTs has yet been elucidated.
2.2.2 Modeling piezoresistivity of PNCs.
Comparing with the experimental studies mentioned in the previous section, to
author's best knowledge, there have been very limited theoretical or numerical studies on
the piezoresistive behaviour of PNCs filled with CNTs. Up to date, only a few numerical
modeling studies were focusing on the investigation of the working mechanisms of PNCs'
piezoresistivity. Pham et al. applied an empirical model, based on the percolation theory, to
investigate the effects of conductive network density and tunneling distance on sensitivity
of PNCs’ piezoresistivity (Pham 2008). They discovered that piezoresistivity increased
significantly by having the filler content approach the percolation threshold. Oliva-Avilés et
al. proposed an analytical model to evaluate the effects of CNT deformation and its influence
on PNCs’ piezoresistivity (Oliva-Avilés 2011). It was discovered that the strain-induced
reconfiguration of CNT conductive network was the main governing factor to PNC’s
piezoresistivity, while the deformations of CNTs in length or diameter were negligible.
Besides the empirical model, 2D and 3D modeling in PNCs' piezoresistivity were
performed by several researchers. In the work by Theodosiou et al., the 2D and 3D
percolation models were used to numerically study the piezoresistive behaviours of PNCs
(Theodosiou 2010). In the model, the percolation probability was determined as number of
percolating CNTs that contributed to the conductive network over the total number of CNTs.
In their work, the effect of applied strain on such percolation probability was revealed. They

20 | P a g e
reported that the piezoresistive behaviours were dominated by piezoresistive response of
CNTs themselves within the strain range of 3.0%, while the effect of deformation of the
percolation conductive network was negligible. However, in their work, the simulated
results of PNCs' percolation threshold varied from experimental results. Furthermore, the
validation of simulated PNCs' piezoresistivity was absent.
Hu et al. conducted numerical simulation to understand the piezoresistivity of PNCs.
The developed model considered the tunneling effects when building the conductive
network. The tunneling distance and thereby the tunneling resistances between CNTs were
updated based on the rigid body movement of the CNTs under applied strain. They reported
that the tunneling effect played a dominating role in piezoresistivity, while the contribution
of the network breakup was not significant under small strains (i.e., 1.0%). Moreover, the
tunneling resistance increased exponentially with the tunneling distance which was
hypothetically increased under external strain. Consequently, they concluded that the strain-
induced resistance change was dominated by the tunneling effect between contacting CNTs,
instead of the breakup of the conductive network. However, nonlinear piezoresistivity was
obtained in their simulation which was different to most of experimental works. Meanwhile,
the direct evidences, such as the degree of the increment in tunneling resistance and the
degree of breakup of the conductive path, lacked when they went to the aforementioned
conclusion.
While different analytical and numerical studies have attempted to explain the
piezoresistivity of PNCs from different perspectives, there is no systematical quantitative
analysis that decouples the effects of different governing factors on PNC’s piezoresistivity,

21 | P a g e
including (i) destruction of CNT conductive networks; (ii) reorientation of CNTs; (iii)
alternation of CNT conductive networks; (iv) variation in tunneling resistance; and (v)
change in intrinsic resistance along CNT in the conductive paths.
2.2.3 Fiber reorientation model
Fiber reorientation model can be applied to the composite system with the aim of
predicting the relation between the applied strain and the reorientation of conductive short
fibers (i.e., CNTs). Such model realistically represented the strain-induced reconfiguration of
CNTs conductive network within the polymer matrix (Taya 1998). Furthermore, such model
can help to reveal the governing factors of PNCs’ piezoresistive behaviours when the strain
applied, such as reorientation of CNTs, destruction of CNT conductive network and
alternation of CNT conductive network.
As discussed by Taya et al., the orientation and relocation of fibers in an elastomeric
composite were expected to take place under applied strain (Taya 1998). Consequently, if
the microstructure of conductive short fibers was initially percolating, the percolating
microstructure was degenerated to less- or non-percolation network as the applied strain
increases. In the fiber reorientation model presented by Taya et al., it was assumed that upon
incremental uniaxial straining along the x axis, the changes in the orientation and location of
a short fiber (i.e., CNT) were determined based on the affine transformation, which assumed
that the length components of a fiber in particular direction (i.e., length components in x, y
and z axes) would change by the same ratio as the corresponding dimensions (i.e., x, y and z
directions) in the matrix. In the 3D modeling for the piezoresistivity of PNCs, the fiber

22 | P a g e
reorientation model would be used to realistically represent the strain-induced
morphological changes in CNT conductive network.
2.3 Summary
In summary, this chapter presents the extensive experimental and numerical studies
on the electrical conductivity of nanocomposites made from insulating polymers filled by
CNTs have been conducted by researchers. The concept of percolation phenomenon in CNT-
polymer PNC has been discussed. While researchers have progressively improved the
models used to determine PNC’s electrical conductivity, a number of shortcomings in
existing modeling schemes were also discussed. As a result, it is important for researchers
to develop new modeling schemes to determine PNC’s electrical conductivity. One of the
most important aspects is to improve the computational efficiency without compromising
the accuracy of the simulation results.
Moreover, this chapter also provides a summary of the experimental and numerical
studies of the piezoresistive PNC. Although different analytical and modeling studies have
attempted to explore the piezoresistivity of PNCs from different perspectives, quantitative
analyses on the effects of different microscopic governing factors on PNC’s macroscopic
piezoresistive behaviours were scarce. This led to a barrier to elucidate the structure-to-
property relationship of piezoresistive PNC filled with CNT.
23 | P a g e
CHAPTER 3 Electrical Conductivity of PNCs
3.1 Theoretical framework
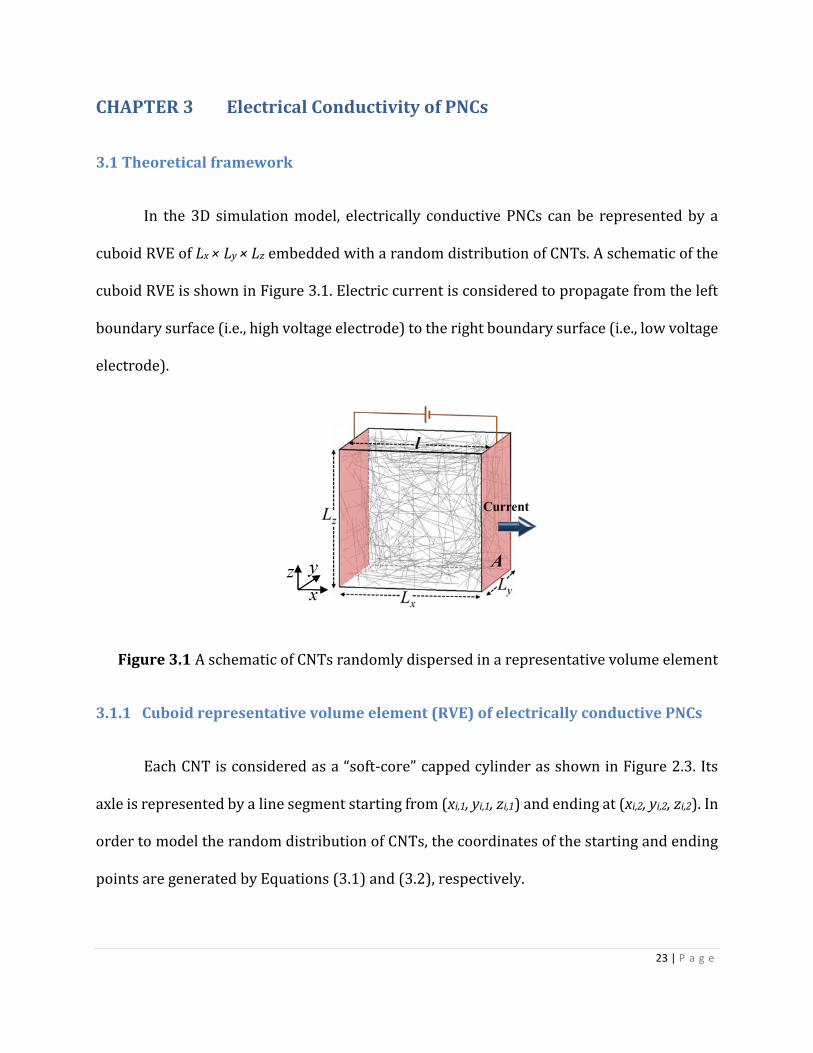
In the 3D simulation model, electrically conductive PNCs can be represented by a
cuboid RVE of Lx × Ly × Lz embedded with a random distribution of CNTs. A schematic of the
cuboid RVE is shown in Figure 3.1. Electric current is considered to propagate from the left
boundary surface (i.e., high voltage electrode) to the right boundary surface (i.e., low voltage
electrode).
Figure 3.1 A schematic of CNTs randomly dispersed in a representative volume element
3.1.1 Cuboid representative volume element (RVE) of electrically conductive PNCs
Each CNT is considered as a “soft-core” capped cylinder as shown in Figure 2.3. Its
axle is represented by a line segment starting from (xi,1, yi,1, zi,1) and ending at (xi,2, yi,2, zi,2). In
order to model the random distribution of CNTs, the coordinates of the starting and ending
points are generated by Equations (3.1) and (3.2), respectively.

24 | P a g e
,1i xx L rand (3.1a)
,1 yiy L rand (3.1b)
,1i zL nz ra d (3.1c)
where rand is a uniformly distributed random number in [0,1].
,2 ,1 cos sini i CNT i ix x L (3.2a)
,2 ,1 sin sini i CNT i iy y L (3.2b)
,2 ,1 cosi i CNT iz z L (3.2c)
where LCNT is the average length of the CNT; i is the azimuthal angle; and i is the polar angle.
The orientation of CNTi is defined by the azimuthal and polar angles, which can be generated
by Equations (3.3a) and (3.3b), respectively.
2i
rand (3.3a)
cos (1 cos ) cosi max max
rand (3.3b)
where max is the upper limit of the alignment angle (i.e., the angle between the CNT and the
x-axis). max equals to /2 represents the case of PNCs with isotropically distributed CNTs
without any preferential orientation; max equals to zero represents the case of PNCs with all
CNTs perfectly aligned in the direction of the current flow (i.e., the x-axis).

25 | P a g e
3.1.2 Electrical conductivity of PNCs represented by an individual cuboid RVE
In the simulation model, all the interconnecting CNTs that bridge the two electrodes
in a RVE are identified to construct the random resistor network. Similar to the previous
numerical studies (Hu 2008b, Bao 2011), two types of resistances in the percolating CNTs
network are considered, namely the intrinsic resistance (Rintrinsic) along an individual CNT
and the contact resistance (Rcontact) between two CNTs. Referring to Figure 3.2, two CNTs are
considered to be connected and form a continuous electrically conductive path when the
shortest distance between them is shorter than the cut-off distance (dcutoff). The intrinsic
resistance along CNTi, between Nodek and Nodel, can be calculated by Equation (3.4).
, 2
4 klintrinsic kl
CNT
lR
D (3.4)
where CNT is the intrinsic electrical conductivity of the CNT; D is the diameter of the CNT;
and lkl is the distance between Nodek and Nodel.
Figure 3.2 A schematic of CNTs' interconnection.
The contact resistance between CNTi and CNTj is induced by electron ballistic
tunneling through the contact junction. The Landauer-Büttiker formula can be used to
estimate the contact resistance (Buldum 2001), which depends on the shortest distance

26 | P a g e
between them (i.e., dkp), which is shorter than dcutoff. Its value can be determined by Equations
(3.5a) through (3.5c).
, 2
1
2contact kp
hR
e M
T (3.5a)
exp for 0
exp for
vdwkp vdw
tunnel
kp
vdw kp cutoff
tunnel
dd D d
d
d DD d d D d
d
T (3.5b)
1
2 2tunnel
e
hd
m
(3.5c)
where h is Planck’s constant; T is the transmission probability for the electron to tunneling
between CNTs through polymer; M is the number of conduction channels, which is
dimensionless and related to CNT’s diameter (Naeemi 2009); e is the charge of an electron;
dvdw is the van der Waals separation distance caused by the Pauli exclusion principle (Hertel
1998, Girifalco 2000), which limits the minimum distance between two CNTs; dtunnel is the
tunneling characteristic length; me is the mass of an electron; and ΔE is the height of energy
barrier (Simmons 1963).
After identifying the random resistor network of CNTs in the RVE as well as
calculating the Rintrinsic and Rcontact of all CNTs in the network, a conductance matrix is
constructed to represent the network using the Kirchhoff’s circuit laws (Knudsen 2006). The
equivalent conductance of this conductive network (i.e., denoted as GRVE) can be obtained

27 | P a g e
using the Gaussian decomposition method. Consequently, the PNC’s electrical conductivity,
,can be obtained by Equation (3.6).
x
RVE RVE
y z
l LG G
A L L (3.6)
where l is the distance between the left and right boundary surfaces; and A is the cross-
sectional area of the RVE.
3.1.3 Electrical conductivity of PNCs by considering the interconnectivity of CNTs
across the RVEs’ boundary surfaces
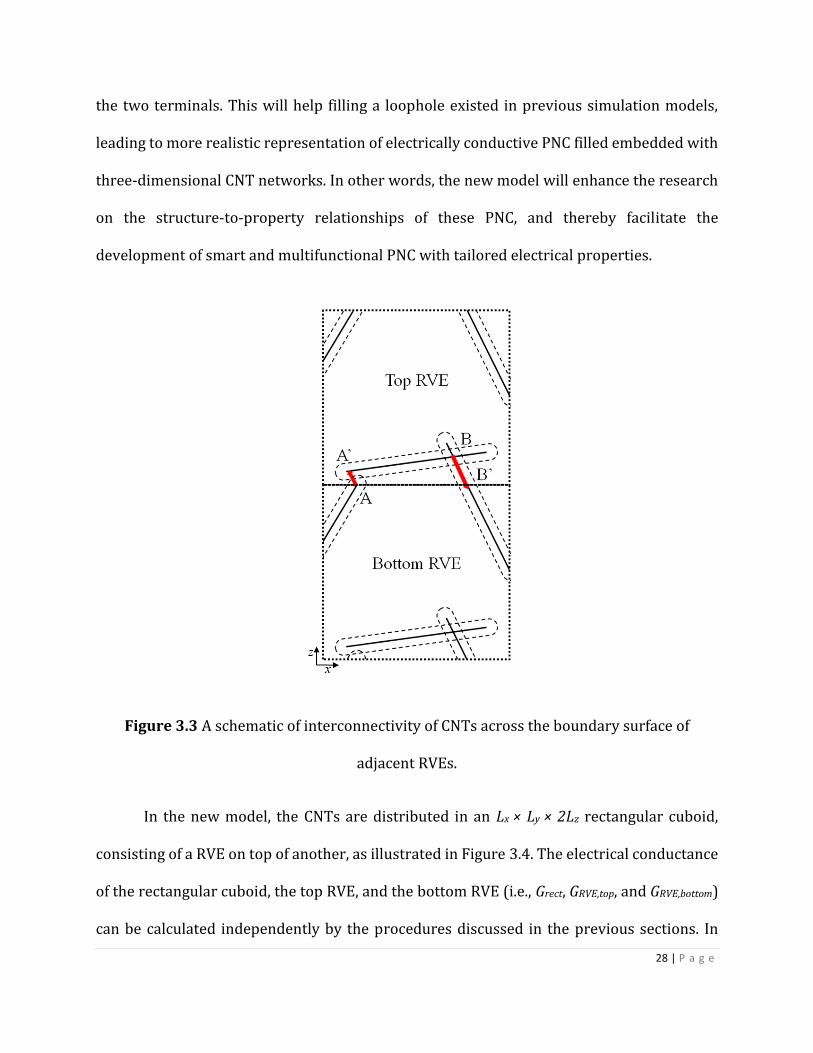
Figure 3.3 shows a schematic that illustrates the interconnectivity of CNTs across a
boundary surface between adjacent RVEs. It is apparent that the simulation procedures
described in the previous sections will neglect the highlighted conductive pathways
generated by CNTs across the boundary surface (i.e., path AA’ and BB’ in Figure 3.3). This
would lead to an underestimation of the PNC’s and an overestimation of the PNC’s c by the
model, especially for a relatively small RVE. One possible solution to circumvent this problem
is to use a RVE that is sufficiently large such that the error caused by the ignorance of the
cross-boundary CNTs would reduce. However, such approach will significantly increase the
computation cost (i.e., time and memory) to run the simulation. Therefore, a new model is
developed in this work to account for the electrical conductivity contributed by the
interconnecting CNTs in adjacent RVEs across the boundary surfaces. Without adopting the
“cut-and-relocate” approach to handle CNTs penetrating the RVE’s boundary, it is possible
to avoid the unnecessary bias that immediately increases the number of CNTs penetrating
28 | P a g e
the two terminals. This will help filling a loophole existed in previous simulation models,
leading to more realistic representation of electrically conductive PNC filled embedded with
three-dimensional CNT networks. In other words, the new model will enhance the research
on the structure-to-property relationships of these PNC, and thereby facilitate the
development of smart and multifunctional PNC with tailored electrical properties.
Figure 3.3 A schematic of interconnectivity of CNTs across the boundary surface of
adjacent RVEs.
In the new model, the CNTs are distributed in an Lx × Ly × 2Lz rectangular cuboid,
consisting of a RVE on top of another, as illustrated in Figure 3.4. The electrical conductance
of the rectangular cuboid, the top RVE, and the bottom RVE (i.e., Grect, GRVE,top, and GRVE,bottom)
can be calculated independently by the procedures discussed in the previous sections. In

29 | P a g e
Figure 3.4, the CNTs penetrating across the boundary surface are highlighted. Among them,
some CNTs contributing to the electrically conductive pathways in the rectangular cuboid
cell may contribute neither to the electrically conductive pathways in the top RVE nor to the
bottom RVE. In other words, they are independent of the CNT networks contributed to
GRVE,top and GRVE,bottom. These extra electrically conductive pathways would lead to additional
electrical conductance in both the bottom boundary surface of the top RVE and the top
boundary surface of the bottom RVE.
Figure 3.4 CNTs distributed in a rectangular cuboid (note: CNTs penetrating across the
boundary surface are highlighted).
Considering the isotropic random distribution of CNTs, the additional electrical
conductance in both the bottom boundary surface of the top RVE and the top boundary
surface of the bottom RVE can be approximated to equal each other, and they can be denoted

30 | P a g e
as Gboundary. These additional and independent pathways (Gboundary), bridging the left
boundary surface (i.e., high voltage electrode) and the right boundary surface (i.e., low
voltage electrode), are parallel to the CNT networks in the cores of the top RVE (GRVE,top) and
the bottom RVE (GRVE,bottom). Hence, the relationship among Grect, GRVE, and Gboundary (i.e., the
average of GRVE,top, and GRVE,bottom) can be expressed by Equation (3.7).
2 2rect RVE boundaryG G G (3.7)
Similarly, the front and back boundary surfaces of each cuboid RVE would also
contribute to additional electrical conductance of the RVE. All together, the conductance of
an individual cuboid RVE, accounting for the additional electrical conductance contributed
by the four boundary surfaces parallel to the direction of electric current, can be determined
by Equation (3.8).
4adj RVE boundaryG G G (3.8)
where Gadj and GRVE are the equivalent electrical conductance with and without considering
the additional conductance contributed by the interconnecting CNTs across the boundary
surfaces, respectively.
Combining Equations (3.7) and (3.8), the equivalent electrical conductance of an
individual RVE can be expressed as Equation (3.9).
2 3adj re RVct EG G G (3.9)
31 | P a g e
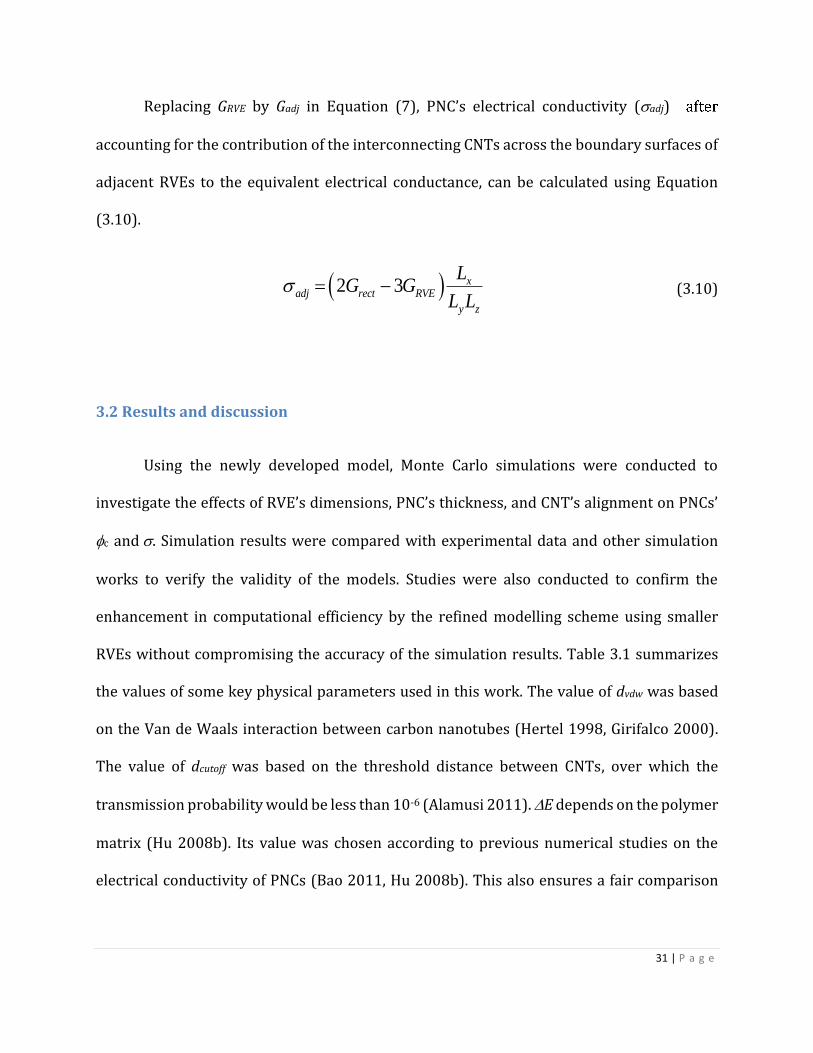
Replacing GRVE by Gadj in Equation (7), PNC’s electrical conductivity (adj)
accounting for the contribution of the interconnecting CNTs across the boundary surfaces of
adjacent RVEs to the equivalent electrical conductance, can be calculated using Equation
(3.10).
2 3 xadj rect RVE
y z
LG G
L L (3.10)
3.2 Results and discussion
Using the newly developed model, Monte Carlo simulations were conducted to
investigate the effects of RVE’s dimensions, PNC’s thickness, and CNT’s alignment on PNCs’
c and . Simulation results were compared with experimental data and other simulation
works to verify the validity of the models. Studies were also conducted to confirm the
enhancement in computational efficiency by the refined modelling scheme using smaller
RVEs without compromising the accuracy of the simulation results. Table 3.1 summarizes
the values of some key physical parameters used in this work. The value of dvdw was based
on the Van de Waals interaction between carbon nanotubes (Hertel 1998, Girifalco 2000).
The value of dcutoff was based on the threshold distance between CNTs, over which the
transmission probability would be less than 10-6 (Alamusi 2011). E depends on the polymer
matrix (Hu 2008b). Its value was chosen according to previous numerical studies on the
electrical conductivity of PNCs (Bao 2011, Hu 2008b). This also ensures a fair comparison

32 | P a g e
between our simulation results in this thesis to those based on other models reported in
literatures (Bao 2011, Hu 2008b) in the later sections.
Table 3.1 Physical Parameters used in simulation
Physical Parameters Value Unit
Van der Waals separation distance (dvdw) [35, 36] 3.4 Å
Cut-off distance (dcutoff) [23] 1.4 nm
Energy barrier (E) [23, 39] 1.0 eV
3.2.1 Effects of RVE’s dimensions on the simulation results of electrical conductivity
Various studies have demonstrated that the simulation results of PNC’s using the
3D resistor network model are sensitive to the dimensions of the RVE. In order to suppress
the effect of RVE’s size on the simulation results, Hu et al. (Hu 2008a, Hu 2008b) showed that
a cuboid RVE of 25 m × 25 m × 25 m was needed to simulate c and of PNCs filled with
CNTs with an average length of 5 m in order to achieve numerical convergence. However,
the relatively large RVE also led to a surge in computational burden. In order to demonstrate
the sensitivity of the simulation results based on the refined model on the RVE’s dimensions,
a series of simulations using RVEs with different sizes were conducted and the results are
shown in Figures 3.5(a) through 3.5(d). As a case example, the physical parameters of CNTs
used in the simulations were the same as those used by Hu et al.. Hence, the length and
diameter of CNTs were set to be 5 m and 50 nm, respectively. In addition, the number of

33 | P a g e
conduction channels (M) and intrinsic electrical conductivity of a CNT (CNT), were chosen to
be 460 and 1 × 10⁴ S/m, respectively (Naeemi 2009).
Figure 3.5 Simulation results of PNC's adj at different CNT loadings based on (a) cubic
RVEs with different dimensions; (b) cuboid RVEs with fixed Lx (i.e., 1.5 × LCNT) but varying
Ly and Lz; (c) cuboid RVEs with fixed Ly and Lz (i.e., 1.5 × LCNT) but varying Lx; and (d)
relative difference of simulated adj and with varying Ly and Lz.
Figure 3.5(a) depicts that the simulation results of PNCs’ adj were sensitive to the
changes in cubic RVEs’ dimensions at low CNT loadings (i.e., < 0.01). It is apparent that

34 | P a g e
simulated adj at different CNT loadings converged as the RVEs’ dimensions increased.
Regardless of the RVEs’ sizes, the PNCs’ adj rapidly increased at low CNT loadings and
approached to a plateau as increased. The general trends were consistent with the
numerical works conducted by Hu et al. (Hu 2008b). Figures 3.5(b) and (c) plot the effect of
simultaneously varying Ly and Lz while fixing Lx, and that of varying Lx while fixing Ly and Lz,
respectively, on PNCs’ adj. These results would help to decouple the influence of varying the
dimension parallel to the direction of current flow from that of varying the dimensions
perpendicular to the current flow. As shown in Figure 3.5(b), when Lx was fixed to 1.5 × LCNT ,
PNCs’ adj were unaffected by varying Ly and Lz, regardless of the CNT loadings. In contrast,
Figure 3.5(c) reveals that when Ly and Lz were fixed, the simulated PNCs’ adj were sensitive
to the change of Lx at low CNT loadings (i.e., < 0.01), while they were virtually indifferent
at higher CNT loadings. The figure suggested that the simulation results started to converge
when Lx was greater than or equal to 4.0 × LCNT. Figure 3.5(d) shows the relative difference
between the simulation results with and without considering the contribution of
interconnecting CNTs across the boundary surfaces (i.e., adj and ) when different Ly and
Lz were used. The relative difference reduced as Ly and Lz increased. In other word, the
contribution made by the interconnecting CNTs across the boundary surfaces to PNC’s
electrical conductivity was more significant at smaller Ly and Lz.
Since varying Ly and Lz while fixing Lx were proven to have negligible influence on the
simulation of PNCs’ , it is possible to significantly improve the computational efficiency of
the Monte Carlo simulation by reducing Ly and Lz. Figure 3.6 compares the simulation time
per run for the case using RVE with all dimensions equaled to 4.0 × LCNT with that for the case
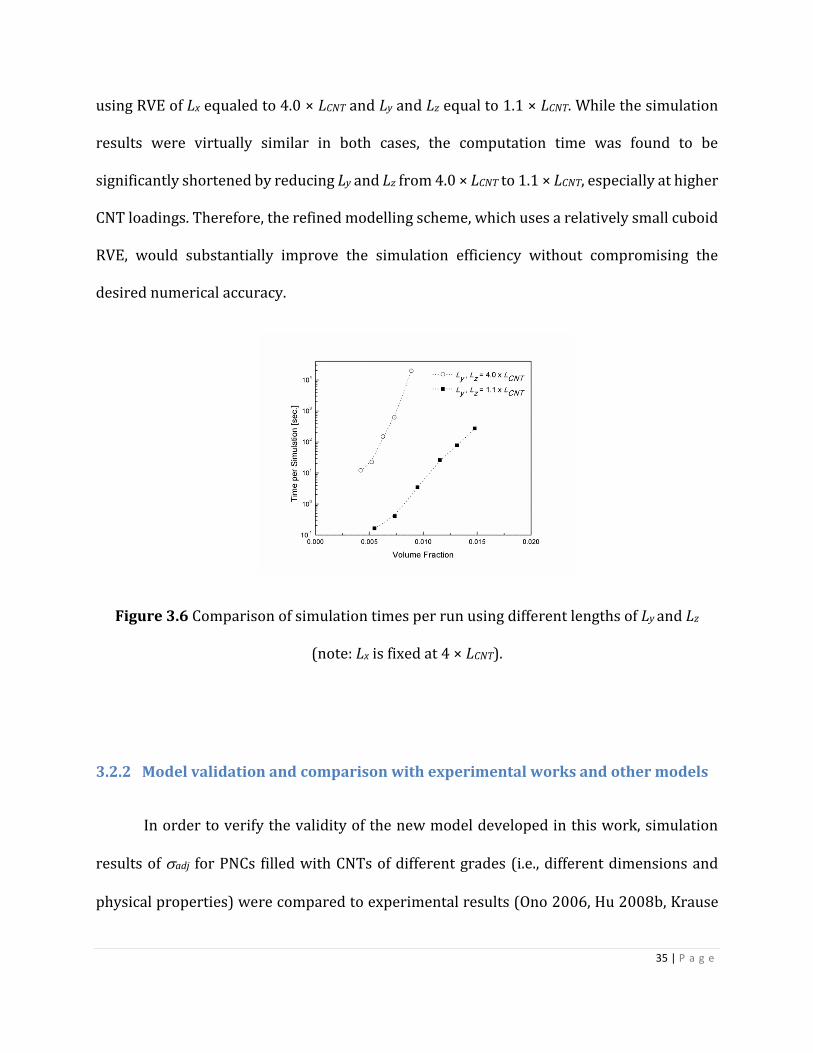
35 | P a g e
using RVE of Lx equaled to 4.0 × LCNT and Ly and Lz equal to 1.1 × LCNT. While the simulation
results were virtually similar in both cases, the computation time was found to be
significantly shortened by reducing Ly and Lz from 4.0 × LCNT to 1.1 × LCNT, especially at higher
CNT loadings. Therefore, the refined modelling scheme, which uses a relatively small cuboid
RVE, would substantially improve the simulation efficiency without compromising the
desired numerical accuracy.
Figure 3.6 Comparison of simulation times per run using different lengths of Ly and Lz
(note: Lx is fixed at 4 × LCNT).
3.2.2 Model validation and comparison with experimental works and other models
In order to verify the validity of the new model developed in this work, simulation
results of adj for PNCs filled with CNTs of different grades (i.e., different dimensions and
physical properties) were compared to experimental results (Ono 2006, Hu 2008b, Krause

36 | P a g e
2011). Figure 3.7(a) plots the comparison of simulated PNCs’ adj with experimental
measurements for PNCs filled with multi-walled carbon nanotubes (MWNTs) of LCNT and D
equaled to 5 m and 50 nm, respectively. Unlike most of other numerical studies that
selected values of CNT’s CNT within the typical range reported in literature, the simulation
in this work considered the dependence of CNT and M on the dimensions of CNTs (Naeemi
2009) in order to conduct more realistic simulation. These two parameters were determined
to be 2.1 × 10³ S/m and 460, respectively. It can be observed that the numerical predictions
of PNCs’ adj at different CNT loadings showed good agreement with experimental results.
Figure 3.7(b) illustrates the comparison of simulated PNCs’ adj with experimental data for
PNCs filled with MWNTs of smaller dimensions yet higher aspect ratio. Distribution of LCNT
was characterized by Krause et al. using a normalized frequency versus CNT’s length bar
chart (Knudsen 2006). In our simulation work, the Weibull Distribution (Wang 2006), as
Equation (3.11), was used to represent such distribution of LCNT.
1
,( ; )
0?
kx
kk x
fe
x k
0,
0,
x
x
(3.11)
where is the scale parameter and k is the shape parameter.
The average length and diameter of the MWNTs were determined to be 1.603 m and
9.5 nm, respectively. The resultant CNT and M were equal to 900 × 103 S/m and 87,
respectively (Naeemi). Similar to the previous case, the PNCs’ adj, numerically predicted by
the new model and simulation scheme, showed good agreement with the experimental
measurements. In short, the good agreement between the simulation results and the

37 | P a g e
experimental results for the electrical conductivity of PNCs filled with different grades of
MWNTs suggest that the refined model and simulation scheme can be used as a strategic tool
to design CNT loadings and CNTs’ degree of alignment to tailor the PNCs’ c and . This will
facilitate the identification of structure-to-property relationship of electrically conductive
PNC embedded with three-dimensional CNT network. Moreover, it will enhance the research
and development of smart and multifunctional PNC with tailored electrical properties.
Figure 3.7 Comparison of simulation results of PNCs’ adj with existing experimental data
obtained by: (a) Y. Ono et al., N. Hu et al., and NCT Co. Ltd.; and (b) B. Krause et al..
Simulations results obtained using the refined model were also compared with other
numerical studies, based on the 3D random resistor network model, conducted by Hu et al.
(Hu 2008b) and Bao et al. (Bao 2011). The comparisons are plotted in Figures 3.8(a) and
3.8(b). Since Hu et al. employed a cubic RVE with side length of 5 × LCNT, the RVE used herein
had Lx equaled to 5 × LCNT, while Ly and Lz equaled to 1.1 × LCNT in order to ensure a fair
comparison. The reduced lengths in both Ly and Lz were justified by the insensitivity of the
simulation results to the changes in these two dimensions. Bao et al., on the other hand,

38 | P a g e
employed a cubic RVE of its side length equal to 1.1 × LCNT. Therefore, to ensure a fair
comparison, the simulation results to be compared with their results were generated based
on two cases: (i) a RVE of identical dimensions Lx= Ly = Lz = 1.1 × LCNT; and (ii) a RVE of Lx
equaled to 4 × LCNT, while Ly and Lz equaled to 1.1 × LCNT.
Figure 3.8 Comparison of simulation results with other numerical studies: (a) N. Hu et al.,
(b) W. S. Bao et al., based on the 3D resistor network model.
Figure 3.8(a) illustrates the comparison between the simulation results of and adj
and the predicted obtained by Hu et al. (Hu 2008b). The plot reveals that adj (i.e., predicted
electrical conductivity by considering interconnecting CNTs at the boundary) was higher
than (i.e., predicted electrical conductivity without considering interconnecting CNTs at
the boundary) for PNCs with different CNT loadings; however, the difference between them
reduced with increasing loads of CNT. This trend can be attributed to the establishment of
sufficient number of electrically conductive paths in the PNC’s core at higher CNT contents.
In other words, the relative contribution of interconnecting CNTs across the RVE’s boundary
surface to the overall conductive network gradually decreased. Moreover, Figure 3.8(a) also
reveals that the simulation results reported by Hu et al. were consistent with adj and

39 | P a g e
simulated in this work at a wide range of CNT loadings. The similar values of c are obtained.
Nevertheless, obvious differences can be observed for PNCs with CNT’s volume fraction
either below ~0.013 or above ~0.03. At lower CNT loading (i.e., < 0.013), by cutting the
extruding portion of CNTs outside the RVE and relocating them onto the opposite boundary
surfaces, Hu et al. unintentionally generated bias on the random distribution of CNTs and
resulted in a higher than usual number of CNTs in contact with the two electrodes (i.e., the
left and right boundaries of RVE). This led to a higher simulated than our predicted . At
higher CNT loading (i.e., > 0.03), the error caused by the ignorance of the contact resistance
among interconnecting CNTs by their work became more significant as the number of
interconnecting CNTs in the random resistor network increased. Therefore, it would lead to
an overestimation of PNCs’ , which resulted in a simulation result higher than the predicted
in this work. This was also consistent with the later work by Hu et al. (Hu 2008b) that
demonstrated the significance of tunneling effect on PNCs’ .
Figure 3.8(b) illustrates the comparison between the simulation results by Bao et al.
(Bao 2011) and the simulated adj based on RVEs of the aforementioned two dimensions.
Comparing the trends among the three plots, it is worthwhile to note that the trends of our
calculated adj using a cubic RVE with its side length equaled to 1.1 × LCNT was similar to the
simulated reported by Bao et al. This also resulted in very similar c between their work
(i.e., c = 0.00279) and this study (i.e., c = 0.00288). However, it is apparent that their
predicted was consistently lower than the simulated adj in this work at all CNT loadings.
Using the “cut and relocate” approach, the CNT’s length, and thereby the aspect ratio in their
relatively small RVE would be decreased significantly. This would reduce the probability to

40 | P a g e
generate an electrically conductive pathway, leading to lower predicted values of PNC’s .
Moreover, obvious difference can be seen when comparing their predicted with the
simulated adj based on a RVE with Lx equaled to 4 × LCNT. By increasing Lx to 4 × LCNT, the c
of the PNC increased dramatically (i.e., c = 0.00546) because of the lower probability to
develop a continuous conductive channel along a longer path. This again confirmed that a
sufficient length in the direction of current flow is needed to achieve numerical convergence.
3.2.3 Effect of the distance between two electrodes in a RVE on percolation threshold
As previously shown in Figure 3.5(c), the simulated PNC’s adj was predominantly
influenced by the change in Lx (i.e., the distance between two electrodes in a RVE), especially
at low CNT loadings (i.e., < 0.01). Such influence was negligible at higher CNT loadings. To
more clearly demonstrate the effect of changing Lx on the formation of conductive CNT
network in a polymer matrix, the power law fitting based on the percolation theory (i.e.,
Equation (2.1)) was applied to determine the PNC’s c for varying Lx was applied to
determine the PNC's c for varying Lx, and the results are plotted in Figure 3.9. It is apparent
that c increased as the volume of the RVE increased by only increasing Lx. In contrast, when
the volume of the RVE increased by simultaneously increasing both Ly and Lz, the PNC’s c
remained relatively constant. Overall, it is reasonable to conclude that c has a positive
relationship with Lx, but is virtually independent of Lx and Lz. This finding on the effect of
increasing Lx on c is consistent with the experimental observations reported by Fu et al. (Fu
2009). It was proven experimentally that PNC’s c would be influenced by the test sample’s

41 | P a g e
thickness, across which the PNC’s was measured. Their experimental measurements
revealed that PNC’s increased significantly with the thickness of the PNC sample.
Figure 3.9 Calculated percolation threshold using different RVEs, cuboid RVEs with fixed Ly
and Lz (i.e., 1.5 × LCNT) but varying Lx; and cuboid RVEs with fixed Lx (i.e., 1.5 × LCNT) but
varying Ly and Lz.
The positive relationship between Lx and PNC’s c can be explained by considering
the probability of having the minimum number of CNTs to construct an electrically
conductive pathway across the two terminals. Under the percolation theory, c is the critical
concentration of CNTs at which the formation of the first conductive CNT pathway, bridging
the two electrodes across the RVE (i.e., across Lx,). Increasing Lx means a longer separation
distance between the two electrodes, leading to the needs of a larger number of CNTs to
construct a conductive path. For a given loading of randomly dispersed CNTs in the RVE, the
probability of sequentially interconnecting CNTs to form a continuous path to bridge the two
electrodes decreases exponentially as the minimum required number of CNTs increases. For
example, for a RVE with Lx equals to 10 µm, it requires at least two 5 µm-long CNTs to form

42 | P a g e
a conductive path bridging the two electrode surfaces. If Lx of the RVE is increased to 15 m,
a minimum of three 5 m-long CNTs would be needed to achieve the same. The probability
of three CNTs to interconnecting one another can be determined by considering the overall
probability of two independent events to occur simultaneously. First, two CNTs need to be
interconnected to create a conductive channel. Consequently, a third CNT will need to
interconnect with the end of this two-CNT channel. It is apparent that the probability of
forming a three-CNT conductive pathway (i.e., consists of two independent events) is lower
than that of forming a two-CNT conductive pathway. Therefore, it would be less likely for a
small number of CNTs to generate a conductive pathway across the RVE with longer Lx. In
other words, a higher concentration of CNTs would be required to construct an electrically
conductive pathway, and thereby increasing the PNC’s c. On the other hand, increasing Ly
and Lz only lead to the increase in the RVE’s volume without affecting the probability of
developing the first conductive path in the direction of the electric current flow.
3.2.4 Effect of CNTs’ alignment on PNCs’ percolation thresholds and electrical
conductivity
Figures 3.10(a) through 3.10(c) plot the effect of CNTs’ alignment on the PNCs’ c and
adj. The simulations were conducted using a RVE as described in Section 3.1. The alignment
of CNTs was varied by setting the upper limits for the angle between CNTs and the x-axis (i.e.,
max) in Equation (3.3b). Figure 3.10(a) shows that the simulation results of PNCs’ adjversus
the degree of CNT alignment. For max ranging for 30° (i.e., highly aligned) to 90° (i.e.,
perfectly random orientation), the PNC’s adj increased rapidly at low CNT loading, and
increased gradually thereafter to a plateau with increasing CNT loadings. However, the

43 | P a g e
dependence of PNC’s adj on max varied with CNT loadings. This changing relationship of adj
versus max is clearly revealed in Figure 3.10(b). In order to maximize PNC’s adj, a higher
degree of CNT alignment was favorable at higher CNT loadings, whereas more randomly
oriented CNTs were beneficial at lower CNT loadings. Furthermore, the effects of CNTs
alignment on PNCs’ c are shown in Figure 3.10(c). The simulation results show that c
decreased as max increased (i.e., CNTs were more randomly oriented). These findings were
consistent with the experimental studies conducted by Du et al. (Du 2005).

44 | P a g e
Figure 3.10 Calculated electrical properties of PNCs at different CNTs alignment, (a)
electrical conductivity vs. volume fraction at different max; (b) electrical conductivity vs.
max at different volume fraction; (c) percolation threshold vs. max.
When CNTs are highly aligned, (e.g., max = 30°), all CNTs are nearly parallel to each
other. Thus, it is less probable for CNTs to interconnecting each other to form a conductive
channel at small . In other words, a higher loading of CNTs would be required to form the
first electrically conductive pathway, and thereby increasing PNCs’ c. On the other hand, for
PNCs filled with high concentrations of CNTs, a large number of electrically conductive
pathways would be formed easily in the polymer matrix. Along each of these numerous
pathways, the conductance is governed by the length of the path (i.e., intrinsic resistance)
and the number of CNT intersections (i.e., contact resistance) along the path. In PNCs filled
with randomly-oriented CNTs, these conductive paths comprise of more CNTs, and thereby
leading to longer pathways and more CNT-to-CNT intersections along these paths. As a result,
the conductance of these paths would be lower, resulting in reduced PNC’s adj at higher CNT
loadings. Combining the observations from Figures 3.10(a) through 3.10(c), it can be

45 | P a g e
concluded that highly aligned CNTs would help to maximize PNCs’ with high CNT loadings;
however, perfectly oriented CNTs would help to suppress PNCs’ c.
3.3 Concluding Remarks
A more realistic and efficient model to describe the three-dimensional carbon
nanotube (CNT) networks in polymer nancomposites (PNCs) has been developed in this
work. Compared to various existing random resistor models, the refined model accounts for
the contribution of interconnecting CNTs across the boundary surfaces of the representative
volume element (RVE). This avoid unnecessary biases in the spatial dispersion and length
distribution of CNTs being caused by the “cut-and-relocate” approach adopted in typical
models found in literatures. A series of Monte Carlo simulations, based on RVEs with
different dimensions, have revealed that the simulated PNC’s electrical conductivity is only
influenced by the RVE’s dimension parallel to the direction of the current flow. This leads to
a more efficient simulation scheme of using RVEs with reduced length in dimensions
perpendicular to the direction of the current flow. As a result, the computation cost of the
Monte Carlo simulations can be suppressed significantly without compromising their
accuracy. Using the improved model, electrical conductivity of PNCs filled with different
grades of multi-walled carbon nanotubes were predicted, and the results demonstrated good
agreement with those reported in existing experimental studies. It has also been shown that
PNCs’ percolation threshold (c) increased with the distance between the two electrodes of
the RVE. Through comparisons with other simulation models, the key differences and
improvements of the refined model were elucidated. Furthermore, the effects of CNTs’

46 | P a g e
orientation on PNCs’ c and have been studied. Simulation results suggest that perfectly
random orientation of CNTs lead to lower c, while highly aligned CNTs along the direction
of electric current lead to higher at high CNT loadings. In short, the new model being
developed in this work would serve as a more realistic strategic tool to design optimal CNT
loading and orientation to tailor the PNC’s electric properties.
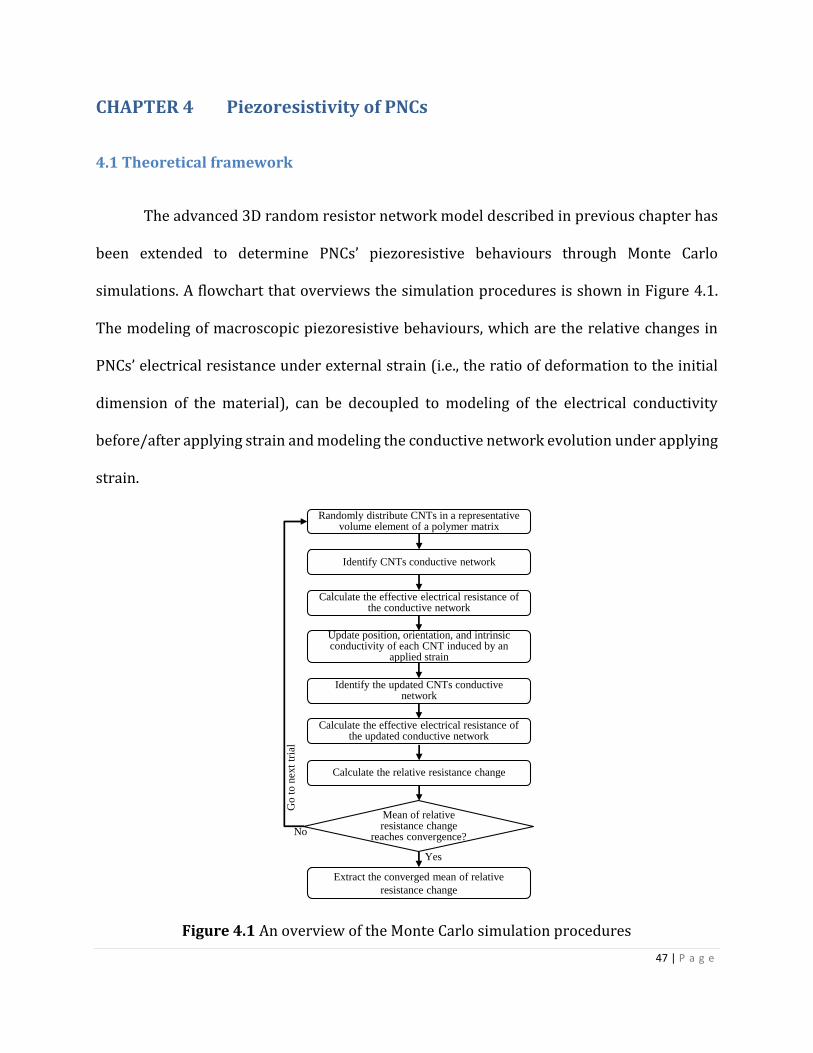
47 | P a g e
CHAPTER 4 Piezoresistivity of PNCs
4.1 Theoretical framework
The advanced 3D random resistor network model described in previous chapter has
been extended to determine PNCs’ piezoresistive behaviours through Monte Carlo
simulations. A flowchart that overviews the simulation procedures is shown in Figure 4.1.
The modeling of macroscopic piezoresistive behaviours, which are the relative changes in
PNCs’ electrical resistance under external strain (i.e., the ratio of deformation to the initial
dimension of the material), can be decoupled to modeling of the electrical conductivity
before/after applying strain and modeling the conductive network evolution under applying
strain.
Figure 4.1 An overview of the Monte Carlo simulation procedures
Randomly distribute CNTs in a representative volume element of a polymer matrix
Calculate the effective electrical resistance of the conductive network
Update position, orientation, and intrinsic conductivity of each CNT induced by an
applied strain
Calculate the effective electrical resistance of the updated conductive network
Identify CNTs conductive network
Identify the updated CNTs conductive network
Mean of relative resistance change
reaches convergence?
Extract the converged mean of relative
resistance change
Yes
No
Calculate the relative resistance change
Go
to
nex
t tr
ial
48 | P a g e
4.1.1 Transformation of the CNT network in a PNC under applied strain
The transformation of the embedded CNTs (i.e., translation and rotation) caused by
external mechanical strain is related to the deformation of CNT doped polymer matrix whose
Poisson’s ratio is chosen to be 0.35 (Fernberg 2009). It can be determined based on an affine
transformation (Taya 1998). The translation of the center-point of the ith CNT is determined
by Equations (4.1a) through (4.1c).
, ,' (1 )c i c i ployx x (4.1a)
, ,' (1 )c i c i polyy y (4.1b)
, ,z' (1 )c i c i polyz (4.1c)
where (xc,i, yc,i, zc,i) and (x'c,i, y'c,i, z'c,i) are the coordinates of the center-point of the ith CNT
with and without strain; poly is the applied strain on the PNC; and is the PNC’s Poisson’s
ratio.
Using i and i, the relationships between (poly, ) and ('i,'i) can be expressed as in
Equations (4.2a) through (4.2c).
,
,
' cos '1
cos
CNT x CNT ipoly
CNT x CNT i
L L
L L
(4.2a)
,
,
' cos ' sin '1
cos sin
CNT y CNT i ipoly
CNT y CNT i i
L L
L L
(4.2b)
,
,
' sin ' sin '1
sin sin
CNT z CNT i ipoly
CNT z CNT i i
L L
L L
(4.2c)

49 | P a g e
Then, the updated ('i, 'i) are determined by Equations (4.3a) and (4.3b).
'i i (4.3a)
1
tan ' tan1
poly
i i
poly
(4.3b)
Using the updated coordinates of the CNTs, the reconfigured CNT network under
applied strain (i.e., poly) can be identified. Moreover, the strain of individual CNT is linearly
proportional to poly (Hu 2012). The strain-induced change in the intrinsic conductivity (i.e.,
CNT) of the ith CNT can be updated by Equation (4.4).
21 2.118
'cos 'i
CNTCN
l
T
po y i
(4.4)
where 2.118 is the estimated CNTs’ piezoresistivity calculated by Hu et al. (Hu 2012); and
is the strain ratio of CNT to polymer.
The value of 'CNT is obtained for each individual CNT due to the difference in the polar
angle (i.e., i). The revised Rintrinsic can be calculated by Equations (3.4) and (4.4).
Furthermore, upon the transformation of the CNTs in the conductive network, it is necessary
to revise Rcontact by using Equations (3.5a) through (3.5c) and the updated coordinates of the
two interconnecting CNTs. The new PNC’s effective resistance (R'), under poly, can then be
determined. The relative change of the strain-induced resistance (R/R) can subsequently
be calculated by Equation (4.5).
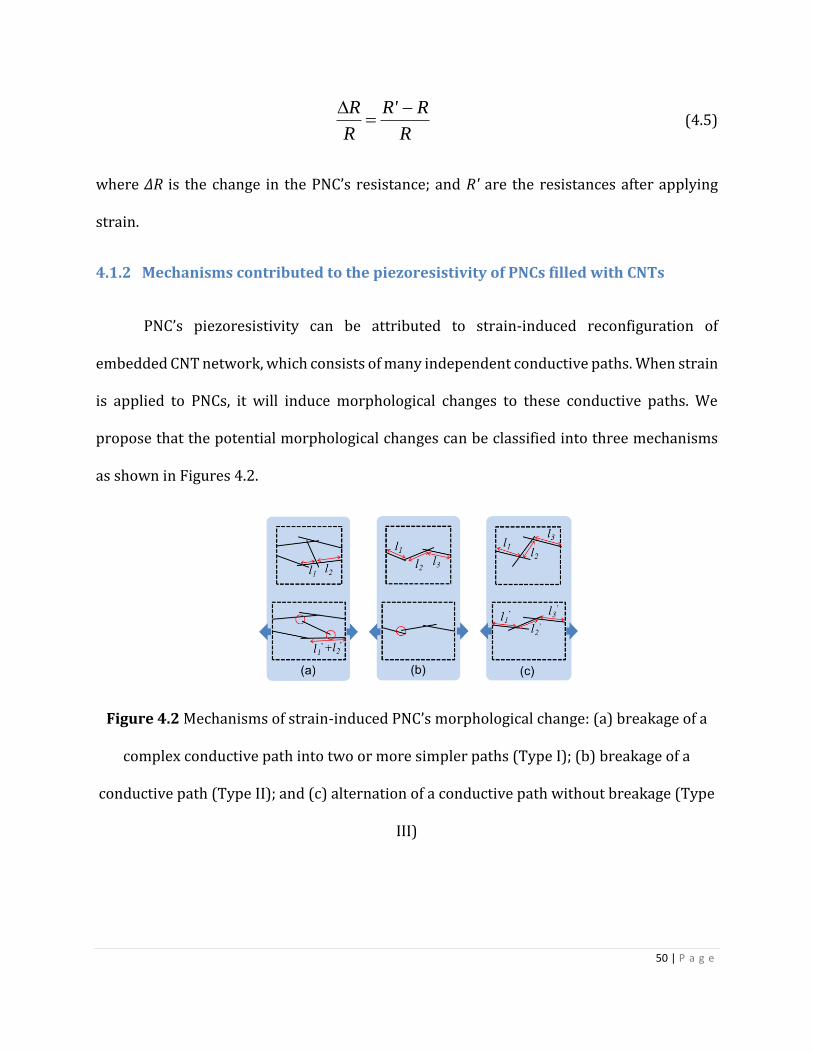
50 | P a g e
R R' R
R R
(4.5)
where ∆R is the change in the PNC’s resistance; and R' are the resistances after applying
strain.
4.1.2 Mechanisms contributed to the piezoresistivity of PNCs filled with CNTs
PNC’s piezoresistivity can be attributed to strain-induced reconfiguration of
embedded CNT network, which consists of many independent conductive paths. When strain
is applied to PNCs, it will induce morphological changes to these conductive paths. We
propose that the potential morphological changes can be classified into three mechanisms
as shown in Figures 4.2.
Figure 4.2 Mechanisms of strain-induced PNC’s morphological change: (a) breakage of a
complex conductive path into two or more simpler paths (Type I); (b) breakage of a
conductive path (Type II); and (c) alternation of a conductive path without breakage (Type
III)

51 | P a g e
Under Type I mechanism, illustrated in Figure 4.2(a), a complex conductive network
comprises of many CNTs is broken down into several simpler networks. This is caused by
disconnecting individual CNTs from the network due to their translation and reorientation.
Consequently, the equivalent resistance of the conductive network will moderately increase.
Under Type II mechanism, illustrated in Figure 4.2(B), the translation and reorientation of
individual CNTs along a conductive path will break because of the separation of CNTs at their
junctions beyond a threshold (Kirkpatrick 1973). As the conductive pathway has been
disrupted, it would lead to a more significant reduction in the conductive network’s
equivalent resistance than Type I mechanism. Under Type III mechanism, illustrated in
Figure 4.2(c), the separation distance between two CNTs at a junction increases slightly. This
will result in a minor decrease in the equivalent resistance of the CNT conductive network.
Under all three mechanisms, the intrinsic piezoresistivity of CNTs will also contribute to the
macroscopic piezoresistivity of the PNC (Hu 2012).
In order to systematically analyze the contributions of each proposed mechanism to
PNC’s piezoresistivity, a set of parameters related to the morphological changes are defined
and their relationships to PNCs’ piezoresistivity are summarized in Table 4.1. Moreover, to
identify the contribution of the three proposed mechanisms on the piezoresistivity of PNCs,
the changes in the five key morphological parameters under each mechanism are indicated
in Table 4.2.
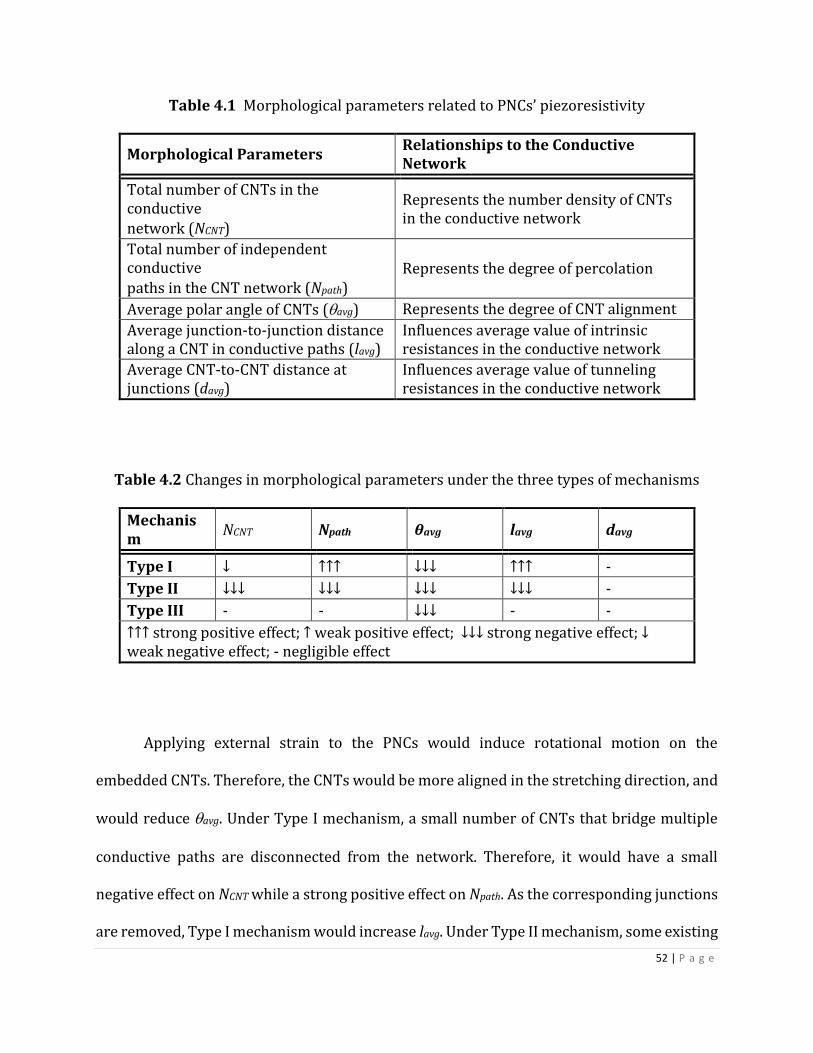
52 | P a g e
Table 4.1 Morphological parameters related to PNCs’ piezoresistivity
Morphological Parameters Relationships to the Conductive Network
Total number of CNTs in the conductive network (NCNT)
Represents the number density of CNTs in the conductive network
Total number of independent conductive
paths in the CNT network (Npath) Represents the degree of percolation
Average polar angle of CNTs (avg) Represents the degree of CNT alignment
Average junction-to-junction distance along a CNT in conductive paths (lavg)
Influences average value of intrinsic resistances in the conductive network
Average CNT-to-CNT distance at junctions (davg)
Influences average value of tunneling resistances in the conductive network
Table 4.2 Changes in morphological parameters under the three types of mechanisms
Mechanism
NCNT Npath θavg lavg davg
Type I ↓ ↑↑↑ ↓↓↓ ↑↑↑ -
Type II ↓↓↓ ↓↓↓ ↓↓↓ ↓↓↓ -
Type III - - ↓↓↓ - -
↑↑↑ strong positive effect; ↑ weak positive effect; ↓↓↓ strong negative effect; ↓ weak negative effect; - negligible effect
Applying external strain to the PNCs would induce rotational motion on the
embedded CNTs. Therefore, the CNTs would be more aligned in the stretching direction, and
would reduce avg. Under Type I mechanism, a small number of CNTs that bridge multiple
conductive paths are disconnected from the network. Therefore, it would have a small
negative effect on NCNT while a strong positive effect on Npath. As the corresponding junctions
are removed, Type I mechanism would increase lavg. Under Type II mechanism, some existing

53 | P a g e
CNT conductive paths are disrupted. Hence, it would significantly reduce both NCNT and Npath.
Moreover, since the simple CNT conductive paths associated with Type II mechanism usually
have long junction-to-junction distances, their removal from the network would have a
strong negative impact on lavg. Type III mechanism only involves rotation and translation of
CNTs without removing them from the conductive network. Thus, it has negligible effect on
all the morphological parameters except θavg. However, upon continuous increase in strain,
Type III mechanism would eventually be transformed into Type II mechanism, resulting in
dramatic effects on PNC’s piezoresistivity.
4.2 Results and discussion
Using the described theoretical framework, the relative changes of PNCs’ resistances
under different levels of strain were determined. As the discussion in Chapter 3, the
dimensions of RVEs were set to 4 × LCNT by 1.1 × LCNT by 1.1 × LCNT. Simulation results were
compared with experimental data (Park 2008, Fernberg 2009) for PNCs loaded with either
different contents or different grades of CNTs to verify the model. After the validation,
systematic studies were conducted to quantitatively analyze the impacts of different
proposed mechanisms on PNCs’ piezoresistivity.
4.2.1 Validation of the 3D model and the simulation scheme
The predicted piezoresistivity of PNCs filled with multi-walled carbon nanotubes
(MWNTs) were compared with experimental data of MWNT/PEO PNCs reported by Park et
al.(Park 2008). The experimental measurements were extracted from the plot of resistance

54 | P a g e
change (i.e., R/R) versus strain (i.e., poly). Following the parameters described in their study,
LCNT and D were set to be 2.5 m and 15 nm, respectively, in the simulation. CNT was
determined to be 1100 S/m (Naeemi 2009). Figure 4.3(a) compares the simulated
piezoresistive behaviours and the experimental data of PNCs loaded with 0.56 vol.% and 1.44
vol.% MWNTs. It can be observed that the simulation results agreed with the experimental
data at both MWNT loadings. In order to further confirm the validity of the model and
simulation scheme, the piezoresistivity of MWNT-doped epoxy filled with 0.5 wt.% of MWNT
reported by Fernberg et al. (Fernberg 2009) was also simulated. The experimental results of
PNCs’ piezoresistivity were converted from the plot of different resistivity of specimen at
varying strain. LCNT and D were set to be 5 m and 15 nm, respectively, according to the
MWNT’s characteristics in their work. CNT were determined to be 2100 S/m (Naeemi 2009).
As shown in Figure 4.3(b), a good agreement between the simulation result and the
experimental data had been achieved for the MWNT-doped epoxy’s piezoresistivity. Overall,
it demonstrated that the proposed model and simulation scheme can be used as realistic
tools to quantitatively analyze the piezoresistive behaviours of PNCs.

55 | P a g e
Figure 4.3 Comparison of simulation results of PNCs’ piezoresistivity with existing
experimental data reported by (a) Park et al. and (b) Fernberg et al.
4.2.2 Key governing factors to PNCs’ piezoresistivity
The underlying mechanisms for PNCs’ piezoresistivity were investigated by
quantitatively analyzing different strain-induced morphological changes. These included the
relative changes in (i) total number of CNTs in the conductive network (NCNT), (ii) average
polar angle (avg) of CNTs, (iii) average intrinsic resistance along a CNT between two
junctions (Rintrinsic,avg), and (iv) average tunneling resistance at CNT junctions (Rcontact,avg).
MWNT/PEO PNCs loaded with 0.56 and 0.80 vol.% of MWNTs were considered herein as
case examples.
Figure 4.4(a) and (b) plot the strain-induced relative changes of these parameters for
PNCs loaded with different MWNT contents. The relative change of NCNT for the PNC loaded
with 0.56 vol.% MWNT had a more negative slope than that loaded with 0.80 vol.% MWNT,
while the slopes of the relative changes of avg, Rintrinsic,avg, and Rcontact,avg were similar at both

56 | P a g e
MWNT loadings. The negligible change in Rcontact,avg suggested an insignificant influence of
strain on Rcontact at MWNT-to-MWNT junctions. Moreover, NCNT and avg decreased linearly
while Rintrinsic,avg increased linearly with increased strain. The elongation of PNCs led to
rotational and translational motions for all MWNTs. The rotational motion tended to
promote the alignment of MWNTs along the straining direction, leading to a decrease in avg.
The reduction in NCNT could be attributed to both Type I and Type II mechanisms. MWNT’s
rotation and translation would cause some MWNTs that bridged multiple conductive paths
disconnected from the conductive network. This broke some of the complex MWNT network
into simpler ones (i.e., Type I mechanism) and reduced NCNT. Strain could also induce
breakage of some junctions along simpler conductive paths (i.e., Type II mechanism) and
further decreased NCNT.
Figure 4.4 Strain-induced relative changes in quantifiable parameters at (a) 0.56 and (b)
0.80 vol.% of MWNTs.
The drop in Rintrinsic,avg could potentially be attributed to two factors: (i) intrinsic
piezoresistivity of an individual MWNT, and (ii) change in distance between adjacent

57 | P a g e
junctions along an individual MWNT. Consistent with the work reported by Hu et al. (Hu
2012), the strain-induced change in CNT had limited influence on the PNCs’ macroscopic
piezoresistive behaviours. Under Type I mechanism, the separation of MWNTs from the
conductive network would remove some MWNT-to-MWNT junctions. This would in turn
increase the distance between adjacent junctions along a MWNT, leading to the change in
Rintrinsic,avg.
4.2.3 Effects of CNT loadings on PNCs’ piezoresistive behaviours
PNCs’ macroscopic piezoresistivity was shown to be predominantly affected by
changes in the conductive network’s morphology. Thus, the relative changes in the five
morphological parameters summarized in Table 4.2 were simulated. Figures 4.5(a) and (b)
depict the results for PNCs loaded with 0.56 and 0.80 vol.% MWNTs subjected to strain. In
both cases, larger strain would increase Npath and lavg while decrease NCNT and θavg. However,
strain had negligible effect on davg.
Figure 4.5 Strain-induced relative changes in different morphological parameters of the
conductive network at (a) 0.56 and (b) 0.80 vol.% of MWNTs.
58 | P a g e
While both Type I and Type II mechanisms would contribute to the piezoresistivity,
the decrease in NCNT together with the hike in both Npath and lavg suggested that Type I
mechanism had a larger contribution than Type II mechanism. It was also found that higher
MWNT loadings would increase the complexity of conductive paths. Simulation results
suggested that each conductive path consists of an average of 46 MWNTs in PNCs with 0.56
vol.% MWNT and 151 MWNTs in those with 0.80 vol.% MWNT. Therefore, increasing MWNT
loadings would promote the contribution of Type I mechanism to the PNC’s piezoresistivity
while suppress that of Type II mechanism. As Type I mechanism only partially disrupts the
network while Type II mechanism completely breaks a conductive pathway, the
enhancement to Type I mechanism would reduce PNC’s piezoresistivity. In addition, Figures
4.5(a) and (b) show that PNCs filled with higher MWNT loading lessened the relative
decrease in NCNT while surged the relative increase in Npath. Hence, the dominance of Type I
mechanism to the piezoresistivity increased with CNT loadings. Although Type III
mechanism should also exist, its influence on the PNCs’ piezoresistivity was minimal until
larger strain shifted it to Type II mechanism.
4.2.4 Effects of CNT alignment on PNCs’ piezoresistivity
The effects of CNT alignment on PNCs’ piezoresistivity were simulated by varying the
maximum polar angle between the ith CNT and the x-axis (i.e., max). Figures 4.6(a) and (b)
show that the effects of max on the electrical conductivity (PNC) and piezoresistivity of PNCs
with different MWNT loadings. A small max (e.g., 35°) meant that MWNTs were preferentially
aligned while a large max (e.g., 90°) meant that MWNTs were more randomly oriented. For
both MWNT loadings, PNC increased rapidly when reducing the degree of CNT alignment at
59 | P a g e
small max. It then reached a plateau as max increased, and eventually dropped slightly as max
approached 90°. In other words, there existed an optimal max to promote PNC. Consistent
with the previous discussion in section 3.2.4 and the literature (Bao 2011, Du 2005), Figures
4.5(a) illustrates that the optimal max was larger for PNCs with lower MWNT loadings. Du et
al. (Du 2005) discovered that the filler start to form a conductive network at a critical point
upon increasing the isotropy (i.e., decreasing the alignment). This produces a dramatic
increase in electrical conductivity (e.g., the significant increment in Figures 4.5(a)). Similar
to the percolation threshold theory, such alignment threshold (i.e., max,c) can be evaluated
using power law fitting as expressed in Equation (4.6).
,( )t
0 max max c for ,max max c (4.6)
where 0 is a parameter attributed to the intrinsic conductivity of CNTs; and t is the critical
exponent, which is known to be dominated by the dimensionality of the system (Kirkpatrick
1973).
The max,c were calculated to be 25o and 35o for PNCs loaded with 0.56 and 0.80 vol.%
MWNTs, respectively. Figures 4.6(a) and (b), revealed that increasing filler alignment would
significantly reduce PNC near the alignment threshold, while dramatically promote PNCs'
piezoresistivity. Thus, higher degree of CNT alignment near max,c would enhance PNCs’
piezoresistivity. This could be attributed to the simple and fragile conductive networks
formed by highly-aligned MWNTs. This finding agreed with the experimental studies
conducted by Oliva-Avilés et al. (Oliva-Avilés 2011). Their study revealed that higher

60 | P a g e
piezoresistivity was obtained for MWNT/PSF films with pre-aligned MWNTs induced by an
AC electric field.
Figures 4.6 Effects of CNT alignment on (a) Electrical conductivity and (b) piezoresistivity
of PNCs at 0.56 and 0.80 vol.% of MWNTs.
Strain was shown to have negligible influence on davg and consistent effect on θavg (i.e.,
decrease). Thus, our simulations to study the effects of CNT alignment on PNC’s
piezoresistivity focused on lavg, Npath, and NCNT. Figures 4.7(a) through (c) show the effects of
CNT alignment on the relative changes in these parameters when PNCs loaded with 0.56 vol.%
MWNT were strained. It can be observed that higher degrees of MWNT alignment would
reduce the strain-induced increases in lavg and Npath, while promote the decrease in NCNT.
Figure 4.7(d) shows the rate of relative changes in these parameters with respect to the
applied strain (i.e., the slopes of the linear lines in Figures 4.7(a) through (c)). Most
importantly, the rate of relative change in lavg changed from negative to positive at θmax
equaled to approximately 40° as θmax increased. This suggests that Type II mechanism for
PNC’s piezoresistivity would be more pronounced for PNCs embedded with highly aligned

61 | P a g e
CNTs, while Type I mechanism for PNC’s piezoresistivity would take over when CNTs
became more randomly oriented. Moreover, the average numbers of MWNTs per conductive
path were determined to be 7 and 46 for θmax equaled to 35° and 90°, respectively. In other
words, high degree of CNT alignment would promote the formation of simple CNT network,
leading to the increase significance of Type II mechanism.
Figures 4.7 Effects of CNT alignment on the relative changes of (a) Npath, (b) lavg, (c) NCNT,
and (d) rate of relative changes in these parameters, at 0.56 vol.% MWNTs loading.
The effects of CNT alignment on the relative changes in lavg, Npath, and NCNT when
straining PNCs with 0.80 vol.% MWNTs are illustrated in Figures 4.8(a) through (c). Similar

62 | P a g e
to the trends for PNCs with lower MWNT loading, preferential MWNT alignment would
reduce the strain-induced increases of lavg and Npath, but promote the decrease in NCNT.
Moreover, Figure 4.8(d) reveals that the rate of relative change in lavg remained positive at
all θmax from 25° to 90°, suggesting that the higher MWNT loading led to the predominance
of Type I mechanism for PNC’s piezoresistivity, even for the cases of PNCs with high degree
of MWNT alignment. This can be attributed to the increased complexity of CNT network with
higher MWNT loadings.
Figure 4.8 Effects of CNT alignment on the relative changes of (a) Npath, (b) lavg, (c) NCNT,
and (d) rate of relative changes in these parameters, at 0.80 vol.% MWNTs loading.

63 | P a g e
4.3 Concluding Remarks
This work extends an advanced 3D resistor network model to simulate PNCs’
piezoresistive responses to external strain. The model and the simulation scheme were
verified by comparing the simulation results with experimental data of PNC’s
piezoresistivity. Three mechanisms contributed to piezoresistivity have been proposed in
this paper. These mechanisms include: (Type I) breakage of a complex conductive network
into two or more simpler conductive paths; (Type II) disruption of a conductive path; and
(Type III) alternation of a conductive path without breakage. Among them, Type II
mechanism would lead to higher piezoresistivity when comparing to Type I mechanism
because of the complete breakage of conductive paths. While Type III mechanism has
negligible direct impact on the piezoresistive behaviours of PNCs, it is the precursor of Type
II mechanism. Quantitative analyses on strain-induced changes in different morphological
parameters revealed different structures of PNCs (e.g., CNT contents or CNT alignment)
would favor different mechanisms for PNC’s piezoresistivity. For PNCs filled with randomly
dispersed CNTs, Type I mechanism predominantly contributed to the PNC’s piezoresistivity
while Type II mechanism’s influence was less significance. Moreover, the dominance of Type
I mechanism was more pronounced for PNCs with higher CNT loadings, because of the
increased complexity of CNT network. On the other hand, preferential CNT alignment would
also affect the dependence of PNC’s piezoresistivity on different mechanisms. For PNCs filled
with low content of highly aligned CNTs, the PNCs’ piezoresistivity was mainly caused by
Type II mechanism due to the small number of CNTs in each conductive path. The
contribution of Type I mechanism became more pronounced as CNT loading increased. The

64 | P a g e
identified underlying mechanisms for PNC’s piezoresistivity and their relationships to PNC’s
morphology provide insights to optimize the micro-and-nanostructures of PNCs, which
would help enhancing the sensitivity of these smart materials for strain sensing applications.
65 | P a g e
CHAPTER 5 Concluding Remarks
5.1 Summary of Conclusions
This thesis developed a realistic and efficient modeling framework to describe the three
dimensional carbon nanotube networks in polymer nanocomposites. The newly developed
novel model was applied to reveal the electrical conductivity of carbon nanotube based
polymer nanocomposites. The following conclusions have been promoted through this
thesis:
1. In the three dimensional modeling of carbon nanotube networks in polymer
nanocomposites, the contribution of interconnecting carbon nanotubes across the
boundary surfaces of the representative volume element should been accounted, in
order to avoid unnecessary biases in the spatial dispersion and length distribution of
carbon nanotubes being caused by the “cut-and-relocate” approach adopted in typical
models found in literatures. The size of the representative volume element can be
decreased, and thereby significantly reduce the computational cost of the Monte Carlo
simulations
2. Using the newly developed model to simulate the electrical conductivity of carbon
nanotube based polymer nanocomposites, it has revealed that the electrical
conductivity is only influenced by the dimension of representative volume element in
parallel to the direction of the current flow. The length in dimensions perpendicular
to the direction of the current flow can be significantly reduced without affecting the
simulation results.

66 | P a g e
3. A series of Monte Carlo simulations, using the newly developed novel model, were
conducted to simulate the electrical conductivity of polymer nanocomposites based
on different grades of multi-walled carbon nanotubes. The simulation results agreed
with those reported in existing experimental studies. It was demonstrated that the
novel model developed in this thesis significantly increase the efficiency of the Monte
Carlo simulations while maintaining the results accuracy.
4. This novel model was applied to the numerical study on the effects of carbon
nanotube’s orientation on electrical conductivity of polymer nanocomposites. It has
been revealed that randomly orientated carbon nanotubes leads to lower percolation
threshold, while highly aligned carbon nanotubes along the direction of electric
current lead to higher electrical conductivity at high carbon nanotube loadings.
Furthermore, this thesis extended the newly developed novel model of three dimensional
carbon nanotube networks to expose the governing mechanisms of the carbon nanotube
based polymer nanocomposites’ piezoresistivity. The following conclusions have been
promoted:
1. Three governing mechanisms contributing to the piezoresistivity of carbon nanotube
based polymer nanocomposites are proposed in this thesis study, namely (Type I)
breakage of a complex conductive network into two or more simpler conductive
paths; (Type II) disruption of a conductive path; and (Type III) alternation of a
conductive path without breakage.

67 | P a g e
2. Among these governing mechanisms, Type II mechanism would lead to higher
piezoresistivity of carbon nanotube based polymer nanocomposites when comparing
to Type I mechanism because of the complete breakage of conductive paths. Though,
Type III mechanism has negligible direct impact on the piezoresistive behaviours, it
is the precursor of Type II mechanism. Quantitative analyses on strain-induced
changes in different morphological parameters revealed that different structures of
carbon nanotube based polymer nanocomposites (e.g., carbon nanotube contents or
alignment) would favor different types of the mechanisms for PNC’s piezoresistivity.
3. For PNCs filled with randomly dispersed carbon nanotube, Type I mechanism
predominantly contributed to the piezoresistivity of carbon nanotube based polymer
nanocomposites, while Type II mechanism’s influence was less significance.
Moreover, the dominance of Type I mechanism was more pronounced for polymer
nanocomposites with higher carbon nanotube contents, because of the increased
complexity of the electrically conductive network.
4. Along with carbon nanotube contents, preferential CNT alignment would affect the
dependence of polymer nanocomposites’ piezoresistivity on different types of the
mechanisms. For polymer nanocomposites filled with highly aligned carbon
nanotubes, the contribution of Type II mechanism were enhanced due to the
simplicity of the each electrically conductive path (i.e., small number of carbon
nanotubes in the path).

68 | P a g e
5.2 Summary of Contributions
The significant research contributions presented in this thesis are summarized as follows:
1. The novel model newly developed in this thesis work significantly reduced the
computational cost of the Monte Carlo simulation without compromising the
accuracy. It would serve as a realistic strategic design tool to fabricate carbon
nanotube based polymer nanocomposites with tailored electrical conductivity by
controlling carbon nanotube loading and orientation.
2. The identified underlying mechanisms for the piezoresistivity of carbon nanotube
based polymer nanocomposites and their relationships to the morphology of
conductive network with nanocomposites provided the enormous insights to
optimize the micro-and-nanostructures of carbon nanotube based polymer
nanocomposites, which would help enhancing the sensitivity of these smart
materials for strain sensing applications.
69 | P a g e
5.3 Scholarly Publications
The research work presented in this thesis has been disseminated via two refereed
journal publications, two conference publications and presentations detailed as follows:
Refereed journal publications
1. Fang, W., and Leung, S.N., “Elucidation of Structure-to-Property Relationships of
Piezoresistive Polymer-Carbon Nanotube Nanocomposites,” Journal of Applied
Physics, Vol. 118, Issue 4, pp. 044907, 2015.
2. Fang, W., Jang, H.W., and Leung, S.N., “Evaluation and Modelling of Electrically
Conductive Polymer Nanocomposites with Carbon Nanotube Networks,” Composites
Part B: Engineering, Vol. 83, pp. 184-193, 2015.
Conference publications and presentations
1. Fang, W., Leung, S.N., and Zhu, Z.H., “Electrical Conductivity Modeling of Carbon
Nanotube Networks in Polymer Nanocomposites and Their Foams,” CSME
International Congress, Toronto, ON, Canada, June 1-4, 2014.
2. Fang, W. and Leung, S.N., “Impacts of Different Mechanisms on Carbon
Nanotubes/Polymer Nanocomposites’ Piezoresistivity,” SPE, ANTEC, Technical
Papers, Paper #2086485, Orlando, FL, USA, March 23-25, 2015.

70 | P a g e
List of References
Akima, N., Iwasa, Y., Bron, S., Barbour, A. M., Cao, J., Musfeldt, J. L., Matsui, H., Toyota, N.,
Shiraishi, M., Shimoda, H., and Zhou, O. (2006). Strong anisotropy in the far-infrared
absorption spectra of stretch-aligned single-walled carbon nanotubes. Advanced Materials,
18, 1166-1169.
Alamusi, Hu, N., Fukunaga, H., Atobe, S., Liu, Y., and Li, J. (2011). Piezoresistive strain sensors
made from carbon nanotubes based polymer nanocomposites. Sensor, 11, 10691.
Bao, W. S., Meguid, S. A., Zhu, Z. H., and Meguid, M. J. (2011). Modeling electrical conductivities
of nanocomposites with aligned carbon nanotubes. Nanotechnology, 22, 485704.
Bao, W. S., Meguid, S. A., Zhu, Z. H., and Weng, G. J. (2012). Tunneling resistance and its effect
on the electrical conductivity of carbon nanotube nanocomposites. Journal of Applied Physics,
111, 093726.
Behnam, A., Guo, J. and Ural, A. (2007). Effects of nanotube alignment and measurement
direction on percolation resistivity in single-walled carbon nanotube films. Journal of Applied
Physics, 102, 044313.
Buldum, A., and Lu, J. P. (2001). Contact resistance between carbon nanotubes. Physical
Review B, 63, 161403-161406.
71 | P a g e
Dalton, A. B., Collins, S., Moñoz, E., Razal, J. M., Ebron, V. H., Ferraris, J. P., Coleman, J. N., Kim,
B. G., and Baughman, R. H. (2003). Super-tough carbon-nanotube fibres. Nature, 423, 703.
Davies, D. K. (1969). Charge generation on dielectric surface. Journal of Physics D: Applied
Physics, 2, 1533-1537.
Du, F., Fischer, J. E., and Winey, K. I. (2005). Effect of nanotube alignment on percolation
conductivity in carbon nanotube/polymer composites. Physical Review B: Condensed Matter
and Material Physics, 72, 121404.
Ebbesen, T. W., Lezec, H. J., Hiura, H., Bennet, J. W., Ghaemi, H. F., and Thio, T. (1996). Electrcal
conductivity of individual carbon nanotube. Nature, 82, 54-56.
Fernberg, P., Nilsson, G., and Joffe, R. (2009). Piezoresistive performance of long-fiber
composites with carbon nanotube doped matrix. Journal of Intelligent Material Systems and
Structures, 20, 1017.
Girifalco, L. A., Hodak, M., and Lee, R. S. (2000). Carbon nanotubes, buckyballs, ropes, anda
universal graphitic potential. Physical Review B, 62, 13104.
Girifalco, L. A., Hodak, M., and Lee, R. S. (2000). Carbon nanotubes, buckyballs, ropes, anda
universal graphitic potential. Physical Review B, 62, 13104.

72 | P a g e
Glenis, S., Likodimos, V., Guskos, N., Yarmis, D., Zolnierkiewicz, G., Szymczyk, A., and Lin, C. L.
(2010). Magnetic properties of carbon nanotube poly(ether-ester) nanocomposites. Journal
of Applied Physics, 108, 054314.
Grujicic, M., Cao, G., and Roy, W. N. (2004). A computational analysis of the percolation
threshold and the electrical conductivity of carbon nanotubes filled polymeric materials.
Journal of Materials Science, 39, 4441-4449.
Hertel, T., Walkup, R. E., and Avouris, P. (1998). Deformation of carbon nanotubes by surface
van der Waals forces. Physical Review B, 58, 13870-13873.
Hertel, T., Walkup, R. E., and Avouris, P. (1998). Deformation of carbon nanotubes by surface
van der Waals forces. Physical Review B, 58, 13870-13873.
Hou, J., Wang, X., Vellelacheruvu, P., Guo, J., Liu, C., and Cheng, H. (2006). Thermal
characterization of single-wall carbon nanotube bundles using the self-heating 3 technique.
Journal of Applied Physics, 100, 124314.
Hu, G., Zhao, C., Zhang, S., Yang, M., and Wang, Z. (2006). Low percolation thresholds of
electrical conductivity and rheology in poly(ethylene terephthalate) through the networks
of multi-walled carbon nanotubes. Polymer, 47, 480-488.
Hu, N., Masuda, Z., Yan, C. Y., Yamamoto, G., Fukunaga, H., and Hashida, T. (2008a). The
electrical properties of polymer nanocomposites with carbon nanotube fillers.
73 | P a g e
Nanotechnology, 19, 215701.
Hu., N., Karube, Y., Yan, C., Masuda, Z., and Fukunaga, H. (2008b). Tunneling effect in a
polymer/carbon nanotube nanocomposite strain sensor. Acta Materialia, 56, 2929-2936.
Kirkpatrick, S. (1973). Percolation and conduction. Reviews of Modern Physics, 45, 574.
Knudsen, H. A., and Fazekas, S. (2006). Robust algorithm for random resistor networks using
hierarchical domain structure. Journal of Computational Physics, 211, 700-718.
Kukovecz, A., Kanyo, T., Konya, Z., and Kirisci, I. (2005). Long-time low-impact ball milling of
multi-wall carbon nanotubes. Carbon, 43, 994-1000.
Kymakis, E., Alexandou, I., and Amaratunage, G. A. J. (2002). Single-walled carbon nanotube–
polymer composites: electrical, optical and structural investigation. Synthetic Metal, 127, 59-
62
Li, C., Thostenson, E. T., and Chou, T. W. (2007). Dominant role of tunneling resistance in the
electrical conductivity of carbon nanotube–based composites. Applied Physics Letters, 91,
223114.
Li, H. J., Lu, W. G., Li, J. J., Bai, X. D., and Gu, C. Z. (2005). Multichannel ballistic transport in
multiwall carbon nanotubes, Physical Review Letters, 95, 086601.

74 | P a g e
Marcus, M. S., Simmons, J. M., Castellini, O. M., Hamers, R. J., and Eriksson, M. A. (2006).
Photogating carbon nanotube transistors. Journal of Applied Physics, 100, 084306.
Matsubara, E. Y., Rosolen, J. M., and Silva, S. R. P. (2008). Composite electrode of carbon
nanotubes and vitreous carbon for electron field emission. Journal of Applied Physics, 104,
054303.
Moaseri, E., Karimi, M., Baniadam, M., and Maghrebi, M. (2014) Improvements in mechanical
properties of multi-walled carbon nanotube-reinforced epoxy composites through novel
magnetic-assisted method for alignment of carbon nanotubes. Composites Part A: Applied
Science and Manufacturing, 64, 228-233.
Naeemi, A., and Meindl, J. D. (2009) Performance modeling for carbon nanotube
interconnnects. In: Carbon nanotube electronics. New York: Springer, 163-190.
Nogales, A., Broza, G., Roslaniec, Z., Schulte, K., Sics, I., Hisao, B. S., Sanz, A., Garcia-Gutierrez,
M. C., Rueda, D. R., Domingo, C., Ezquerra, T. A. (2004). Low percolation threshold in
nanocomposites based on oxidized single wall carbon nanotubes and poly(butylene
terephthalate). Macromolucles, 37, 7669-7872.
Oliva-Avilés, A. I., Avilés, F., and Sosa, V. (2011). Electrical and piezoresistive properties of
multi-walled carbon nanotube/polymer composite films aligned by an electric field. Carbon,
49, 2989-2997.

75 | P a g e
Park, M., Kim, H., and Youngblood, J. P. (2008). Strain-dependent electrical resistance of
multiwalled carbon nanotube/polymer composite films. Nanotechnology, 19, 055705.
Pham, G. T., Park, Y., Liang, Z., Zhang, C., and Wang, B. (2008). Processing and modeling of
conductive thermoplastic/carbon nanotube films for strain sensing. Composites Part B:
Engineering, 39, 209-2016.
Rubio, A., Sanchez-Portal, D., Aartacho, E., Ordejon, P., and Soler, J. M. (1999). Electronic
states in a finite carbon nanotube: a one-dimensional quantum box. Physical Review Letters,
82, 3520.
Shiraishi, M., and Ata, M. (2001). Work function of carbon nanotubes. Carbon, 39, 1913-1917.
Shtogun, Y. V., and Woods, L. M. (2010). Mechanical properties of defective single wall carbon
nanotubes. Journal of Applied Physics, 107, 061803.
Simmons, J. G. (1963). Generalized formula for the electric tunnel effect between similar
electrodes separated by a thin insulating film. Journal of Applied Physics, 34, 1793-1803.
Taya, M., Kim, W. J., and Ono, K. (1998). Piezoresistivity of a short fiberrelastomer matrix
composite. Mechanics of Materials, 28, 53-59.
Theodosiou, T. C., and Saravanos, D. A. (2010). Numerical investigation of mechanisms
affecting the piezoresistive properties of CNT-doped polymers using multi-scale models.

76 | P a g e
Composites Science and Technology, 70, 1312-1320.
Venema, L. C., Wildoer, J. W. G., Janssen, J. W., Tans, S. J., Tuinstra, H. L. J., Kouwenhoven, L. P.,
and Dekker, D. (1999). Imaging electron wave functions of quantized energy levels in carbon
nanotubes. Science, 283, 52-55.
Wang, S., Liang, Z., Wang, B., and Zhang, C. (2006). Statistical characterization of single-wall
carbon nanotube length distribution. Nanotechnology, 17, 634-639.
Wang, X., Jiang, Q., Xu, W., Cai, W., Inoue, Y., and Zhu, Y. (2012). Effect of carbon nanotube
length on thermal, electrical and mechanical properties of CNT/bismaleimide composites.
Carbon, 53, 145-152.
Zamora-Ledezma, C., Blanc, C., and Anglaret, E. (2012). Controlled alignment of individual
single-wall carbon nanotubes at high concentrations in polymer matrices. Journal of physical
Chemistry, 116, 13760.
Zhou, W., Islam, M. F., Wang, H., Ho, D. L., Yodh, A. G., Winey, K. I., and Fischer, J. E. (2004).
Small angle neutron scattering from single-wall carbon nanotube suspensions: evidence for
isolated rigid rods and rod networks. Chemical Physics Letters, 384, 185-189.