modeling instruction for physical science and chemistry in
TRANSCRIPT

Modeling Instruction for Physical Science and Chemistry in Ohio
2009-2010
Evaluation Annual Report
Submitted: July 19, 2010
Prepared by Jan Upton, Ph.D.
Institutional Research Consultants, Ltd. 9293 Marlebury End Powell, OH 43065
TEL: (614) 571-9088 E-MAIL: [email protected]
WEB PAGE: www.ircorporation.com

Modeling Workshops Annual Evaluation Report: 2009-2010 IRC (7/19/10) page i
TABLE OF CONTENTS
Introduction ................................................................................................................................. 1 Background of Participating Teachers ........................................................................................ 5 Pre-survey and Post-survey Comparisons ................................................................................. 6 Summer Workshop and Follow-up Results ............................................................................... 13 Conclusions and Recommendations ........................................................................................ 23 Tables Table 1: Survey Response Rates by Workshop ......................................................................... 2 Table 2: Current Position in Pre-survey and Post-survey ........................................................... 3 Table 3: OBR Pre-survey – Reasons for Choosing Program ..................................................... 3 Table 4: OBR Pre-survey – Types of Credit Participant Will Receive ......................................... 4 Table 5: Membership in a Science Professional Organization.................................................... 5 Table 6: Participation in Science/Science Teaching Conferences .............................................. 6 Table 7: Increased Understanding from the Workshops ........................................................... 15 Table 8: Workshop Activities Rated Worthwhile ....................................................................... 15 Table 9: Better Understanding and Improved Student Performance ........................................ 17 Table 10: OBR Questions about Impact on Participating Teacher ........................................... 18 Table 11: OBR Questions about Professional Development Experience ................................. 18 Table 12: OBR Questions about Impact on Teachers’ Professionalism ................................... 19 Table 13: OBR Questions about Impact on Students ............................................................... 19 Table 14: Attendance at Follow-up Sessions ............................................................................ 21 Appendices Appendix 1: Description of Teachers .................................................................................. 25-26 Appendix 2: Districts Represented ............................................................................................ 27 Appendix 3: Number of Sections of Physics, Physical Science, and Chemistry ....................... 28 Appendix 4: Teacher Opinions and Attitudes in IRC Pre-survey and Post-survey ................... 29 Appendix 5: School Support of Science Instruction and Teacher as a Resource ..................... 30 Appendix 6: Teacher Opinions and Attitudes in OBR Pre-survey and Post Survey ................. 31 Appendix 7: Teacher Classroom Practices in OBR Pre-survey and Post-survey ..................... 32 Appendix 8: Opinions about Preparedness in IRC Pre-survey and Post-survey ...................... 33 Appendix 9: Weekly Classroom Activities in IRC Pre- and Post-survey ................................... 34 Appendix 10: Impact of the Workshops .................................................................................... 35 Appendix 11: Increased Understanding from the Workshops – Survey Order ......................... 36 Appendix 12: Workshop Activities Rated Worthwhile – Survey Order ...................................... 37 Appendix 13: Better Understanding and Improved Student Performance – Full Results ......... 38 Appendix 14: Open-ended Question Responses – Post-survey ......................................... 39-41

INTRODUCTION The Physical Science and Chemistry Modeling Workshops were designed to demonstrate techniques and strategies that high school physics, physical science, and chemistry teachers could utilize in their classrooms that would result in more inquiry-based learning experiences for their students. This marks the sixth year that the Ohio Board of Regents (OBR) has funded a Physical Science Modeling initiative. Three modeling programs were offered during the same 3-week period in June 2009. They included the two Year 1 course offerings: Physics/Physical Science Modeling Workshop (previously offered in 2004-2005, 2006-2007, and 2007-2008, 2008-2009) and a Chemistry Modeling Workshop (also taught in 2007-2008 and 2008-2009). The third workshop, the Year 2 course (previously taught in 2005-2006 and 2007-2008), which was expanded in 2008-2009 to address the needs of teachers who took either of the two first year courses, was also offered. In addition, three teachers who had previously completed both a first and second year course worked together developing strategies to help students better succeed on the science portion of the Ohio Graduation Test (OGT). The following abbreviations will be used throughout this report to denote the respective workshops: PHYS1 = Physics/Physical Science Year 1, CHEM1 = Chemistry Year 1, YEAR2 = Chemistry/Physical Science Year 2, and OGT = Ohio Graduation Test strategies. Instructional Team Dr. Kathleen A. Harper, formerly the Director of Undergraduate Course Development in OSU’s Department of Physics and a visiting professor at Denison University during the 2009-2010 project year, is the Project Director. Dr. Harper has been one of the Co-Principal Investigators since the program was first funded in 2004-2005. Dr. Ted Clark, Assistant Professor in Ohio State’s Chemistry Department, has contributed to this program for three years, and this year he served as a Co-Principal Investigator and co-instructor of the Chemistry course. Dr. Jerrell Beckham, Assistant Professor in the Department of Education at Denison, assisted with the design of the summer workshops, with the intention of ensuring consistency of the activities with the Ohio content standards. As is in previous years, experienced high school teachers from Central Ohio were the primary workshop instructors. Although they benefited from the university faculty members’ content expertise and input about various aspects of science education, it was the teachers along with Dr. Harper who had been trained in modeling, which prepared them to lead the summer sessions. Jason Cervenec, a science teacher in Worthington City Schools, had previously participated in a Physical Science Modeling Workshop in another state and has been one of the OSU workshop instructors since the initial implementation. The other teacher-instructors (Doug Forrest of Pickerington Local Schools, Mary Battershell and Jessica Mamais of Olentangy Local Schools, and Heidi Jackman from Dublin City Schools) had completed two of the Modeling Workshops. Ms. Jackman was the only new instructor on the staff this year, whereas, the other teacher-instructors worked with the project for two or more years. Including high school teachers as instructors helped give participants concrete evidence that the approach could work with a wide range of high school students. In addition, the workshop had active support of two school administrators, Michael Grote, Director of Staff Development for Columbus City Schools (CCS), and Cindi Goldhaber, Principal at Pickerington High School North.

Evaluation Surveys Fifty-six teachers completed the 3-week summer course. Surveys were developed by Institutional Research Consultants, Ltd. (IRC), the external evaluator, and administered by the instructional team. There were two Pre-surveys: the one required by OBR and one developed by IRC. These surveys covered participants’ opinions about science teaching, instructional practices, and demographics. IRC combined the two preliminary surveys, and this report provides analysis of selected OBR questions and all the IRC items. The response rate overall was 91 percent (see Table 1). The highest Pre-survey response rates were from the first year groups—PHYS1 (100%) and CHEM1 (94%). The returning teachers, YEAR2 (79%) and OGT (67%), had lower survey participation rates. All 56 teachers who completed one of the 3-week Modeling workshops during summer 2009 returned the end of workshop survey. This survey asked participants about their summer experience and encouraged them to provide feedback.
Table 1: Survey Response Rates by Workshop
Workshop Total in Program
OBR/IRC Pre-survey End of Workshop
OBR/IRC Post-survey
Surveys Return Rate Surveys Return Rate Surveys Return Rate PHYS1 21 21 100.0 21 100.0 15 71.4 CHEM1 18 17 94.4 18 100.0 13 72.2 YEAR2 14 11 78.5 14 100.0 8 57.1 OGT 3 2 66.7 3 100.0 1 33.3
TOTAL 56 51 91.1 56 100.0 37 66.1
Only 66 percent of participants returned the Post-survey. Nearly three-quarters of the PHYS1 and CHEM1 groups (with a 71% and 72% response rate respectively) returned this survey. Only 57 percent of the YEAR2 participants and one (33%) of the three teachers working on OGT preparation completed it.1 The Project Director followed up with the non-respondents via e-mail through the first week in June. In the future, the project leadership may want to administer this survey at each follow-up session, with distribution to only new attendees at subsequent sessions. This approach would mean less time between the initial and year-end surveys for many participants, but it might result in a higher Post-survey response rate. The Pre-survey and End of Workshop survey results were covered extensively in two interim evaluation reports2. Although parts of those reports are repeated here, the focus in this report is on participants’ opinions about and use of modeling toward the end of the project year. In addition, we analyze and discuss the differences between their pre- and post-responses. This report also reflects updates made to the Pre-survey data file. Current Position, Reasons for Choosing the Program, and Credit Received All of the participants were teachers. Table 2 provides additional detail on their specific positions. On the Pre-survey, most were regular teachers (94%) except for one special education teacher (2%) in the PHYS1 workshop and two (4%) who specified their status as “Other.” The latter two participants consisted of a substitute and a pre-service teacher. By year-end, there was little change in the positions. Nearly all selected the regular teacher classification (97%). Only one (3%) specified the “Other” option—a “Teacher on Special Assignment,” which 1 Since there was only one OGT respondent to the Post-survey, the OGT results are omitted from Post-survey tables, but the OGT response is included in the Total. 2 IRC submitted reports to Dr. Harper on the results from the End of Workshop Survey on October 22, 2009 and the Pre-survey on December 11, 2009.
Modeling Workshops Annual Evaluation Report: 2009-2010 IRC (7/19/10) page 2

denotes a regular teacher who takes on administrative and/or trainer responsibilities for a specified period. No one selected the “Special Education” option on the Post-survey.
Table 2: Current Position in Pre-survey and Post-survey
Pre-survey N=51
Post-survey N=37
N % N % Teacher 48 94.1 36 97.3 Special Education, Resource or Inclusion Teacher 1 2.0 0 0.0 Other (Pre-survey: 1 pre-service teacher and 1 substitute teacher; Post-survey: 1 Teacher on Special Assignment)
2 3.9 1 2.7
The workshops were targeted to high school teachers, and almost all participants (94%) taught at this grade level. The only exception was that there were three middle school teachers of grades 7-8 (6%), all of whom were in the PHYS1 class. Most of the participants taught only science (96%), one (2%) taught math only, and another (2%) taught math and science. Appendix 1 on pages 25-26 provides additional detail on participants’ characteristics. The group represented 23 districts (see Appendix 2 on page 27). Most participants (92%) taught in public schools and four (8%) were from private schools. The districts with the greatest number of teachers were CCS with ten (18%), Olentangy Local Schools had six (11%), South-Western sent five (9%), and Big Walnut and Pickerington each were represented by four (7%). The workshops continue to attract teachers statewide. A third (33%) of participants were from counties more than an hour’s drive from the training site. The PIs once again requested funding which allowed them to offer temporary housing in a local motel to teachers whose residence was outside the central Ohio service area. Table 3 presents reasons for participants’ decision to take part in one of the workshops. More than half chose to attend the Institute on their own initiative (57%) or was encouraged to attend by a former participant (53%). This latter reason was especially a factor for the CHEM1 teachers (77%). Two (4%) mentioned that they had received encouragement from the Project Director. Four (8%) mentioned other reasons. Two noted that they liked the first year workshop and one each was motivated by “heard it is a good program” and receipt of “free graduate credit.”
Table 3: OBR Pre-survey – Reasons for Choosing Program1
PHYS1 CHEM1 YEAR2 OGT TOTAL N=21 N=17 N=11 N=2 N=51
a. Applied on my own initiative 52.4 47.1 81.8 50.0 56.9 b. Participation was required by
the school district 0.0 0.0 0.0 0.0 0.0
c. School district provided incentives to participate 0.0 0.0 0.0 0.0 0.0
d. Encouraged to participate by the project director 0.0 5.9 0.0 50.0 3.9
e. School staff agreed that the program was needed 0.0 0.0 0.0 0.0 0.0
f. Encouraged to attend by a former participant 52.4 76.5 27.3 0.0 52.9
g. Other reason 9.5 0.0 18.2 0.0 7.8
1Total can add to more than 100 percent, as respondent could give more than one response.
Modeling Workshops Annual Evaluation Report: 2009-2010 IRC (7/19/10) page 3

Most participants (88%) indicated that they are receiving graduate credit (Table 4). In addition, more than a third (37%) were receiving credit toward their certification/licensure. Twenty-eight percent expected to receive credit toward a salary increase and slightly less than a quarter (22%) received credit toward continuing education. Only one participant (4%) did not expect to receive any credit.
Table 4: OBR Pre-survey – Types of Credit Participant Will Receive1
PHYS1 CHEM1 YEAR2 OGT TOTAL N=21 N=17 N=11 N=2 N=51
a. Graduate credit 95.2 76.5 90.9 100.0 88.2
b. Undergraduate credit 0.0 0.0 0.0 0.0 0.0
c. Credit toward salary increase 33.3 23.5 18.2 50.0 27.5 d. Credit toward continuing
education 28.6 23.5 9.1 0.0 21.6
e. Credit toward certification/licensure 42.9 29.4 36.4 50.0 37.3
f. No credit given 0.0 11.8 0.0 0.0 3.9
g. Other 0.0 0.0 0.0 0.0 0.0 1Total can add to more than 100 percent, as respondent could give more than one response.
Physics, Physical Science, and Chemistry Classes The extent to which the teachers are responsible for one or more sections of physics, physical science, or chemistry provides a general idea of the extent to which modeling instruction is needed and would likely be utilized in a classroom. We reviewed the course loads for all the teachers (see Appendix 3 on page 28). During the 2008-2009 and 2009-2010 school years, more than half taught chemistry (51-53%), half taught physical science (49-51%), and more than a third (35%) had a physics class. Eighty-eight percent of the teachers who responded to the Pre-survey taught at least one class in one of the specified discipline areas. All but one of the Post-survey respondents (97%) taught at least one of these courses in 2009-2010. More than two-thirds of the PHYS1 teachers (67%) taught physical science, and about half of this group also had responsibility for a physics class (48-53%). In addition, about a third (33-38%) of the PHYS1 teachers taught chemistry. The CHEM1 participants predominantly taught chemistry (77-82%), at least a quarter (25-31%) had a physical science class, and only 1-2 in this group (6-15%) were assigned to a physics class. The YEAR2 group, on the other hand, was more evenly split with respect to responsibility for physics (46% initially and 38% by year-end), physical science (54% initially and 38% by year-end), and chemistry (45-50%). The three OGT teachers taught physics and physical science classes. These results confirm that participating teachers have a high level of responsibility for physics, physical science, and chemistry classes at their schools. Modeling is applicable to the courses they teach and their students will potentially benefit from the changes in instructional practices.
Modeling Workshops Annual Evaluation Report: 2009-2010 IRC (7/19/10) page 4

BACKGROUND OF PARTICIPANTS Appendix 1 on pages 25-26 provides teachers’ demographics on all available items from the Pre-survey. There were more female teachers (61%) compared to males (39%). Participants were predominantly white (92%). There were only four from racial/ethnic minority groups. Two were Black (4%), one was Asian/Pacific Islander (2%), and one specified “Black and American Indian” (2%). This year’s participants were somewhat younger than average. Nearly a third (30%) were under age 30. More than half (57%) were 40 or under. The 41-50 and 51-60 age groups were evenly split (20% each). Only 4 percent were older than 60. The sessions continue to attract experienced teachers. The majority of the PHYS1 (62%) and CHEM1 (63%) participants had more than five years of experience. Only three (6%) were in their first year of teaching. Most of the YEAR2 group (91%) and the two OGT participants (100%) had taught for more than five years. However, their tenure at their current school tended to be less. As noted in the prior year report, many of the involved suburban districts have added new schools due to growth, while CCS has recently replaced some of its outdated buildings. Several of the districts have had a high level of reassignments as part of efforts to manage budget shortfalls. Thus, it was not surprising to find that the majority of the teachers (60%) had been at their schools less than six years. Most of the teachers (67%) had master’s degrees and two (4%) in the PHYS1 session had earned a doctorate. More than a quarter (28%) reported a Bachelor’s degree as the highest degree received. Participants’ primary degree areas included science education (63%), biology or life science (37%), chemistry/biochemistry (35%), and physics/physical science (28%). Six participants (12%) specified degrees in ““other” areas, including education, education administration, political science, psychology, and nursing. Table 5 highlights that more than half (57%) of participants were members of a science professional organization when they began a Modeling Workshop. By year-end, membership in a professional organization increased slightly (to 62%), as one Post-survey respondent (3%) became a member during the 2009-2010 project year.
Table 5: Membership in a Science Professional Organization1
Member at beginning of 2009-2010 Modeling Workshop
Pre-survey PHYS1 CHEM1 YEAR2 OGT TOTAL
N=21 N=17 N=11 N=2 N=51
Yes 52.9 64.3 54.5 50.0 56.8
No 47.1 35.7 45.5 50.0 43.2
Member during of 2009-2010 School Year Post-survey
PHYS1 CHEM1 YEAR2 TOTAL2
N=15 N=13 N=8 N=37
Was a member prior to participating in Modeling 53.3 46.2 87.5 59.5
Became a member during a prior Modeling class 0.0 0.0 0.0 0.0
Became a member this year 0.0 7.7 0.0 2.7
Yes 53.3 53.9 87.5 62.2
No 46.7 46.2 12.5 37.8 1Percentages are based on those with valid response to item. 2There was only one OGT respondent to the Post-survey. This individual’s results are reported in the total only.
Modeling Workshops Annual Evaluation Report: 2009-2010 IRC (7/19/10) page 5

Only 44 percent indicated that they also took part in a science/science teaching conference in the 2008-2009 school year (Table 6), and this declined to less than two-fifths (38%) in the current school year. The lower than usual rate of participation is most likely due to the recession, as most districts have had to cut back on all non-essential expenses.
Table 6: Participation in Science/Science Teaching Conferences1
Pre-survey PHYS1 CHEM1 YEAR2 OGT TOTAL2
N=21 N=17 N=11 N=2 N=51
2008-2009
None 47.4 71.4 45.5 100.0 56.5
1 36.8 21.4 45.5 0.0 32.6
2 10.5 7.1 9.1 0.0 8.7
More than 2 5.3 0.0 0.0 0.0 2.2 Post-survey
PHYS1 CHEM1 YEAR2 OGT TOTAL2
N=15 N=13 N=8 N=1 N=37
2009-2010
None 53.3 69.2 62.5
See Note 2
62.2
1 33.3 23.1 37.5 29.7
2 6.7 0.0 0.0 2.7
More than 2 6.7 7.7 0.0 5.4
1Percentages are based on those with valid response to item. 2There was only one OGT respondent to the Post-survey. This individual’s results are reported in the total only.
Although participants overall are experienced teachers, there continues to be a mix of veteran and novice teachers, which can pose challenges for the instructional team. The Modeling Workshops have repeatedly demonstrated that having university actual high school teachers (who can provide ample examples from their own classrooms) along with faculty who work well with teachers on the instructional team enables the sessions to meet the needs of participants from a wide range of backgrounds.
PRE-SURVEY AND POST-SURVEY COMPARISONS Appendices 4-9 on pages 29-34 provide comparisons from the Pre-survey, completed by participants before beginning participation in the Modeling Workshops, and the Post-survey administered at the final follow-up session in March, approximately nine months afterwards. Appendix 4 presents participants’ opinions about science teaching and learning. Appendix 5 covers the extent to which they viewed teachers at their school as being interested in inquiry-based instruction and their principals as being supportive. Appendix 5 also includes questions about participants’ service as a resource to other science teachers in their schools and districts. Appendices 6 and 7 provide responses to OBR questions about teachers’ preparedness and instructional practices. Appendix 8 covers IRC questions that measure respondents’ opinions about their preparedness and experience with different teaching approaches, including hands-on and inquiry-based instruction, and their experience working with different student subgroups (e.g., females and students from various cultural backgrounds). Finally, Appendix 9 has teachers’ self-reports about the extent to which they use various classroom practices at least weekly.
Modeling Workshops Annual Evaluation Report: 2009-2010 IRC (7/19/10) page 6

Changes in Opinions about Science Instruction and School Support The IRC pre- and Post-survey results reported in Appendix 4 on page similarly revealed a high level of agreement across workshops with values often associated with the successful implementation of inquiry-based instruction:
Virtually all students can learn to think scientifically (91% - 100%).
I enjoy teaching science (91% - 100%).
The teacher should consistently use activities which require students to do original thinking (88%-100%).
Significant growth was realized on only one item, “Students learn science best in class with students of similar abilities (overall 41% agreed with this statement on the Pre-survey compared to only 24% on the Post-survey). Although not significant, there were changes in the desired direction with respect to inquiry-based instructional practices on four additional items.
Teachers should know the answers to most questions students ask about science (decreased from 59% to 22%).
Students should never leave science class feeling confused or stuck (decreased
from 28% to 8%).
I organize my curriculum around the textbook (decreased from 24% to 11%).
An important issue is not whether students’ answers to any science question are correct but whether students can explain their answers (increased from 80% to 89%).
Although PHYS1 and YEAR2 teachers modestly increased their agreement with, “Learning for all students is enhanced by incorporating the contributions of different cultures,” there was a non-significant decline in the proportion of teachers’ agreement overall (from 90% to 84%), which was driven by the large decrease in the CHEM1 teachers’ response (from 94% to 69%). The mediocre agreement of YEAR2 (73-75%) with this questions is also somewhat unusual. In addition, there were two items which agreement often goes down as the use of inquiry-based practices becomes more prevalent. However, the value overall stayed about the same, and unexpectedly more of the YEAR2 teachers agreed with these items by year-end.
Some people are good at science and some just are not (YEAR2 increased from 0% to 13%; overall stayed about the same with 14% to 16%).
Good science teachers show students the correct way to answer questions they will be tested on. (YEAR2 increased from 18% to 38%; overall stayed at 32% on both surveys).
On the Pre-survey, there was more variation than usual in the extent to which the workshop teachers viewed their principals as supportive of innovative approaches to science teaching (see Appendix 5 on page 30). PHYS1 (81%) and YEAR2 (82%) felt that their principals supported such activities, but the CHEM1 (69%) and OGT (50%) were less confident that their principals would be behind changes in science instruction. By year-end, CHEM1 reported greater support from principals (85%).
Modeling Workshops Annual Evaluation Report: 2009-2010 IRC (7/19/10) page 7

The initial and follow-up responses to the questions about peer support for science teaching at their schools also varied by workshop group. Although the PHYS1 teachers expressed less agreement (67%) by year-end, there were modest increases in the other groups.
Most science teachers in my school regularly share ideas and materials related to science instruction (Pre-survey: Overall=74%, PHYS1=76%, CHEM1=81%, YEAR2=64%, and OGT=50%; Pre-survey: Overall=75%, PHYS1=67%, CHEM1=83%, and YEAR2=75%).
On the following two items, the discrepancies between the workshop groups were less on the Post-survey and the overall trend was of increasing interest of teachers in inquiry-based instruction and active involvement in the science curriculum.
Most science teachers at my school would like to use an “inquiry” style of
teaching (Pre-survey: Overall=68%, PHYS1=71%, CHEM1=75%, YEAR2=46%, and OGT=100%. Post-survey: Overall=73%, PHYS1=80%, CHEM1=77%, and YEAR2=63%).
Most science teachers in my school contribute actively to making decisions about the science curriculum. (Pre-survey: Overall=54%, PHYS1=62%, CHEM1=56%, YEAR2=46%, and OGT=0%. Post-survey: Overall=68%, PHYS1=60%, CHEM1=77%, and YEAR2=63%).
Seventy percent overall initially agreed that “I regularly serve as a resource for other science teachers in my school,” which increased to 76 percent by year-end. Upon beginning the workshop, nearly a third (32%) said they served as a resource for other science teachers in their districts. This grew to 38 percent, with the largest reported gain among the CHEM1 teachers (up from 31% to 54%). The teachers overall described their principals and colleagues as more supportive of inquiry-based practices by the end of the project year. Nevertheless, the response pattern of the four workshop groups was unique compared to prior cohorts. The main difference is the PHYS1 teachers appeared more comfortable, whereas the CHEM1 teachers seemed less ready for the principles associated with inquiry than is usual. Consequently, we expected to see greater variation in the progress realized by each group by year-end. For example, there was especially room for potential growth by the CHEM1 group, which appears to have been realized. In addition, although the returning teachers (YEAR2 and OGT) had opinions that were overall more in line with inquiry-based instruction than the first-year groups, their responses suggested more resistance to some of aspects of inquiry-based instruction than is typically with returning teachers. Changes in Preparation and Classroom Practices Workshop participants’ responses to the OBR survey questions in Appendix 6 on page 31 revealed that most entered the workshop with a high level of interest in networking (96%), a good understanding of fundamental core content in their discipline (92%), excitement about teaching science (92%), and the perception that they were an effective teacher (92%). By the Post-survey, agreement with these four items was slightly higher (97-100%). Compared to prior year cohorts, these participants indicated greater comfort with using authentic assessment methods (84% felt they had a good understanding compared to 68% in the prior year), and there was a modest growth in the response to this item (89%). Even though not significant, there was also notable growth in the following aspects:
Modeling Workshops Annual Evaluation Report: 2009-2010 IRC (7/19/10) page 8

I have a good understanding of effective questioning techniques and its use in the classroom (PHYS1 from 81% to 100%; CHEM1 increased from 77% to 92%; YEAR2 from 64% to 88%; overall from 77% to 95%). Although more than three-quarters (77%) initially said they had a good understanding of effective questioning techniques, the YEAR2 group expressed a lower than expected level of competence with this strategy (64%), which fortunately increased by year-end.
I have a good understanding of the methods necessary to teach math and/or
science concepts effectively (largest increase for YEAR2 from 82% to 100%; overall from 84% to 97%).
In addition, they verified that they had a good understanding of how to relate
classroom activities to Ohio’s academic standards (largest increase for PHYS1 from 81% to 100%; overall from 86% to 97%).
The OBR questions in Appendix 7 (page 32) also support a pre-disposition toward classroom instruction that emphasizes group work. Specifically, few teachers felt that their “Students generally work independently” (0-8%) or that “Students generally learn concepts and processes through readings, lectures, and demonstrations” (3-4%). By the follow-up survey, more of the teachers said that “classroom interaction involves a dialogue among teacher and students” (from 69% to 81%) and that the “student role is to apply inquiry and problem solving skills” (from 71% to 76%). Consistent with the results from Appendix 6, more than a quarter (29-30%) said they “generally assess students’ progress using alternative methods (e.g., open-response questions, hands-on performance, portfolios, observations).” Only a small number of teachers said they “emphasize broad coverage of information with little depth (14% initially and 8% at follow-up) and “find it difficult to encourage the efforts and contributions of certain students or groups of students” (8% initially and 14% at follow-up). Appendix 8 on page 33 shows teacher self-ratings, before taking the workshop and approximately nine months afterwards, about their own preparation to teach in specific ways. Respondents grew significantly in their comfort with implementing inquiry learning, using cooperative groups, using science equipment, teaching heterogeneous ability groups, and using performance-based assessment in science (including portfolios). They experienced the following statistically significant increases:
Implementing inquiry or discovery learning (CHEM1 increased from 60% to 92%; overall increased from 67% to 92%).
Using cooperative groups (CHEM1 increased from 60% to 92%). Using science equipment as an integral part of science instruction (PHYS1
increased from 75% to 100%; overall increased from 77% to 95%)
Teaching groups that are heterogeneous in ability (overall increased from 65% to 89%).
Informing students of career opportunities in science (PHYS1 increased from
70% to 100%; overall increased from 64% to 78%).
Using performance-based assessment in science (PHYS1 increased from 55% to 87%; CHEM1 increased from 47% to 85%; overall increased from 52% to 78%).
Modeling Workshops Annual Evaluation Report: 2009-2010 IRC (7/19/10) page 9

Using portfolios to assess student progress in science (overall increased from 25% to 38%).
There were also noteworthy non-significant increases in the teachers’ preparation in the following areas:
Presenting the applications of science concepts (PHYS1 increased from 67% to 93%; CHEM1 increased from 67% to 85%; YEAR2 increased from 82% to 100%; overall increased from 71% to 92%).
Phrasing questions to encourage more open-ended investigations (PHYS1
increased from 62% to 93%; CHEM1 increased from 53% to 85%; overall increased from 59% to 87%).
Teaching groups from a variety of cultural backgrounds (CHEM1 increased from
53% to 77%; YEAR 2 increased from 55% to 75%; overall increased from 65% to 76%).
Encouraging participation of underrepresented minorities in science (CHEM1
increased from 60% to 92%; overall increased from 67% to 78%). However, YEAR2 teachers said they felt less prepared (decreased from 55% to 38%).
Participants were also asked to report on the frequency that they typically implemented various classroom activities in the prior school year. Appendix 9 on page 34 provides the detailed results. The most frequently utilized activity was once again small group work (96-100%). Consistent with prior cohorts, they regularly used hands-on/manipulative activities (89% on both surveys) in their classes, particularly the returning teachers (YEAR2 and OGT). This year’s participants expressed greater initial use of teacher-created lessons (94%) and science equipment (81%). On the Pre-survey, slightly more than half of the group indicated that their students learned by inquiry each week (53%). As with past cohorts, the first year participants tended to have lower use of inquiry-based instruction. Although both OGT teachers said their students frequently participated in inquiry, only 73 percent of the YEAR2 teachers had a similarly high use, which was less than the prior year group (91%). Given these patterns, there was less room for the dramatic changes in classroom practices that we have seen with prior cohorts. Although the progress on these items was not statistically significant, the following changes are consistent with increased use of inquiry-based practices.
Learn by inquiry (PHYS1 increased from 50% to 79%; CHEM1 increased from 36% to 54%; YEAR2 increased from 73% to 88%; overall increased from 53% to 72%).
Engage in reflective thinking/writing about what they are learning (CHEM1
increased from 36% to 62%; overall increased from 38% to 43%).
Make conjectures and explore possible methods to solve a scientific problem (PHYS1 increased from 35% to 60%; overall increased from 51% to 62%).
Write their reasoning about how to solve a scientific problem (PHYS1 increased
from 30% to 53%; YEAR2 increased from 64% to 75%; overall increased from 45% to 60%).
Modeling Workshops Annual Evaluation Report: 2009-2010 IRC (7/19/10) page 10
Read a science textbook (PHYS1 decreased from 55% to 20%; CHEM1 decreased from 50% to 23%; overall decreased from 43% to 22%).
Use worksheets from textbooks (PHYS1 decreased from 50% to 20%; CHEM1
decreased from 50% to 23%; overall decreased from 40% to 19%). Thus, by the end of the project year, the different groups were using inquiry-based instructional strategies to a greater extent. The changes overall were modest, as many of the participants were already using these approaches in their classrooms. However, for others it was a major shift in their approach. Teachers’ comments underscored their use of specific strategies from the Modeling Workshops such as having students use whiteboards as well as making them explain their answers to a greater degree. The YEAR2 participants gave examples of how they expanded their use of modeling and made major changes to their curriculum. Below are open-ended comments made by teachers in response to the Post-survey question “What kind of changes, if any, did you make in how you teach your science classes as a result of your Modeling Workshop experience this year?” Specific examples included:3 PHYS1
Using whiteboards to share information, engage students, promote discovery, and assess student understanding. I started teaching honors physics for the first time this year and completely used modeling as the method of teaching. I also incorporated many units into 9th grade physical science. More performance-based assessments. More student discovery labs/challenges. I included the underpinnings at the beginning of the school year. I used the materials of matter and force modified to the 8th grade. I used white boards regularly. I included “challenges” in my assessments. I used more student-centered learning strategies. The students did more of their own thinking and reflected on learning. Students were more engaged because there were more hands-on activities and more performance-based assessments. Students learned to do science, instead of reading about others doing science and answering questions about how other people do science. Learning to let go and let the students do the work. They now don’t want me to do a demo each time. They want to jump in and do for themselves and compare results with each other.
CHEM1
I am using the whiteboards as a method of conducting class discussions and pulling out ideas…almost daily. We also use many of the inquiry/discovery ideas presented for chemistry. Incorporated the modeling approach and timeline in class. Encouraged cooperative learning groups.
3 Additional responses are provided in Appendix 14 (pages 39-41).
Modeling Workshops Annual Evaluation Report: 2009-2010 IRC (7/19/10) page 11

Implemented inquiry-based activities. Alternative assessments to elicit explanations by students. Having students experience concepts in learning situations rather than finding them the answers. Incorporate situations that require them to think and test their understanding of concepts. Use of whiteboards. Student-led discussion. Leaving questions unanswered. Use of journals in class. Lab discussion led by students to debate/explain results. Incorporated much more student participation/presentation with white boarding. Builds student confidence and language skills.
YEAR2
I have implemented the following changes as part of introducing modeling to my science classes: Reduced lecture days to one or two a week covering approximately 20-25 minutes. Students work in groups to address specific key topics of study besides lab-based activities. Students participate in more inquiry and problem solving activities. Students are placed in pair-based exercises or small groups (3 participants) to support or counsel or tutor each other. Incorporated layered curriculum into the classroom to provide diversified learning materials for each student. Provide more performance-based assessments to keep students and parents informed of their child’s progress during the year. I continue to revamp my old units to make them more modeling like. I would like to organize all of my units like my 2nd year project for ease of use. I continue to modify labs that I’ve had using traditional style teaching into more modeling friendly labs that focus on manipulating variables and looking at connections/results to see the bigger picture. I required students to explain the reasoning behind a concept. Think about the big picture/end product at the beginning and scaffold unit from there. I incorporated the lessons we created during the workshop this past summer. I also tried to improve other lessons to make them line up more with the modeling approach. I am currently using the method to teach my freshmen integrated science class. The way that material is presented and discussed has changed dramatically. Since I was in the second year chemistry course, my changes were more in how I thought the material should go together. I was more experimental in the way I taught.
Most of the participants emphasized their use of modeling and suggested that the approach resulted in their students being more actively engaged in their own learning. Two teachers, however (one in PHYS1 and the other in CHEM1) indicated that they were already using inquiry-based practices and that the workshop did not enhance their instruction. They explained:
Modeling Workshops Annual Evaluation Report: 2009-2010 IRC (7/19/10) page 12

I was using all those techniques to a large extent even before I attended the modeling workshop. It was a very basic workshop in content and extremely time consuming in delivering the small content. I initially started teaching with the particle diagrams. I forwent that after the first unit because I had so many learning targets to fit in, and it was impossible to concentrate on just a few. I have decided not to continue doing modeling. After 33 successful years of science teaching, it is better for me to continue with what worked very well for me. I am incorporating learning targets, student reflections, more formative assessments and the inquiry, scientific reasoning that I have used in the past.
Although the Modeling Workshop may not be for everyone, the majority of participants embraced it and are making an effort to apply the recommended practices in the classrooms despite numerous obstacles. Teachers underscored the challenges they often faced.
The biggest problem I have is a lack of scientific equipment, and I realize that supplying me with that equipment is beyond the scope of the workshop. Need more on how to modify the modeling to fit your schedule. I have only 45-minute periods, which makes modeling harder. This year was the first year I incorporated any form of modeling into the classroom. While it wasn’t a complete transformation, small steps were made.
SUMMER WORKSHOP AND FOLLOW-UP RESULTS All 56 teachers who participated in a summer workshop completed an End of Workshop Survey. Appendices 10-13 on pages 35-38 provide participants’ responses to questions about the impact of the session and the extent to which their understanding increased because of their experience. The Post-survey results, representing 37 respondents, begin on page 17. Summer Workshop Highlights Appendix 10 on page 35 presents participants’ opinions about the workshop at the end of the session. All respondents agreed:
Overall, this workshop was a successful professional development experience.
Would recommend this workshop to other teachers.
Increased their ability to see connections among science concepts.
Participants’ questions and concerns were addressed effectively.
High proportions (89-100%) of the each group affirmed that (overall percentage is indicated):
They had adequate time to reflect on and relate material to their experience and needs (98%).
This workshop enhanced their confidence in teaching science (98%).
Modeling Workshops Annual Evaluation Report: 2009-2010 IRC (7/19/10) page 13

This workshop has helped them become a more effective teacher (98%).
They gained skills in how to use inquiry in my classroom (96%). They feel better prepared to encourage science activities in their buildings (96%).
Everyone in the Year 1 and OGT groups agreed that the workshop contributed positively to their attitude about science. All of the PHYS1 and OGT participants and most of CHEM1 (94%) also said that the summer experience improved their content knowledge. Teachers in these groups also felt that they had increased their ability to see connections between science and math (PHYS1=95%, CHEM1=94%, and OGT=100%). The YEAR2 group, on the other hand, had less agreement with these three items (71-79%). These findings were consistent with the prior year. Both Year 1 groups unanimously confirmed that they gained skills in complex thinking and reasoning. This was less true for the YEAR2 (79%) and OGT teachers (67%). Fewer of the YEAR2 group (79%) compared to the prior year (90%) confirmed that the amount of guidance/structure was appropriate. On the other hand, all of the OGT participants indicated that the amount of guidance/structure was a match with their needs. The two lowest related areas were consistent with prior years:
I have a better understanding of how to apply the science standards (Overall=77%, PHYS1=95%, CHEM1=61%, YEAR2=64%, and OGT=100%).
I feel prepared to provide professional development on the covered workshop-
specific activities for teachers in my building (Overall=75%, PHYS1=86%, CHEM1=61%, YEAR2=71%, and OGT=100%).
Of note is that the PHYS1 teachers said that they had a better understanding of how to apply the science standards and felt prepared to provide professional development to their colleagues increased from the prior cohort (77% and 46% respectively agreed with these questions). The instructional team may have included additional coverage of the standards in the PHYS1 course. Furthermore, as has been typical with other Modeling cohorts, at year-end, they confirmed that the workshop appropriately addressed the standards and participants informally share what they learn with teachers in their buildings (see Tables 11 and 12 on pages 18-19). Table 7 provides coverage of additional areas in which teachers may have furthered their understanding because of the workshops (also see Appendix 11). The OGT respondents indicated that they had improved their understanding on all aspects covered by this set of survey questions. All but one CHEM1 teacher said they learned strategies that they can use to improve students’ science performance. Most participants also said that they increased their understanding of effective applications of inquiry-based instruction in classrooms. Participants’ opinions about the other impacts varied by workshop. Both the PHYS1 (95%) and YEAR2 (93%) groups agreed they learned about the technology required for effective instruction in science, but fewer CHEM1 teachers (71%) felt that they increased their understanding in this area. Most of the PHYS1 (95%) and CHEM1 (94%) teachers said they increased their awareness of current research in science education and their ability to utilize such research to their classes. The PHYS1 teachers gave a much higher rating of these items than the prior cohort did. YEAR2, on the other hand, had a lower level of agreement with these items (64%). A similar pattern occurred in the groups’ opinions about the extent to which they gained strategies for facilitating change in science instruction in their buildings (PHYS1=86%, CHEM1=82%, and YEAR2=64%). In contrast, more of the PHYS1 (91%) and YEAR2 (86%) teachers felt they had increased their understanding of effective uses of alternative assessment, whereas this was less the case for CHEM1 (77%). Seventy-nine percent overall indicated that their understanding
Modeling Workshops Annual Evaluation Report: 2009-2010 IRC (7/19/10) page 14

of the “Application of Ohio’s science standards” increased, which is higher than occurred with the prior year cohort (71%). The Year 1 groups were more likely to agree that the workshop impacted their understanding of the standards compared to the prior year, whereas the opposite pattern was evident for YEAR2 (2009-2010: PHYS1=80%, CHEM1=88%, and YEAR2=64%; 2008-2009: PHYS1=76%, CHEM1=53%, and YEAR2=91%).
Table 7: Increased Understanding from the Workshops1
—Questions Ordered by High to Low Total Response—
PHYS1 CHEM1 YEAR2 OGT TOTAL N=21 N=18 N=14 N=3 N=56 Strategies that can be used to improve students’ science performance. 100.0 94.1 100.0 100.0 98.1
Effective applications of inquiry-based instruction in classrooms. 100.0 94.1 92.9 100.0 96.3
The technology required for effective instruction in science. 95.2 70.6 92.9 100.0 87.0
Awareness of current research in science education. 95.2 94.1 64.3 100.0 87.0
Ability to utilize current research in science education in my classes. 95.2 94.1 64.3 100.0 87.0
Effective uses of alternative assessment. 90.5 76.5 85.7 100.0 85.2 Strategies for facilitating change in science instruction in my building. 85.7 82.4 64.3 100.0 79.6
Application of Ohio’s science standards. 80.0 88.2 64.3 100.0 79.2
1Percent of participants who indicated that they "Strongly Agree" or "Agree" with each statement. Percentages are based on those with valid response to item.
The teachers were also asked to rate the value of specific workshop activities (Table 8 and Appendix 12). Once again, the most highly rated aspects were modeling inquiry, the collegial interaction with other participants and facilitators, and the purchase of the educational/classroom materials. The introduction to resources was also well-received (89%).
Table 8: Workshop Activities Rated Worthwhile1
—Questions Ordered by High to Low Total Response—
PHYS1 CHEM1 YEAR2 OGT TOTAL N=21 N=18 N=14 N=3 N=56 Modeling of inquiry. 100.0 100.0 92.3 100.0 98.2 Overall interaction with the other participants. 100.0 100.0 100.0 66.7 98.2 Overall interaction with workshop facilitators. 100.0 100.0 100.0 66.7 98.2 Purchase of educational/classroom materials. 95.0 100.0 100.0 NA 96.0 Year 2 Workshop Only: Large blocks of "free" time spent working on curriculum. NA NA 92.3 100.0 93.3
Introduction to various sources of curriculum materials (books, websites, etc.). 90.5 94.4 84.6 66.7 89.1
Discussion of reading assignments. 90.5 94.4 84.6 NA 88.7 Reading assignments (research articles). 95.2 88.9 76.9 NA 86.8 Examples on how to apply district standards. 75.0 87.5 41.7 100.0 72.5
1Percent of participants who indicated that the activity was "Very Worthwhile" or "Somewhat Worthwhile." Percentages are based on those with valid response to item.
Modeling Workshops Annual Evaluation Report: 2009-2010 IRC (7/19/10) page 15

The reading assignments and their discussion received higher ratings this year (89%). The results suggest that the instructional team may have made adjustments to the Year 1 reading materials, as there were more complaints last year about the need for more current articles. Compared to the prior year, more of this year’s PHYS1 and CHEM1 teachers viewed the coverage of the examples on how to apply district standards as worthwhile, whereas the YEAR2 group gave a lower rating (2009: PHYS1=75%, CHEM1=88%, and YEAR2=42%; 2008: PHYS1=57%, CHEM1=53%, and YEAR2=73%). Year 1 participants, as is typical at the end of the summer course, emphasized their appreciation of the modeling experience and the way they learned from being in student mode, participating in the discussions, and reading the research articles. PHYS1
Instructors were great. Purchasing materials was wonderful for me since I teach in a high-needs school. Meeting other teachers from different areas. The content improved my understanding so much, and I can’t wait to use new methods with my students. This workshop has been the best thing I have ever done to become a better teacher. This has completely changed the game for me. Thank you for allowing me to participate. Seeing the modeling process demonstrated was invaluable. Excellent, excellent. Going through the labs, worksheets, and challenges as students and then discussing things as teachers afterwards.
CHEM1 I appreciated how everything was research based! That’s solid. Learning new insights/ways to teach the same stuff that I’ve taught for years makes me excited about going back to work in the fall (instead of dreading it). I loved doing so many of the labs and getting the chance to question everyone else. Good practice! This is the first time anyone has given me a good enough reason to teach ratios instead of the factor-label method. You guys did a great job! Networking with other participants. Seeing modeling from the student point of view. Seeing questioning techniques on a variety of topics. Having the necessary research available to help support and advocate modeling. The experiment of the laboratories and activities in student mode were enlightening and beneficial. Having the knowledge and experience of the instructors was critical in the success of the workshop.
Returning teachers (YEAR2 and OGT) also gave a high rating to the large blocks of “free” time available to work on curriculum.4 Their comments about the strengths of the workshop underscored the benefits of having time to create curriculum units.
4 Participants in the other two workshops were not asked this question because the workshops were not designed to include large blocks of “free” time to work on curriculum.
Modeling Workshops Annual Evaluation Report: 2009-2010 IRC (7/19/10) page 16
Working on a unit of “my own” really helped me see what modeling instruction is all about. Until I had to plan my own unit, I never worried too much about what my model was.
They say if you really understand the material, you can teach it to someone. If you understand modeling, you can make a modeling unit! Making the unit opened my eyes to what the modeling framework is, and how flexible it can be.
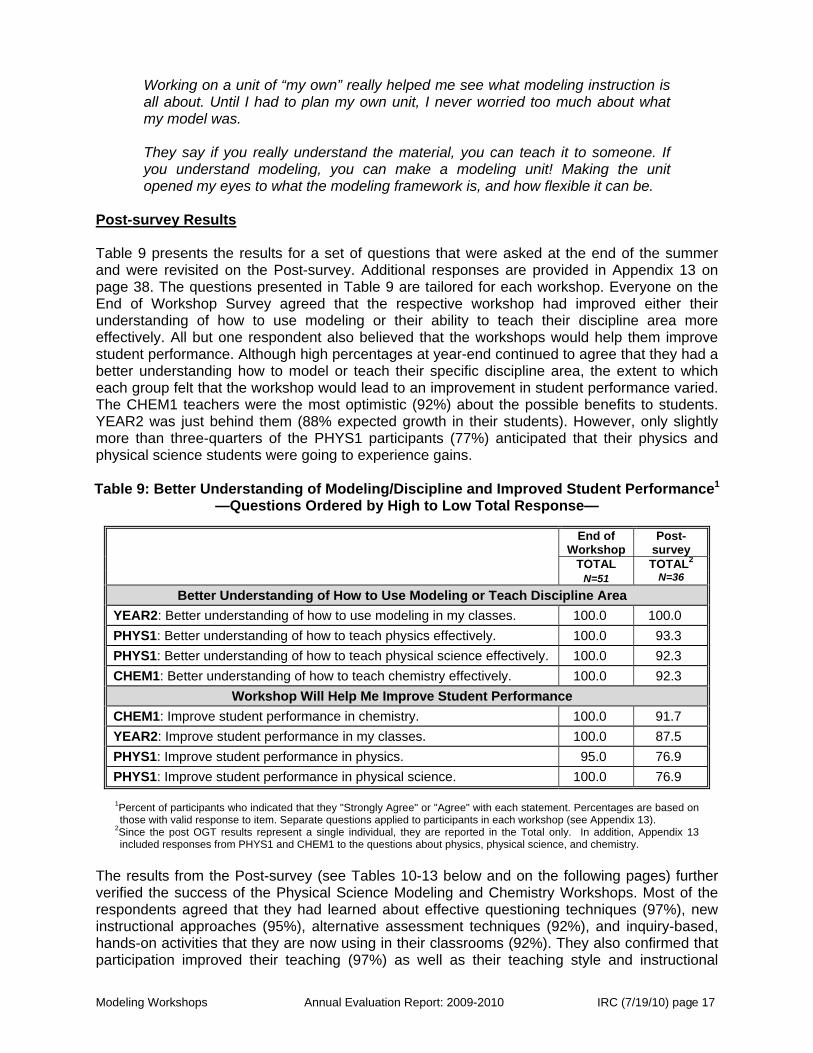
Post-survey Results Table 9 presents the results for a set of questions that were asked at the end of the summer and were revisited on the Post-survey. Additional responses are provided in Appendix 13 on page 38. The questions presented in Table 9 are tailored for each workshop. Everyone on the End of Workshop Survey agreed that the respective workshop had improved either their understanding of how to use modeling or their ability to teach their discipline area more effectively. All but one respondent also believed that the workshops would help them improve student performance. Although high percentages at year-end continued to agree that they had a better understanding how to model or teach their specific discipline area, the extent to which each group felt that the workshop would lead to an improvement in student performance varied. The CHEM1 teachers were the most optimistic (92%) about the possible benefits to students. YEAR2 was just behind them (88% expected growth in their students). However, only slightly more than three-quarters of the PHYS1 participants (77%) anticipated that their physics and physical science students were going to experience gains. Table 9: Better Understanding of Modeling/Discipline and Improved Student Performance1
—Questions Ordered by High to Low Total Response—
End of Workshop
Post-survey
TOTAL TOTAL2
N=51 N=36
Better Understanding of How to Use Modeling or Teach Discipline Area YEAR2: Better understanding of how to use modeling in my classes. 100.0 100.0 PHYS1: Better understanding of how to teach physics effectively. 100.0 93.3 PHYS1: Better understanding of how to teach physical science effectively. 100.0 92.3 CHEM1: Better understanding of how to teach chemistry effectively. 100.0 92.3
Workshop Will Help Me Improve Student Performance CHEM1: Improve student performance in chemistry. 100.0 91.7 YEAR2: Improve student performance in my classes. 100.0 87.5 PHYS1: Improve student performance in physics. 95.0 76.9 PHYS1: Improve student performance in physical science. 100.0 76.9
1Percent of participants who indicated that they "Strongly Agree" or "Agree" with each statement. Percentages are based on those with valid response to item. Separate questions applied to participants in each workshop (see Appendix 13).
2Since the post OGT results represent a single individual, they are reported in the Total only. In addition, Appendix 13 included responses from PHYS1 and CHEM1 to the questions about physics, physical science, and chemistry.
The results from the Post-survey (see Tables 10-13 below and on the following pages) further verified the success of the Physical Science Modeling and Chemistry Workshops. Most of the respondents agreed that they had learned about effective questioning techniques (97%), new instructional approaches (95%), alternative assessment techniques (92%), and inquiry-based, hands-on activities that they are now using in their classrooms (92%). They also confirmed that participation improved their teaching (97%) as well as their teaching style and instructional
Modeling Workshops Annual Evaluation Report: 2009-2010 IRC (7/19/10) page 17

techniques (97%). Finally, participants verified that the professional development increased their enthusiasm for teaching (92%). There was only modest variation in the response from each group. The only exception to this was the difference in the PHYS1 agreement (80%) with CHEM1 (62%) and YEAR2 (63%) on the “learned new content” questions. Overall, there was much less agreement with this item (70%) than in past years. A few of the participants stressed that the focus of the course is on approach rather than content. However, at the end of the summer, 93 percent confirmed that they had improved their content knowledge (Appendix 10).
Table 10: OBR Questions about the Impact on Participating Teacher1
As a result of this professional development…
PHYS1 CHEM1 YEAR2 TOTAL2
N=15 N=13 N=8 N=37
a) I learned new content (concepts, facts and definitions)… 80.0 61.5 62.5 70.3
b) I learned new instructional approaches / teaching strategies… 100.0 92.3 100.0 94.6
c) I learned effective questioning techniques… 100.0 92.3 100.0 97.3 d) I learned about alternative forms of assessment… 93.3 84.6 100.0 91.9 e) I learned inquiry-based, hands-on activities that I
now use in my classroom… 93.3 92.3 87.5 91.9
f) Participation in this professional development improved my teaching… 100.0 92.3 100.0 97.3
g) Participation… improved my teaching style and instructional techniques… 100.0 92.3 100.0 97.3
h) Participation… increased my enthusiasm for teaching… 100.0 84.6 87.5 91.9
1Percent of participants who indicated that they "Strongly Agree" or "Agree" with each statement. Percentages are based on those with valid response to item.
2Since the post OGT results represent a single individual, they are reported in the Total only.
Table 11 highlights participants’ opinions about the professional development experience. High proportions (85-100% for each group) felt that the professional development provided ample time to achieve the stated objectives; was of high quality, sustained, and intensive; and was linked to state and national standards. The lowest rated item overall was “provided adequate follow-up” (87%); interestingly, the PHYS1 group was satisfied with the follow-up (100%), CHEM1 was in the middle (85%), and YEAR2 appeared to want additional contact (63%). One YEAR2 participant wrote: “I wished there were more follow-up sessions. I was not able to attend the one for my session. I missed the opportunity to learn more.”
Table 11: OBR Questions about Professional Development Experience1
PHYS1 CHEM1 YEAR2 TOTAL2
As a result of this professional development… N=15 N=13 N=8 N=37
a) …provided ample time to achieve the stated objectives… 100.0 84.6 100.0 94.6
b) …provided adequate follow-up… 100.0 84.6 62.5 86.5 c) …provided useful resources and/or materials to
assist with my instruction in the classroom… 93.3 92.3 87.5 91.9
d) …was high quality, sustained and intensive… 100.0 84.6 100.0 94.6 e) …was linked to state and national standards… 100.0 84.6 100.0 94.4
1Percent of participants who indicated that they "Strongly Agree" or "Agree" with each statement. Percentages are based on those with valid response to item.
2Since the post OGT results represent a single individual, they are reported in the Total only.
Modeling Workshops Annual Evaluation Report: 2009-2010 IRC (7/19/10) page 18

Table 12 presents the results to questions about participants’ professionalism. All said that they would recommend the program to other teachers. Most (97%) have shared what they learned through informal interactions with their colleagues (97%) and felt that the program had resulted in a professional network among participants. Many have maintained contact with each other (91%), with the teacher instructors (83%), and the university (82%). Slightly more than half (51%) had attended a professional association conference. Less than a third (30%) had shared through formal interactions with colleagues; however, as would be expected, YEAR2 teachers were more likely to say they did this (38%).
Table 12: OBR Questions about the Impact on Teachers’ Professionalism1
PHYS1 CHEM1 YEAR2 TOTAL2
As a result of this professional development… N=15 N=13 N=8 N=37
a) I have maintained contact (or plan to maintain contact) with other participants… 93.3 84.6 100.0 91.4
b) I have maintained contact (or plan to maintain contact) with college/university faculty who provided the professional development…
85.7 75.0 85.7 82.4
c) The program led to the establishment of a professional network among participants… 93.3 100.0 100.0 96.9
d) I have attended a professional association conference… 46.7 45.5 75.0 51.4
e) I have or would recommend this program to other teachers… 100.0 100.0 100.0 100.0
f) I have shared what I learned with colleagues through informal interactions… 100.0 92.3 100.0 97.3
g) I have shared what I learned with colleagues through formal interactions... 26.7 23.1 37.5 29.7
h) I have maintained contact (or plan to maintain contact) with the teachers leaders who provided the professional development…
76.9 76.9 100.0 82.9
1Percent of participants who indicated that they "Strongly Agree" or "Agree" with each statement. Percentages are based on those with valid response to item.
2Since the post OGT results represent a single individual, they are reported in the Total only. The reported impact on students varied widely by workshop group (Table 13). However, the pattern of PHYSI reporting the greatest impact, followed by CHEM, and then YEAR2 was consistent for all the questions in this set. The lower YEAR2 response may be partly due to less change being possible, given that they should have incorporated modeling in their classrooms in a previous year.
Table 13: OBR Questions about Impact on Students1
As a result of my participation in this professional development program…
PHYS1 CHEM1 YEAR2 TOTAL2 N=15 N=13 N=8 N=37
a) My students are more attentive, enthusiastic and involved in classroom activities… 100.0 69.2 37.5 75.7
b) The quality of student work is noticeably improved… 86.7 61.5 50.0 75.7
c) My students are participating in science and math activities outside of the classroom to a greater degree…
53.3 38.5 12.5 40.5
1Percent of participants who indicated that they "Strongly Agree" or "Agree" with each statement. Percentages are based on those with valid response to item.
2Since the post OGT results represent a single individual, they are reported in the Total only.
Modeling Workshops Annual Evaluation Report: 2009-2010 IRC (7/19/10) page 19

All of the PHYS1 participants said that their students were more attentive, enthusiastic, and involved in classroom activities, which was followed by the CHEM1 group (69%), while only slightly more than a third of YEAR2 (38%) agreed with this item. Most of the PHYS1 (87%) felt the quality of student work was noticeably improved, but the other groups had a lower level of agreement (CHEM1=62% and PHYS1=50%). Slightly more than half of the PHYS1 teachers (53%) reported that their students were participating in science and math activities outside the classroom to a greater degree; CHEM1 (39%) and YEAR2 (13%) were less confident about this type of impact on their students. Participants’ Recommended Changes to Workshop and Follow-up Sessions At the end of the summer, teachers made numerous suggestions in response to the question, “In your opinion, what aspects of this workshop could be improved?” A few recommended adjustments to the daily schedule. One simply stated, “8-4:30 M-TH (No Friday Class).” Another thought that the workshop should be offered as a college course:
I would like to eventually see this workshop offered as a college course that lasts a semester. I would have learned so much more over a longer period of time or offer another part to the Year 1 workshop.
The YEAR2 group, however, expressed some frustration about their need for more detailed feedback earlier on. Specific comments included:
More discussion of articles. More guidance on how to set up a modeling unit. More time spent as class discussing modeling unit/structure. Slightly less time working on own in groups with material. Not told that our unit did not fit “modeling type” until 10 minutes after “soft copy” was due. We needed more direction earlier on. It appeared that we didn’t receive feedback until it was too late to change the unit. Very frustrating experience.
One CHEM1 teacher indicated that she could not think of any needed changes:
Not sure that I can really request more improvement. It is all well organized and thoughtfully prepared. One may agree or disagree with the sequence or other issues. However, you are spending time thinking about what you do as a teacher, which I feel makes for a good workshop.
However, others emphasized the need for additional feedback. Of concern is that one participant described some of the summer feedback within the CHEM1 course as unnecessarily harsh.
Provide feedback to us when we practice. Be sure the feedback is constructive. Several participants felt they were slammed—very crushing experiences for some of them. More practices/guidance with questioning. Feedback on modeling/questioning practice from instructors—little or none was provided to participants. Give feedback after we have practice teaching and leading discussions. Maybe give students feedback forms to fill out.
Modeling Workshops Annual Evaluation Report: 2009-2010 IRC (7/19/10) page 20

Table 14 outlines the teachers’ participation in the three follow-up sessions that took place on three Saturdays during the school year. All of the PHYS1 teachers attended at least one session. Nearly a third of the CHEM1 group (23%) did not go to a follow-up meeting; however, those who attended were likely to make it to all three days (46%). Half of the YEAR2 group attended only one session and the other half did not go to any. Overall, of the Post-survey respondents, more than four-fifths (81%) attended at least one session, and nearly a third (32%) went to all three meetings.
Table 14: Attendance at Follow-up Sessions
Number of Follow-up Sessions PHYS1 CHEM1 YEAR2 TOTAL1
N=15 N=13 N=8 N=37
None 0.0 23.1 50.0 18.9
One 6.7 15.4 50.0 21.6
Two 53.3 15.4 0.0 27.0
Three 40.0 46.2 0.0 32.4
1Since the post OGT results represent a single individual, they are reported in the Total only. The Post-survey also included a question asking participants, “Are there any modifications that you would recommend be made to the follow-up sessions?” Selected comments are included below and additional comments appear in Appendix 14 on page 40. Twenty-two of the 37 respondents (59%) to the Post-survey left this item blank or specified “none.” One YEAR2 respondent was especially pleased with the experience, saying “excellent workshop, perhaps the most influential experience in my teaching career.” Three recommended that the follow-up sessions have a later start time in the morning. Two also shared that three weeks for the summer session was too much.
I strongly feel three weeks for the modeling workshop is way too much time. At times, I felt like activities were designed to fill in time rather than to deliver the content. Some activities like reading and writing the papers could have been handled much better by discussion alone rather than consuming 1-2 hrs of time. While I enjoyed the program and found it beneficial, the time requirements were too demanding. If the program was shorter, I believe many more teachers would be interested.
Participants generally expressed dissatisfaction with the speakers from the summer program and follow-up sessions. Nevertheless, one respondent stressed the value of this component, “The speakers were very helpful in helping me understand how science is used by college education professors and industry.” Many also felt the speaker from Battelle was “excellent.” Several urged more contact between the first and second year participants.
Networking with others is critical. Follow up during year facilitated this. Need to hear from more experienced teachers that this is a process—reassurance that I will get where I want to be with time.
There was clearly a desire for additional communication, both in-person and on-line. One mentioned that they had regular e-mail correspondence from the project leadership, “The weekly correspondence provides excellent information and opportunities for all concerned.” However, another explained that he missed a follow-up session due to irregular communication,
Modeling Workshops Annual Evaluation Report: 2009-2010 IRC (7/19/10) page 21

“I missed the 3rd session because I did not receive as much notice as I did for the other two follow-ups.” This discrepancy is likely due to how various e-mail systems classify incoming messages. The Project Director pointed out that the Yahoo listserv was flagged as SPAM by some districts, which resulted in participants not always receiving important announcements. They hope to resolve this problem by moving to OSU’s e-mail system. Teachers from both years also wanted more sharing of the models (even in draft form) that YEAR2 was developing, and a few noted that this could be done as part of expanding communication through a more “user-friendly web site” in which “resources for modelers” could be readily shared. A few suggested use of Wikis, Blogs, and Skype as part of facilitating cost-effective and ongoing communication.
At some point, it would be great if there were an Ohio modeling website with Year 2 projects and the OGT curriculum. Online website with units that have been developed. More online communication between participants. Perhaps a model type site where participants could post supplementary material to use with each unit. Having a wiki or blog to contact others from the group and/or previous participants. I found the current system hard to find, if it is working. I just gave up looking a few months ago. Additional workshops during the year. Internet group collaboration. Skype session since we are scattered around state? Better organization of materials that previous 2nd year groups have developed.
Others mentioned the potential value of a Modeling Conference, at least annually in which workshop alumni and current participants would come together. It was clear that they wanted to hear about the practices of high school teachers who were successfully using modeling in their classrooms. Additional practical suggestions from respondents included the following:
Give teachers two copies of worksheets/materials—one for us to do in workshop and a blank one to use later. A possible modeling mentoring program—pair a new teacher with a teacher who has been teaching modeling for years. Perhaps a roundtable—people can share something new that they created or used since they’ve been using modeling.
The Project Director also noted a small group of the participants were able to go to the annual conference of the American Association of Physics Teachers (AAPT) in Ann Arbor, Michigan. She pointed out that there was a gathering there for “anybody who has taken a modeling workshop anywhere in the country.” She explained that the Ohio teachers constituted a third of the modeling representatives and emphasized the value to the participants.
Modeling Workshops Annual Evaluation Report: 2009-2010 IRC (7/19/10) page 22

It seemed like they were being asked for ideas from a lot of people from around the country. There seemed to be a lot of respect for our teachers and what they had to say. I was very pleased to see that.
In addition, she has noticed participants’ growing activity on national modeling listservs. We have now added a question to cover this on the Pre- and Post-surveys, so this will provide another measure of teachers’ professional involvement and outreach to peers. CONCLUSIONS AND RECOMMENDATIONS The 2009-2010 Physical Science and Chemistry Modeling Workshops provided an effective professional development experience. Fifty-six teachers participated in the summer session in which teacher-instructors modeled inquiry-based instructional practices. High proportions confirmed that the session increased their understanding and use of the presented strategies. This cohort also expressed greater comfort with the use of alternative assessment compared to those in prior years. Many of the teachers gave concrete examples of their use of whiteboards and efforts to have students explain their answers. They have also incorporated changes in their assessment practices. Preliminary assessment results on teachers and students from the project leadership suggest that the experience has also resulted in significant impacts on their understanding. These data will be included in the Project Director’s Annual Report. This year’s cohort revealed some unexpected patterns in pre-existing opinions and practices. Specifically, the PHYS1 teachers appeared to have attitudes and use of instructional strategies that were more in line with inquiry-based instruction than is usual when teachers begin a Modeling Workshop. In contrast, prior CHEM1 teachers tended to have had more experience with inquiry-based strategies than was evident with the current cohort. Finally, the returning teachers, particularly those in YEAR2, revealed more resistance to inquiry-based practices than is typical among those who have completed a Modeling Workshop. Despite the somewhat unusual initial response sets for each group described above, there were statistically significant increases in participants’ comfort with implementing inquiry, using cooperative groups, using science equipment as an integral part of science instruction, teaching groups that are heterogeneous in ability, informing students of career opportunities in science, using performance-based assessment in science, and using portfolios to assess student progress in science. As expected based on the Pre-survey results, the CHEM1 group was most likely to experience significant growth. However, the PHYS1 teachers demonstrated more significant gains than expected, given their greater level of preparation in most of these areas at the onset. The Project Director also pointed out that the PHYS1 group, “really came together and had a very nice sense of community.” Thus, an important impact on this group may have been the opportunity to connect with like-minded teachers. Furthermore, there was noteworthy non-significant growth in the YEAR2 participants. They increased their ability to incorporate inquiry-based practices effectively. Applying their knowledge to curriculum development appeared to produce a breakthrough in their appreciation of how they should be working with students, suggesting that these teachers had begun to overcome much of their resistance to inquiry-based practices mentioned above. The OGT Development teachers also benefitted from the experience. In addition, their work will be incorporated into a new session for the 2010-2011 workshops that will focus on the needs of 9th grade physical science teachers. The Project Director explained that the new course will have some overlap with the physics and chemistry courses as well as earth science, as all of these areas are part of the benchmarks in Ohio and coverage on all is needed as part of preparing students for the OGT.
Modeling Workshops Annual Evaluation Report: 2009-2010 IRC (7/19/10) page 23

The teacher-instructors also continued to see benefits of their involvement in modeling within their own schools and district. It was typical for a contingent of teachers at their schools (specifically 3-6) to have completed a least one workshop, which facilitated collaboration and use of inquiry-based practice across the curriculum. The teacher-instructors shared:
Teachers have been collaborating and sharing techniques and strategies with teachers who have taken a modeling course in a different subject or who haven’t taken a workshop at all. More teachers are interested in taking a workshop or additional workshops. One thing is that I think my principal and superintendent have seen the importance of developing skills as much as teaching content. There is now a large push on developing 21st century skills at our school district and I think Modeling is seen as a central way to do that. On top of the collaboration, we have aligned our curriculum with assessments.
The Project Director gave a further example of a participant who “has managed to integrate several activities that are from our workshop.” She went on to explain that the teacher “is making them standard practice in the high school’s freshmen physical science course, which she was all excited about, and she is now planning to push 2 or 3 new things in every year.” As part of preparing staff, additional teachers (2-3) from this district are planning to participate in the 2009-2010 session. The teacher-instructors and Project Director also spoke about the ongoing interest in and impact of the workshop.
As years have gone on, I thought the interest and impact of these workshops might wane. I think the exact opposite is true. As more teachers see the benefit of this type of instruction the impact continues to grow and word continues to spread within and between buildings and districts. The Modeling workshops are the most important work I perform outside of teaching my classes at the high school. I continue to learn from participants and other workshop leaders.
We didn’t do any mailings this year. We used various e-mail lists that we know about. The word even got out late in Southern Ohio, but the individual teachers have done such a great job of promoting it for us. All we have to do is send them the information and tell them we need their help, and it happens.
The Modeling Workshops continue to serve the needs of physical science, physics, and chemistry teachers. Moreover, participants repeatedly requested continuation courses. For example, one YEAR2 teacher asked for “A third year chemistry session.” Both groups want additional follow-up opportunities and access to the materials through a web page. Thus, in addition to offering high-quality professional development during the summer, the project leadership might want to pursue additional funding that would support efforts to extend their dissemination of materials and communication with the Modeling community. There appears to be a great need for such ongoing support that goes beyond the scope of the current Modeling Workshops.
Modeling Workshops Annual Evaluation Report: 2009-2010 IRC (7/19/10) page 24

Appendix 1 Physical Science and Chemistry Modeling Workshops
Description of Teachers1
PHYS1 CHEM1 YEAR2 OGT TOTAL N=21 N=17 N=11 N=2 N=51 Gender
Female 52.4 58.8 72.7 100.0 60.8 Male 47.6 41.2 27.3 0.0 39.2
Race/Ethnicity White, non-Hispanic 85.7 100.0 90.9 100.0 92.2 Black, non-Hispanic 9.5 0.0 0.0 0.0 3.9 Asian/Pacific Islander 4.8 0.0 0.0 0.0 2.0 Other: Black and American Indian 0.0 0.0 9.1 0.0 2.0
Age Under 30 21.1 35.7 45.5 0.0 30.4 31-40 Years 31.6 21.4 18.2 50.0 26.1 41-50 Years 31.6 14.3 9.1 0.0 19.6 51-60 Years 15.8 21.4 18.2 50.0 19.6 Over 60 Years 0.0 7.1 9.1 0.0 4.3
Position Teacher 90.5 94.1 100.0 100.0 94.1 Special Education, Resource or Inclusion Teacher 4.8 0.0 0.0 0.0 2.0 Other: Substitute and Pre-service 4.8 5.9 0.0 0.0 3.9
Grade Level Taught Middle (7-8) 14.3 0.0 0.0 0.0 5.9 High School (9-12) 85.7 100.0 100.0 100.0 94.1
School Type Public 95.2 94.1 81.8 100.0 92.2 Private 4.8 5.9 18.2 0.0 7.8
Classroom Type Math only 4.8 0.0 0.0 0.0 2.0 Science only 90.5 100.0 100.0 100.0 96.1 Math and Science 4.8 0.0 0.0 0.0 2.0
1Percentages are based on those with valid response to item.
Modeling Workshops Annual Evaluation Report: 2009-2010 IRC (7/19/10) page 25

Appendix 1 Physical Science and Chemistry Modeling Workshops
Description of Teachers1
—Continued—
PHYS1 CHEM1 YEAR2 OGT TOTAL N=21 N=17 N=11 N=2 N=51
Years of Teaching Experience Less than 1 year 4.8 6.3 9.1 0.0 6.0 1-2 years 19.0 18.8 0.0 0.0 14.0 3-5 years 14.3 12.5 0.0 0.0 10.0 6-10 years 23.8 18.8 45.5 50.0 28.0 11-19 years 19.0 12.5 36.4 50.0 22.0 20 years or more 19.0 31.3 9.1 0.0 20.0
Years Taught at Current School Less than 1 year 19.0 6.3 9.1 0.0 12.0 1-2 years 42.9 25.0 9.1 0.0 28.0 3-5 years 14.3 31.3 18.2 0.0 20.0 6-10 years 9.5 6.3 36.4 50.0 16.0 11-19 years 9.5 25.0 27.3 50.0 20.0 20 years or more 4.8 6.3 0.0 0.0 4.0
Highest Degree Received Bachelor's Degree 36.8 21.4 18.2 50.0 28.3 Master's Degree 52.6 78.6 81.8 50.0 67.4 Doctorate 10.5 0.0 0.0 0.0 4.3
Degree Areas2 Science Education 57.1 52.9 81.8 100.0 62.7 Earth Science or Geology 14.3 5.9 18.2 0.0 11.8 Mathematics Education 0.0 0.0 0.0 0.0 0.0 Biology or life science 33.3 35.3 54.5 0.0 37.3 Physics or Physical science 33.3 5.9 45.5 50.0 27.5 Mathematics 0.0 0.0 0.0 0.0 0.0 Chemistry or biochemistry 33.3 35.3 45.5 0.0 35.3 Environmental Science 9.5 11.8 0.0 0.0 7.8 Engineering 4.8 0.0 0.0 0.0 2.0 Other 19.0 5.9 9.1 0.0 11.8
1Percentages are based on those with valid response to item. 2Total can add to more than 100 percent, as respondent could obtain degree in more than one area.
Modeling Workshops Annual Evaluation Report: 2009-2010 IRC (7/19/10) page 26

Appendix 2 Physical Science and Chemistry Modeling Workshops1
Districts Represented
Pre-survey
N=56 District County N %
Avon Lake Lorain 1 1.8 Big Walnut Delaware 4 7.1 Canton Stark 2 3.6 Central Local Schools Defiance 1 1.8 Columbus Franklin 10 17.9 Dublin Franklin 1 1.8 Henry County Henry 1 1.8 Kenton Hardin 1 1.8 London Madison 1 1.8 Mansfield Richland 1 1.8 Mason Warren 1 1.8 Mentor Lake 1 1.8 New Albany Franklin 3 5.4 Oak Hills Hamilton 1 1.8 Olentangy Delaware 6 10.7 Ontario Richland 1 1.8 Pickerington Fairfield 4 7.1 Reynoldsburg Franklin 2 3.6 Shaker Heights Cuyahoga 1 1.8 South Point Lawrence 1 1.8 South-Western Franklin 5 8.9 Whitehall Franklin 1 1.8 Worthington Franklin 1 1.8 Private - Cincinnati Hamilton 2 3.6 Private - Columbus Franklin 1 1.8 Private - Columbus Muskingum 1 1.8 Not applicable – Looking for job Not applicable 1 1.8
1Information is for all participants who completed a summer workshop.
Modeling Workshops Annual Evaluation Report: 2009-2010 IRC (7/19/10) page 27

Modeling Workshops Annual Evaluation Report: 2009-2010 IRC (7/19/10) page 28
Appendix 3 Physical Science and Chemistry Modeling Workshops
Sections of Physics, Physical Science, and Chemistry1
—Percentage Taught in 2008-2009 and 2009-2010—
TOTAL2
Pre=51, Post=37 Physics Physical Science Chemistry 2008-2009 2009-2010 2008-2009 2009-2010 2008-2009 2009-2010 None 64.7 64.9 49.0 51.4 47.1 48.6 1-2 17.6 18.9 17.6 21.6 19.6 10.8 3-4 5.9 8.1 21.6 8.1 17.6 16.2 5-6 11.8 8.1 5.9 18.9 15.7 24.3 More than 6 0.0 0.0 5.9 0.0 0.0 0.0
PHYS1 Pre=22, Post=14
Physics Physical Science Chemistry 2008-2009 2009-2010 2008-2009 2009-2010 2008-2009 2009-2010None 52.4 46.7 33.3 33.3 61.9 66.7 1-2 28.6 26.7 14.3 0.0 28.6 20.0 3-4 9.5 20.0 28.6 40.0 9.5 13.3 5-6 9.5 6.7 14.3 26.7 0.0 0.0 More than 6 0.0 0.0 9.5 0.0 0.0 0.0
CHEM1 Pre=19, Post=14
Physics Physical Science Chemistry 2008-2009 2009-2010 2008-2009 2009-2010 2008-2009 2009-2010None 94.1 84.6 76.5 69.2 17.6 23.1 1-2 5.9 15.4 11.8 7.7 17.6 0.0 3-4 0.0 0.0 5.9 7.7 23.5 23.1 5-6 0.0 0.0 0.0 15.4 41.2 53.8 More than 6 0.0 0.0 5.9 0.0 0.0 0.0
YEAR2 Pre=11, Post=8
Physics Physical Science Chemistry 2008-2009 2009-2010 2008-2009 2009-2010 2008-2009 2009-2010None 54.5 62.5 45.5 62.5 54.5 50.0 1-2 18.2 12.5 18.2 12.5 9.1 12.5 3-4 0.0 0.0 36.4 25.0 27.3 12.5 5-6 27.3 25.0 0.0 0.0 9.1 25.0
1Nonrespondents to each item were coded to having answer of “None.” 2Total includes OGT respondents (Pre=2, Post=1).

Appendix 4 Physical Science and Chemistry Modeling Workshops
Teacher Opinions and Attitudes in IRC Pre-survey and Post-survey1
Pre-survey Post-survey2
PHYS1 CHEM1 YEAR2 OGT TOTAL PHYS1 CHEM1 YEAR2 TOTAL3 N=21 N=17 N=11 N=2 N=51 N=15 N=13 N=8 N=37
a) Virtually all students can learn to think scientifically. 90.5 93.8 100.0 100.0 94.0 100.0 100.0 100.0 100.0 b) Students learn science best in classes with students of
similar abilities. 30.0 56.3 36.4 50.0 40.8 13.3 38.5 25.0 24.3*
c) I enjoy teaching science. 95.2 100.0 90.9 100.0 96.0 100.0 100.0 100.0 100.0
d) I organize my curriculum around the textbook. 28.6 31.3 9.1 0.0 24.0 6.7 23.1 0.0 10.8 e) The teacher should consistently use activities which
require students to do original thinking. 90.5 87.5 100.0 100.0 92.0 100.0 100.0 100.0 100.0
f) Teachers should know the answers to most questions students ask about science. 52.4 75.0 50.0 50.0 59.2 33.3 15.4 12.5 21.6
g) Students should never leave science class feeling confused or stuck. 38.1 31.3 9.1 0.0 28.0 6.7 7.7 12.5 8.1
h) An important issue is not whether students’ answers to any science question are correct but whether students can explain their answers.
81.0 81.3 72.7 100.0 80.0 100.0 76.9 87.5 89.2
i) Some people are good at science and some just are not. 19.0 18.8 0.0 0.0 14.0 20.0 15.4 12.5 16.2 j) Learning for all students is enhanced by incorporating
the contributions of different cultures. 95.2 93.8 72.7 100.0 90.0 100.0 69.2 75.0 83.8
k) Good science teachers show students the correct way to answer questions they will be tested on. 33.3 43.8 18.2 0.0 32.0 26.7 38.5 37.5 32.4
1Percent of participants who indicated that they "Strongly Agree" or "Agree" with each statement. Percentages are based on those with valid response to item. 2Statistically significant differences highlighted are between follow-up responses compared to their pre-treatment responses for participants who responded to both surveys. 3Post total includes one OGT responses. Responses for the post OGT results are not reported separately, as they represent a single individual. *Statistically significant difference with p-value < .10.
Modeling Workshops Annual Evaluation Report: 2009-2010 IRC (7/19/10) page 29

Appendix 5 Physical Science and Chemistry Modeling Workshops
School Support of Science Instruction and Teacher as a Resource1
Pre-survey Post-survey2
PHYS1 CHEM1 YEAR2 OGT TOTAL PHYS1 CHEM1 YEAR2 TOTAL3 N=21 N=17 N=11 N=2 N=51 N=15 N=13 N=8 N=37
a) Most science teachers at my school would like to use an “inquiry” style of teaching. 71.4 75.0 45.5 100.0 68.0 80.0 76.9 62.5 73.0
b) Most science teachers in my school contribute actively to making decisions about the science curriculum. 61.9 56.3 45.5 .0 54.0 60.0 76.9 62.5 67.6
c) Most science teachers in my school regularly share ideas and materials related to science instruction. 76.2 81.3 63.6 50.0 74.0 66.7 83.3 75.0 75.0
d) I regularly serve as a resource for other science teachers in my school. 71.4 62.5 72.7 100.0 70.0 66.7 69.2 100.0 75.7
e) I regularly serve as a resource for other science teachers in my district. 38.1 31.3 27.3 .0 32.0 33.3 53.8 25.0 37.8
f) My principal is supportive of innovative approaches to teaching science. 81.0 68.8 81.8 50.0 76.0 80.0 84.6 75.0 78.4
1Percent of participants who indicated that they "Strongly Agree" or "Agree" with each statement. Percentages are based on those with valid response to item. 2There were no statistically significant differences between follow-up responses compared to their pre-treatment responses for participants who responded to both surveys. 3Post total includes one OGT responses. Responses for the post OGT results are not reported separately, as they represent a single individual.
Modeling Workshops Annual Evaluation Report: 2009-2010 IRC (7/19/10) page 30

Appendix 6 Physical Science and Chemistry Modeling Workshops
Teacher Opinions and Attitudes in OBR Pre-survey and Post-survey 1
Pre-survey Post-survey2
PHYS1 CHEM1 YEAR2 OGT TOTAL PHYS1 CHEM1 YEAR2 TOTAL3
N=21 N=17 N=11 N=2 N=51 N=15 N=13 N=8 N=37
a) I have a good understanding of fundamental core content in my discipline. 85.7 100.0 90.9 100.0 92.2 100.0 100.0 100.0 100.0
b) I have a good understanding of relating classroom activities to Ohio’s Academic Standards. 81.0 88.2 90.9 100.0 86.3 100.0 92.3 100.0 97.3
c) I have a good understanding of authentic assessment methods used to measure student performance. 81.0 82.4 90.9 100.0 84.3 85.7 84.6 100.0 88.9
d) I have a good understanding of effective questioning techniques and its use in the classroom. 81.0 76.5 63.6 100.0 76.5 100.0 92.3 87.5 94.6
e) I have a good understanding of the methods necessary to teach math and/or science concepts effectively. 81.0 88.2 81.8 100.0 84.3 93.3 100.0 100.0 97.3
f) I believe I am an effective teacher. 90.5 93.8 90.9 100.0 92.0 100.0 92.3 100.0 97.3
g) I am excited about teaching in my subject area. 90.5 100.0 81.8 100.0 92.2 100.0 100.0 100.0 100.0 h) I am interested in networking with teachers and other
professionals. 95.2 100.0 90.9 100.0 96.1 93.3 100.0 100.0 97.2
1Percent of participants who indicated that they "Strongly Agree" or "Agree" with each statement. Percentages are based on those with valid response to item. 2There were no statistically significant differences between follow-up responses compared to their pre-treatment responses for participants who responded to both surveys. 3Post total includes one OGT responses. Responses for the post OGT results are not reported separately, as they represent a single individual.
Modeling Workshops Annual Evaluation Report: 2009-2010 IRC (7/19/10) page 31

Appendix 7 Physical Science and Chemistry Modeling Workshops
Teacher Classroom Practices in OBR Pre-survey in IRC Pre-survey and Post-survey1
Pre-survey Post-survey2
PHYS1 CHEM1 YEAR2 OGT TOTAL PHYS1 CHEM1 YEAR2 TOTAL3 N=21 N=17 N=11 N=2 N=51 N=15 N=13 N=8 N=37
a) Classroom interaction involves a dialogue among teacher and students. 70.0 64.7 70.0 100.0 69.4 93.3 76.9 62.5 81.1
b) Students generally work independently. 0.0 11.8 0.0 0.0 3.9 0.0 15.4 0.0 8.1 c) Instruction emphasizes broad coverage of information
with little depth. 14.3 17.6 9.1 0.0 13.7 6.7 7.7 12.5 8.1
d) Student role is to apply inquiry and problem solving skills to discover solutions to problems. 71.4 64.7 72.7 100.0 70.6 86.7 69.2 62.5 75.7
e) Students generally learn concepts and processes through readings, lectures, and demonstrations. 4.8 5.9 0.0 0.0 3.9 0.0 7.7 0.0 2.7
f) I find it difficult to encourage the efforts and contributions of certain students or groups of students. 4.8 11.8 9.1 0.0 7.8 13.3 15.4 12.5 13.5
g) I generally assess students’ progress using alternative methods (e.g., open-response questions, hands-on performance, portfolios, observation).
42.9 17.6 18.2 50.0 29.4 46.7 23.1 12.5 29.7
1Percent of participants who indicated that the specified classroom teaching approach was a close match (value of 4 or 5) with their position. Percentages are based on those with valid response to item.
2There were no statistically significant differences between follow-up responses compared to their pre-treatment responses for participants who responded to both surveys. 3Post total includes one OGT responses. Responses for the post OGT results are not reported separately, as they represent a single individual.
Modeling Workshops Annual Evaluation Report: 2009-2010 IRC (7/19/10) page 32

Appendix 8 Physical Science and Chemistry Modeling Workshops
Opinions about Preparedness in IRC Pre-survey and Post-survey 1
Pre-survey Post-survey2
PHYS1 CHEM1 YEAR2 OGT TOTAL PHYS1 CHEM1 YEAR2 TOTAL3 N=21 N=17 N=11 N=2 N=51 N=15 N=13 N=8 N=37
a) Manage a class of students who are using hands-on/manipulative materials. 81.0 86.7 100.0 100.0 87.8 93.3 92.3 100.0 94.6
b) Use cooperative learning groups. 81.0 60.0 90.9 100.0 77.6 93.3 92.3* 87.5 91.9
c) Implement inquiry or discovery learning. 57.1 60.0 90.9 100.0 67.3 93.3 92.3** 87.5 91.9***
d) Present the applications of science concepts. 66.7 66.7 81.8 100.0 71.4 93.3 84.6 100.0 91.9 e) Phrase questions to encourage more open-ended
investigations. 61.9 53.3 54.5 100.0 59.2 93.3 84.6 75.0 86.5
f) Use science equipment as an integral part of science instruction. 75.0 73.3 81.8 100.0 77.1 100.0* 84.6 100.0 94.6*
g) Teach groups that are heterogeneous in ability. 75.0 66.7 45.5 50.0 64.6 86.7 92.3 87.5 89.2*
h) Teach students from a variety of cultural backgrounds. 80.0 53.3 54.5 50.0 64.6 80.0 76.9 75.0 75.7
i) Inform students of career opportunities in science. 70.0 60.0 63.6 0.0 63.8 100.0** 61.5 62.5 78.4*
j) Use performance-based assessment in science. 55.0 46.7 45.5 100.0 52.1 86.7** 84.6** 62.5 78.4***
k) Use portfolios to assess student progress in science. 35.0 26.7 9.1 0.0 25.0 66.7 23.1 0.0 37.8*
l) Encourage participation of females in science. 90.0 80.0 72.7 50.0 81.3 93.3 92.3 75.0 89.2 m) Encourage participation of underrepresented minorities
in science. 80.0 60.0 54.5 50.0 66.7 86.7 92.3 37.5 78.4
1Percent of participants who indicated “Very Well Prepared” or “Prepared but Want More.” Percentages are based on those with valid response to item. 2Statistically significant differences highlighted are between follow-up responses compared to their pre-treatment responses for participants who responded to both surveys. 3Post total includes one OGT responses. Responses for the post OGT results are not reported separately, as they represent a single individual. *Statistically significant difference with p-value < .10. **Statistically significant difference with p-value < .05. ***Statistically significant difference with p-value < .01.
Modeling Workshops Annual Evaluation Report: 2009-2010 IRC (7/19/10) page 33

Modeling Workshops Annual Evaluation Report: 2009-2010 IRC (7/19/10) page 34
Appendix 9 Physical Science and Chemistry Modeling Workshops
Weekly Classroom Activities in IRC Pre-survey and Post-survey 1
Pre-survey Post-survey2
PHYS1 CHEM1 YEAR2 OGT TOTAL PHYS1 CHEM1 YEAR2 TOTAL3 N=21 N=17 N=11 N=2 N=51 N=15 N=13 N=8 N=37
a) Listen and take notes during presentation by teacher 73.7 78.6 72.7 50.0 73.9 46.7 76.9 75.0 62.2
b) Watch the teacher demonstrate a scientific principle 50.0 57.1 45.5 50.0 51.1 60.0 53.8 37.5 54.1
c) Work in pairs/teams/small groups 95.0 92.9 100.0 100.0 95.7 100.0 100.0 100.0 100.0
d) Read a science textbook 55.0 50.0 18.2 0.0 42.6 20.0 23.1 25.0 21.6 e) Participate in dialogue with the teacher to develop an
idea 70.0 78.6 81.8 100.0 76.6 80.0 76.9 75.0 78.4
f) Make conjectures and explore possible methods to solve a scientific problem 35.0 42.9 81.8 100.0 51.1 60.0 46.2 87.5 62.2
g) Do hands-on/manipulative activities 85.0 85.7 100.0 100.0 89.4 86.7 84.6 100.0 89.2 h) Write their reasoning about how to solve a scientific
problem 30.0 50.0 63.6 50.0 44.7 53.3 53.8 75.0 59.5
i) Learn by inquiry 50.0 35.7 72.7 100.0 53.2 78.6 53.8 87.5 72.2
j) Use worksheets from textbooks 50.0 50.0 18.2 .0 40.4 20.0 23.1 12.5 18.9
k) Use teacher-created lessons 95.0 84.6 100.0 100.0 93.5 93.3 100.0 100.0 97.3 l) Engage in reflective thinking/writing about what they are
learning 45.0 35.7 36.4 .0 38.3 40.0 61.5 25.0 43.2
m) Use science equipment (e.g., measurement tools and graphing calculators) 75.0 85.7 81.8 100.0 80.9 80.0 76.9 100.0 83.8
1Self-report by teacher indicating that activity occurred “Once or twice a week” or “Almost daily.” There was no missing data for this set of items. 2There were no statistically significant differences between follow-up responses compared to their pre-treatment responses for participants who responded to both surveys. 3Post total includes one OGT responses. Responses for the post OGT results are not reported separately, as they represent a single individual.

Appendix 10 Physical Science and Chemistry Modeling Workshops
Impact of the Workshops1
End of Workshop Survey PHYS1 CHEM1 YEAR2 OGT TOTAL
N=21 N=18 N=14 N=3 N=56 a) Adequate time was allowed for participants to reflect
on and relate material to their experience and needs. 100.0 100.0 92.9 100.0 98.2
b) Participants’ questions and concerns were addressed effectively. 100.0 100.0 100.0 100.0 100.0
c) I improved my content knowledge. 100.0 94.4 78.6 100.0 92.9
d) I gained skills in complex thinking and reasoning. 100.0 100.0 78.6 66.7 92.9
e) I gained skills in how to use inquiry in my classroom. 100.0 100.0 85.7 100.0 96.4 f) This workshop contributed positively to my attitude
about science. 100.0 100.0 78.6 100.0 94.6
g) This workshop enhanced my confidence in teaching science. 100.0 100.0 92.9 100.0 98.2
h) I increased my ability to see connections among science concepts. 100.0 100.0 100.0 100.0 100.0
i) I increased my ability to see connections between science and mathematics. 95.2 94.4 71.4 100.0 89.3
j) I have a better understanding of how to apply the science standards. 95.2 61.1 64.3 100.0 76.8
k) Overall, this workshop was a successful professional development experience. 100.0 100.0 100.0 100.0 100.0
l) I would recommend this workshop to other teachers. 100.0 100.0 100.0 100.0 100.0 m) I feel prepared to provide professional development
on the covered workshop-specific activities for teachers in my building.
85.7 61.1 71.4 100.0 75.0
n) I feel better prepared to encourage science activities in my building. 100.0 88.9 100.0 100.0 96.4
o) This workshop has helped me become a more effective teacher. 95.2 100.0 100.0 100.0 98.2
p) Year 2 Workshop Only: The amount of guidance/structure was appropriate. NA NA 78.6 100.0 81.3
1Percent of participants who indicated that they "Strongly Agree" or "Agree" with each statement. Percentages are based on those with valid response to item.
Modeling Workshops Annual Evaluation Report: 2009-2010 IRC (7/19/10) page 35

Appendix 11 Physical Science and Chemistry Modeling Workshops
Increased Understanding from the Workshops1
—Questions Ordered by Appearance on Survey—
End of Workshop Survey PHYS1 CHEM1 YEAR2 OGT TOTAL
N=21 N=18 N=14 N=3 N=56 a) Effective applications of inquiry-based instruction in
classrooms. 100.0 94.1 92.9 100.0 96.3
b) Strategies that can be used to improve students’ science performance. 100.0 94.1 100.0 100.0 98.1
c) Application of Ohio’s science standards. 80.0 88.2 64.3 100.0 79.2 d) The technology required for effective instruction in
science. 95.2 70.6 92.9 100.0 87.0
e) Effective uses of alternative assessment. 90.5 76.5 85.7 100.0 85.2 f) Strategies for facilitating change in science instruction
in my building. 85.7 82.4 64.3 100.0 79.6
g) Awareness of current research in science education. 95.2 94.1 64.3 100.0 87.0 h) Ability to utilize current research in science education
in my classes. 95.2 94.1 64.3 100.0 87.0
1Percent of participants who indicated that they "Strongly Agree" or "Agree" with each statement. Percentages are based on those with valid response to item.
Modeling Workshops Annual Evaluation Report: 2009-2010 IRC (7/19/10) page 36

Modeling Workshops Annual Evaluation Report: 2009-2010 IRC (7/19/10) page 37
Appendix 12 Physical Science and Chemistry Modeling Workshops
Workshop Activities Rated Worthwhile1
—Questions Ordered by Appearance on Survey—
End of Workshop Survey PHYS1 CHEM1 YEAR2 OGT TOTAL
N=21 N=18 N=14 N=3 N=56
a) Overall interaction with the other participants. 100.0 100.0 100.0 66.7 98.2
b) Overall interaction with workshop facilitators. 100.0 100.0 100.0 66.7 98.2
c) Modeling of inquiry. 100.0 100.0 92.3 100.0 98.2
d) Examples on how to apply district standards. 75.0 87.5 41.7 100.0 72.5 e) Introduction to various sources of curriculum
materials (books, websites, etc.). 90.5 94.4 84.6 66.7 89.1
f) Reading assignments (research articles). 95.2 88.9 76.9 NA 86.8
g) Discussion of reading assignments. 90.5 94.4 84.6 NA 88.7
h) Purchase of educational/classroom materials. 95.0 100.0 100.0 NA 96.0 i) Year 2 Workshop Only: Large blocks of "free" time
spent working on curriculum. NA NA 92.3 100.0 93.3
1Percent of participants who rated each aspect as “Very Worthwhile” or “Somewhat Worthwhile.” Percentages are based on those with valid response to item.

Appendix 13 Physical Science and Chemistry Modeling Workshops
Better Understanding of Modeling/Discipline and Improved Student Performance1
—Full Results—
End of Workshop Survey Post-survey2
PHYS1 CHEM1 YEAR2 OGT TOTAL PHYS1 CHEM1 YEAR2 TOTAL3 N=21 N=17 N=11 N=2 N=51 N=15 N=13 N=8 N=37
a) Better understanding of how to teach physics effectively. 100.0 NA NA NA 100.0 93.3 60.0 NA 85.0
b) Better understanding of how to teach physical science effectively. 100.0 NA NA NA 100.0 92.3 66.7 NA 84.2
c) Better understanding of how to teach chemistry effectively. NA 100.0 NA NA 100.0 55.6 92.3 NA 77.3
d) Improve student performance in physics. 95.0 NA NA NA 95.0 76.9 66.7 NA 75.0
e) Improve student performance in physical science. 100.0 NA NA NA 100.0 76.9 60.0 NA 72.2
f) Improve student performance in chemistry. NA 100.0 NA NA 100.0 37.5 91.7 NA 70.0 g) Better understanding of how to use modeling in my
classes. NA NA 100.0 NA 100.0 NA NA 100.0 100.0
h) Improve student performance in my classes. NA NA 100.0 NA 100.0 NA NA 87.5 87.5 i) Better understanding of how to teach science concepts
on the OGT. NA NA NA 100.0 100.0 NA NA NA NA
j) Improve student performance on the OGT science test. NA NA NA 100.0 100.0 NA NA NA NA
1Percent of participants who indicated that they "Strongly Agree" or "Agree" with each statement. Percentages are based on those with valid response to item. Separate questions applied respectively to participants in each workshop.
2The total on the Post-survey in Appendix 13 included responses from all the first year participants (PHYS1 and CHEM1) to the questions about physics, physical science, and chemistry. 3Post total includes one OGT responses. Responses for the post OGT results are not reported separately, as they represent a single individual.
Modeling Workshops Annual Evaluation Report: 2009-2010 IRC (7/19/10) page 38

Appendix 14 Physical Science and Chemistry Modeling Workshops
Open-ended Question Responses Post-survey
What kind of changes, if any, did you make in how you teach your science classes as a result of your Modeling Workshop experience this year?
PHYS1 Cooperative groups. White boarding/discussions.
I used many different questioning techniques to get students to defend answers and explain answers to each other.
I used white boards for students to explain lab results and for problem solving.
Incorporate more challenge activities. I use whiteboards but changed my questioning technique. Looked for the student’s to develop the understanding.
More white boarding/public demonstrations of knowledge. More questioning. More student demonstrations of knowledge by challenges.
Students were made to verbalize their answers.
Used white boarding and questioning much more, and more effectively. CHEM1
More open-ended questions. Use of whiteboards for students to expose their ideas.
More student defense of ideas, reflection in writing, and use of a lab notebook.
Not sure because I am a first year teacher, so I have nothing to compare it to. Also, I took the chemistry workshop, and I teach physical science so I have not been able to use very much of the chemistry concepts because we are just now doing them at the end of the year.
Use modeling lessons. Whiteboards. More labs/demos.
Use of whiteboard presentations by students (with homework and lab material).
Modeling Workshops Annual Evaluation Report: 2009-2010 IRC (7/19/10) page 39

Appendix 14 Physical Science and Chemistry Modeling Workshops
Open-ended Question Responses Post-survey
—Continued— Are there any modifications that you would recommend be made to the follow-up sessions?
PHYS1 Add Biology when possible.
It appeared as though some of the second year presenters were not ready to present today. That was hard to see given the effect to make it there in this session.
Start later: 8:45 maybe!
Topics in advance maybe. CHEM1
First two sessions were most useful; speakers on last day with mass audience not as useful.
I would like to start at 8:30 rather than 8:00 a.m. Centering around specific topics is good. (And soliciting topics in advance by e-mails also good).
If they could be shorter and we could move through the material faster, that would be better. Thanks for the food.
None really, maybe email out an agenda.
Not particularly, except have higher quality presenters on content or approaches.
Spend more time on new materials. The material covered was helpful, but I wanted/needed more time to feel comfortable. Focus the workshops on grade-level (focus on high school chemistry or AP chemistry vs. middle school).
Start later. More guest speakers.
Modeling Workshops Annual Evaluation Report: 2009-2010 IRC (7/19/10) page 40

Modeling Workshops Annual Evaluation Report: 2009-2010 IRC (7/19/10) page 41
Appendix 14 Physical Science and Chemistry Modeling Workshops
Open-ended Question Responses Post-survey
—Continued— What kinds of activities or other support would help you continue your Modeling development? Please specify whether these should occur during the school year or in subsequent summers.
PHYS1 Follow up workshops of 1-2 days or 3-5 days. Three weeks is a long time for the initial
workshop. I wanted to cover more content like we did in the summer.
I would like to see others in our school attend so that we can work together to redesign our curriculum.
Observation of classroom where modeling has been used for a while.
There should be emphasis on all aspects of the science content of a course not only the select few topics. Three weeks is long time to deliver 5-6 content topics. Most of the topics delivered in the workshop were the topics on FCI. It was like teaching to the test. Yes, the workshop is good, but the time is not used effectively. Three weeks of time for any workshop is way too much. It should be one week at a time at the most.
This will be difficult because of time restraints. So much to do…so little time. I guess summer would be easier to get together with members of the group to discuss what we did this year.
CHEM1 Access (easier) to materials from other teachers, etc. I am the only teacher at my school doing
modeling and so being able to utilize a network of colleagues would be helpful. More follow-up or review times both during the school year and in the summer. Continuation of the workshops so other teachers can get and remain involved.
Current support has worked well for me. This is my 3rd course. Follow-up sessions that were a shorter time commitment. Perhaps NOT always on Saturday.
It would be ideal if I had more of my co-workers involved. That day-to-day interaction involving modeling would be best.
Keeping contacts and resources up to date.
Modeling toward a college-level curriculum example (AP chemistry).
Web site more user friendly.
YEAR2 A follow up to Year 1 that would allow me to see the circular motion and momentum event.
Follow-ups for people who have gone through the 2nd year workshop to see who has continued to develop new materials/units.
Having another modeling workshop for other physics topics. Perhaps going into electricity, magnetism, astronomy, optics, relative motion, etc. The workshops work very well over the summer.
I need help changing the material to fit the needs of freshmen.
Modeling alumni workshops—one day in the summer.