modeling flow and pesticide transport through surface
TRANSCRIPT
Presented by:
Modeling flow and pesticide transport through surface water diversions in the California Central Valley
Lauren Padilla, Stone Environmental Inc. Michael Winchell, Stone Environmental Inc.
Natalia Peranginangin, Syngenta Crop Protection, LLC July 19, 2013

Modeling Goal and Challenges
Background: Agriculturally intensive Central Valley Region in California with need to control pests drains to the California Bay-Delta
Goal: Characterize pesticide concentrations in the Delta
Challenges: Modeling the many surface water diversions in and around Delta that have major effects on flow rates and pesticide concentrations

California Bay-Delta Watershed
Drainage area includes entire Central Valley
Intensive agricultural region
Surface water diverted hundreds of miles
− Delta Mendota Canal
− California Aqueduct

Central Valley Surface Water Diversions
Flood control structures
Irrigation canals
Pumping stations
Merced ID Main Canal Diversion
CVP Jones Pumping Plant
Tisdale Weir

Central Valley Surface Water Diversions
Time-varying
High flow rates
Lack temporal patterns
Sacramento River
Tisdale Spillage
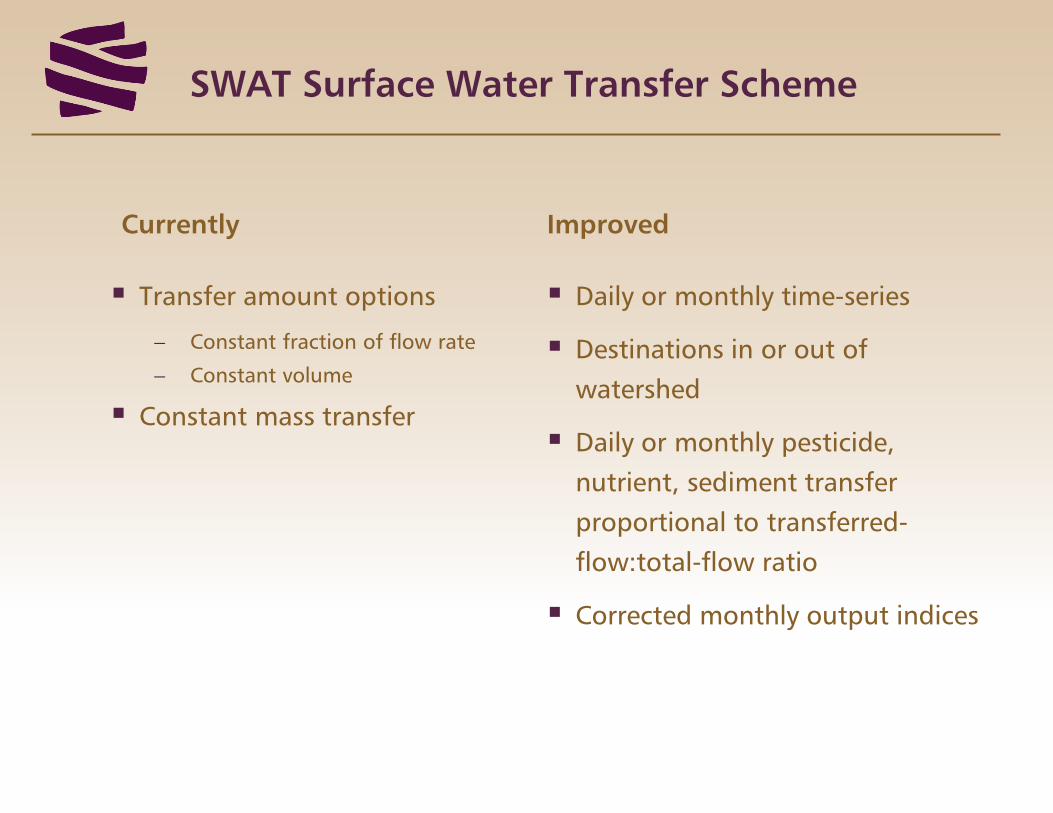
SWAT Surface Water Transfer Scheme
Transfer amount options
− Constant fraction of flow rate
− Constant volume
Constant mass transfer
Daily or monthly time-series
Destinations in or out of watershed
Daily or monthly pesticide, nutrient, sediment transfer proportional to transferred-flow:total-flow ratio
Corrected monthly output indices
Currently
Improved
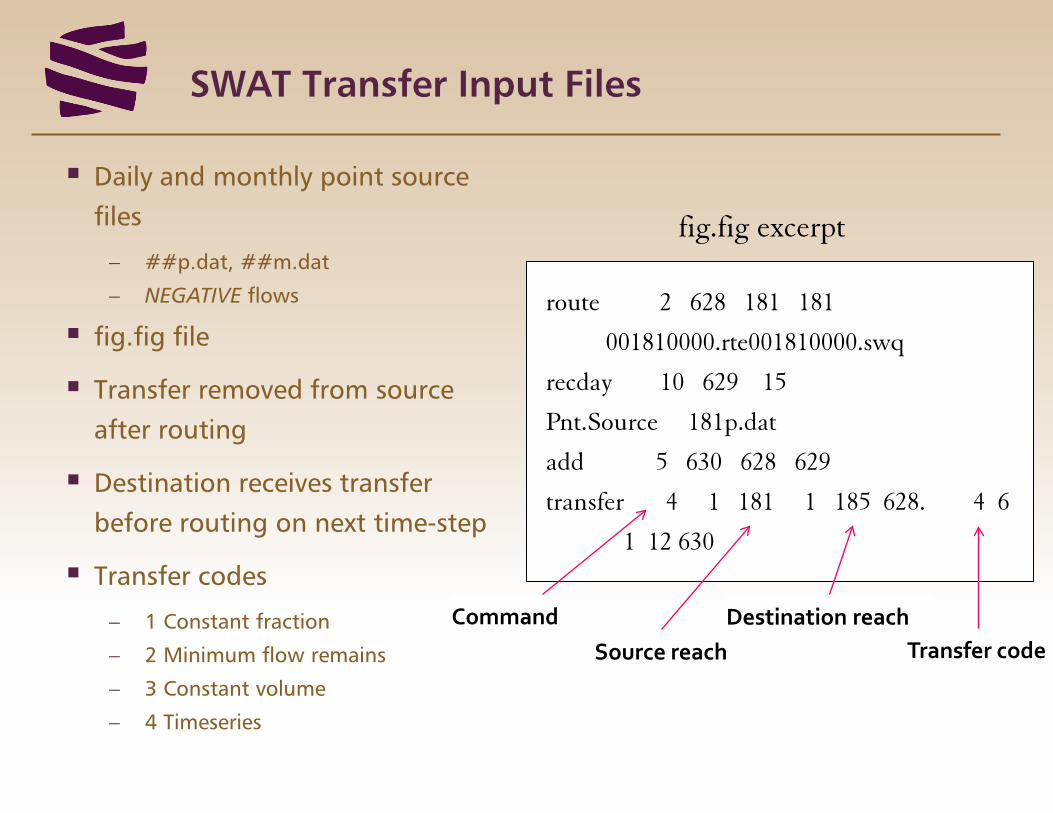
SWAT Transfer Input Files
Daily and monthly point source files
− ##p.dat, ##m.dat
− NEGATIVE flows
fig.fig file
Transfer removed from source after routing
Destination receives transfer before routing on next time-step
Transfer codes
− 1 Constant fraction
− 2 Minimum flow remains
− 3 Constant volume
− 4 Timeseries
route 2 628 181 181
001810000.rte001810000.swq
recday 10 629 15
Pnt.Source 181p.dat
add 5 630 628 629
transfer 4 1 181 1 185 628. 4 6
1 12 630
fig.fig excerpt
Command Source reach
Destination reach Transfer code

California Central Valley SWAT Model
Topography: 30-m NHDPlus V2 Hydrologically Conditioned DEM
Soils Data: Soil Survey Geographic database, 1:25,000 scale
Land Use Data: Cropland Data Layer (CDL), 30-m, multiple crop classes
344 Subbasins
− Average 140 km2 (1000 - .01 km2)
− 37,041 HRUs
24 Point Source Inlets
− Drain 26,300 square miles or 40% of watershed area
− 30-year daily average time-series
− US Geological Survey gage data

Modeled Diversions – Daily time-step
Weirs and Channels
− Moulton, Colusa, Tisdale Weir transfers to Sutter Bypass
− Fremont, Sacramento Weirs to Yolo Bypass
− Delta Cross Channel connection to Mokelumne River
− Little Potato Slough connection to San Joaquin River
− All returned to watershed
Pumping Plants
− Central Valley Project Jones Pumping Plant to Delta-Mendota Canal
− State Water Project Banks Pumping Plant to CA Aqueduct
− Contra-Costa Canal
− All exported out of watershed
Daily Datasets
− US Geological Survey, DAYFLOW
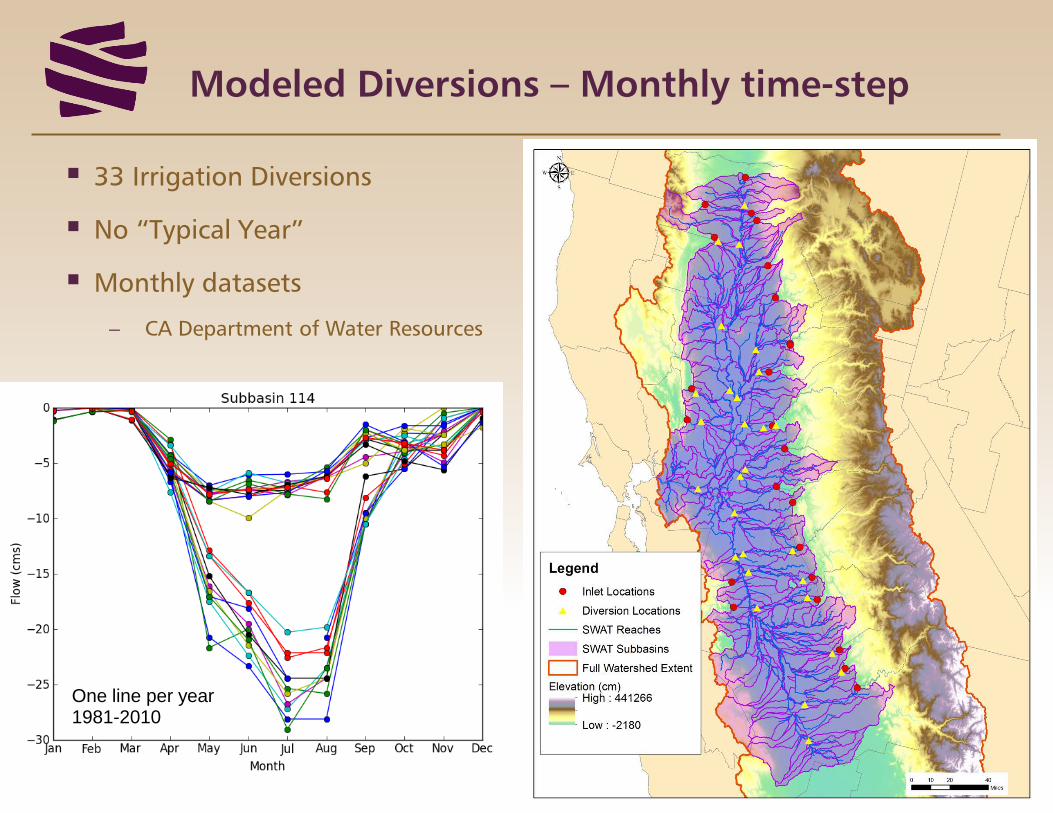
Modeled Diversions – Monthly time-step
33 Irrigation Diversions
No “Typical Year”
Monthly datasets
− CA Department of Water Resources
One line per year 1981-2010

Estimation of Missing Data
Few days to few years of missing observations
Estimation strategies
− Linear interpolation
− Average or similar year
Middle River Monthly Average Flow Rate
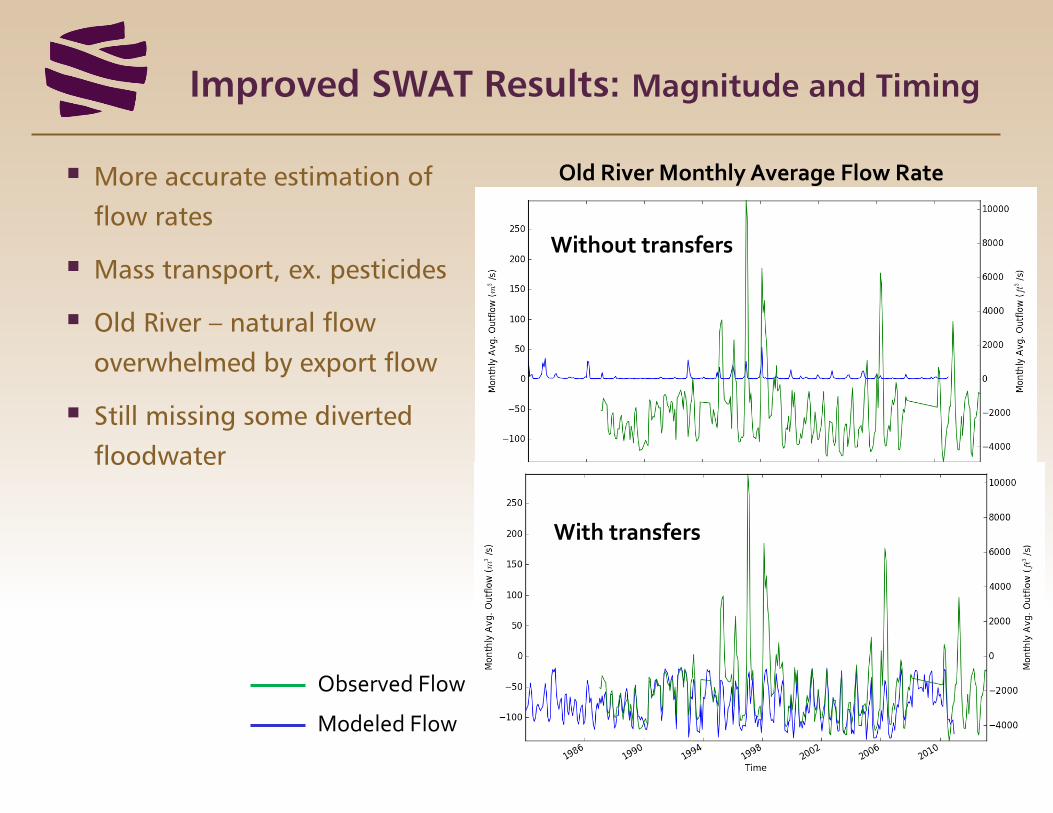
Improved SWAT Results: Magnitude and Timing
More accurate estimation of flow rates
Mass transport, ex. pesticides
Old River – natural flow overwhelmed by export flow
Still missing some diverted floodwater
Old River Monthly Average Flow Rate
Without transfers
With transfers
Observed Flow
Modeled Flow

Improved SWAT Results: Spatial Extent
Improved spatial distribution of pesticide mass
Natural flow would move San Joaquin County mass toward San Joaquin River
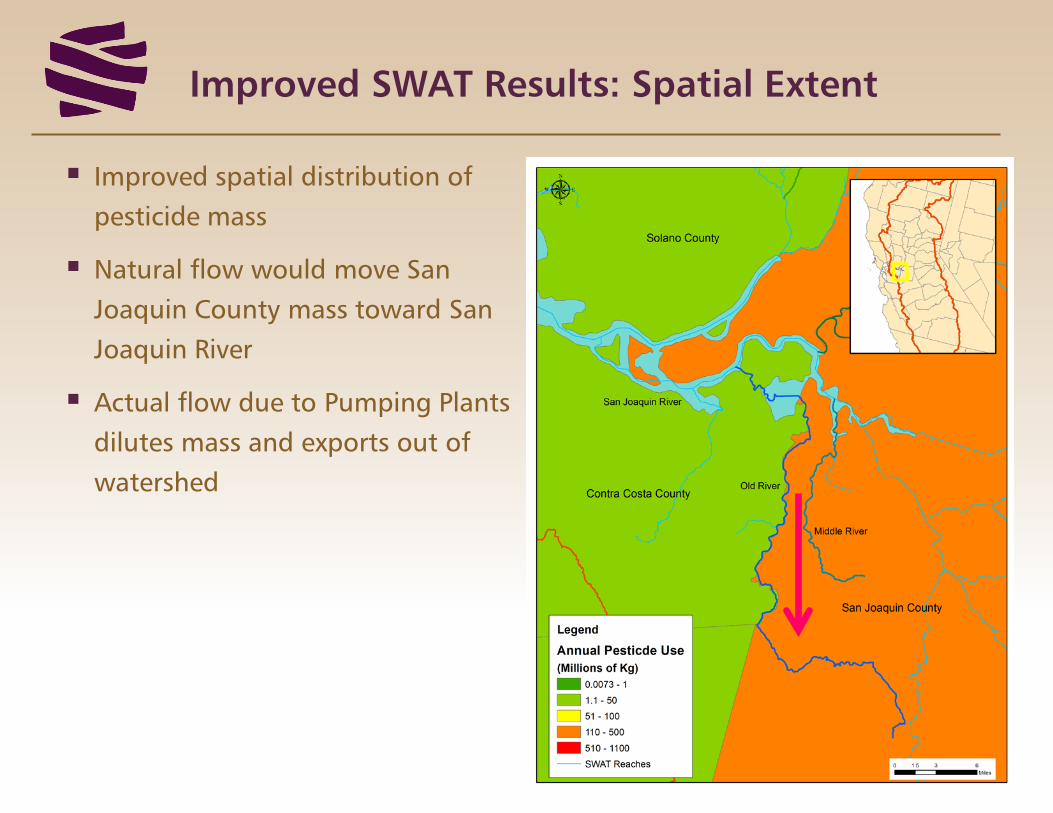
Improved SWAT Results: Spatial Extent
Improved spatial distribution of pesticide mass
Natural flow would move San Joaquin County mass toward San Joaquin River
Actual flow due to Pumping Plants dilutes mass and exports out of watershed

Improved SWAT Results: Calibration
Better model calibration
Avoids compensating for transfer error with calibration parameters
Observed Flow
Modeled Flow
Without transfers
With transfers
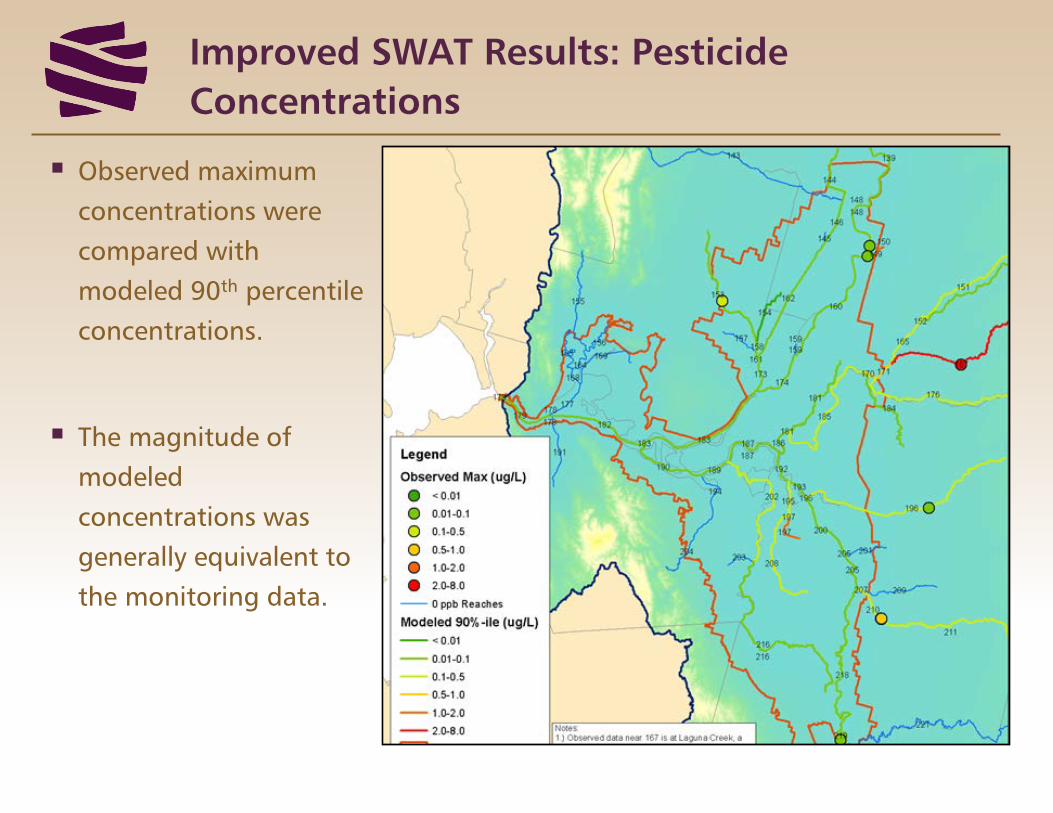
Improved SWAT Results: Pesticide Concentrations
Observed maximum concentrations were compared with modeled 90th percentile concentrations.
The magnitude of modeled concentrations was generally equivalent to the monitoring data.

Summary
Improved scheme: time-varying transfer of water, pesticide, nutrient, sediment mass
Daily or monthly options
More accurate magnitude and spatial distribution
Fig.fig and point source input files
Useful in large watersheds like Central Valley with many engineering controls on surface water
However, not a dynamic model – only as good as input data
Flooded Yolo Bypass
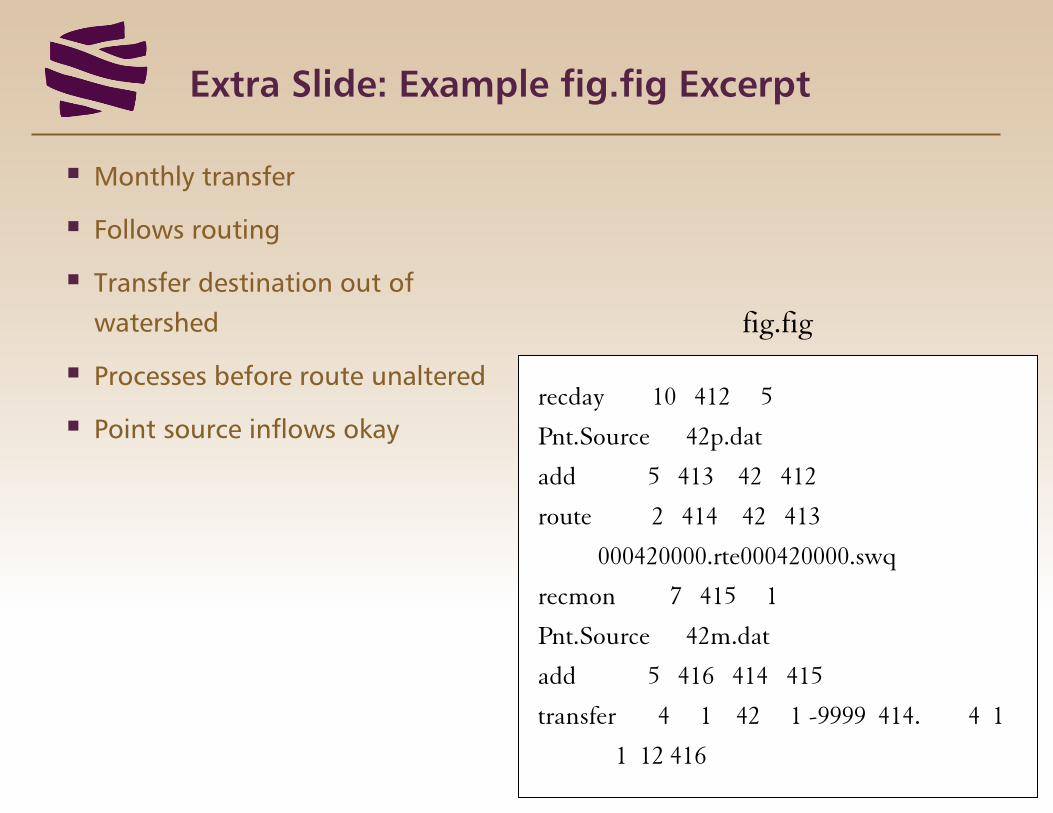
Extra Slide: Example fig.fig Excerpt
Monthly transfer
Follows routing
Transfer destination out of watershed
Processes before route unaltered
Point source inflows okay recday 10 412 5
Pnt.Source 42p.dat
add 5 413 42 412
route 2 414 42 413
000420000.rte000420000.swq
recmon 7 415 1
Pnt.Source 42m.dat
add 5 416 414 415
transfer 4 1 42 1 -9999 414. 4 1
1 12 416
fig.fig