modeling cumulative arm fatigue in mid-air interaction based on perceived exertion · pdf...
TRANSCRIPT

Modeling Cumulative Arm Fatigue in Mid-Air Interactionbased on Perceived Exertion and Kinetics of Arm Motion
1Sujin Jang, 2Wolfgang Stuerzlinger, 3Satyajit Ambike, 1Karthik Ramani∗1School of Mechanical Engineering and3Department of Health and Kinesiology
Purdue University, West Lafayatte, IN, USA{jang64, ramani, sambike}@purdue.edu
2School of Interactive Arts + TechnologySimon Fraser University
Vancouver, [email protected]
ABSTRACTQuantifying cumulative arm muscle fatigue is a critical factorin understanding, evaluating, and optimizing user experienceduring prolonged mid-air interaction. A reasonably accurateestimation of fatigue requires an estimate of an individual’sstrength. However, there is no easy-to-access method to mea-sure individual strength to accommodate inter-individual dif-ferences. Furthermore, fatigue is influenced by both psycho-logical and physiological factors, but no current HCI modelprovides good estimates of cumulative subjective fatigue.We present a new, simple method to estimate the maximumshoulder torque through a mid-air pointing task, which agreeswith direct strength measurements. We then introduce a cu-mulative fatigue model informed by subjective and biome-chanical measures. We evaluate the performance of the modelin estimating cumulative subjective fatigue in mid-air interac-tion by performing multiple cross-validations and a compar-ison with an existing fatigue metric. Finally, we discuss thepotential of our approach for real-time evaluation of subjec-tive fatigue as well as future challenges.
Author KeywordsMid-air interaction; perceived exertion; cumulative fatiguemodel; maximum arm strength; biomechanical arm model.
ACM Classification KeywordsH.5.2. Information Interfaces and Presentation (e.g. HCI):User Interfaces
INTRODUCTIONRecent advances in sensing technologies have produced low-cost human motion tracking methods (e.g., MS Kinect, LeapMotion), and these methods are being leveraged to study andadopt natural human motion for the design of mid-air inter-actions in various environments (e.g., AR/VR [37, 40], med-ical operations [36], gaming [33], and virtual design [54]).Physical ergonomics is an important design factor for mid-air interaction [8, 26, 30]. In particular, arm fatigue – the∗School of Electrical and Computer Engineering (by courtesy)
Permission to make digital or hard copies of all or part of this work for personal orclassroom use is granted without fee provided that copies are not made or distributedfor profit or commercial advantage and that copies bear this notice and the full cita-tion on the first page. Copyrights for components of this work owned by others thanACM must be honored. Abstracting with credit is permitted. To copy otherwise, or re-publish, to post on servers or to redistribute to lists, requires prior specific permissionand/or a fee. Request permissions from [email protected] 2017, May 6-11, 2017, Denver, CO, USA.Copyright c© 2017 ACM ISBN 978-1-4503-4655-9/17/05 ...$15.00.http://dx.doi.org/10.1145/3025453.3025523
so-called “Gorilla arm” effect [2] – is known to negativelyimpact user experience and hamper prolonged use of mid-airinterfaces. Fatigue is a complex phenomenon defined as thedecline in maximal force or power capacity of muscle dueto sustained activation [20]. This means that sub-maximalforces, such as those encountered in most mid-air interac-tions, can be sustained for extended periods even as fatigueaccumulates. However, users will typically perceive the accu-mulation of fatigue (i.e., feel the arm getting heavier), and thismay negatively impact their experience. Furthermore, subjec-tive fatigue and its perceived intensity are influenced not onlyby the task demands and the individual’s current physiologi-cal state, but also by the history of the individual’s movementchoices. Consequently, models estimating the current fatigueof a user must be based on continuous measurement of the on-going interaction. Although the term “Arm fatigue” appearsin more than 300 publications in HCI over the last decade, wedo not have good predictive models of cumulative fatigue thataccount for variable and intermittent periods of interaction.
Another practical issue in quantifying muscle fatigue is themeasurement of an individual’s maximal strength. The fa-tigue rate for a given task depends on the proportion of mus-cular strength that the task consumes. Naturally, fatigue es-timation requires the quantification of an individual’s max-imal ability [19], and biomechanists typically achieve thisby recording the maximal forces (or joint torques) that thesubject can produce under isometric conditions [34, 41, 44].However, these measurements require expensive force sen-sors and specialized test rigs, making sensor-based strengthmeasurements impractical for HCI research.
Lastly, physiological and psychological human factors bothinfluence fatigue [20], and thus, user experience as well [28].To better evaluate and understand the effect of fatigue on userexperience, we need congruent models that account for bothinfluences [28, 32]. Current models to quantify fatigue aremostly informed by direct measurements of forces or phys-iological signals (e.g., movement dynamics, muscle forces),and rarely account for the perceived effect of fatigue accumu-lation. These direct measurements are invasive, require spe-cialized equipment, and therefore, are not practical for imple-mentation in HCI. Subjective fatigue evaluation (e.g., Borgscales [11]) requires no set-up and provides useful informa-tion of the user experience. However, direct verbalization andreporting is necessary, which, again interferes with the user’sinteractive experience. Thus, existing objective and subjec-tive methods for evaluating fatigue can be cumbersome andinvasive as multiple recordings are required during tasks.
Sensing and Input CHI 2017, May 6–11, 2017, Denver, CO, USA
3328

In HCI, researchers recently investigated the role of musclefatigue [7, 8, 30]. However, previous work mostly considersinstantaneous muscle contractions, and thus cannot quantifycumulative muscle fatigue. Also, previous work is informedby physical measures (e.g., muscle forces and torques), anddoes not quantify fatigue perception, which is necessary forthe accurate evaluation of user experience during interaction.
This paper addresses the above-mentioned issues in evaluat-ing cumulative arm fatigue during mid-air interaction. First,we propose a simple and effective method to estimate an in-dividual’s maximal shoulder torque using a mid-air pointingtask. We use a camera-based skeleton tracking system to cap-ture arm movements, and then compute the shoulder-jointforces and torques during the pointing task, which subjectsperform till volitional failure. Then, we use the Intensity–Endurance Time curve [41] to estimate the maximum shoul-der torque without a direct force or torque measurement. In-tensity is the ratio between the maximum and current torqueexerted at the shoulder. Endurance time (ET) is the durationof muscular exertion before the volitional failure. We validateour indirect maximum torque estimation method via compar-isons with direct measurements obtained with a force sensor.
Second, we introduce a method to quantify cumulativearm fatigue based on the three-compartment muscle model(TCM) [56]. The model allows muscle units to be in ei-ther an active (MA), fatigue (MF ), or rest (MR) state anddefines state-transition rules. This enables quantification ofcumulative fatigue when both task and rest periods appearduring interaction. By optimizing the free model parame-ters to minimize the difference between the model and user-reported estimates of perceived fatigue, we account for bothphysical and psychological processes that influence perceivedfatigue. We investigate the performance of the model in pre-dicting subjective fatigue in mid-air pointing tasks throughcross-validations and a comparison with an existing metric.
Our contributions include: (1) a simple and effective methodto estimate the maximum shoulder torque through a mid-airpointing task; (2) a cumulative fatigue model that estimatessubjective fatigue using movement kinetics measured duringongoing mid-air interaction; (3) experimental validation ofthe cumulative fatigue model for estimating subjective armfatigue; and (4) a procedure for modeling the cumulative fa-tigue that accounts for subject specificity of muscle fatigue.Below, we describe related work, techniques, experimentalmethods, and the analysis of experimental results. Our find-ings show the potential of the model in predicting subjectivefatigue in mid-air interactions. We discuss the challenges forfurther developing the model to quantify arm muscle fatiguederived from subjective and biomechanical factors.
RELATED WORKHere we review prior work related to objective and subjectiveevaluation of muscle fatigue, cumulative fatigue models, andmuscle fatigue evaluation for mid-air interactions.
Objective Fatigue EvaluationMuscle fatigue is quantified based on changes in variousphysiological quantities such as muscle activation (measured
using electromyography (EMG) [14]), intra cellular acido-sis [55], arterial oxygen [3], blood pressure [49], and heartrate [48]. Such invasive methods are impractical for HCI.
Another method uses a measurement of maximum muscularstrength. The maximum capacity of muscular exertion is de-fined as the “maximum voluntary contraction (MVC)”, and itis commonly expressed as a force (N ) or a torque (N · m).Reduction in MVC during a continuous task is considered asa reliable assessment of muscle fatigue. Biomechanists com-monly measure MVC using force sensors in specialized testrigs (e.g., [1, 29, 47]). However, such set-ups are invasive,not easily accessible, and impractical for evaluating musclefatigue during HCI tasks.
Ratings of Perceived ExertionThere are several psychometric scales commonly used forevaluating subjective fatigue such as Likert scale [13],NASA-TLX [27], VAS (visual analog signal) [9], and ratingsof perceived exertion (RPE) [12]. Such subjective evalua-tion based on the muscular sensation is also a result of phys-iological changes [4], and it should be carefully consideredin evaluating muscle fatigue. The Borg RPE scales, giventheir reproducibility and sensitivity [12], have been exten-sively used in psychological evaluation of muscle fatigue asa complement to physiological measures in various field ofresearch (e.g., sports [21], medicine [43], ergonomics [10]).Borg CR10 [12] is a categorical rating with ratio properties(0∼10 points), and it has been used to assess perceived ex-ertions in body parts such as the hand and the arm [22, 39,51]. The Borg CR10 scale uses verbal anchors and numbersto map the magnitude of exertion to a scalar invariance scale.
Several studies have shown that the Borg CR10 scaleis strongly correlated with objective measures, such asEMG [17, 53], and that it is reliable at lower levels of forceexertion (e.g., holding a weight less than 2∼3 kg [44]). Thismakes the Borg CR10 scale particularly suitable for evaluat-ing fatigue in mid-air interaction, where relatively little or noexternal load is exerted on the arms (bare-hand interactions).
Cumulative Muscle Fatigue ModelDue to the analytic complexity of describing fatigue, fewmodels are available to properly quantify muscle fatigue.The Endurance Time (ET)–Intensity curve (e.g., Rohmert’scurve [46]) has been extensively used to empirically modelthe effect of fatigue on the task endurance time in static ex-ertion tasks. Although this approach is useful in estimatingfatigue-induced ET, it cannot be used for more complex tasksinvolving dynamic load conditions or recovery during rest pe-riods. Liu et al. [38] proposed a dynamic muscle model basedon three muscle states: rest (MR), active (MA), and fatigue(MF ). However, this model has only been validated underconstant, maximum effort, and thus it is not generalizableto dynamic load conditions such as arm movements inter-spersed with rest periods. Xia et al. [56] proposed a three-compartment muscle (TCM) model by introducing a feed-back controller term between the active (MA) and rest (MR)muscle states. More recently, Frey-Law et al. [24] validatedthe TCM model in estimating ET under static load conditions,
Sensing and Input CHI 2017, May 6–11, 2017, Denver, CO, USA
3329

and obtained a set of joint-specific model parameters. Thisenables the model to predict the muscle activation states un-der various task conditions (i.e., static and dynamic load con-ditions). However, their validation was still limited to staticload conditions. Sonne et al. [50] further experimentally val-idated the performance of the TCM model in predicting fa-tigue during grasping and thumb contraction tasks by provid-ing a task-specific, optimized fatigue model.
Similarly, we optimize the TCM model for estimating shoul-der joint fatigue. Also, we optimize the model using bothsubjective fatigue ratings and movement kinematics. Onceoptimized, our model estimates previously unseen subjectivefatigue levels based only on kinematic measurements. We arenot aware of any prior work that achieves this.
Quantifying Muscle Fatigue in Mid-Air InteractionsIn HCI, there are two closely related studies on quantifyingarm fatigue during mid-air interaction. Consumed Endurance(CE) [30] is an easy-to-implement metric for estimating ETin mid-air selection tasks. The authors showed a strong cor-relation between CE and the Borg scale. Yet, CE is basedon Rohmert’s ET curve [46], which is only valid for staticload conditions, and thus CE does not consider rest and itseffect on cumulative fatigue [56]. Also, CE is assumed tobe zero at exertion levels below 15%. This controversial as-sumption [23, 41] limits use of CE for evaluating mid-air in-teraction with low exertion levels. CE also uses generic maxi-mum shoulder torque values, even though shoulder strength issubject-specific [41]. In contrast, we propose a novel methodto measure an individual’s maximum shoulder torque thatdoes not require expensive sensors, and which shows strongagreement with traditional, contact-based measurements.
Bachynsky et al. [7, 8] introduced a biomechnical simulationto evaluate muscle activation. This work showed the poten-tial of simulation-based approaches to quantify the effect offatigue on the design of touch-based and mid-air interactions.However, the simulation only considers muscle contractionsin a static optimization, and thus cannot quantify cumulativemuscle fatigue. Also, Bachynsky et al. [6] observed that theirsimulation output does not correlate well with subjective fa-tigue measures. This makes their simulation results less com-parable with our model estimates.
Unlike existing approaches, we consider cumulative arm fa-tigue involving both interaction and rest periods without lim-iting the range of exertion. Furthermore, our model quantifiesthe user’s perception of fatigue, which is likely more directlyrelated to the user experience during mid-air interaction.
ESTIMATING ARM MUSCLE FATIGUEHere we describe our method for quantifying arm fatigue byintroducing three-compartment muscle model, biomechani-cal arm model, and maximum shoulder torque estimation.
Three-Compartment Fatigue ModelWe introduce the three-compartment muscle (TCM) modelfor estimating active, rest, and fatigue muscle states (see [24,56] for more details). The TCM model assumes that the mo-tor units involved in a task can be in one of three possible
Figure 1. Three-compartment muscle (TCM) model
states: active (motor units receiving neural activation andcontributing to the current task), fatigued, (fatigued motorunits without activation), or resting (inactive motor units thatare not required for the current task). Figure 1 shows the threemuscle unit states, and the relations between them. MF (%)is the proportion, or ‘compartment’ of motor units that arecurrently in fatigued state, MA(%) is the compartment of ac-tive motor units, and MR(%) is the proportion of motor unitsat rest. Each compartment of motor states is expressed as apercentage of the maximum voluntary contraction (%MVC).Since motor-unit recruitment is binary (they are either con-tracted or not), MA = 100% indicates that all motor unitsare recruited for a MVC task. A sub-maximal task impliesMA < 100%. The three motor unit states are related as:
dMR
dt= −C(t) +R ∗MF ,
dMA
dt= C(t)− F ∗MA,
dMF
dt= F ∗MA −R ∗MF ,
where F and R, are the model parameters defining the rate atwhich active motor units are fatiguing, and the rate at whichfatigued motor units recover and enter the rest state, respec-tively, and C(t) is motor unit activation function defined as:
C(t) =
{LD(TL−MA) if MA < TL,MR > TL−MA
LDMR if MA < TL,MR ≤ TL−MA
LR(TL−MA) if MA ≥ TLwhere TL is the target load defined as a torque ratio[Tcurrent/Tmax] ∗ 100(%), LD is the muscle force develop-ment factor, and LR is the relaxation factor. The last twoparameters are set to 10 based on the sensitivity analysis byFrey-Law et al. [24].
Model FittingWe used the optimization toolbox in MATLAB to optimizethe TCM and to identify the model parameters (F and R) formid-air interaction. The pattern search method [5] was usedto minimize the root mean squared errors (RMSE) betweenthe perceived exertion (Borg scale ratings) and the size of thefatigued motor unit compartment (MF ):
minimizeF,R
√√√√ 1
n
n∑i=1
[φ(MF (i))−B(i)]2
subject to F ∈ [Flb, Fub], R ∈ [Rlb, Rub]
where n is the number of fitting data, MF (i) is the fatiguelevel estimation, B(i) is the Borg scale rating, and the up-per and lower bounds of the parameters are defined as Flb =
Sensing and Input CHI 2017, May 6–11, 2017, Denver, CO, USA
3330

Figure 2. Simulated fatigue estimates (MF ) using the TCM model with0.001 dB noise. Left: Input (TL) to the model w/ and w/o noise. Right:comparison of estimation results w/ and w/o noise.
Rlb = 0.001, Fub = 0.0182∗100, andRub = 0.00168∗100.The upper bounds are defined by multiplying the constantparameters recommended by Frey-Law et al. [24] with 100.We assume a linear relationship between the Borg scale and%MVC (proportion of current and maximum torque) basedon a review of their relationship [42]. φ(·) is a linear functionmapping the fatigue estimation MF (i) to the Borg scale. Wedefine the linear mapping as φ(x) = 0.0875∗x. This means avalue of ‘8’ in Borg CR10 scale is equivalent to 90% of MF .
Sensitivity Analysis of Fatigue EstimationSince we target the use of off-the-shelf vision-based skele-ton tracking systems (e.g., Kinect), we need to deal with thefact that such tracking is more susceptible to noise and jit-ters compared to marker-based tracking systems (e.g., Vicon,OptiTrack). Therefore, we tested the sensitivity of the TCMmodel to the presence of severe noise. Simulation results (seeFigure 2) showed that the model is relatively insensitive to jit-ters and errors in torque estimation (mean absolute error, M=1.00, SD=0.98 in %MVC).
Biomechanical Upper Limb ModelFatigue development rate is joint specific, and the shoulder fa-tigues much faster than the elbow or wrist during arm move-ments [23]. Therefore, we assume that arm fatigue is mostlyattributable to shoulder-joint fatigue, and the shoulder-jointstrength is the most relevant design-related parameter formid-air interaction.
Estimating shoulder fatigue using the TCM model requirestwo inputs: the maximum joint torque (Tmax) and the time-course of torque exerted at the joint (T (t)). Our new methodto estimate Tmax will be discussed in the next section. Herewe briefly introduce a standard procedure to measure theshoulder joint torque T (t) based on a biomechanical armmodel [15]. We model the upper limb as rigid bodies (links)connected in series by joints [45]. Figure 3 shows the modeldefined by a 4 degree-of-freedom (DOF) serial chain (shoul-der:3, elbow:1). The biomechanical arm model equations andthe Newton-Euler inverse dynamics procedure [15] to com-pute the shoulder torque (T ) are provided in the Appendix.
Estimating Maximum Shoulder TorqueTo estimate the muscle strength of users, we propose a pro-cedure where users perform a fatiguing exercise by holdinga weight in the air. This procedure eliminates the need of aforce sensor and dynamic measurements for estimating the
Figure 3. Biomechanic model of the upper limb.
maximal shoulder torque. In this isometric exercise, usersare asked to flex the shoulder and maintain the arm in thehorizontal position while holding a weight (e.g., 1.36 kg forfemale and 2.27 kg for male subjects). To guide subjects inmaintaining this posture, a simple pointing task is designed.A circular target is fixed at the same height as the shoulder,and placed in front of the body at maximum arm extension(see Figure 4(b)). The target is displayed on screen, and canonly be “touched” when the user holds the correct posture.
We compute the time course of the shoulder torque T (t)using the upper limb biomechanics model and measure theendurance time while subjects perform the isometric exer-cise. The subjects are assumed to exert constant shoul-der torque for this isometric test, and we compute the av-erage shoulder torque exerted during the exercise (Tavg).We use the equation of maximal shoulder capacity (%MVC)and endurance time (ET) experimentally derived by Math-iassen et al. [41]: ET = a ∗ exp(−b ∗ %MVC), where%MVC is the ratio of current and maximum shoulder torque(Tcurrent/Tmax ∗ 100%), and a and b are experimentally de-fined constants (40.609 and 0.097). To find the maximumtorque Tmax, we invert Mathiassen’s equation as:
Tmax =−b ∗ Tavglog(ET/a)
× 100 (1)
This yields an estimate of the the maximum shoulder torque(involving the anterior deltoid, coracobrachialis, biceps, andpectoralis major muscles). We compare this indirect measure-ment with traditional sensor-based ones in our experiments.
EXPERIMENTAL METHODSWith the two experiments described below, we validate (1) amethod to estimate maximal shoulder-joint torque using kine-matic measurements with the Kinect camera and (2) the three-compartment muscle (TCM) model for estimating cumulativeshoulder fatigue during mid-air interaction. We focus on a“virtual hand” mid-air pointing task, a fundamental mode ofinteraction in 3D user interfaces.
General SetupWe used a Microsoft Kinect sensor and the correspondingSDK to track arm movements. Data were sampled at 50
Sensing and Input CHI 2017, May 6–11, 2017, Denver, CO, USA
3331
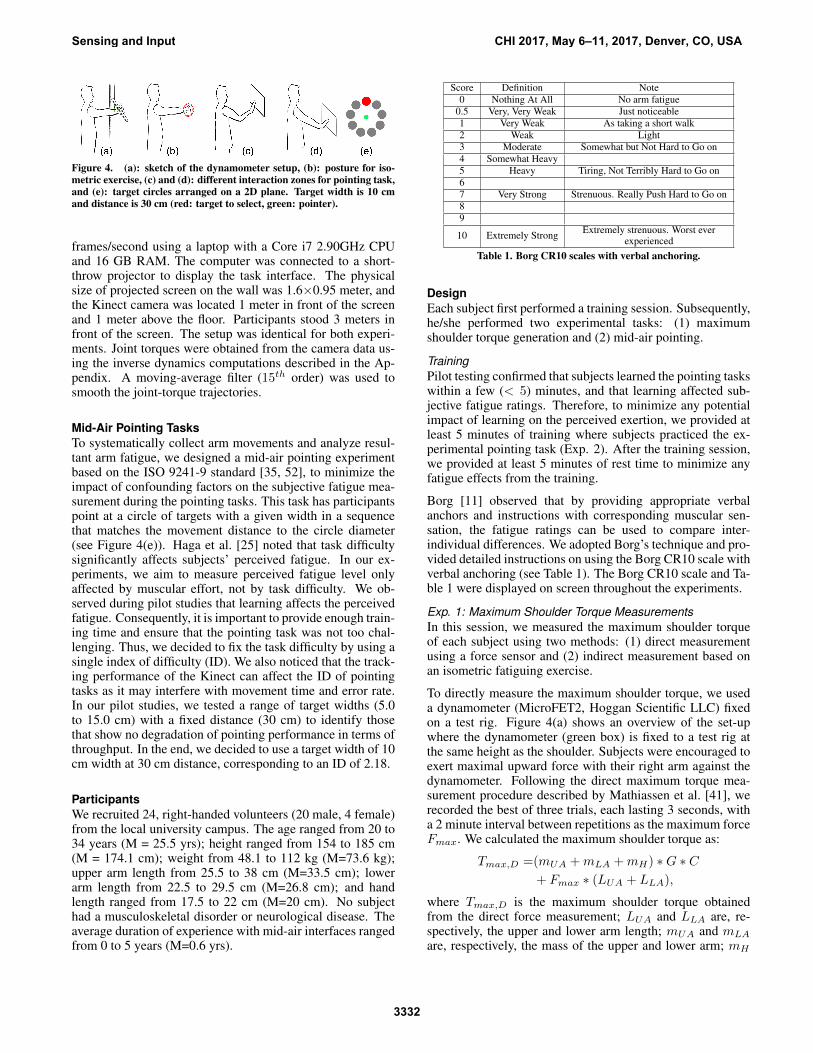
Figure 4. (a): sketch of the dynamometer setup, (b): posture for iso-metric exercise, (c) and (d): different interaction zones for pointing task,and (e): target circles arranged on a 2D plane. Target width is 10 cmand distance is 30 cm (red: target to select, green: pointer).
frames/second using a laptop with a Core i7 2.90GHz CPUand 16 GB RAM. The computer was connected to a short-throw projector to display the task interface. The physicalsize of projected screen on the wall was 1.6×0.95 meter, andthe Kinect camera was located 1 meter in front of the screenand 1 meter above the floor. Participants stood 3 meters infront of the screen. The setup was identical for both experi-ments. Joint torques were obtained from the camera data us-ing the inverse dynamics computations described in the Ap-pendix. A moving-average filter (15th order) was used tosmooth the joint-torque trajectories.
Mid-Air Pointing TasksTo systematically collect arm movements and analyze resul-tant arm fatigue, we designed a mid-air pointing experimentbased on the ISO 9241-9 standard [35, 52], to minimize theimpact of confounding factors on the subjective fatigue mea-surement during the pointing tasks. This task has participantspoint at a circle of targets with a given width in a sequencethat matches the movement distance to the circle diameter(see Figure 4(e)). Haga et al. [25] noted that task difficultysignificantly affects subjects’ perceived fatigue. In our ex-periments, we aim to measure perceived fatigue level onlyaffected by muscular effort, not by task difficulty. We ob-served during pilot studies that learning affects the perceivedfatigue. Consequently, it is important to provide enough train-ing time and ensure that the pointing task was not too chal-lenging. Thus, we decided to fix the task difficulty by using asingle index of difficulty (ID). We also noticed that the track-ing performance of the Kinect can affect the ID of pointingtasks as it may interfere with movement time and error rate.In our pilot studies, we tested a range of target widths (5.0to 15.0 cm) with a fixed distance (30 cm) to identify thosethat show no degradation of pointing performance in terms ofthroughput. In the end, we decided to use a target width of 10cm width at 30 cm distance, corresponding to an ID of 2.18.
ParticipantsWe recruited 24, right-handed volunteers (20 male, 4 female)from the local university campus. The age ranged from 20 to34 years (M = 25.5 yrs); height ranged from 154 to 185 cm(M = 174.1 cm); weight from 48.1 to 112 kg (M=73.6 kg);upper arm length from 25.5 to 38 cm (M=33.5 cm); lowerarm length from 22.5 to 29.5 cm (M=26.8 cm); and handlength ranged from 17.5 to 22 cm (M=20 cm). No subjecthad a musculoskeletal disorder or neurological disease. Theaverage duration of experience with mid-air interfaces rangedfrom 0 to 5 years (M=0.6 yrs).
Score Definition Note0 Nothing At All No arm fatigue
0.5 Very, Very Weak Just noticeable1 Very Weak As taking a short walk2 Weak Light3 Moderate Somewhat but Not Hard to Go on4 Somewhat Heavy5 Heavy Tiring, Not Terribly Hard to Go on67 Very Strong Strenuous. Really Push Hard to Go on89
10 Extremely Strong Extremely strenuous. Worst everexperienced
Table 1. Borg CR10 scales with verbal anchoring.
DesignEach subject first performed a training session. Subsequently,he/she performed two experimental tasks: (1) maximumshoulder torque generation and (2) mid-air pointing.
TrainingPilot testing confirmed that subjects learned the pointing taskswithin a few (< 5) minutes, and that learning affected sub-jective fatigue ratings. Therefore, to minimize any potentialimpact of learning on the perceived exertion, we provided atleast 5 minutes of training where subjects practiced the ex-perimental pointing task (Exp. 2). After the training session,we provided at least 5 minutes of rest time to minimize anyfatigue effects from the training.
Borg [11] observed that by providing appropriate verbalanchors and instructions with corresponding muscular sen-sation, the fatigue ratings can be used to compare inter-individual differences. We adopted Borg’s technique and pro-vided detailed instructions on using the Borg CR10 scale withverbal anchoring (see Table 1). The Borg CR10 scale and Ta-ble 1 were displayed on screen throughout the experiments.
Exp. 1: Maximum Shoulder Torque MeasurementsIn this session, we measured the maximum shoulder torqueof each subject using two methods: (1) direct measurementusing a force sensor and (2) indirect measurement based onan isometric fatiguing exercise.
To directly measure the maximum shoulder torque, we useda dynamometer (MicroFET2, Hoggan Scientific LLC) fixedon a test rig. Figure 4(a) shows an overview of the set-upwhere the dynamometer (green box) is fixed to a test rig atthe same height as the shoulder. Subjects were encouraged toexert maximal upward force with their right arm against thedynamometer. Following the direct maximum torque mea-surement procedure described by Mathiassen et al. [41], werecorded the best of three trials, each lasting 3 seconds, witha 2 minute interval between repetitions as the maximum forceFmax. We calculated the maximum shoulder torque as:
Tmax,D =(mUA +mLA +mH) ∗G ∗ C+ Fmax ∗ (LUA + LLA),
where Tmax,D is the maximum shoulder torque obtainedfrom the direct force measurement; LUA and LLA are, re-spectively, the upper and lower arm length; mUA and mLA
are, respectively, the mass of the upper and lower arm; mH
Sensing and Input CHI 2017, May 6–11, 2017, Denver, CO, USA
3332

Figure 5. Experimental protocol of pointing task. An experiment blockconsists of 1 minute of pointing task and either one of 5/10/15/20 secondsof rest, and each pointing task conditions consists of four blocks.
is the mass of the hand; G is 9.81 m/s2; and C is the distancebetween the shoulder joint and the center of mass of the arm.
In the isometric exercise, we followed the procedure of in-directly estimating maximum shoulder torque described inthe previous section. Subjects were asked to hold a weight(2.27 kg for males and 1.36 kg for females, to account for ex-pected gender-based strength differences) in their dominanthand, flex the shoulder till the arm was horizontal and main-tain this posture till failure. Subjects saw feedback of theirpointing position on screen. We measured the endurance timeas the duration between the start of the trial and when sub-jects indicated volitional failure to maintain the arm posture,or when the hand position was below the target for over 2 sec-onds. The average torque Tavg exerted by their shoulder wascomputed using inverse dynamics (see the Appendix). Thenwe obtain the indirectly measured maximum shoulder torqueTmax,I using Equation 1. During this trial, subjects were re-quired to report their current Borg rating every 20 seconds.These ratings were not utilized for further analysis, but theexercise provided the subjects with Borg rating experiencebefore the next experimental task.
Exp. 2: Mid-Air Pointing ExperimentsThe main goal of this experiment is to collect subjectivefatigue ratings and corresponding biomechanics measures.Then, we aim to generate a cumulative fatigue model that ac-curately describes the relationship between the two variables.To study this relationship in a principled way, we first needto identify what factors in the interaction design decisivelyaffect cumulative fatigue.
In prior work [30, 31] the authors observed that users getmore rapidly fatigued when their arm moves higher from itsresting position and extended further away from the body. Wechose to investigate the height of the interaction zone as anexperimental condition with a fixed range of arm extension,specifically a posture at approximately half of maximum armstretch. Rest periods are also a decisive factor contributingto cumulative fatigue: the less rest we take, the more we getfatigued. We chose to control these two variables in our studydesign directly (2×2 experiment conditions). Then we furtherinvestigate the applicability of the model for estimating sub-jective fatigue in different interaction conditions. Figure 4(e)shows the targets arranged on a 2D plane at two different lo-cations (see Figure 4(c),(d)), one at shoulder level and theother midway between the shoulder and waist.
Pilot tests revealed that if subjects perform mid-air tasks inall four conditions (i.e., at least four mid-air pointing tasks ina series), subjects had a higher chance to experience learn-ing and pre-fatigue effects. Thus, we designed our experi-
ment with rest period conditions as a between-subject fac-tor and interaction space conditions as a within-subject one.Each group had 12 participants (2 females), and subjectswere given two randomly ordered interaction space condi-tions. Each group experienced a different order of rest pe-riods – [20s-5s-15s-10s] for group 1 and [5s-10s-20s-15s] forgroup 2 – during approximately 5 minutes of pointing tasks.
ProcedureWe first introduced the entire experimental procedure to thesubjects, and surveyed their current physical state and moodalong with background information. Then an experimentermeasured the body segment parameters of subjects includingtotal weight, height, upper arm length (shoulder to elbow),lower arm length (elbow to wrist), and hand length (wrist tothe third finger tip). Based on these measurements, we com-puted the inertial properties of each upper limb segment basedon De Leva’s estimation method [16], and used those for theinverse dynamics computations (see Appendix for details).
Next, subjects started the training session for the mid-airpointing tasks. They performed all interaction space condi-tions in the main experiments with the guidance that theyshould “hit as many targets as possible while keeping goodpointing accuracy”. This is a typical instruction given forFitts’ Law studies, and used to spur the subject’s motivationand effort in performing the tasks. We used the same instruc-tion in the second sub-experiment (Exp. 2) to induce andmaintain non-trivial arm fatigue during the tasks. After thetraining session, subjects had at least 5 minutes of rest.
Subsequently, subjects performed the direct maximum shoul-der torque measurement. There were three blocks in this mea-surement consisting of 3 seconds of maximal force exertionand 2 minutes of rest. After the direct force measurement, weprovided at least 15 minutes of mandatory rest to ensure noafter-task interference, as done in traditional procedures [41].Then subjects performed the isometric load exercise till theyexperienced task failure. This was followed by another 30minutes of mandatory rest.
After this break, we started the mid-air pointing section (Exp.2). There were two experimental conditions in this session.Each sub-task consists of four task blocks, and each block in-cludes 1 minute of a pointing task and either one of 5, 10,15, and 20 seconds of rest period (see Fig 5). Subjects took30 minutes of mandatory rest in between sub-tasks to ensurethat there is no interference from prior sub-task. Subjects pro-vided Borg ratings every 20 second during the pointing tasks,and at the start and end of the rest period.
RESULTSHere we first compare the indirect maximal shoulder torqueestimates with the sensor-based direct measurements. Sec-ond, we show the effect of rest periods on the Borg ratings.Lastly, we investigate the performance of the TCM model inestimating the subjective fatigue level during mid-air interac-tion. Table 2 shows the all experiment conditions presentedin the mid-air pointing experiments (Exp. 2). In the rest ofthis section, we denote group 1 and 2 as G1 and G2, and the
Sensing and Input CHI 2017, May 6–11, 2017, Denver, CO, USA
3333

Group 1 Group 2Interaction
zonesG1-H:shoulder level G2-H:shoulder level
G1-L:waist level G2-L:waist levelRest order [20s, 5s, 15s, 10s] [5s, 10s, 20s, 15s]
Table 2. Experimental conditions in the mid-air pointing tasks (Exp. 2).
Figure 6. Results of indirect maximum shoulder torque measurementusing an isometric fatiguing exercise, sorted by %error across subjects(x-axis). The results are compared with sensor-based direct measures.
high and low interaction zones as H and L. Then, we furtheranalyze the factors on the estimation performance.
Validating Indirect Maximum Muscular Strength MeasureIn the isometric load exercise (Exp. 1), we recorded the en-durance time and the averaged shoulder torque (Tavg). Byusing these measures in Equation 1, we computed the indi-rect maximum shoulder torque (Tmax,I ). We also recordedthe maximum shoulder force exerted toward a dynamometerand computed the direct maximum shoulder torque (Tmax,D)from the force measures. We compared these two measuresby evaluating %error=
|Tmax,I−Tmax,D|Tmax,D
∗ 100% and abso-lute error = |Tmax,I − Tmax,D|. Figure 6 shows the errorsbetween Tmax,I and Tmax,D. Results show only 6.1 Nm(SD=5.0) absolute error and 8.4% (SD=6.21%) relative error.A paired-samples t-Test showed no significant difference be-tween Tmax,I and Tmax,D (t(23)=1.576, p=0.129).
Borg CR10 Scale Ratings across SubjectsFigure 7 shows the averaged Borg ratings for each exper-imental conditions. In Figure 7(a), G1-H shows a slowdevelopment of fatigue relative to G2-H. This is expected, asG1-H has 20 seconds rest in the first task block while G2-Hhas only 5 seconds rest. Thus, G2-H is a more fatiguing taskcondition compared to G1-H. A similar trend is visible inFigure 7(b), where G1-L and G2-L are compared. Both restperiod conditions ultimately lead to arm muscle fatigue as theaverage Borg ratings reach their maximum towards the end ofthe last task block. The introduction of shorter rest periods atthe beginning of the tasks seems to affect the overall fatiguelevel as the highest averaged Borg rating was 6.54 and 3.79in G1-H and G1-L respectively, while G2-H and G2-L were6.13 and 3.50. Figure 7 also shows the range of Borg ratingsacross all subjects. There are large variations across subjectsin Borg ratings (average variation range=3.2, min=1, max=6).
Model Performance in Estimating Perceived ExertionTo evaluate the performance of the model in estimating sub-jective fatigue, we performed multiple cross-validations oninteraction conditions and subjects. We also drew a compari-son with an existing fatigue metric (CE [30]).
Figure 7. Borg CR10 ratings by 24 subjects during the mid-air pointingtasks. (a) shows the ratings in the high interaction zone in G1-H and G2-H. (b) shows the ratings in the low interaction zone in G1-L and G2-L.
Figure 8. Results of cross-validation across (a): interaction space condi-tions within groups and (b): rest period conditions between groups. Thesubjects are sorted by the ascending order of RMSE.
Cross-Validating Interaction Space ConditionsTo investigate the applicability of the cumulative fatiguemodel to different interaction space conditions–higher orlower interaction space–we designed a cross validation testwhere the model is optimized only with either one of inter-action zone conditions. Then we tested it on the data setof the other condition. The cross-validations are performedin each group separately to see the performance in isolationwithout the potentially confounding effects of rest periods.In total, there were four cross-validations in this experiment,G1-H ↔ G1-L (2) and G2-H ↔ G2-L (2). Figure 8(a) de-picts the RMSE of each subject data in ascending order. Theaveraged RMSEs of each cross validation are: G1-L2H =1.36 (SD=0.72), G1-H2L = 0.83 (SD=0.28), G2-L2H = 1.95(SD=0.87), and G1-H2L = 1.18 (SD=0.68) on the Borg scale.The overall RMSE is 1.33 (SD=0.77).
Between Subject Groups in Different ConditionsTo demonstrate the applicability of the model to different con-ditions, such as the order of rest period and subjects, we de-signed a cross validation where the model is optimized us-ing either one of two group’s data. Then the model is testedwith the other group’s data. In this validation, we can evalu-ate how well the model can be used in different situations.There were total four cross-validations: G2→G1-H/L (2)and G1→G2-H/L (2). Figure 8(b) shows the between-groupcross-validation results. The averaged RMSEs of each crossvalidation are: ‘G2ToG1-H’ = 1.38 (SD=0.70), ‘G2ToG1-L’ = 0.79 (SD=0.29), ‘G1ToG2-H’ = 1.63 (SD=0.78), and‘G2ToG1-L’ = 1.24 (SD=0.64) on the Borg scale. The over-all RMSE is 1.26 (SD=0.35), which is slightly lower than thecross-validation between interaction space conditions (1.33).To further investigate the statistical difference between the
Sensing and Input CHI 2017, May 6–11, 2017, Denver, CO, USA
3334

Figure 9. Results of the leave-one-out cross-validation of the model across all subject data. Green-upward/downward triangles: upper/lower boundof ground truth, blue circles: averaged ground truth, black crosses: TCM estimates, red circles: averaged TCM estimates, orange circles: averagedCE [30] estimates, purple circles: averaged CE estimates on the subject data with average %MVC above 15% (only observed in G2-H condition).
cross validation results between groups, we performed apaired t-test. Results showed no significant difference in theaveraged RMSE (t(47)=-0.713, p=0.479). Thus, we concludethat the between group conditions did not affect the estima-tion performance of the model.
Effect of Interaction Conditions on Fatigue EstimationTo investigate the effect of task conditions–interaction zonesand rest period order–on the estimation performance mea-sured in RMSE, we performed a mixed factors ANOVA testwith rest period order as between-subject factor and interac-tions zones as within-subject factor. We optimized the modelusing all data collected from the experiments (24 subjects ×2 interaction tasks), and obtained the model parameters asF = 0.0146 and R = 0.0022. The ANOVA results showedthat there is no significant interaction effect between rest or-der and interaction zone (F1,22 = 0.026, p = 0.874); nosignificant difference between rest order conditions (F1,22 =2.361, p = 0.390); but also that the interaction zone con-ditions are significantly different (F1,22 = 26.812, p <0.001). Overall, the upper interaction zone (RMSE-M=1.52,SD=0.76) showed higher fatigue estimation errors comparedto the lower condition (RMSE-M=0.98, SD=0.54).
The parameter optimization discussed above is ecologicallyless sound since it was performed using all subject data. Toillustrate the robustness of our results, we decided to performa leave-one-out (LOO) cross-validation for the fatigue mod-els generated for each subject. For example, the first sub-ject’s data is excluded from optimizing the model, so that wecan also test the model toward unseen subject’s data. Weassume that the RMSE measured using each model is inde-pendent from each other (i.e., only one data is eliminated inthe optimization, and it does not affect the model parame-ters). We performed the same mixed factors ANOVA test, butwith the models generated from the LOO cross-validations.With this, we obtained similar results in that there is no sig-nificant interaction effect between rest order and interactionzone (F1,22 = 0.109, p = 0.745); no significant effect of thetwo rest order conditions (F1,22 = 3.589, p = 0.071); anda significant effect of interaction zone conditions (F1,22 =17.350, p < 0.001). Similar to the previous ANOVA test, theupper interaction zone (mean RMSE=1.50, SD=0.74) showedhigher fatigue estimation errors compared to the lower condi-tion (mean RMSE=1.03, SD=0.56). Based on these two con-gruent ANOVA test results, we conclude that the estimation
performance of the TCM model is less affected by changes ofrest duration compared to interaction space conditions.
Comparison with Consumed Endurance MetricTo compare the estimation performance of our model withan existing fatigue metric, Comsumed Endurance (CE [30]),we computed CE on all subject data used in the LOO cross-validation test. For CE, we used each subject’s maximumshoulder torque and the torque profile measured during thepointing tasks. The averaged %MVC (= T/Tmax∗100%) foreach subject observed during the pointing tasks was 11.79%(Range=[8.11,17.43]). We converted CE estimates to theBorg scale with CE ∗ 0.1 = Borg, as identified by Hincapie-Ramos et al. [30]. The total interaction time for CE includedboth active and rest periods. As CE only quantifies instanta-neous fatigue, we used averaged CE values of each period inbetween Borg ratings to estimate cumulative fatigue.
Figure 9 shows an overview of the results for the TCM model(ours) and CE across all subject data. The averaged TCMestimates (red circles) mostly follow the trend of averagedBorg ratings (blue circles). Also, individual Borg estimates(black crosses) are well within the min-max bounds (greentriangles) of the Borg ratings. As CE automatically yields afatigue level of zero for behaviors that induce exertion below15%MVC, CE fails to properly quantify the fatigue level inall conditions. As our tasks mostly involved exertion belowthis threshold (avg.=11.79%MVC), this causes CE to under-estimate fatigue. This fundamental limitation of CE yieldslarger overall errors compared to TCM in all task conditions(TCM: overall-RMSE=1.46, Range=[0.83,1.90], CE: overall-RMSE=3.45, Range=[2.42,4.25]).
We also compared our model with CE specifically for the datawith averaged %MVC higher than 15% (N=4, avg. %MVC-Mean=15.93%, Range=[15.01,17.43]). Our TCM model(overall-RMSE=0.93, Range=[0.67,1.19]) still showed lowererror than CE (overall-RMSE=2.96, Range=[2.12,3.60]). Asshown in Figure 9(c) (purple circles), CE tends to almostmonotonously increase while underestimating fatigue levels.Also, CE estimates drop suddenly close to zero during restperiods, failing to capture the continuity of fatigue.
In contrast to CE, our TCM model does not limit the rangeof exertion when estimating cumulative fatigue. Also, ourmodel considers both rest and active periods, and correctlypredicts cumulative fatigue for intermittent task periods.
Sensing and Input CHI 2017, May 6–11, 2017, Denver, CO, USA
3335

Inter-individual Factors on Model PerformanceWe examined the potential effect of (1) subject’s background(e.g., age, overall tiredness, experience with mid-air in-terfaces), (2) physical measurements (weight, height, limblength), and (3) variables collected during the maximumtorque estimation (errors in the estimation, endurance time,maximum torque) on the errors in estimating subjective fa-tigue. We performed a Pearson’s product-moment test withthese individual variables, and none of them showed a signif-icant correlation with the estimation errors. We further exam-ined the relationship between Borg ratings and shoulder jointtorque. These two parameters are directly used in both opti-mizing and evaluating the fatigue model, so it is worth inves-tigating their effects on the estimation performance. In par-ticular, we examined the ratio (rB/T ) between Borg ratingsand shoulder joint torque during the mid-air pointing tasks:rB/T =
Borgavg
Tavg, where Borgavg is the average of Borg rat-
ings and Tavg is the average of shoulder torques collectedfrom a subject performing a mid-air pointing task. We per-formed a linear regression analysis between rB/T and RMSEmeasured in the leave-one-out cross validation with all data.Results showed that there was a strong correlation betweenthe estimation error and rB/T (F1,46 = 109.148, p < 0.001)with an R2 of 0.704. A multiple linear regression was fur-ther calculated to predict the RMSE based on both factorsBorgavg and Tavg . Results showed that the two factorsexplained 70.4% of the variance (R2 = 0.704, F2,45 =53.401, p < 0.001). However, only Borgavg was a signif-icant predictor (β = 0.687, p < 0.001). This can be ex-plained by (1) a significant correlation between subject’s in-ternal variability of Borg ratings and estimation errors and (2)limitations of the linear function (φ(·)) mapping Borg ratingsto the estimate fatigue level MF .
DISCUSSIONOur results validated the value of our approach for estimatingsubjective fatigue only using a camera-based skeleton track-ing system instead of expensive and hard-to-access methodsthat are impractical for HCI.
Simple and Effective Shoulder Torque MeasuresA comparison between our indirect maximum shouldertorque measurement through a simple mid-air pointing taskshowed no significant difference compared to traditionalmethods. To our knowledge, this is the first method to es-timate an individual’s maximum shoulder torque with onlyvision-based skeleton tracking sensors. We envision thatour simple but effective method can be used in various HCIscenarios. For example, personalized training programs forKinect-based at-home therapy applications [57] could beadapted to each individual’s strength using our method.
Reliable Performance in Estimating Subjective FatigueOur results showed good estimation of subjective fatigue(maximum-mean-RMSE=1.95 (SD=0.87) observed in G2-L2H, minimum-mean-RMSE=0.79 (SD=0.29) observed inG2ToG1-L). Given the variability in subjective evaluationsof fatigue, we believe that our model did well in generatingsuch low errors. This approach is a significant stepping-stone
to investigate the relation between subjective and objectivefatigue. The computational complexity for implementing ouralgorithm is low, and it is implementable in real-time (50Hz).
Limitations and Future WorkWhile our model showed overall good estimation perfor-mance (overall-RMSE=1.46 in the LOO cross-validation), weidentified some limitations that should be addressed in fu-ture work. First, our proposal is based on an assumption thatthrough properly transforming biomechanical information wecan estimate the perceived exertion level. However, as subjec-tive fatigue is influenced by both physiological and psycho-logical changes, there are several potential factors that couldnot be modeled with our two parameters. In the experiments,we observed that some subjects indicated much higher Borgratings than what one might expect. For example, subject 19reported about 8 to 10 %MVC while performing the pointingtasks, but indicated the highest Borg ratings–expressed in hisnative language–among all participants. This suggests thatthis subject may experience fatigue and rest differently com-pared to others (i.e., beyond the normal range for F and Rparameters). Such inter-individual difference should be fur-ther studied to reduce estimation errors.
Second, our current assumption of a linear mapping betweenthe perceived exertion and the maximum joint force shouldbe revisited. Some psychophysical relations between muscu-lar intensity and perceived exertion ratings can be describedby power functions [12]. In the future, we will focus on iden-tifying such a mapping function for a focus group of subjects.
We also plan to extend our approach to broader and com-plex interaction scenarios. For example, we can apply theTCM model to other mid-air interaction tasks (e.g., rotation,docking) by fitting the model parameters, as long as the corre-sponding data (joint torque, Borg ratings) is available. In gen-eral, fatigue is task-dependent [19, 20], and different modelparameters might be needed for different tasks.
We are also looking at testing the model on tasks that in-volve highly-trained movements during interaction with vary-ing rest periods, such as playing gesture-based games. Ourmodel already quantifies the effect of rest on cumulative fa-tigue well, but it might be possible to improve estimation ac-curacy for varying rest periods via weighted optimization.
CONCLUSIONWe presented a framework for evaluating subjective fatigueusing only a vision-based skeleton tracking system. First, weproposed an indirect method to estimate the maximum shoul-der torque through a simple mid-air pointing task. Compari-son with traditional sensor-based direct measures showed nosignificant difference between the two methods. Second, weapplied the three-compartment muscle model for estimatingsubjective arm fatigue. To our best knowledge, this is thefirst attempt to quantify cumulative subjective arm fatigue ina continuous task involving rest periods using only biome-chanical information generated by a vision system. Over-all, our model showed good estimation performance in mul-tiple cross-validations. Statistical analysis revealed that themodel’s performance was robust to changes in the duration
Sensing and Input CHI 2017, May 6–11, 2017, Denver, CO, USA
3336

Link θi αi mii~Si
iIi
1 θ1 −π2 0 ~0 03×3
2 θ2 − π2
π2 0 ~0 03×3
3 θ3 + π2
π2 mUA [0, dUA, 0]T diag(IUAx, IUAz, IUAy)
4 θ4 0 mLA +mH [d4, 0, 0]T∗ diag(I4z, I4x, I4y)∗Table 3. D-H and body segment parameters for 4-DOF armmodel (*: find detailed definition in the paragraph below).
of rest, but relatively less robust to changes of the interactionzone. Moreover, our model outperformed an existing fatiguemetric (CE [30]) as ours has no limits on the range of exertionconsidered and takes rest correctly into account.
ACKNOWLEDGEMENTSWe thank the reviewers for their valuable feedback. Thiswork was partly supported by the National Science Founda-tion (Award # 1538868 CMMI). Any opinions, findings, andconclusions or recommendations expressed in this materialare those of the author(s) and do not necessarily reflect theviews of NSF.
Source Code AvailabilityThe fatigue model implementation and the biomechanicalupper limb analysis will be released on the project web-site: http://www.tinyurl.com/cumulative-arm-fatigue
APPENDIX: BIOMECHANICAL ARM MODELIn Figure 3, four cylinders represent 1-DOF revolute joints(J0∼J3), and vectors ~z0 ∼ ~z3 indicate their respective rota-tion axis. The first three joints (J0∼J2) share the same posi-tion at the shoulder joint, and J3 is attached at the elbow joint.Thus, the arm is a 4-DOF serial chain (shoulder:3, elbow:1).Ji connects ith and (i+ 1)th link, and the link 0 is fixed to theground body. The coordinate frame 0:(~x0, ~y0, ~z0) is the base,and its origin is at J0. The frame i:(~xi, ~yi, ~zi) is attached tolink i, and its origin is at Ji (i ∈ [1, 2, 3]). Lastly, the frame4:(~x4, ~y4, ~z4) is fixed at the end of the lower arm (wrist joint).
Kinematic AnalysisWe use De Leva’s standard approach [16] to estimate thebody segment parameters (BSPs) of the upper arm (UA),lower arm (LA), and hand (H), including the mass (mUA,mLA, mH ), the center of mass (COM) distance (dUA, dLA,dH ), and the moment of inertia matrix (∈ R3×3) of thearm segments (IUA = diag(IUAx, IUAy, IUAz), ILA =diag(ILAx, ILAy, ILAz), IH = diag(IHx, IHy, IHz))based on each individual’s upper-arm (LUA), forearm (LLA),and hand (LH ) lengths, and total mass of body (mTot). Wecompute the COM distances by dUA = LUA(100 − LUA),dLA = −LLA(100 − LLA), dH = LH ∗ LH ; and body partmasses by mUA = mTot ∗ mUA, mLA = mTot ∗ mLA,mH = mTot ∗ mH , where Lis and mis are, respectively,gender dependent %length and %mass parameters [16].
The orientation of each joint axis is specified using theDenavit-Hartenberg (D-H) notation [18]. Table 3 defines theD-H parameters for the 4-DOF arm model, where θi is therotation angle of ith link about ~zi−1 axis, and αi is the angle
between ~zi−1 and ~zi about ~xi−1 axis. Based on the D-H pa-rameters, the rotational matrices among the coordinate framesare constructed as:
i−1Ri =
cos(θi) −cos(αi)sin(θi) sin(αi)sin(θi))
sin(θi) cos(αi)cos(θi) −sin(αi)cos(θi)
0 sin(αi) cos(αi)
where i−1Ri ∈ R3×3 is a rotation matrix transforming anyvector in the ith frame into the (i-1)th frame 1.
Newton-Euler Inverse DynamicsTo compute joint torques from a given arm motions rep-resented by the biomechanics model, we use a recursiveNewton-Euler dynamics formulation (RNE) [15]. It firstcomputes velocities and accelerations of each link from the1st to 4th link, and then computes joint forces and torquesin reverse order. Thus, the effects of forces and torques arepropagated from the last (distal) to the first (proximal) link:Outward recursion (1→ 4):
i~ωi = iRi−1[i−1~ωi−1 + zθi],
i~ωi = iRi−1[i−1~ωi−1 + z0θi + i−1~ωi−1 × z0θi],i~vi = i~ωi × i ~P ∗i + i~ωi × [i~ωi × i ~P ∗i ] + iRi−1
i−1~vi−1,
i~ai = i~ωi × i~Si + i~ωi × [i~ωi × i~Si] + i~vi
Inward recursion (4→ 1):i ~fi = iRi+1
i+1 ~fi+1 +mii~ai,
i~ni = iRi+1[i+1~ni+1 + i+1Rii ~P ∗i × i+1 ~fi+1]
+ [i ~P ∗i + i~Si]× (mii~ai) + iIi
i~ωi + i~ωi × (iIii~ωi)
where z = [0, 0, 1]T; i~ωi and i~ωi are, respectively, the angularvelocity and acceleration vectors of the ith link 2; i~vi and i~aiare, respectively, the linear acceleration vectors of the originof the ith frame and COM for the ith link; i ~fi and i~ni are,respectively, the force and moment exerted on the ith link bythe (i-1)th link; i ~P ∗i is a vector linking the origin of the (i-1)th and ith frame; i~Si is a vector linking the origin of theith frame and COM of the ith link; mi is the mass of the ithlink; and iIi ∈ R3×3 is a diagonal inertia matrix. The lastthree variables are constant BSPs and defined in Table 3. Wecalculate BSPs of link 4 by combining forearm and hand asone rigid body: m4 = mLA +mH , d4 = dLA∗mLA+dH∗mH
mLA+mH,
I4x = ILAx+ IHx, I4y = ILAy +mLA(d4−dLA)2 + IHy +mH(d4 − dH)2, I4z = ILAz + mLA(d4 − dLA)2 + IHz +
mH(d4 − dH)2. We set the initial values as 0~ω0 = 0~ω0 =5 ~f5 = 5~n5 = ~0 and 0~v0 = [−9.81, 0, 0]T m/s2. Finally, wecompute the shoulder torque as:
T =√τ0 + τ1 + τ2,
where τi = [(i+1~ni+1)T(i+1Riz)]2 and z = [0, 0, 1]T.
1[i−1Ri]-1 = [i−1Ri]
T = iRi−12A leading superscript F of a vector F~x ∈ R3 indicates that thevector is referenced to the coordinate frame F .
Sensing and Input CHI 2017, May 6–11, 2017, Denver, CO, USA
3337

REFERENCES1. Biodex dynamometer. http://www.biodex.com/
physical-medicine/products/dynamometers.
2. Gorilla arm.http://www.computer-dictionary-online.org/?q=gorilla%20arm.
3. Amann, M., Romer, L. M., Pegelow, D. F., Jacques,A. J., Hess, C. J., and Dempsey, J. A. Effects of arterialoxygen content on peripheral locomotor muscle fatigue.Journal of Applied Physiology 101, 1 (2006), 119–127.
4. Astrand, P.-O. Textbook of work physiology:physiological bases of exercise. Human Kinetics, 2003.
5. Audet, C., and Dennis Jr, J. E. Analysis of generalizedpattern searches. SIAM Journal on Optimization 13, 3(2002), 889–903.
6. Bachynskyi, M., Oulasvirta, A., Palmas, G., andWeinkauf, T. Is motion capture-based biomechanicalsimulation valid for hci studies?: study and implications.In Proceedings of the 32nd annual conference on Humanfactors in computing systems, ACM (2014), 3215–3224.
7. Bachynskyi, M., Palmas, G., Oulasvirta, A., Steimle, J.,and Weinkauf, T. Performance and ergonomics of touchsurfaces: A comparative study using biomechanicalsimulation. In Proceedings of the 33rd AnnualConference on Human Factors in Computing Systems,ACM (2015), 1817–1826.
8. Bachynskyi, M., Palmas, G., Oulasvirta, A., andWeinkauf, T. Informing the design of novel inputmethods with muscle coactivation clustering. ACMTrans. Comput.-Hum. Interact. 21, 6 (Jan. 2015),30:1–30:25.
9. Bijur, P. E., Silver, W., and Gallagher, E. J. Reliability ofthe visual analog scale for measurement of acute pain.Academic emergency medicine 8, 12 (2001), 1153–1157.
10. Borg, G. Psychophysical scaling with applications inphysical work and the perception of exertion.Scandinavian journal of work, environment & health(1990), 55–58.
11. Borg, G. Borg’s perceived exertion and pain scales.Human kinetics, 1998.
12. Borg, G. A. Psychophysical bases of perceived exertion.Med sci sports exerc 14, 5 (1982), 377–381.
13. Carifio, J., and Perla, R. J. Ten commonmisunderstandings, misconceptions, persistent mythsand urban legends about likert scales and likert responseformats and their antidotes. Journal of Social Sciences 3,3 (2007), 106–116.
14. Cifrek, M., Medved, V., Tonkovic, S., and Ostojic, S.Surface emg based muscle fatigue evaluation inbiomechanics. Clinical Biomechanics 24, 4 (2009),327–340.
15. Craig, J. J. Introduction to robotics: mechanics andcontrol, vol. 3. Pearson Prentice Hall Upper SaddleRiver, 2005.
16. De Leva, P. Adjustments to zatsiorsky-seluyanov’ssegment inertia parameters. Journal of biomechanics 29,9 (1996), 1223–1230.
17. Dedering, A., Nemeth, G., and Harms-Ringdahl, K.Correlation between electromyographic spectral changesand subjective assessment of lumbar muscle fatigue insubjects without pain from the lower back. ClinicalBiomechanics 14, 2 (1999), 103–111.
18. Denavit, J., and Hartenberg, R. S. A kinematic notationfor lower-pair mechanisms based on matrices. Trans.ASME, J. Appl. Mech. 22, 2 (1965), 215 – 221.
19. Enoka, R. M., and Duchateau, J. Muscle fatigue: what,why and how it influences muscle function. The Journalof physiology 586, 1 (2008), 11–23.
20. Enoka, R. M., and Stuart, D. G. Neurobiology of musclefatigue. Journal of applied physiology 72, 5 (1992),1631–1648.
21. Eston, R. Use of ratings of perceived exertion in sports.International journal of sports physiology andperformance 7, 2 (2012), 175–182.
22. Freivalds, A. Biomechanics of the upper limbs:mechanics, modeling and musculoskeletal injuries. CRCpress, 2011.
23. Frey-Law, L. A., and Avin, K. G. Endurance time isjoint-specific: a modelling and meta-analysisinvestigation. Ergonomics 53, 1 (2010), 109–129.
24. Frey-Law, L. A., Looft, J. M., and Heitsman, J. Athree-compartment muscle fatigue model accuratelypredicts joint-specific maximum endurance times forsustained isometric tasks. Journal of biomechanics 45,10 (2012), 1803–1808.
25. Haga, S., Shinoda, H., and Kokubun, M. Effects of taskdifficulty and time-on-task on mental workload.Japanese Psychological Research 44, 3 (2002),134–143.
26. Harrison, C., Ramamurthy, S., and Hudson, S. E.On-body interaction: armed and dangerous. InProceedings of the Sixth International Conference onTangible, Embedded and Embodied Interaction, ACM(2012), 69–76.
27. Hart, S. G., and Staveland, L. E. Development ofnasa-tlx (task load index): Results of empirical andtheoretical research. Advances in psychology 52 (1988),139–183.
28. Hassenzahl, M., and Tractinsky, N. User experience-aresearch agenda. Behaviour & information technology25, 2 (2006), 91–97.
29. Hayes, K., Walton, J. R., Szomor, Z. L., and Murrell,G. A. Reliability of 3 methods for assessing shoulderstrength. Journal of Shoulder and Elbow surgery 11, 1(2002), 33–39.
Sensing and Input CHI 2017, May 6–11, 2017, Denver, CO, USA
3338

30. Hincapie-Ramos, J. D., Guo, X., Moghadasian, P., andIrani, P. Consumed endurance: A metric to quantify armfatigue of mid-air interactions. In Proceedings of the32nd annual conference on Human factors in computingsystems, ACM (2014), 1063–1072.
31. Hofmann, M., Brger, R., Frost, N., Karremann, J.,Keller-Bacher, J., Kraft, S., Bruder, G., and Steinicke, F.Comparing 3d interaction performance in comfortableand uncomfortable regions. In Proceedings of theGI-Workshop VR/AR (2013), 3–14.
32. Hornbæk, K., and Law, E. L.-C. Meta-analysis ofcorrelations among usability measures. In Proceedingsof the SIGCHI conference on Human factors incomputing systems, ACM (2007), 617–626.
33. Hoysniemi, J., Hamalainen, P., and Turkki, L. Wizard ofoz prototyping of computer vision based action gamesfor children. In Proceedings of the 2004 conference onInteraction design and children: building a community,ACM (2004), 27–34.
34. Hunter, S. K., Duchateau, J., and Enoka, R. M. Musclefatigue and the mechanisms of task failure. Exercise andsport sciences reviews 32, 2 (2004), 44–49.
35. ISO, I. 9241-9 ergonomic requirements for office workwith visual display terminals (vdts)-part 9:Requirements for non-keyboard input devices (fdis-finaldraft international standard), 2000. InternationalOrganization for Standardization.
36. Jacob, M. G., and Wachs, J. P. Context-based handgesture recognition for the operating room. PatternRecognition Letters 36 (2014), 196–203.
37. Kaiser, E., Olwal, A., McGee, D., Benko, H., Corradini,A., Li, X., Cohen, P., and Feiner, S. Mutualdisambiguation of 3d multimodal interaction inaugmented and virtual reality. In Proceedings of the 5thinternational conference on Multimodal interfaces,ACM (2003), 12–19.
38. Liu, J. Z., Brown, R. W., and Yue, G. H. A dynamicalmodel of muscle activation, fatigue, and recovery.Biophysical journal 82, 5 (2002), 2344–2359.
39. Lloyd, A., Gandevia, S., and Hales, J. Muscleperformance, voluntary activation, twitch properties andperceived effort in normal subjects and patients with thechronic fatigue syndrome. Brain 114, 1 (1991), 85–98.
40. Malik, S., McDonald, C., and Roth, G. Hand trackingfor interactive pattern-based augmented reality. InProceedings of the 1st International Symposium onMixed and Augmented Reality, IEEE (2002), 117–126.
41. Mathiassen, S. E., and Ahsberg, E. Prediction ofshoulder flexion endurance from personal factors.International Journal of Industrial Ergonomics 24, 3(1999), 315–329.
42. Morishita, S., Yamauchi, S., Fujisawa, C., and Domen,K. Rating of perceived exertion for quantification of theintensity of resistance exercise. International Journal ofPhysical Medicine & Rehabilitation 2013 (2014).
43. Noble, B. J. Clinical applications of perceived exertion.Medicine and science in sports and exercise 14, 5(1981), 406–411.
44. Oberg, T., Sandjo, L., and Kadefors, R. Subjective andobjective evaluation of shoulder muscle fatigue.Ergonomics 37, 8 (1994), 1323–1333.
45. Raikova, R. A general approach for modelling andmathematical investigation of the human upper limb.Journal of biomechanics 25, 8 (1992), 857–867.
46. Rohmert, W. Ermittlung von erholungspausen furstatische arbeit des menschen. European Journal ofApplied Physiology and Occupational Physiology 18, 2(1960), 123–164.
47. Roy, J.-S., Ma, B., MacDermid, J. C., and Woodhouse,L. J. Shoulder muscle endurance: the development of astandardized and reliable protocol. BMC Sports Science,Medicine and Rehabilitation 3, 1 (2011), 1.
48. Segerstrom, S. C., and Nes, L. S. Heart rate variabilityreflects self-regulatory strength, effort, and fatigue.Psychological science 18, 3 (2007), 275–281.
49. Sjøgaard, G., Savard, G., and Juel, C. Muscle blood flowduring isometric activity and its relation to musclefatigue. European journal of applied physiology andoccupational physiology 57, 3 (1988), 327–335.
50. Sonne, M. W., and Potvin, J. R. A modified version ofthe three-compartment model to predict fatigue duringsubmaximal tasks with complex force-time histories.Ergonomics 59, 1 (2016), 85–98.
51. Spielholz, P. Calibrating borg scale ratings of hand forceexertion. Applied Ergonomics 37, 5 (2006), 615–618.
52. Teather, R., and Stuerzlinger, W. Pointing at 3D targetsin a stereo head-tracked virtual environment. InProceedings of the Symposium on 3D User Interfaces,IEEE (2011), 87–94.
53. Troiano, A., Naddeo, F., Sosso, E., Camarota, G.,Merletti, R., and Mesin, L. Assessment of force andfatigue in isometric contractions of the upper trapeziusmuscle by surface emg signal and perceived exertionscale. Gait & posture 28, 2 (2008), 179–186.
54. Vinayak, Murugappan, S., Liu, H., Ramani, K., et al.Shape-it-up: Hand gesture based creative expression of3d shapes using intelligent generalized cylinders.Computer-Aided Design 45, 2 (2013), 277–287.
55. Westerblad, H., Allen, D. G., and Lannergren, J. Musclefatigue: lactic acid or inorganic phosphate the majorcause? Physiology 17, 1 (2002), 17–21.
56. Xia, T., and Law, L. A. F. A theoretical approach formodeling peripheral muscle fatigue and recovery.Journal of biomechanics 41, 14 (2008), 3046–3052.
57. Zhao, W., Feng, H., Lun, R., Espy, D. D., and Reinthal,M. A. A kinect-based rehabilitation exercise monitoringand guidance system. In Software Engineering andService Science (ICSESS), 2014 5th IEEE InternationalConference on, IEEE (2014), 762–765.
Sensing and Input CHI 2017, May 6–11, 2017, Denver, CO, USA
3339