modeling cross-linguistic relationships across consonant inventories: a complex network approach
TRANSCRIPT
Modeling Cross-linguistic Relationships Across
Consonant Inventories: A Complex Network Approach
Sabda Bramha: Sound is Eternity
sabda-brahma su-durbodham
pranendriya-mano-mayamananta-param gambhiramdurvigahyam samudra-vat
– Sound is eternal and as well very difficult to comprehend. It manifests within the life air, the senses, and the mind. It is unlimited and unfathomable, just like the ocean
Signals and Symbols
• Several living organisms can produce sound
– They emit sound signals to communicate
– These signals are mapped to certain symbols (meanings) in the brain
– E.g., mating calls, danger alarms
Human Communication
• Human beings also produce sound signals
• Unlike other organisms, they can concatenate these sounds to produce new messages – Language
• Language is one of the primary cause/effect of human intelligence
Human Speech Sounds
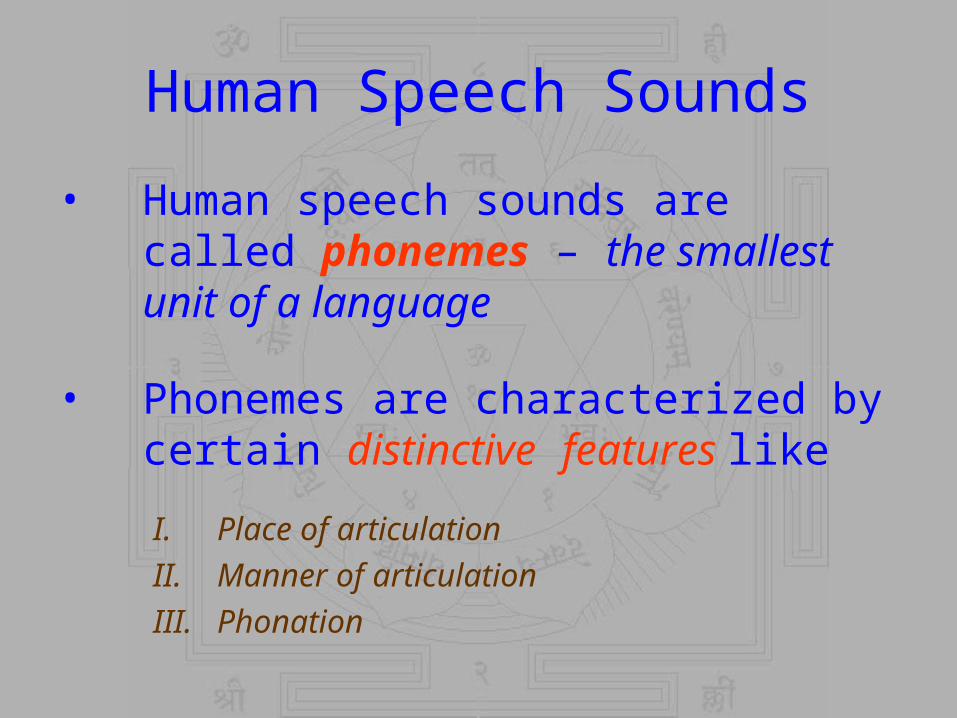
• Human speech sounds are called phonemes – the smallest unit of a language
• Phonemes are characterized by certain distinctive features like
I. Place of articulation
II. Manner of articulation
III. Phonation

Types of Phoneme
• Vowels
/a/, /e/, /u/ …
• Consonants
/p/, /t/, /k/ …
• Dipthongs
/au/, /iu/ …

Choice of Phonemes
• How a language chooses a set of phonemes in order to build its sound inventory?
• Is the process arbitrary?
• Certainly Not
• What are the forces affecting this choice?
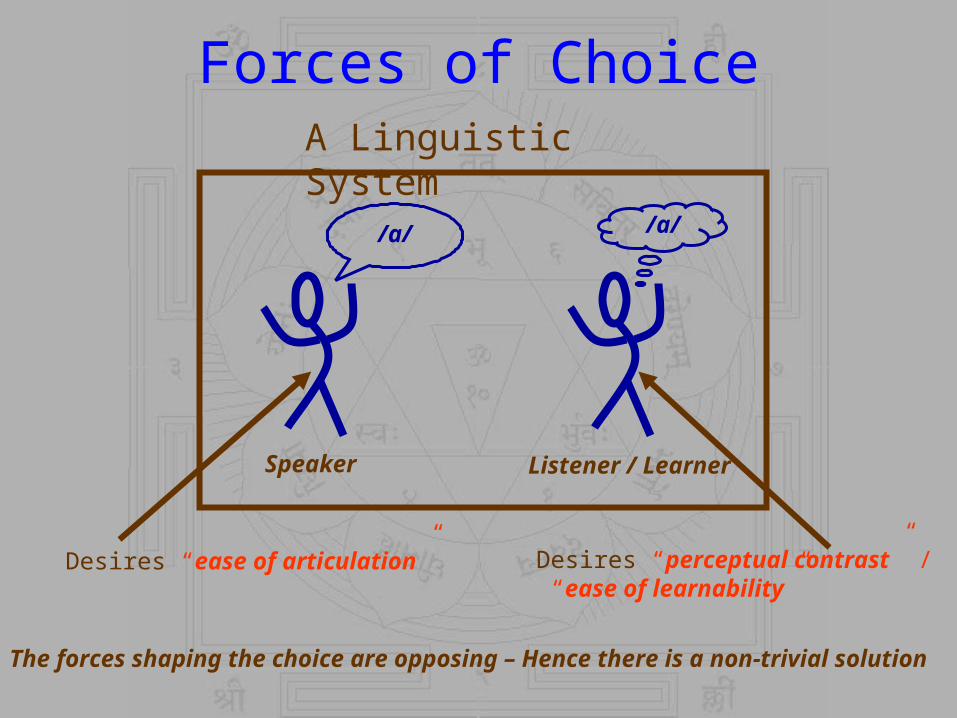
Forces of Choice
/a/
Speaker Listener / Learner
/a/
Desires “ease of articulation” Desires “perceptual contrast” / “ease of learnability”
A Linguistic System
The forces shaping the choice are opposing – Hence there is a non-trivial solution
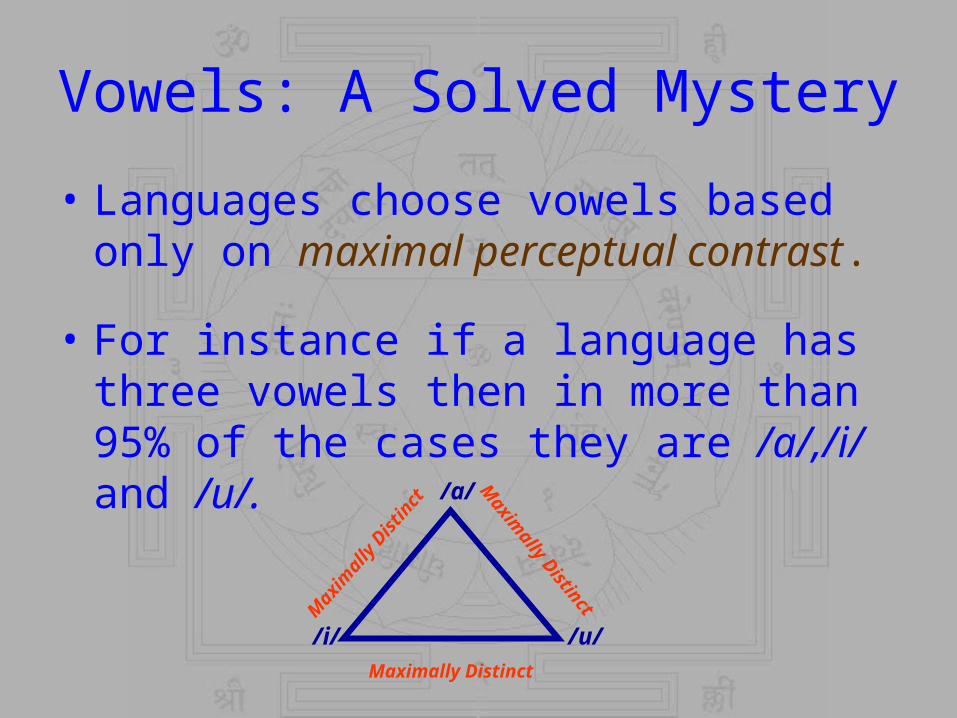
Vowels: A Solved Mystery
• Languages choose vowels based only on maximal perceptual contrast.
• For instance if a language has three vowels then in more than 95% of the cases they are /a/,/i/ and /u/.
/a/
/u//i/Maximally Distinct
Maxim
ally DistinctMax
imal
ly D
istin
ct

Consonants: A Jigsaw puzzle
• Research: From 1929 – Date
• No single satisfactory explanation of the organization of the consonant inventories
– The set of features that characterize consonants is much larger than that of vowels
– No single force is sufficient to explain this organization
– Rather a complex interplay of forces goes on in shaping these inventories

Principle of Occurrence
• PlaNet – “Phoneme Language Network”– A bipartite network N=(VL,VC,E)
– VL : Nodes representing languages of the world
– VC : Nodes representing consonants
– E : Set of edges which run between VL and VC
– There is an edge e Є E between two nodes vl Є VL and vc Є VC if the consonant c occurs in language l.
vl1
vl2
vl3
vl4
vc1
vc2
vc3
vc4

Construction of PlaNet
• Data Source : UCLA Phonological Inventory Database (UPSID)
• Number of nodes in VL is 317
• Number of nodes in VC is 541
• Number of edges is 7022

Degree Distribution of PlaNet
DD of the nodes of VL
An asymmetric β-distribution peaking at 21
– Most of the languages in UPSID tend to have a consonant
inventory size of 21

Degree Distribution of PlaNet: A Two Regime Power Law
DD of the nodes in VCRank versus degree of the nodes in VC
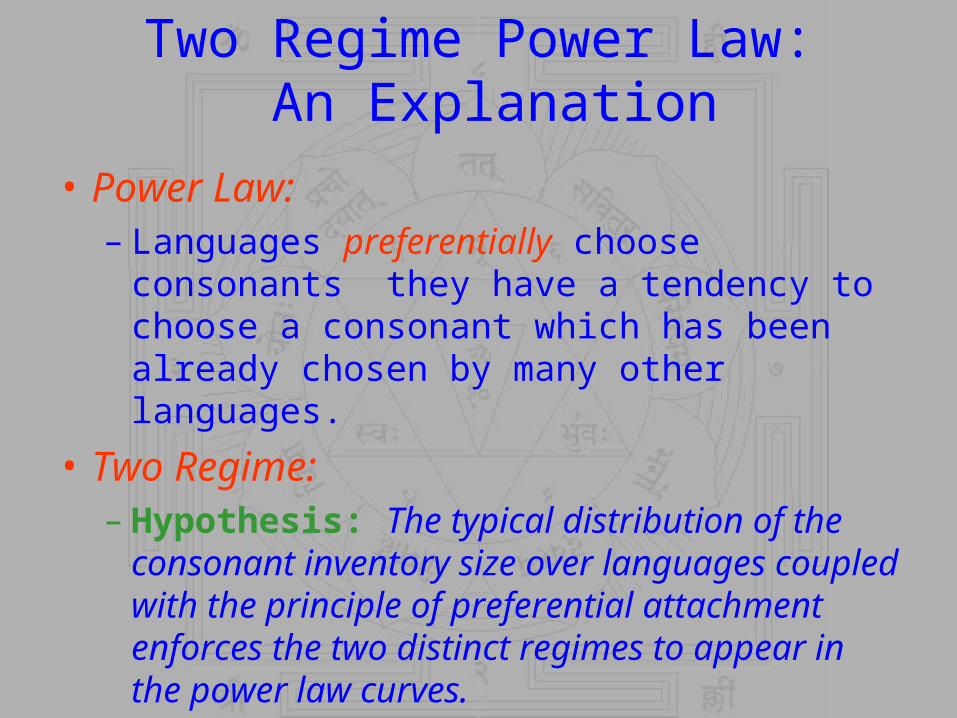
Two Regime Power Law: An Explanation
• Power Law: – Languages preferentially choose consonants
they have a tendency to choose a consonant which has been already chosen by many other languages.
• Two Regime: – Hypothesis: The typical distribution of the
consonant inventory size over languages coupled with the principle of preferential attachment enforces the two distinct regimes to appear in the power law curves.

Why the Break??
• Average consonant inventory size in UPSID is 21– Principle of preferential attachment: The first
21 consonants (most frequent) are more preferred by languages than the rest. Hence the transition.
• The break shifts as the average inventory size is shifted.

Support Experiment• Shift the inventory size form 21 to 25, 30 and 38 by
neglecting the contribution of the consonant inventory size less than 15, 20 and 25 respectively.
Break at 37
Break at 21Break at 25
Break at 30

Simplified Theoretical Explanation
• Assumption: – Inventory size of all languages is fixed at 21.– Consonants are organized in a hierarchy of
preference
• Model: – A language traverses the hierarchy of
consonants– At each step decides with a probability p
whether to choose the current consonant.

Simplified Theoretical Explanation
• Analysis: – Probability of choosing any one of the first 21
consonants is p (since languages must traverse through the first 21 consonants regardless of whether the previous consonants are chosen or not)
– 22nd consonant is chosen only if 0, 1, 2 or at most 20 but not all 21 consonants are chosen
– In general

Simplified Theoretical Explanation
The plots for the function P(n) different values of p

The Synthesis Model (PlaNetsyn)
• Initialization– Degree distribution of the nodes in VL is known. VL={L1,L2,…,L317}
with degrees (consonant inventory size) {k1,k2,…,k317}
– Nodes in VC are unlabelled.
• Algorithm– At every time step a node Lj (j = 1 to 317) from VL tries to attach
itself to a node i Є VC (to which Lj is not already connected) with a probability Pr(i) given by
where ki is the current degree of the node i and Vj is the set of nodes in VC to which Lj is not already connected and ε is the model parameter that inserts some randomness in the model
– The above step is repeated until all Lj Є VL gets connected to exactly kj nodes in VC

The Mechanism in Illustration

Simulation Results
For PlaNetsyn ε = 0.0701 and the results are averaged over 100 runs

Principle of Co-occurrence• Consonants tend to co-occur in groups or
communities• The observed property can be explained by
principle of feature economy– Languages tend to maximize the combinatorial
possibilities of a few distinctive features in order to produce a large number of consonants.
If a language has in its inventory
Then it will also tend to have
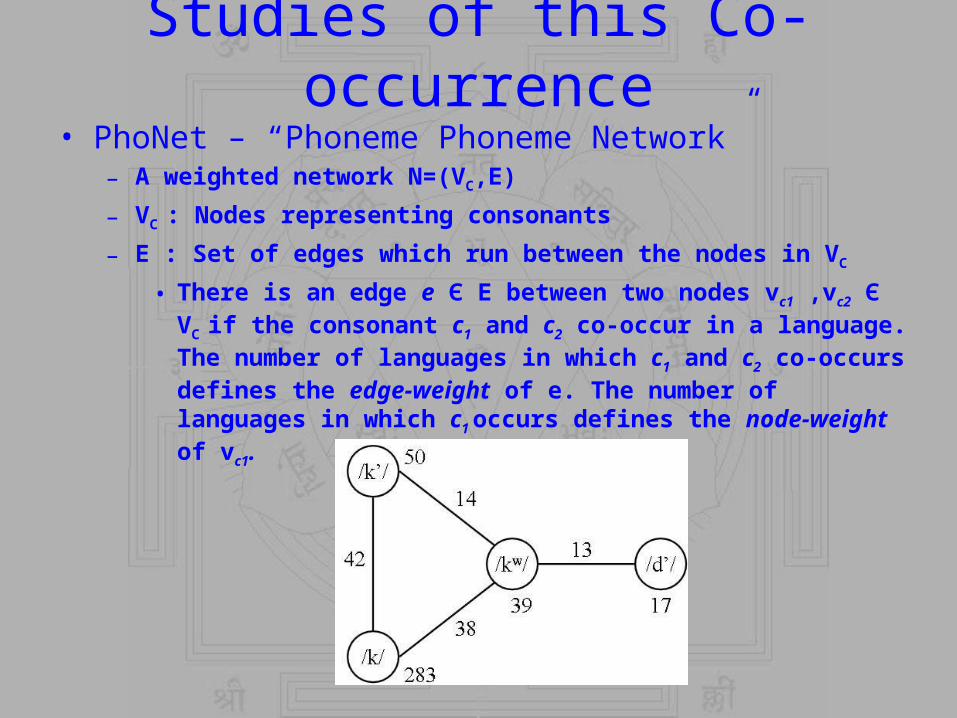
Studies of this Co-occurrence• PhoNet – “Phoneme Phoneme Network”
– A weighted network N=(VC,E)
– VC : Nodes representing consonants
– E : Set of edges which run between the nodes in VC
• There is an edge e Є E between two nodes vc1 ,vc2 Є VC if the consonant c1 and c2 co-occur in a language. The number of languages in which c1 and c2 co-occurs defines the edge-weight of e. The number of languages in which c1 occurs defines the node-weight of vc1.

Construction of PhoNet
• Data Source : UCLA Phonological Inventory Database (UPSID)
• Number of nodes in VC is 541
• Number of edges is 34012
PhoNet

Communities in PhoNet• Modified Radicchi et al. algorithm• Basis
– Edges running between communities are unlikely to belong to short-loops because to complete this loop there needs to be another edge running between these two communities and such edges are rare
• Modification for Weighted Networks– Rather than considering triangles, whether or not the weights on the
edges of this triangle are comparable is to be considered. If they are, then the group of consonants co-occur highly else it is not so.
– Measure strength S for each edge in PhoNet where S is,
– Remove edges with S less than a threshold η
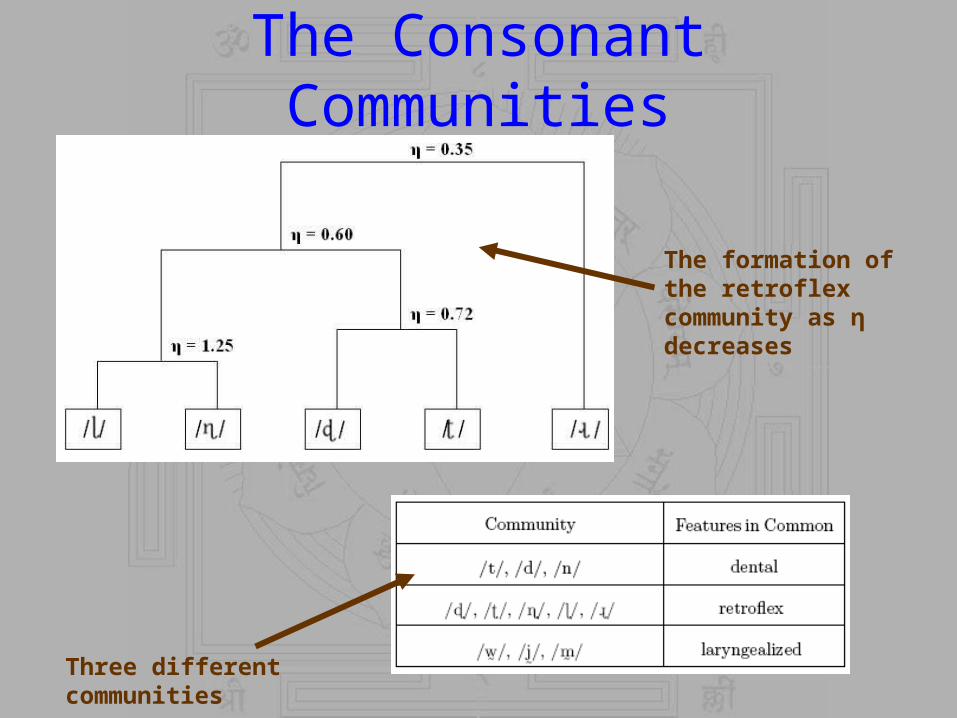
The Consonant Communities
The formation of the retroflex community as η decreases
Three different communities
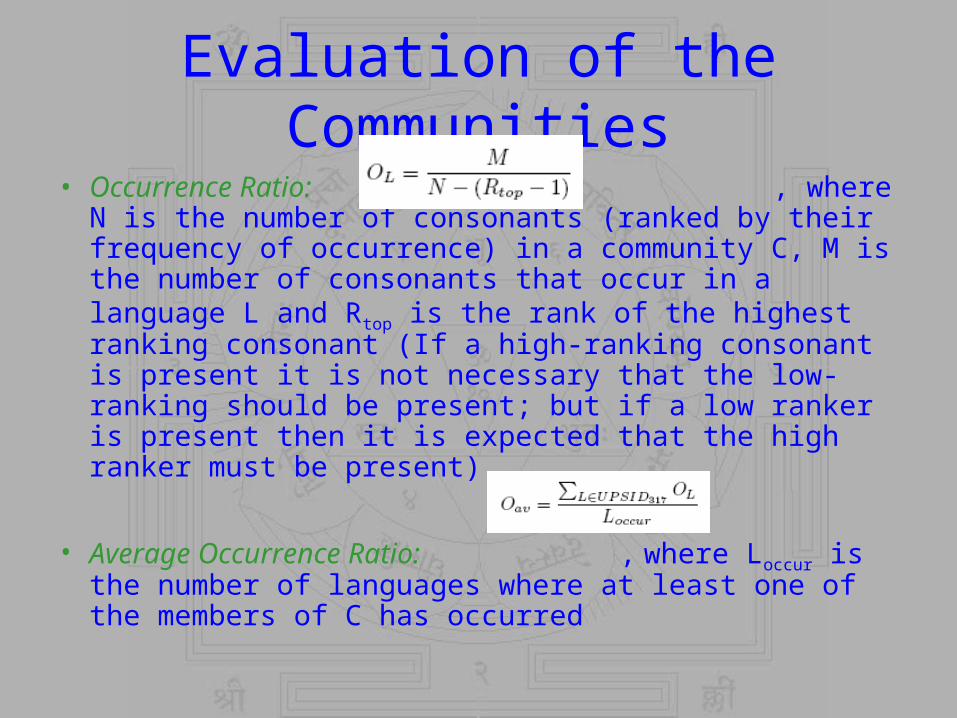
Evaluation of the Communities
• Occurrence Ratio: , where N is the number of consonants (ranked by their frequency of occurrence) in a community C, M is the number of consonants that occur in a language L and Rtop is the rank of the highest ranking consonant (If a high-ranking consonant is present it is not necessary that the low-ranking should be present; but if a low ranker is present then it is expected that the high ranker must be present)
• Average Occurrence Ratio: , where Loccur is the number of languages where at least one of the members of C has occurred
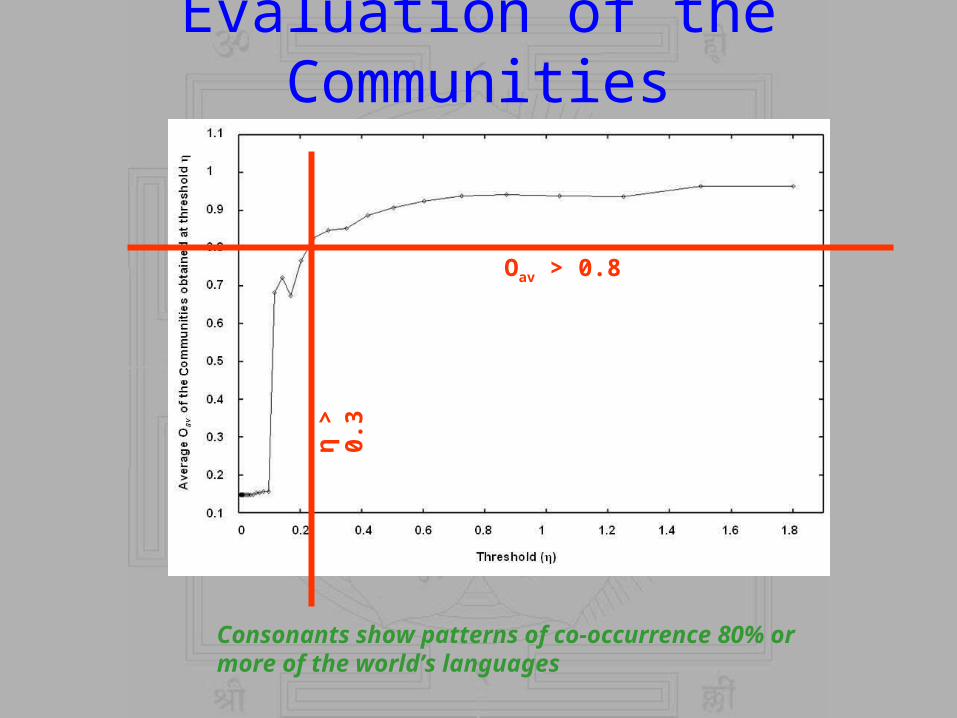
Evaluation of the Communities
η >
0.3
Oav > 0.8
Consonants show patterns of co-occurrence 80% or more of the world’s languages
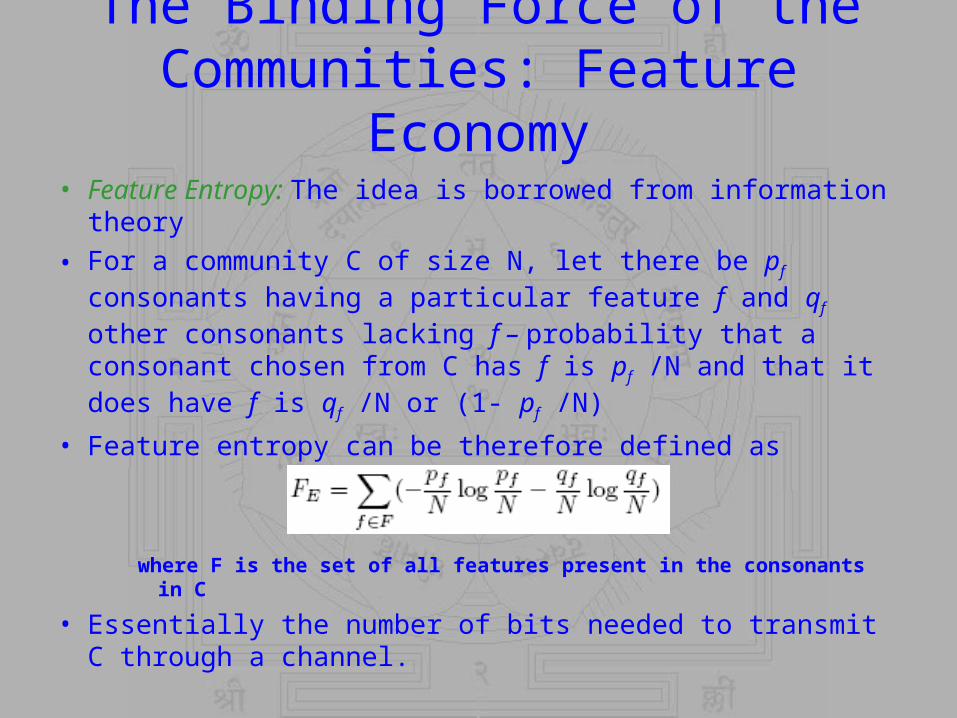
The Binding Force of the Communities: Feature Economy
• Feature Entropy: The idea is borrowed from information theory
• For a community C of size N, let there be pf consonants having a particular feature f and qf other consonants lacking f – probability that a consonant chosen from C has f is pf /N and that it does have f is qf /N or (1- pf /N)
• Feature entropy can be therefore defined as
where F is the set of all features present in the consonants in C
• Essentially the number of bits needed to transmit C through a channel.

For Instance
Lower FE -> C economizes on the number of features
Higher FE -> C does not economize on the number of features

Comparison with Random PhoNet (PhoNetrand)
• Construction of PhoNetrand
– For each consonant c let the frequency of occurrence in be denoted by fc. Let there be 317 bins each corresponding to a language in UPSID. fc bins are then chosen uniformly at random and the consonant c is packed into these bins. Thus the consonant inventories of the 317 languages corresponding to the bins are generated. Construct PhoNetrand from these new consonant inventories similarly as PhoNet.
– Cluster by the PhoNetrand method proposed earlier

Comparison with Random PhoNet (PhoNetrand)
Average feature entropy of the communities of a particular size versus the community size (in log scale)
Average feature entropy of the communities at a threshold η versus the threshold η
Communities would not have emerged if
inventories had evolved just by chance
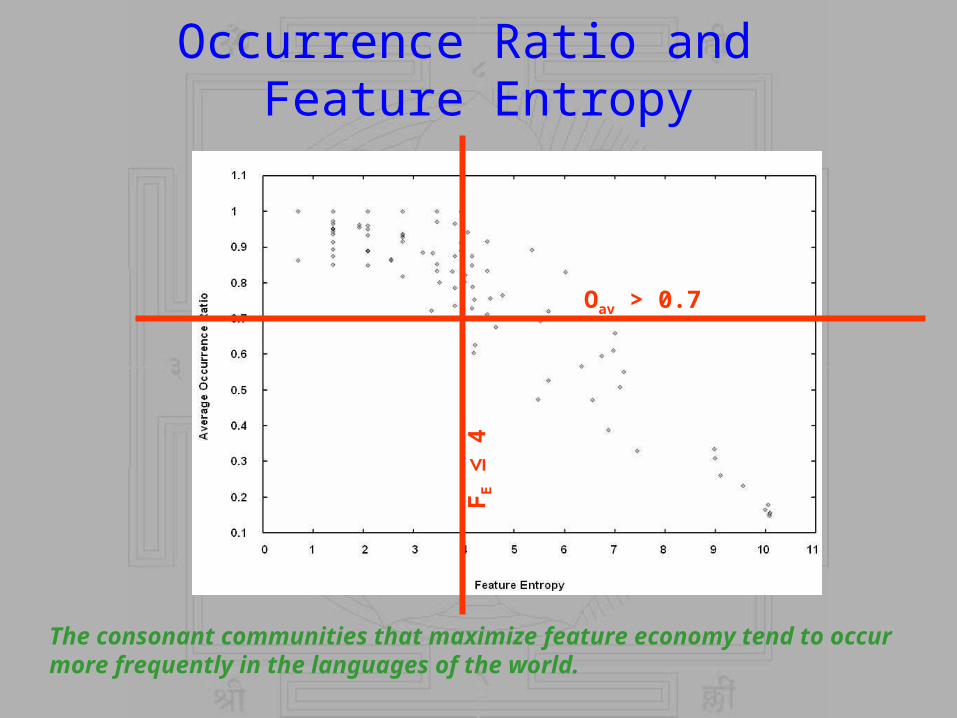
Occurrence Ratio and Feature Entropy
FE ≤
4
Oav > 0.7
The consonant communities that maximize feature economy tend to occur more frequently in the languages of the world.

The Future
• The quantification of Feature Economy can help in understanding the interplay of the forces like – Perceptual Contrast (will tend to increase
feature economy by increasing the number of distinctive features required for better perception)
– Ease of Learnability (will tend to decrease feature economy by decreasing the number of distinctive features to be learnt)

Implications to Language Evolution
• N speakers communicating with two consonants /k/ and /g/.
• Each speaker have l descendant • m of them speak /k/ and the rest n of them
speak /g/• After i generations there will be mli /k/ speakers
and nli /g/ speakers. Now if • If m > n then mli >> nli (something similar to the
phenomenon of preferential attachment)• How the initial disparity (m > n) comes is still to
be explored (maybe phonetic reasons)

Thanks