modeling asian gypsy moth (lymantria dispar introduction ... introduction . asian gypsy moth...
TRANSCRIPT

United States Department of Agriculture Animal and Plant Health Inspection Service
Agency Contact: Lisa Kennaway USDA APHIS PPQ CPHST 2130 Research Blvd., Suite 108 Fort Collins, CO 80526 Phone: 970.490.4463 Fax: 970.482.0924 Email: [email protected]
Modeling Asian Gypsy Moth (Lymantria dispar) Introduction and Establishment for Texas

2
Introduction Asian gypsy moth (Lymantria dispar ssp., AGM) is an exotic pest that has been detected, but not established in the United States (Fig. 1). The threat to American agriculture is significant due to AGMs broad range of host plants, including 500 species of trees and shrubs (APHIS, 2003). The AGM is similar to the European gypsy moth. However, AGM has a much broader host range and the females are capable of flying up to 25 miles, unlike the flightless female European gypsy moth (USDA, 2006). This makes identifying early introductions of the pest crucial to prevent its establishment in North America. AGM is native to Asia. A primary pathway of introduction into America is via ship and cargo traffic from the Far East. These trade patterns place the state of Texas in high risk of AGM introduction. Texas currently has a surveillance system in place to identify (and eradicate if necessary), any moths prior to establishment. The trapping system is organized and managed with expert local knowledge, and places higher trap densities in and near major shipping ports and transportation routes. To enhance the placement of traps in Texas, a geospatial model has been developed to predict areas with the highest AGM introduction and establishment risk based on transportation, population, and vegetation variables. The goal of this model is to improve and/or validate existing trapping locations. Figure 1. (A) Female Asian gypsy moth, (B) Larvae (images courtesy of John Ghent, USDA Forest Service). Methods The analysis method uses a raster-based geospatial model. The model has two assumptions. First, areas closest to highways, cities, ports, and railways have highest potential for AGM introduction based on movement of commodities; and second, analysis can only account for AGM activity on the outside of traveling mechanisms and containers. Stakeholder group A stakeholder group was formed to guide the model and review results. The group includes representatives from: 1. USDA APHIS PPQ Western Region, Texas State Plant Health Director's Office 2. USDA APHIS PPQ Smuggling, Interdiction, and Trade Compliance (SITC) 3. Texas Department of Agriculture 4. US Department of Homeland Security, Customs and Border Protection

3
Model inputs 1. Ports and Mexico Crossings Information provided by the
Texas State Plant Health Director’s office and US Department of Homeland Security, Customs and Border Protection.
2. Major Transportation Pathways
Features extracted from "Highway" and “Railway” feature class, TeleAtlas ArcSDE geodatabase housed at the USDA APHIS PPQ Western Region office.
3. Human Population Texas census blocks for the year 2010. Data downloaded from Center for International Earth Science Information Network (CIESIN) (http://sedac.ciesin.columbia.edu).
4. Firework Distributors
Features created using USDA APHIS PPQ SITC report from SalesGenie marketing database. 5. Military Risk
Data defined as military household effect shipments from Japan and Korea to Texas. Data provided by USDA APHIS PPQ SITC.
6. Vegetation
Vegetation classification developed by Texas Parks and Wildlife Department (www.tpwd.state.tx.us/admin/veg/), and provided by USDA APHIS PPQ Texas State Plant Health Director’s Office.
Data Normalization Once input data were compiled for the model, each layer needed to be normalized. Normalization is required because not all input data represents spatial information in the same way. All input data was normalized to include values from 0-1, where values closest to 0 have a low association with AGM, and values closest to 1 have a high association with AGM. Normalization was achieved by dividing all values by the maximum value, and certain datasets that involved distance required an inversion of values to ensure proper orientation of the values.

4
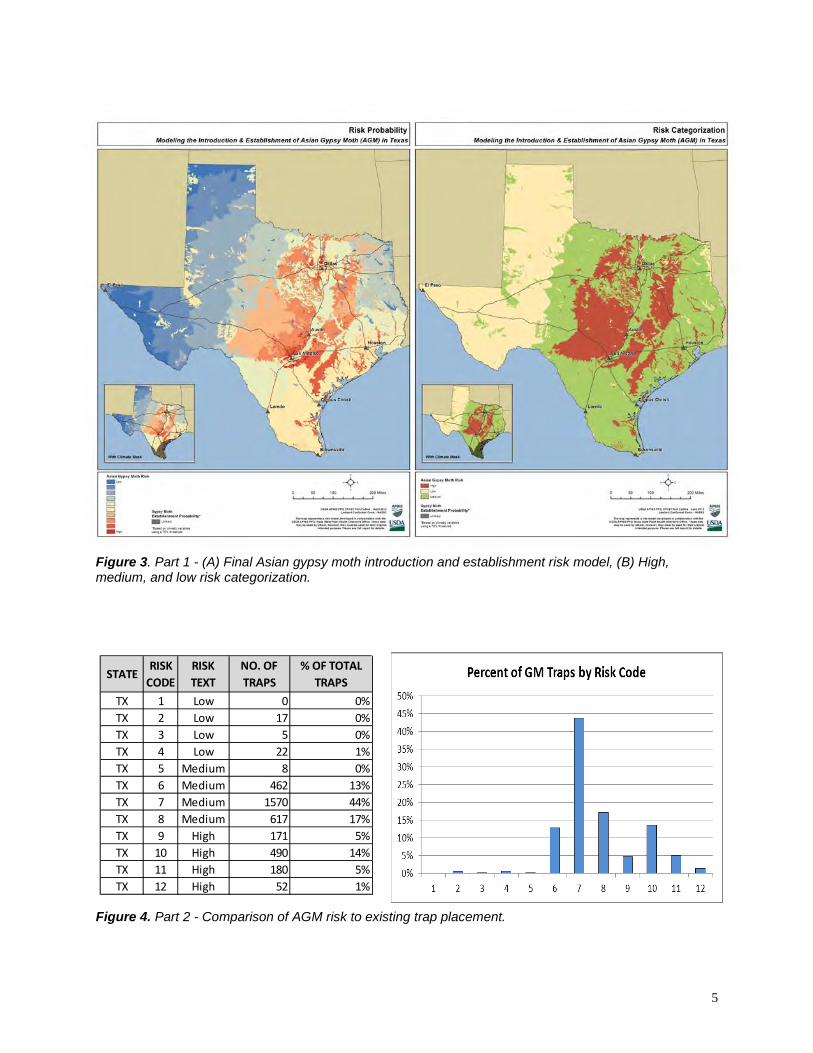
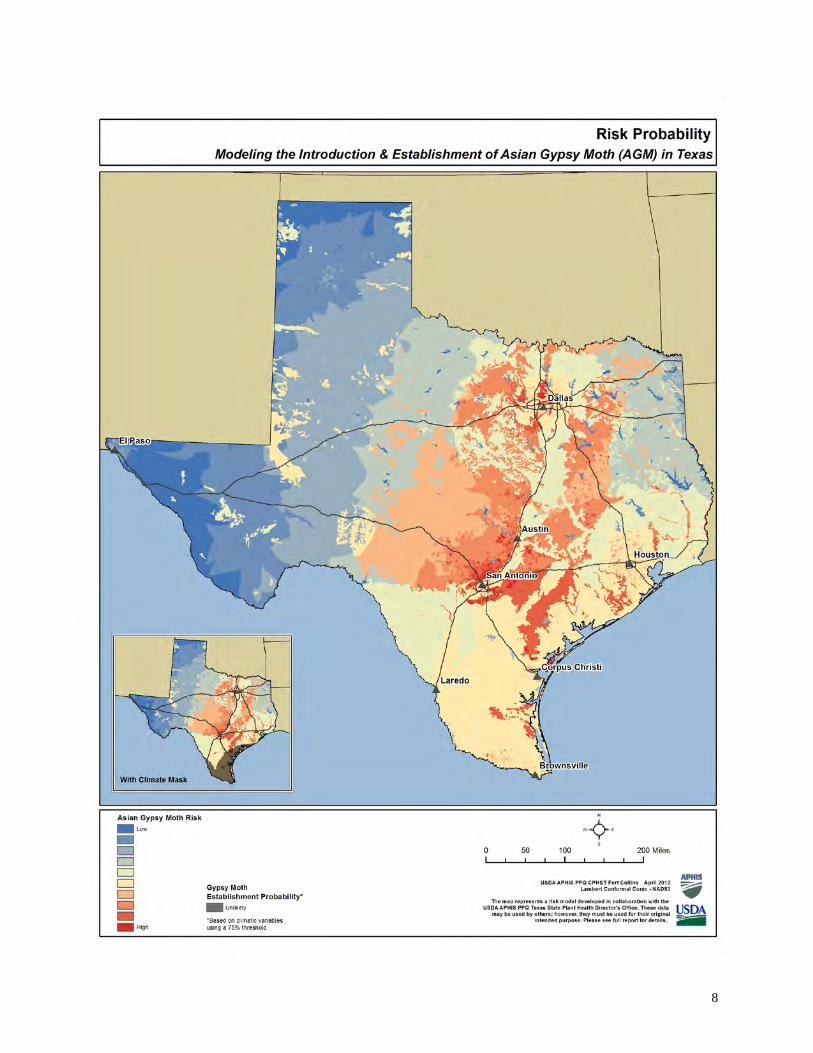
Model Weighting Next, a weighting schema was developed for the model to best represent each variables influence in the final results. Numerous schemas were tested and discussed. The final schema balances model inputs by importance in AGM introduction and establishment. 1. Ports & Border Crossings 35% 2. Vegetation 25% 3. Highway & Railway 20% 4. Population 10% 5. Firework Distributors 5% 6. Military shipments 5% General Gypsy Moth Establishment Mask Based on Climatic Variables A final contributor to the model is a mask data layer developed by the USDA APHIS PPQ Western Region Data, Analysis, Risk, and Targeting (DART) group. In a related project, a data layer was developed that represents areas most likely for European gypsy moth (GM) to establish based on climatic conditions. This mask used known GM phenology parameters to generate a surface of risk for the United States. Final determination on how climatic constraints differ between GM and AGM is in progress. In addition, final determination of how many species comprise the AGM species group, and how climatic constraints may differ within those species is also in progress. For these reasons, this mask was not included as an input into the model, but rather used to mask out those areas most unlikely for GM to establish. The use of this mask requires awareness that there may be differences in climatic constraints of European and Asian gypsy moths, as well as within the Asian gypsy moth group itself. Results Part 1 depicts AGM introduction and establishment risk based on the data inputs and weighting schema (Fig. 3A). This risk can also be categorized into distinct zones for further visualization. The codes are arbitrary, but do lend additional understanding of how risk is represented across the state (Fig. 3B). Also note that Figure 3 includes a map subset of the AGM model with the GM establishment mask. This data has previously been delivered to stakeholders by the USDA APHIS PPQ Western Region office. Additional views of the risk model and establishment mask are provided in Appendix A. Views include maps of major metropolitan areas, 2011 trap locations, and the GM climate mask boundary. Part 2 provides a quantitative spreadsheet analyzing the relationship between modeled AGM risk and 2011 survey traps (Fig. 4), and defines the number of current traps within each risk zone.
5
STATERISK
CODERISK TEXT
NO. OF TRAPS
% OF TOTAL TRAPS
TX 1 Low 0 0%TX 2 Low 17 0%TX 3 Low 5 0%TX 4 Low 22 1%TX 5 Medium 8 0%TX 6 Medium 462 13%TX 7 Medium 1570 44%TX 8 Medium 617 17%TX 9 High 171 5%TX 10 High 490 14%TX 11 High 180 5%TX 12 High 52 1%
Figure 3. Part 1 - (A) Final Asian gypsy moth introduction and establishment risk model, (B) High, medium, and low risk categorization.
Figure 4. Part 2 - Comparison of AGM risk to existing trap placement.

6
Summary This effort assists 2012 gypsy moth trap allocation for the state of Texas, and provides new information of where AGM could be introduced and may establish. AGM is most likely introduced through human mediated pathways that involve cargo and commodity flow. The model is based on a combination of these pathways, and includes a detailed delineation of vegetation communities within the state. The model results are further enhanced by a mask of generalized GM moth establishment probability that is based on climatic parameters, and was developed within the USDA APHIS PPQ Western Region. A full understanding of how climatic constraints differ between European and Asian gypsy moth, as well as within the Asian species group itself, is not known. For this reason, the climatic portion is included as a separate mask and can be used to guide trap allocation, but should not be used as an absolute determination of where AGM can establish. Work continues on defining the climatic constraints of AGM, as well as what factors are most important in determining its introduction. This model is an iterative process and will be updated once further recommendations are made on factors that influence its introduction and establishment. The model visualizes risk throughout the state. In addition, areas of interest can be viewed more closely and drawn with additional information such as aerial photography to best determine where to place a trap. While experts within the state will know best how to use this model to realign traps, some general recommendations for placement include:
1. Zoom into major metropolitan areas and adjust trap locations based on risk areas (see Appendix A for examples).
a. Adjust traps to census blocks that have higher population, and therefore a higher degree of commodity flow.
b. Adjust traps to vegetated areas of highest risk using aerial photography to assist.
2. Adjust some trap locations away from climate mask. Currently, 143 GM traps fall within the climate mask. These traps may be reallocated to other high risk pathways (e.g. highways, firework stands) near the mask boundary.
References Ghent, John. 2004. Asian gypsy moth. [image file]. USDA Forest Service. www.invasive.org. United States. Department of Agriculture. Animal and Plant Health Inspection Service. (2003). Asian Gypsy Moth (APHIS Factsheet). Retrieved January 16, 2009, from the U.S. Department of Agriculture (USDA) Animal and Plant Health Inspection Service (APHIS) web site: http://www.aphis.usda.gov/publications/plant_health/content/printable_version/fs_phasiangm.pdf United States. Department of Agriculture. Animal and Plant Health Inspection Service. (2006). Asian Gypsy Moth Cooperative Eradication Program, Orange County, CA (Environmental Assessment).

7
APPENDIX A
8

9

10

11

12

13

14

15