modeling and measuring the process of watershed change, and implications for fisheries karin e....
TRANSCRIPT

Modeling and Measuring the Process of Watershed Change, and Implications for
FisheriesKarin E. Limburg
SUNY College of Environmental Science & Forestry
Supported by the Hudson River Foundation and National Science Foundation
Modeling and Measuring the Process andModeling and Measuring the Process andConsequences of Land Use ChangeConsequences of Land Use Change
Jon Erickson, Caroline HermansJon Erickson, Caroline Hermans University of VermontUniversity of VermontJohn Gowdy, Audra Nowosielski, John PolimeniJohn Gowdy, Audra Nowosielski, John Polimeni Rensselaer Polytechnic InstituteRensselaer Polytechnic InstituteKarin Limburg, Karen Stainbrook, Bongghi HongKarin Limburg, Karen Stainbrook, Bongghi Hong SUNY College of Environmental Science and ForestrySUNY College of Environmental Science and Forestry
CollaboratorsCollaborators::
David BurnsDavid Burns Dutchess County Environmental Management CouncilDutchess County Environmental Management CouncilEileen SassmanEileen Sassman Wappinger Creek Watershed Intermunicipal CouncilWappinger Creek Watershed Intermunicipal Council

The two paradigms…
The natural landscape (watershed) perspective vs the socio-economic perspective…
Separate, but in need of linkage!
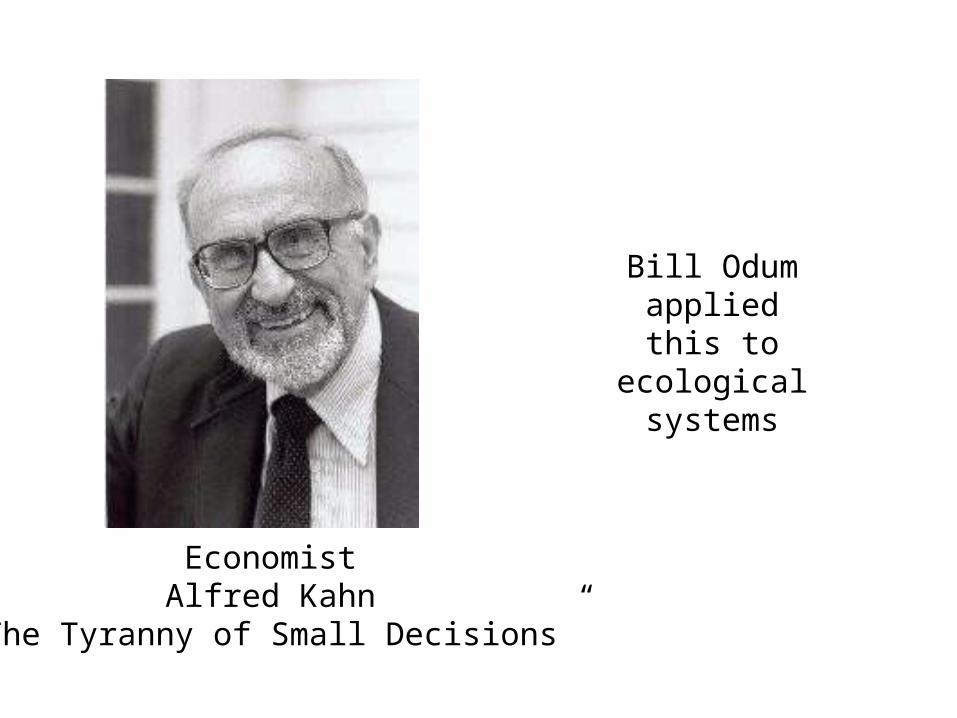
EconomistAlfred Kahn
“The Tyranny of Small Decisions”
Bill Odum applied this to ecological
systems
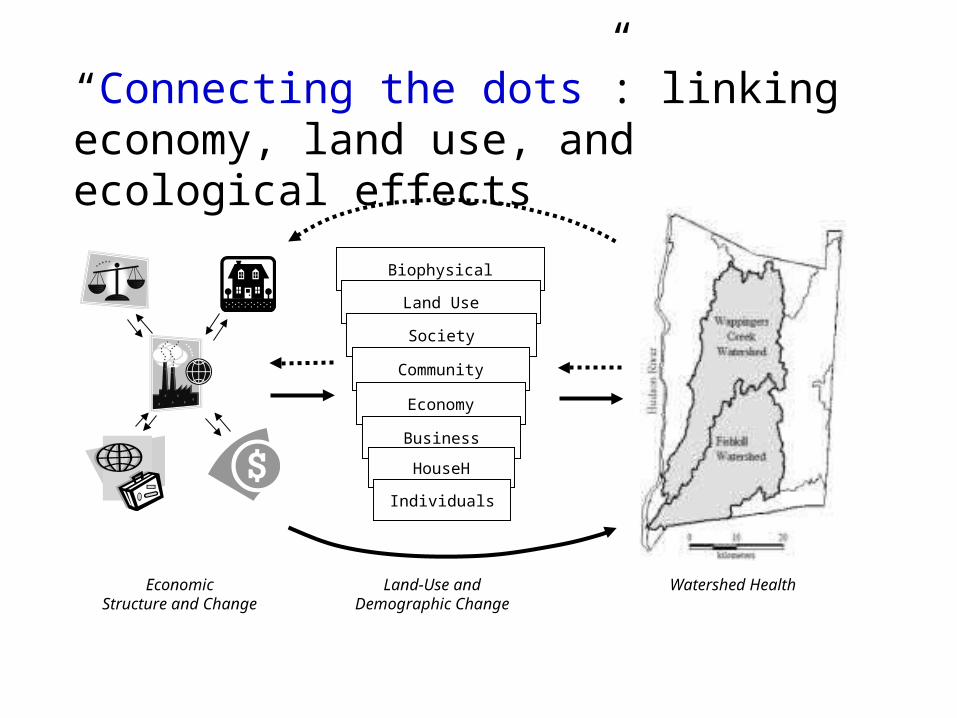
“Connecting the dots”: linking economy, land use, and ecological effects
Watershed HealthLand-Use andDemographic Change
Biophysical
Land Use
Society
Community
Economy
Business
HouseH
EconomicStructure and Change
Individuals

• How does human activity create the demand for land use change?
• How does this demand change the spatial pattern of land use?
• How does land use change affect ecosystem health?
Research Questions
What does all this mean for coastal fisheries?

The Hudson River Watershed – site of
case study
Hudson River estuary
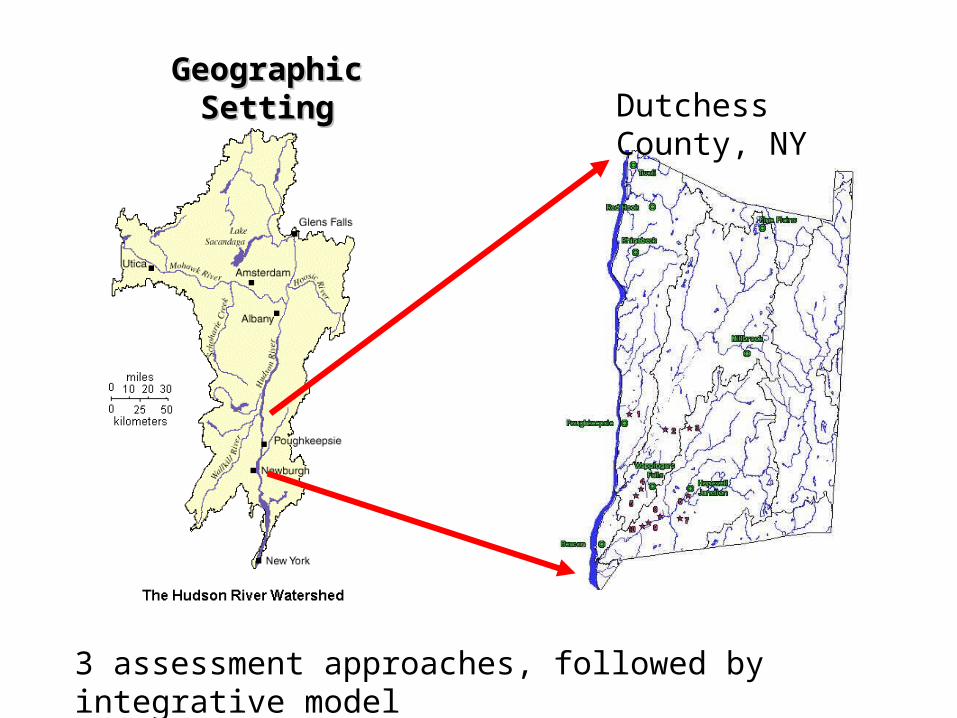
Geographic SettingGeographic SettingDutchess County, NY
3 assessment approaches, followed by integrative model

GOVERMENTGOVERMENT
OUTSIDEOUTSIDEWORLDWORLD
CAPITALCAPITALExportsExports
ImportsImports INDUSTRYINDUSTRY
HOUSEHOLDSHOUSEHOLDS
DepreciationDepreciation
InvestmentInvestment
ConsumptionConsumptionGoodsGoodsLaborLabor
Private GoodsPrivate Goods& Services& Services
PublicPublicServicesServices
County-Wide Stakeholder Workshop:
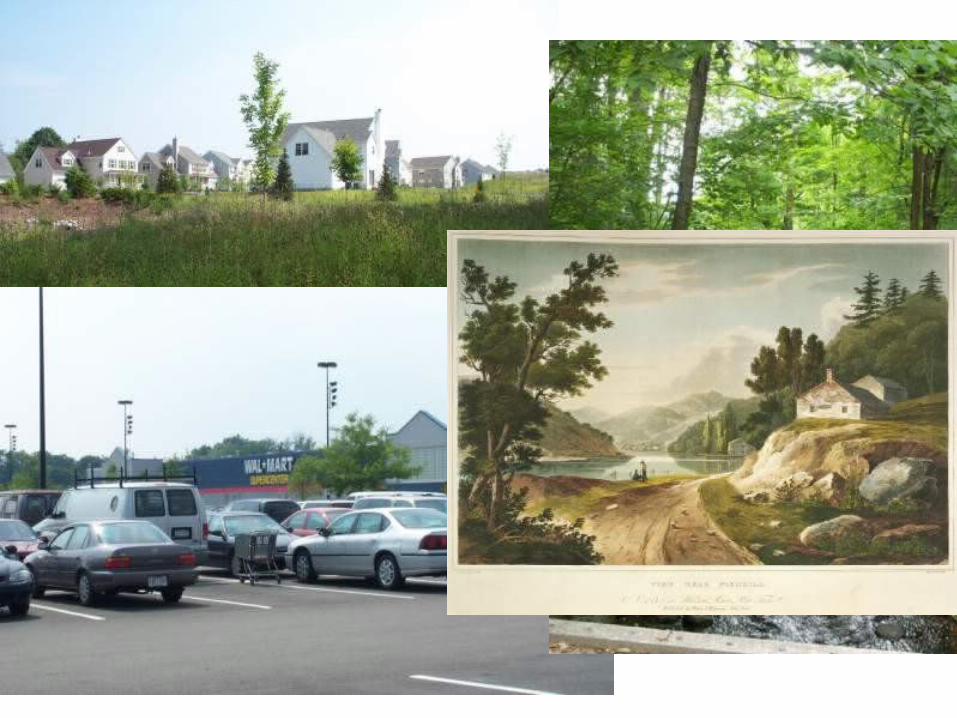
• Semi-Conductor Industry• Suburbanization• Loss of agriculture• Commuting (↑ traffic)
a) Model the economy with a Social Accounting Matrix

#1 in Value-Added#2 in Employment
Dutchess County
Semiconductor and relateddevices industry

b) Land use and demographic change
Quantifying Past & Present Condition
- Satellite maps, followed by…
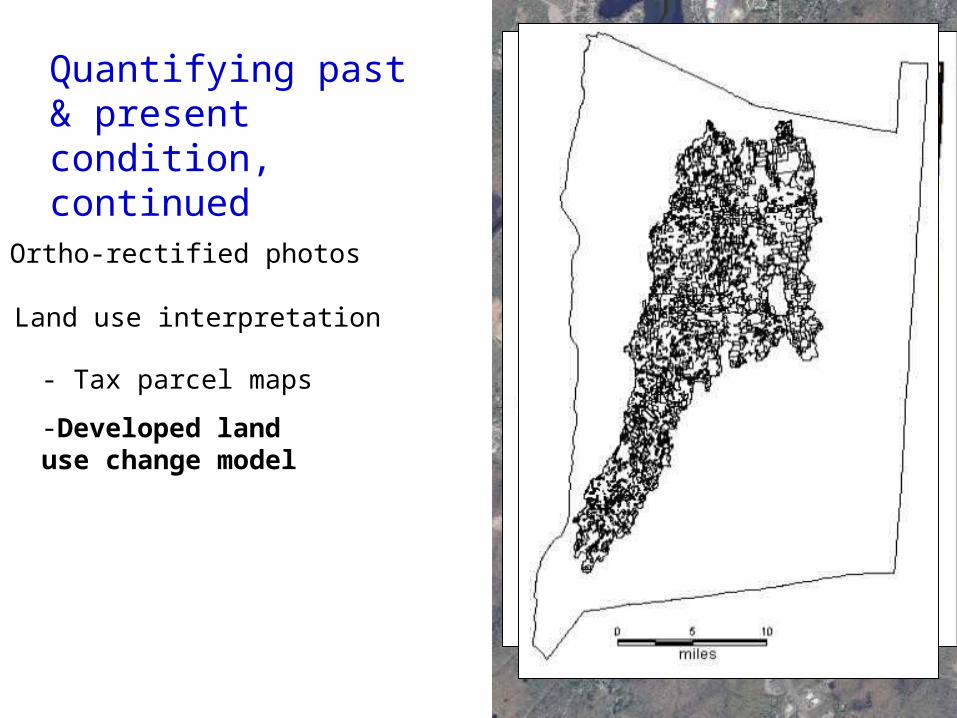
- Ortho-rectified photos
- Land use interpretation
- Tax parcel maps
-Developed land use change model
Quantifying past & present condition, continued

c) Ecosystem health (and watershed
health) maintenance of biotic integrity, resistance and/or resilience to change in the face of anthropogenic disturbance (Rapport, 1992)
includes
physical and chemical environmental quality (e.g., stream temperature, conductivity, and element concentration), biotic condition (e.g., status of fish and macroinvertebrate communities)

Assessing watershed health:
The idea: organisms and ecosystems integrate and reflect the insults (or lack thereof) resulting from watershed-level processes
Some techniques have proven robust after 25+ years of testing; others in development

Indicators of ecosystem health can (should?) evaluate changes at levels of
•Ecological population•Community/habitat•Whole-system
Metrics may not all be additive, although many schemes designed that way

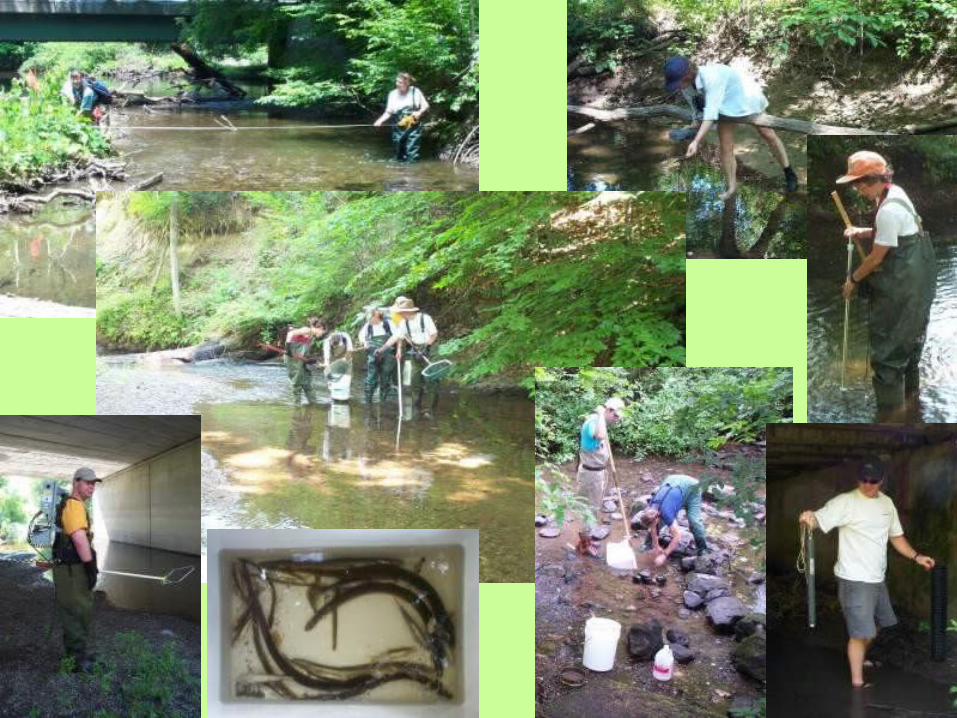
What we looked at:• physical habitat characterizations
• water chemistry
• biotic community structure (fish and macro-invertebrates)
• ecosystem function

Some results: how “healthy” are the Wappinger and Fishkill Creek watersheds?
(Fishkill is closer to NY City, more urbanized…)
Let’s look at a few diagnostics…
Land use patterns
Environmental quality patterns
Biological indicators
…includes changes over time

Assessments at different spatial scales(relates to the degree of influence)
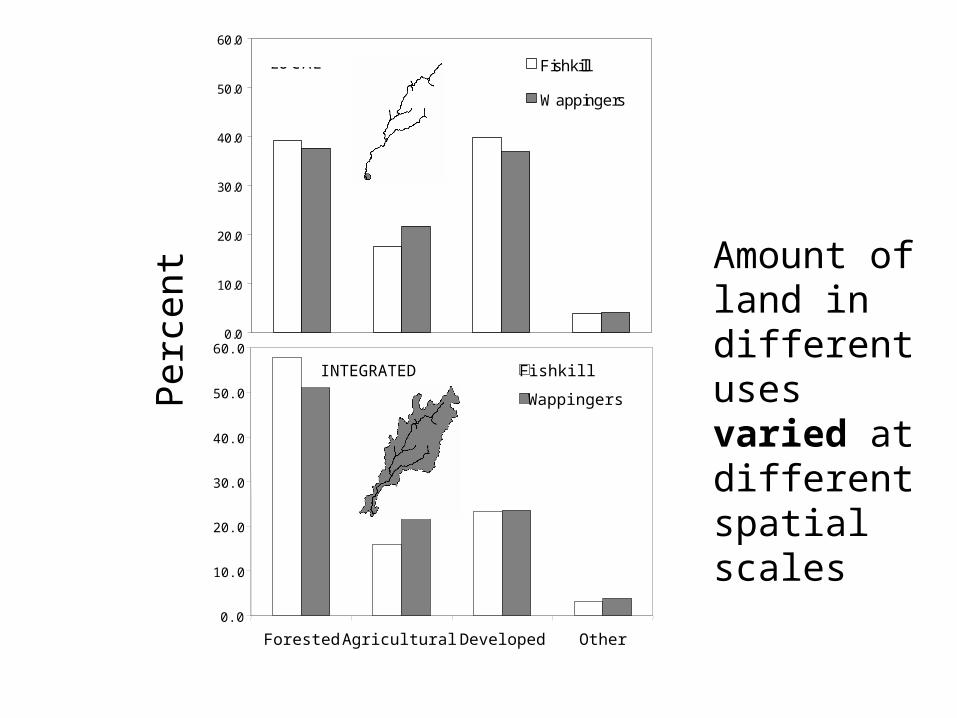
Amount of land in different uses varied at different spatial scales
Per
cent
0.0
10.0
20.0
30.0
40.0
50.0
60.0
Fishkill
Wappingers
LOCAL
0.0
10.0
20.0
30.0
40.0
50.0
60.0
Forested Agricultural Developed Other
Fishkill
Wappingers
INTEGRATED
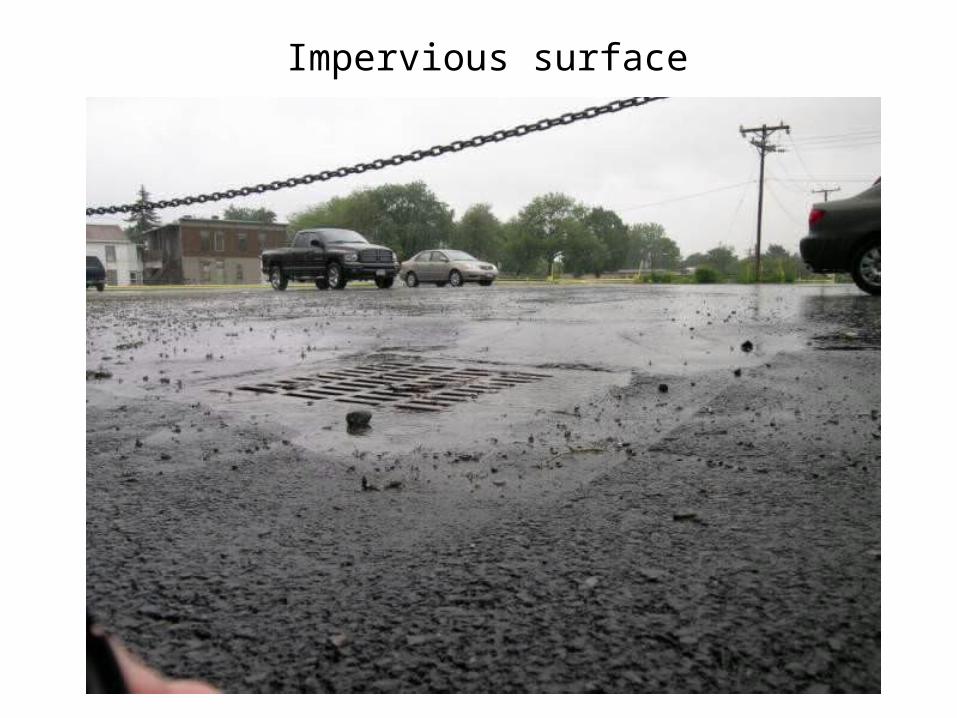
Impervious surface

0.0
2.0
4.0
6.0
8.0
10.0
12.0
14.0
Local Sub-basin IntegratedSpatial scale
Per
cent
impe
rvio
us s
urfa
ceFishkillWappingers


Water quality – an example

Conductivity – a measure of the ionic strength of water
Correlates strongly with human disturbance (population density, road density, nitrates, etc.)
Getting recognition as a bellwether of aquatic disturbance
Hudson Valley, New York
0
10
20
30
40
50
60
F-82 O-83 J-85 J-87 S-88 M-90 D-91 A-93 A-95 D-96 J-98 M-00 N-01 J-03 F-05
Date
Ch
lori
de
Co
nce
ntr
atio
n (
mg
/L)
Wappinger Creek

Biotic responses

Fish Index of Biotic Integrity (IBI)
Use fish community characteristics to assess aquatic health – composed of 12 metrics, including
• Species richness & abundance
• Indicator species (of degradation, e.g.)
• Functional role ID
• Condition and health indices
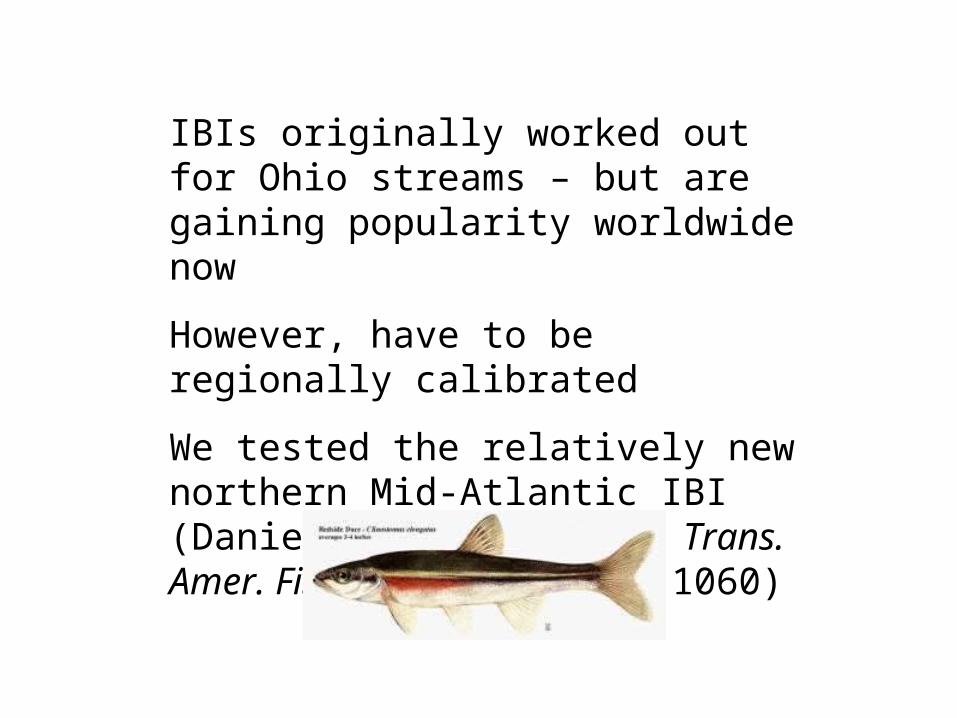
IBIs originally worked out for Ohio streams – but are gaining popularity worldwide now
However, have to be regionally calibrated
We tested the relatively new northern Mid-Atlantic IBI (Daniels et al. 2002. Trans. Amer. Fish. Soc. 131: 1044-1060)

0123456789
Ver
y P
oor
Poo
r P
oor/F
air
Fair
Fair/
Goo
d
Goo
d G
ood/
Exc
.E
xcel
lent
Nu
mb
er
of
sit
es
Fishkill
Wappinger
0123456789
10
Very
Poo
r
Poor
Po
or/F
air
Fair
Fair/
Goo
d
Goo
d G
ood/
Exc
.Ex
celle
nt
Nu
mb
er
of
sit
es
1936
2001
0
1
2
3
4
5
6
7
8
9
10
Ver
y P
oor
Poo
r P
oor/
Fair
Fair
Fair/
Goo
d
Goo
d G
ood/
Exc
.
Exc
elle
nt
Nu
mb
er
of
sit
es
1936
2001
Fishkill Wappinger
IBIs over time…
Similar results w/ macroinvertebrate
analyses

Stable Isotope Analysis.
A big field of research in everything from meteorology to archaeology, geology to food science, ecology to physiology
Basically a way to trace how elements move from one compound to another, or from one chemical state to another
In ecology, we often use Carbon and Nitrogen stable isotope ratios as tracers of matter in food webs – and can also be used to trace migrating animals – and things like pollution…

Less urbanized More urbanized
Stable isotope analysis of a “sentinel species” blacknose dace

Evidence of any threshold effects?
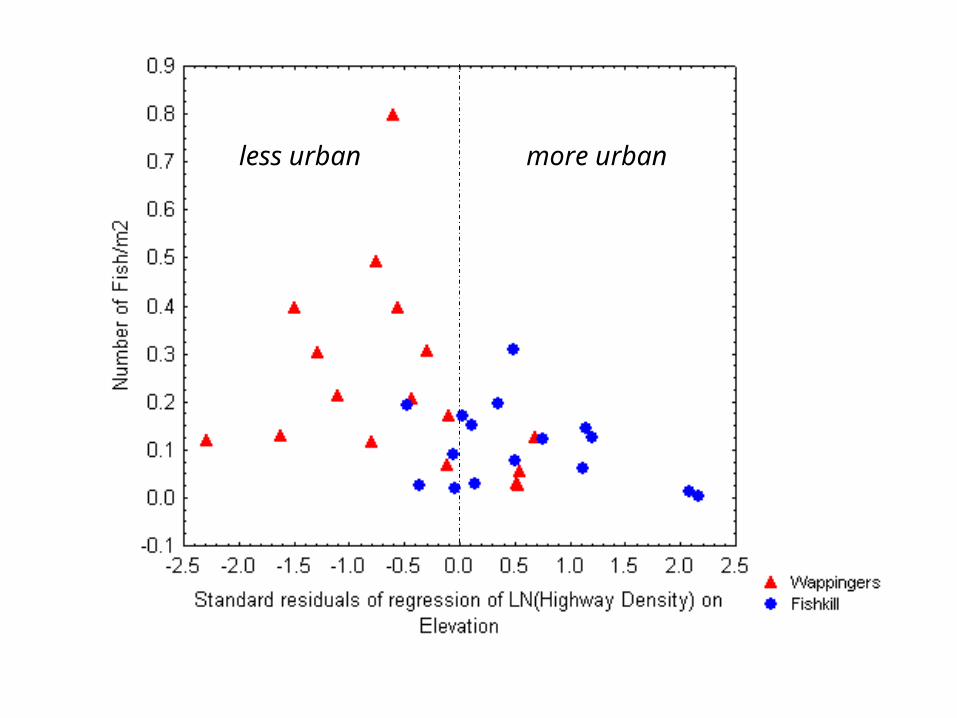
less urban more urban

Social Accounting Matrix(Input-output Model)
Binary Logit Regression Model
Integrating through models
Multiple Linear Regression Model
Nowosielski (2002) Polimeni (2002) Stainbrook (2004)
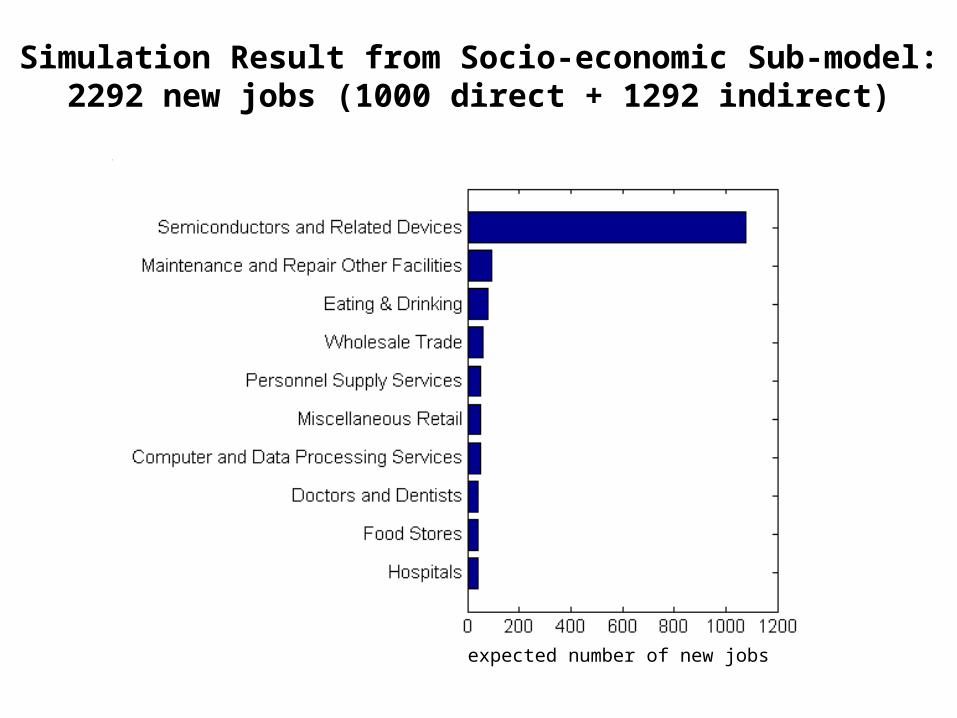
Simulation Result from Socio-economic Sub-model:2292 new jobs (1000 direct + 1292 indirect)
expected number of new jobs

124,549 “Tax Parcels” within Dutchess County
Land Use Change Sub-model

Properties of Tax Parcels

Reclassified: Residential vs Vacant

Input Spatial Dataset(Independent Variables for Binary Logit Model)
NeighborhoodIndex
Distance to Central Business District
Total Assessment
Value
Change in Income
Change in Population
Minimum Lot Size Requirement
Protected LandsSteep AreaWetlandsHydric Soils
Possible Restriction to Development
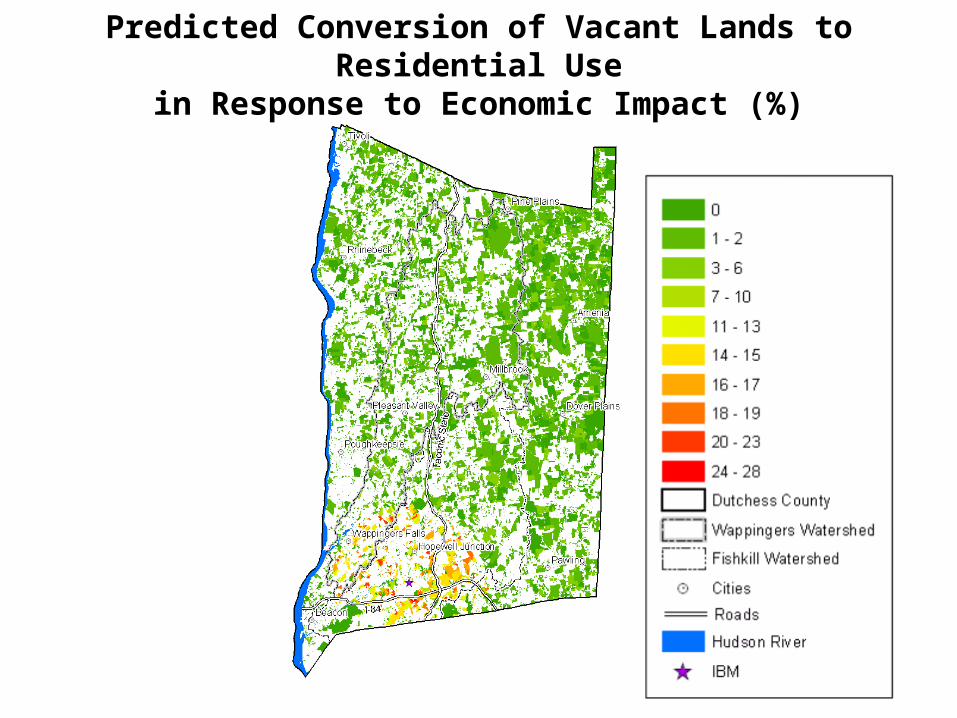
Predicted Conversion of Vacant Lands to Residential Usein Response to Economic Impact (%)

Expected Change in Land Use due to Economic Impact

NAWQA (National Water Quality Assessment) Dataset:Correlation with Percent Urban Land Use
correlation coefficient

Result from Ecosystem Health Sub-model:Reduced Stream Water Quality and Species Diversity
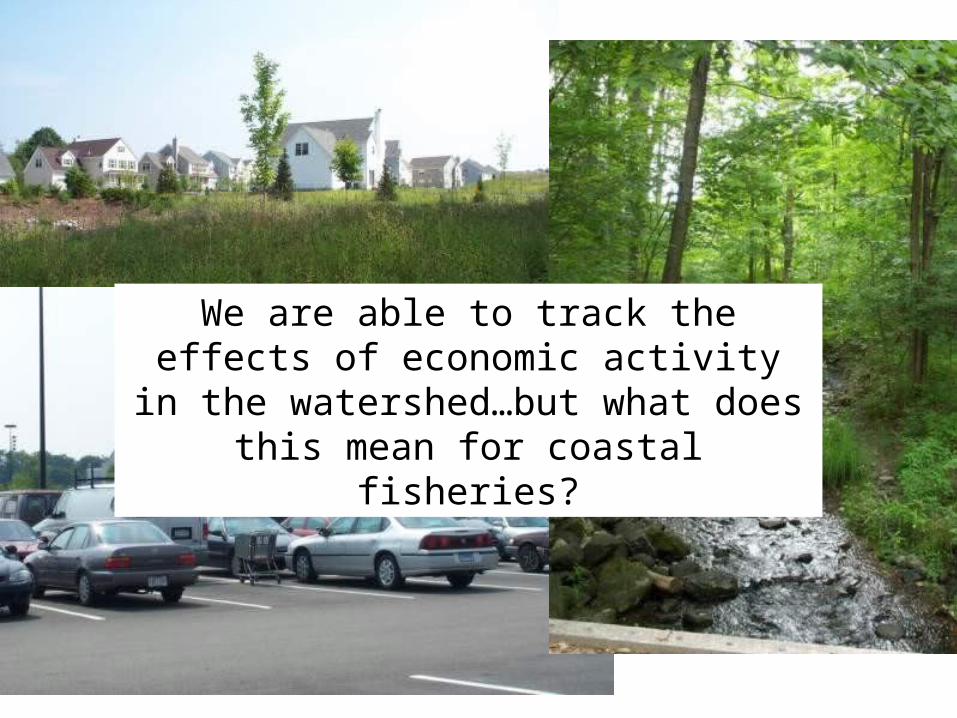
We are able to track the effects of economic activity in the watershed…but
what does this mean for coastal fisheries?

Chesapeake Bay
Mississippi R. watershed and “The Dead Zone”
It’s a matter of scale…
Image sources: NOAA and Virginia Inst. of Marine Science

Fish & Fisheries declines
Diaz, et al. 2004
Hypoxia increasing
Year1840 1860 1880 1900 1920 1940 1960 1980 2000 2020
To
tal R
ea
ctiv
e N
(T
era
gra
ms)
Cu
mu
lativ
e s
yste
ms
rep
ort
ing
hyp
oxi
a
0
50
100
150
200
Nitrogen
Hypoxia

Eutrophication severity (chl)Pela
gic
:dem
ers
al ra
tio
Caddy 2000, de Leiva Moreno 2000
System-wide effects?
Eutrophication severity
Fish
eri
es
lan
din
gs
Caddy 1993
hypoxia
020406080100120140160
0 100 200 300 400 500
PRIMARY PRODUCTION, g C m-2 y-1
AN
NU
AL
FISH
ER
Y
LAN
DIN
G, K
g H
a-1
Nixon 2002

1850 1900 1950 2000
*not including dams missing dates
Dams Over Time*
Data from BASINS software

Is a new paradigm needed?
We (all of us!) need a new way of VALUING the environment.
Not just the $$$...
Connecting the dots…de rode draad
Evaluate ecosystem services…
Evaluate the trade-offs…

Thank you!