modeling and interpretation of the uv, optical and ir
TRANSCRIPT
Stéphane Charlot (IAP/MPA)
Modeling and Interpretation of the UV, Optical and IR Emission from Galaxies
Context
UV UV opticaloptical midIR midIR farIRfarIR
Stars dustStars dust
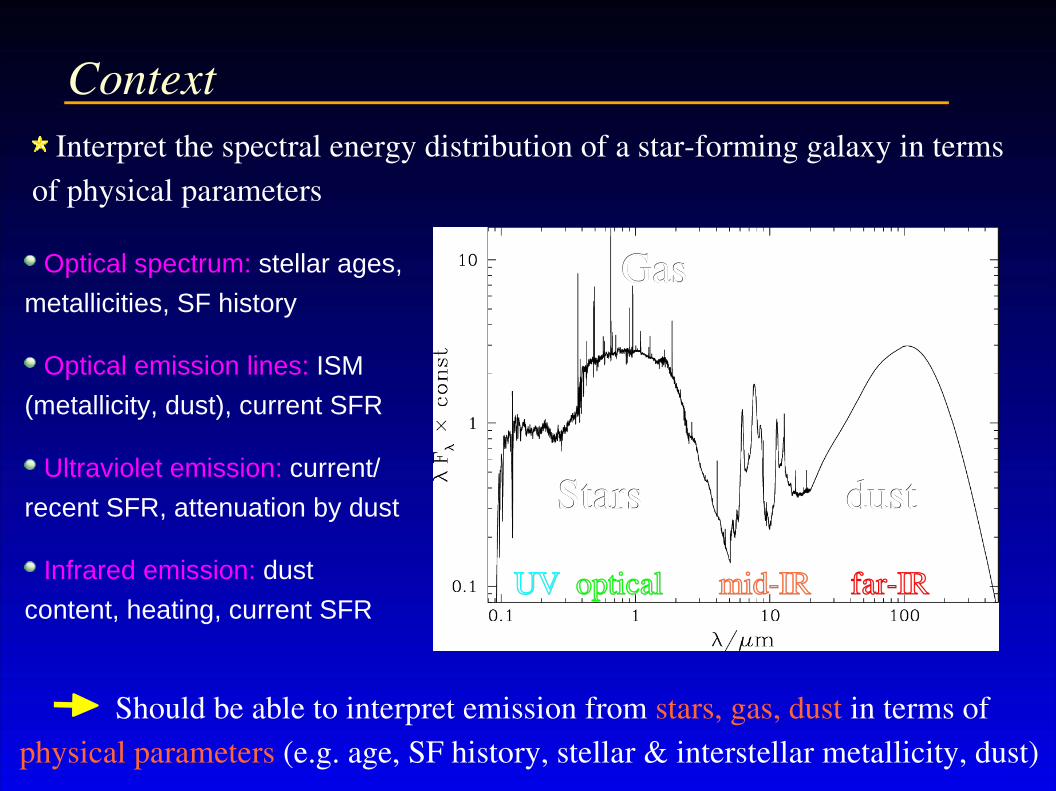
Interpret the spectral energy distribution of a starforming galaxy in terms of physical parameters
Should be able to interpret emission from stars, gas, dust in terms of physical parameters (e.g. age, SF history, stellar & interstellar metallicity, dust)
GasGas Optical spectrum: stellar ages,
metallicities, SF history
Optical emission lines: ISM
(metallicity, dust), current SFR
Ultraviolet emission: current/
recent SFR, attenuation by dust
Infrared emission: dust
content, heating, current SFR
Context
UV UV opticaloptical midIR midIR farIRfarIR
Stars dustStars dust
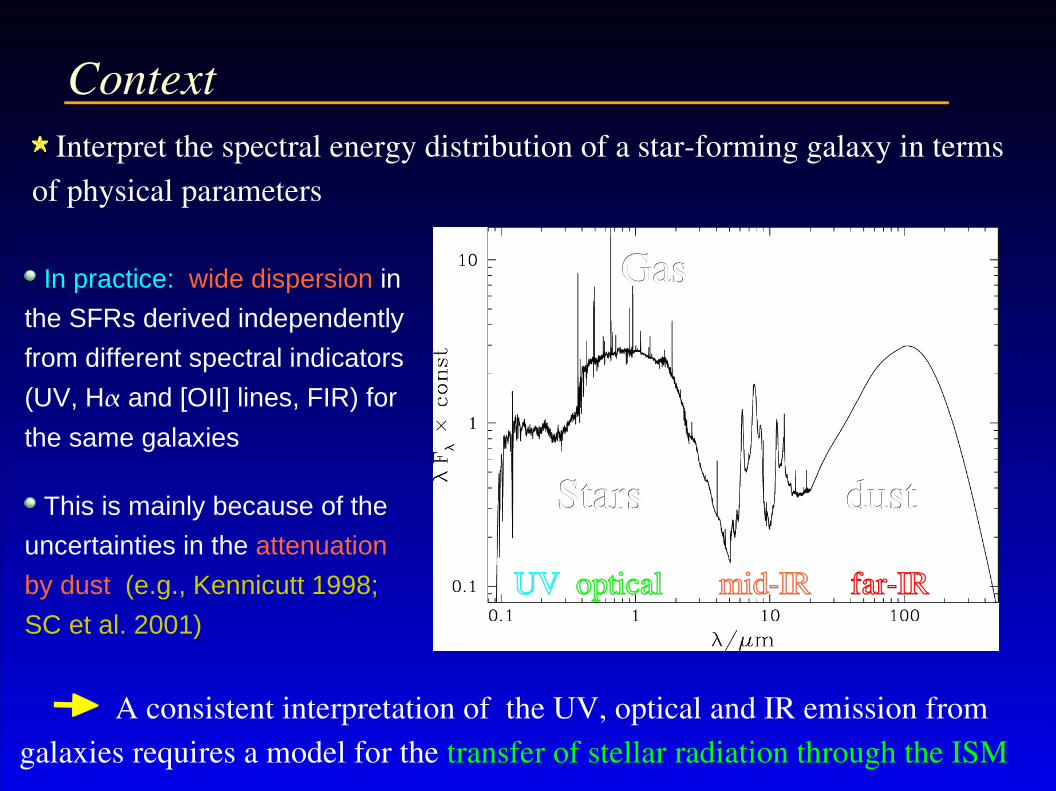
A consistent interpretation of the UV, optical and IR emission from galaxies requires a model for the transfer of stellar radiation through the ISM
GasGas In practice: wide dispersion in
the SFRs derived independently
from different spectral indicators
(UV, H and [OII] lines, FIR) for
the same galaxies
This is mainly because of the
uncertainties in the attenuation
by dust (e.g., Kennicutt 1998;
SC et al. 2001)
Interpret the spectral energy distribution of a starforming galaxy in terms of physical parameters
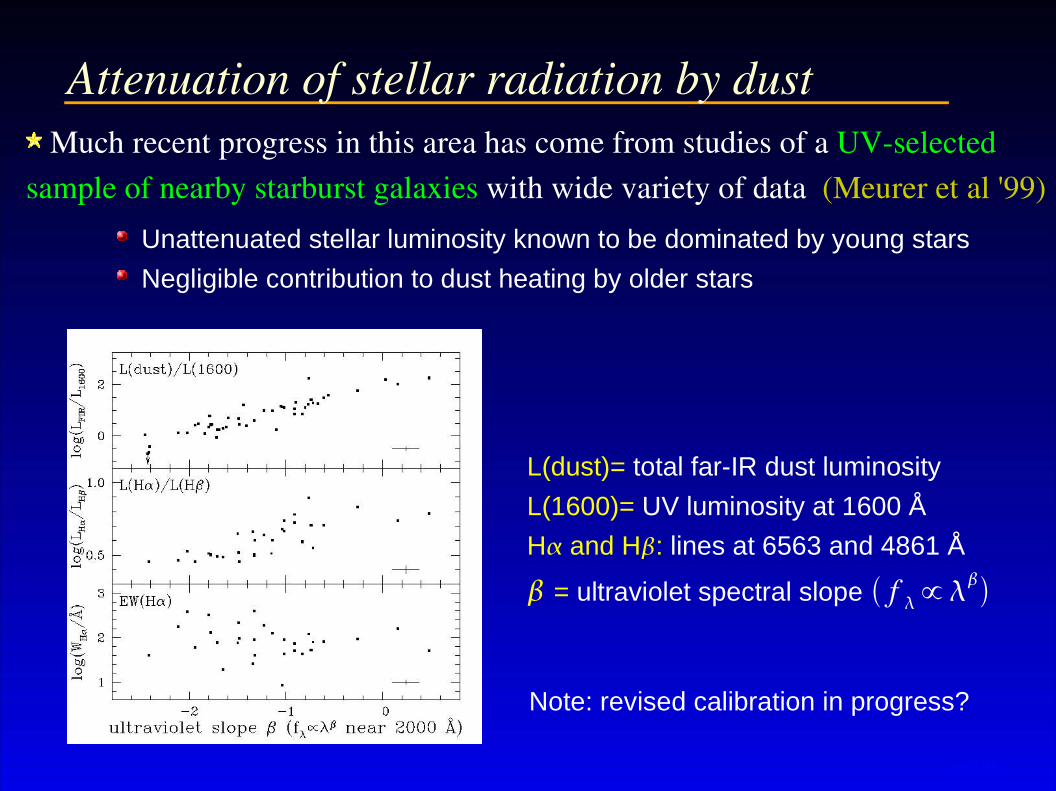
Much recent progress in this area has come from studies of a UVselected sample of nearby starburst galaxies with wide variety of data (Meurer et al '99)
Attenuation of stellar radiation by dust
f ∝
Unattenuated stellar luminosity known to be dominated by young stars
Negligible contribution to dust heating by older stars
L(dust)= total far-IR dust luminosity
L(1600)= UV luminosity at 1600 Å
H and H: lines at 6563 and 4861 Å
= ultraviolet spectral slope
Note: revised calibration in progress?
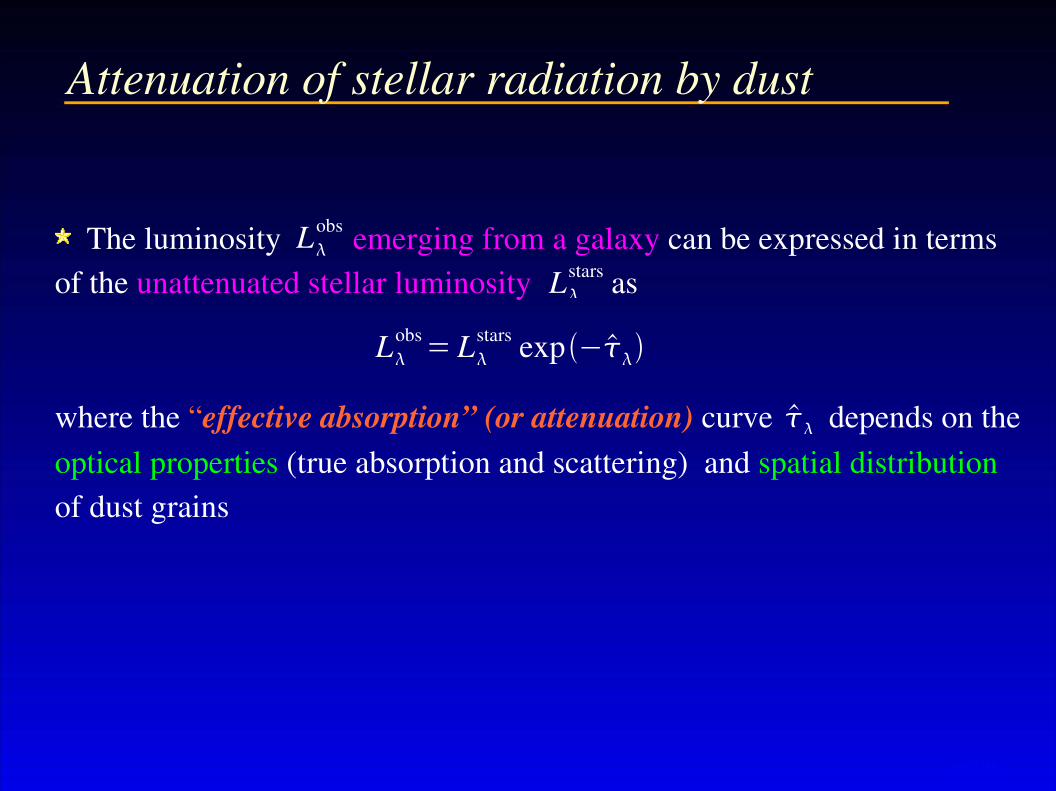
The luminosity emerging from a galaxy can be expressed in terms of the unattenuated stellar luminosity as where the “effective absorption” (or attenuation) curve depends on the optical properties (true absorption and scattering) and spatial distribution of dust grains
Lobs
Lstars
Lobs= L
stars exp−
Attenuation of stellar radiation by dust
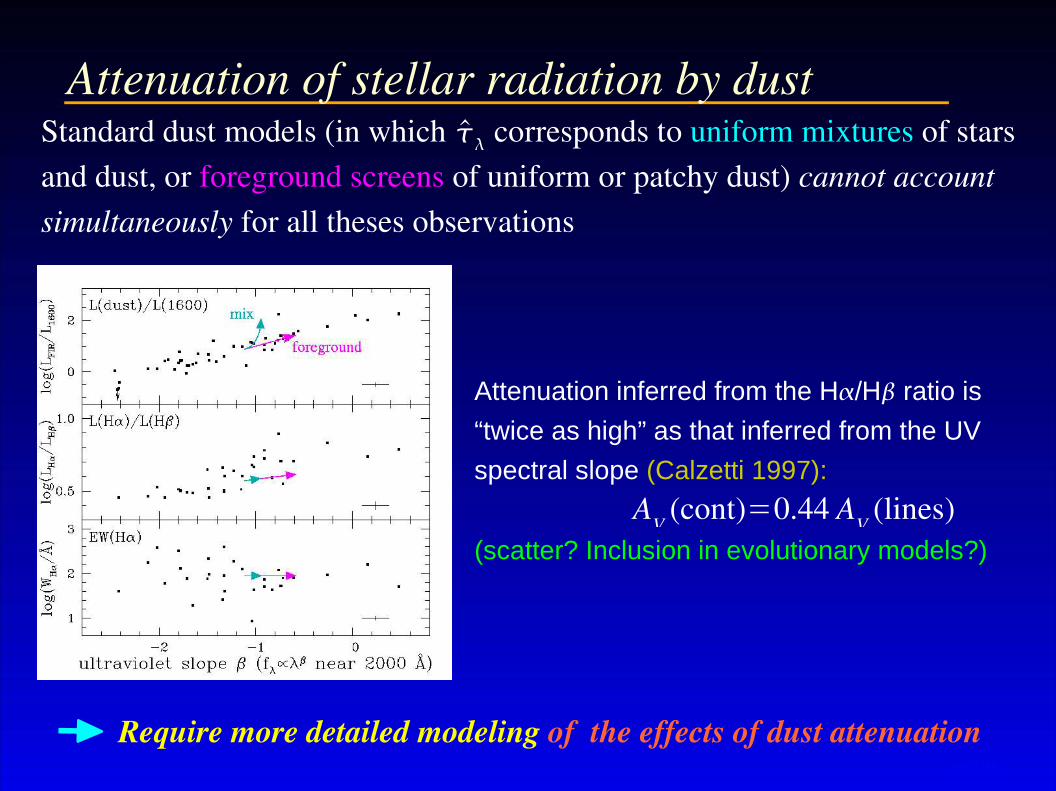
Standard dust models (in which corresponds to uniform mixtures of stars and dust, or foreground screens of uniform or patchy dust) cannot account simultaneously for all theses observations
Require more detailed modeling of the effects of dust attenuation
AV (cont)=0.44 AV (lines)
Attenuation of stellar radiation by dust
Attenuation inferred from the H /H ratio is “twice as high” as that inferred from the UV
spectral slope (Calzetti 1997):
(scatter? Inclusion in evolutionary models?)
Models of the UV, optical and IR emission
At least 4 categories of models developed to interpret the multiwavelength properties of galaxies in terms of stars, gas and dust parameters
(1) Monte Carlo radiative transfer models
(2) Radiative transfer models based on analytic approximations
(3) Radiative transfer models with spectral evolution of stellar populations
(4) Models combining dust physics, radiative transfer and spectral evolution
Monte Carlo radiative transfer models
Stateoftheart model of Witt, Gordon, Misselt and collaborators (DIRTY)
Compute the radiative transfer of photons through arbitrary distributions of dust
(typically a 2-phase clumpy medium in a 3D grid)
Compute dust re-emission self-consistently with absorption and scattering:
thermal equilibrium emission from large grains, and emission from small grains
(and large PAH molecules) undergoing temperature fluctuations
Recently applied to investigate the different effects of dust attenuation on the
photometric properties of the bulges and disks of late-type spiral galaxies (Pierini
et al. 2004) ⇒ importance of scattering and orientation effects
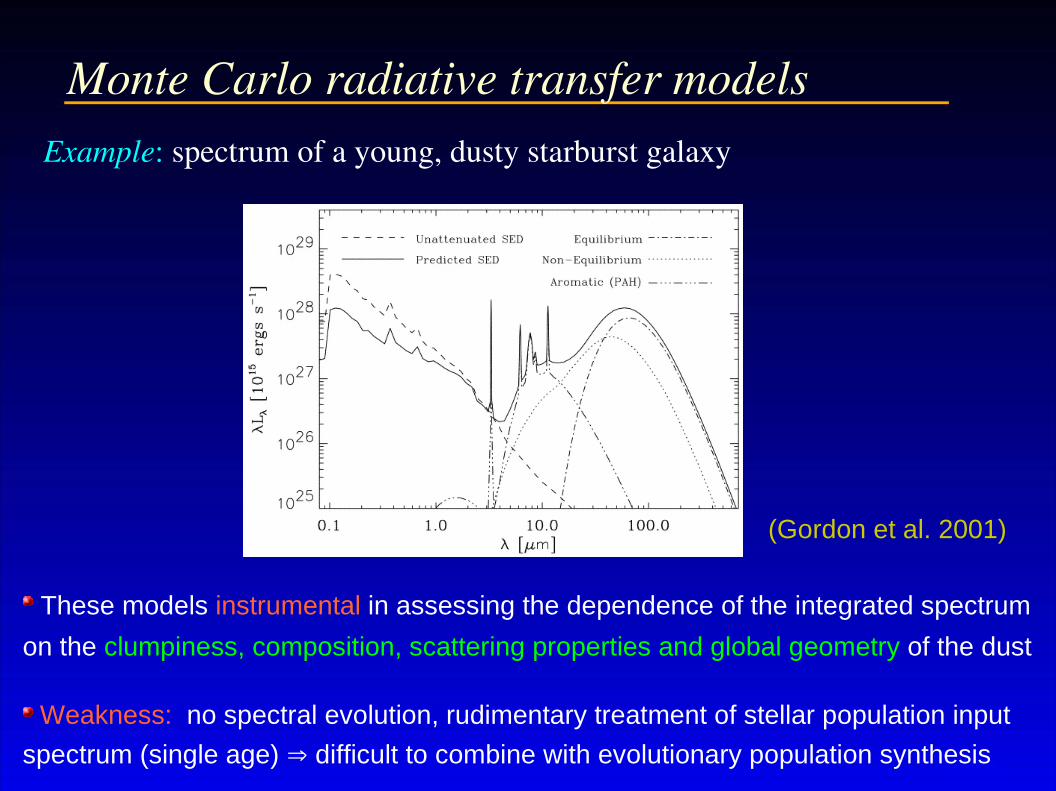
Monte Carlo radiative transfer modelsExample: spectrum of a young, dusty starburst galaxy
(Gordon et al. 2001)
These models instrumental in assessing the dependence of the integrated spectrum
on the clumpiness, composition, scattering properties and global geometry of the dust
Weakness: no spectral evolution, rudimentary treatment of stellar population input
spectrum (single age) ⇒ difficult to combine with evolutionary population synthesis
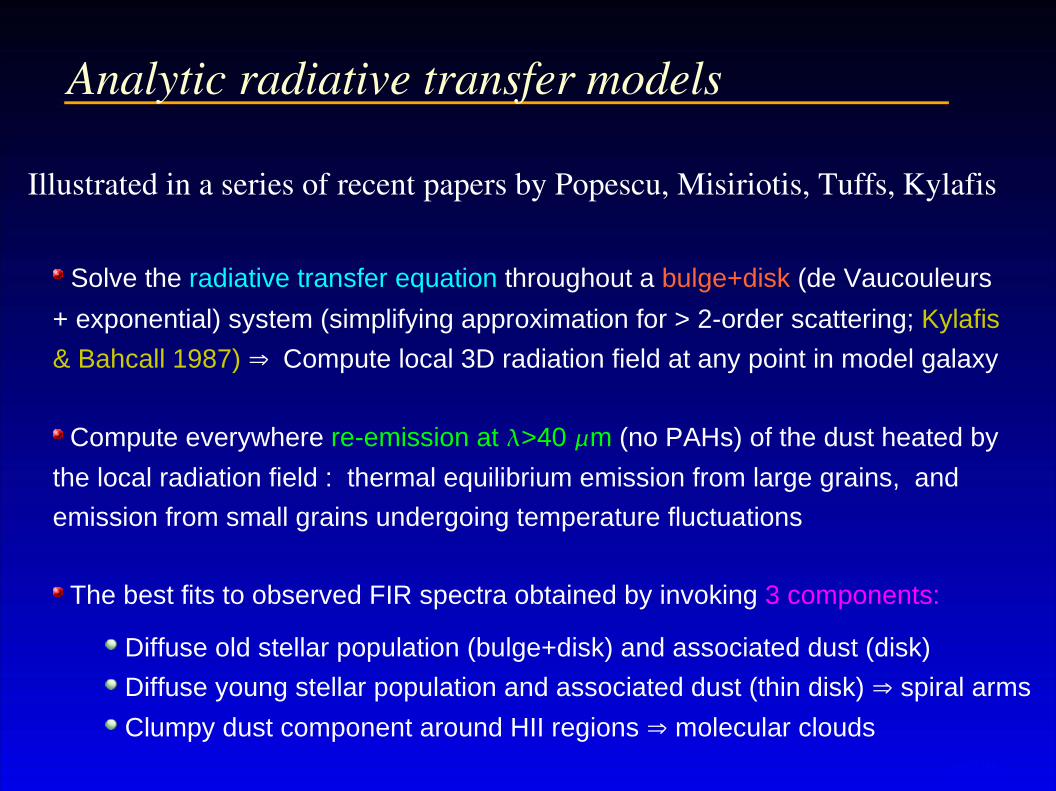
Analytic radiative transfer models
Illustrated in a series of recent papers by Popescu, Misiriotis, Tuffs, Kylafis
Solve the radiative transfer equation throughout a bulge+disk (de Vaucouleurs
+ exponential) system (simplifying approximation for > 2-order scattering; Kylafis
& Bahcall 1987) ⇒ Compute local 3D radiation field at any point in model galaxy
Compute everywhere re-emission at >40 m (no PAHs) of the dust heated by
the local radiation field : thermal equilibrium emission from large grains, and
emission from small grains undergoing temperature fluctuations
The best fits to observed FIR spectra obtained by invoking 3 components:
Diffuse old stellar population (bulge+disk) and associated dust (disk)
Diffuse young stellar population and associated dust (thin disk) ⇒ spiral arms
Clumpy dust component around HII regions ⇒ molecular clouds
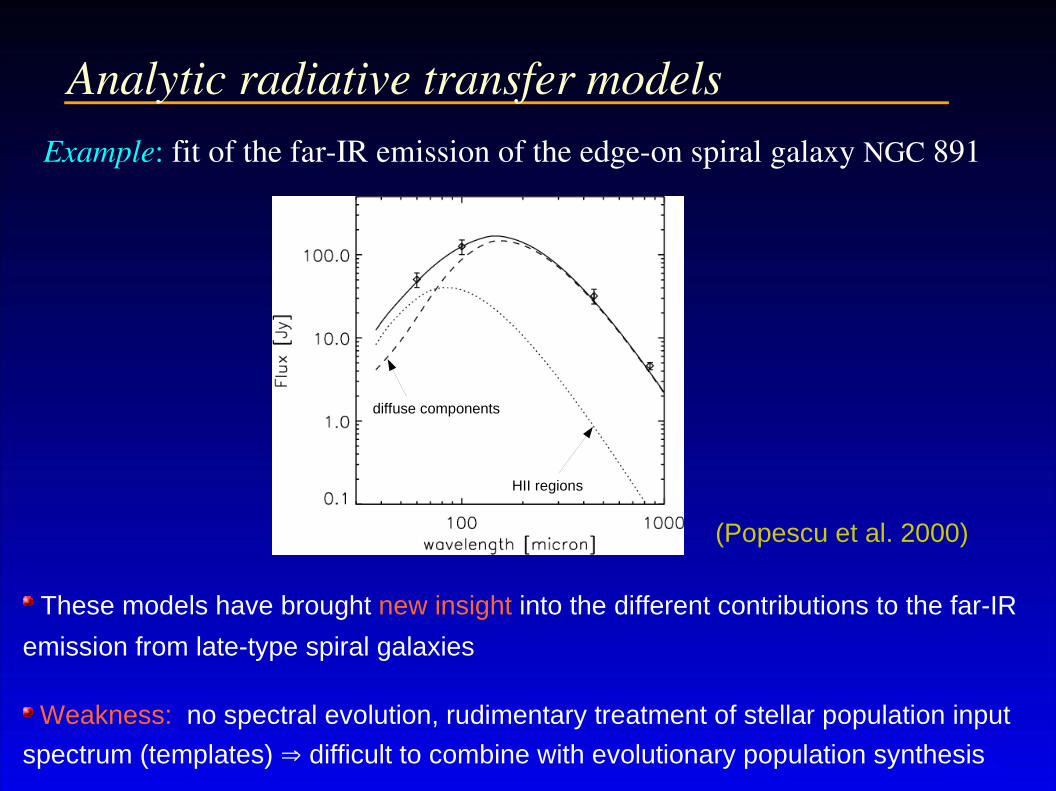
Example: fit of the farIR emission of the edgeon spiral galaxy NGC 891
(Popescu et al. 2000)
These models have brought new insight into the different contributions to the far-IR
emission from late-type spiral galaxies
Weakness: no spectral evolution, rudimentary treatment of stellar population input
spectrum (templates) ⇒ difficult to combine with evolutionary population synthesis
Analytic radiative transfer models
diffuse components
HII regions
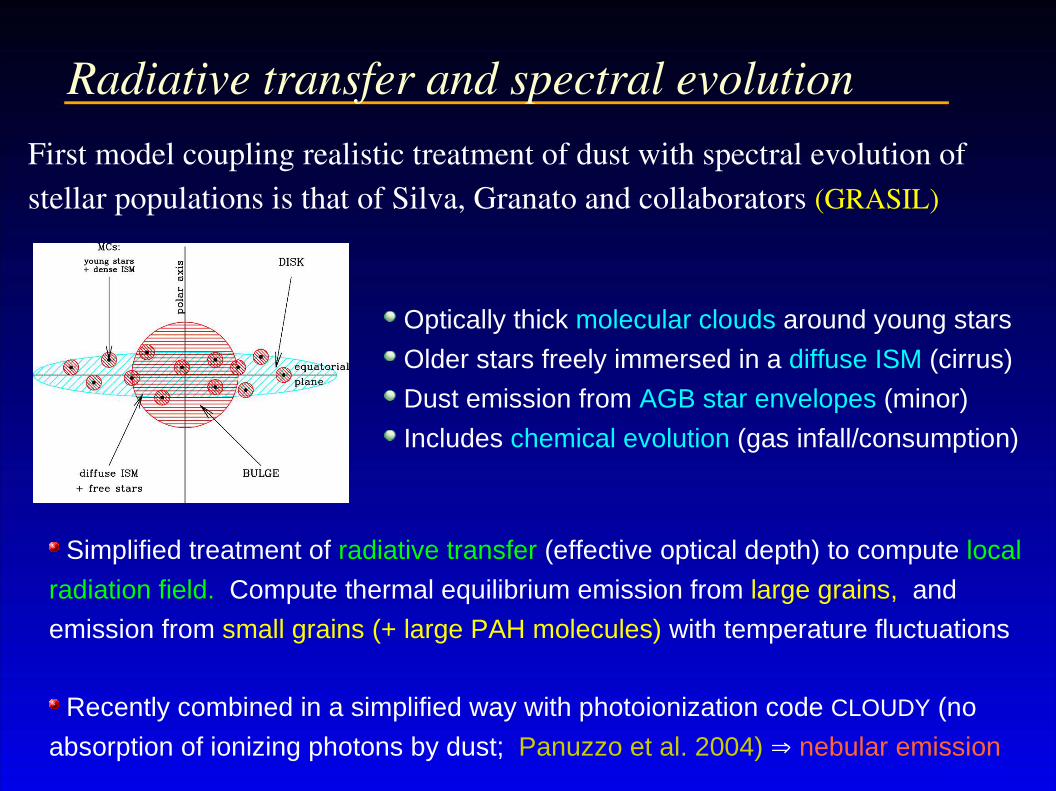
Simplified treatment of radiative transfer (effective optical depth) to compute local
radiation field. Compute thermal equilibrium emission from large grains, and
emission from small grains (+ large PAH molecules) with temperature fluctuations
Recently combined in a simplified way with photoionization code CLOUDY (no
absorption of ionizing photons by dust; Panuzzo et al. 2004) ⇒ nebular emission
Radiative transfer and spectral evolutionFirst model coupling realistic treatment of dust with spectral evolution of stellar populations is that of Silva, Granato and collaborators (GRASIL)
Optically thick molecular clouds around young stars
Older stars freely immersed in a diffuse ISM (cirrus)
Dust emission from AGB star envelopes (minor)
Includes chemical evolution (gas infall/consumption)
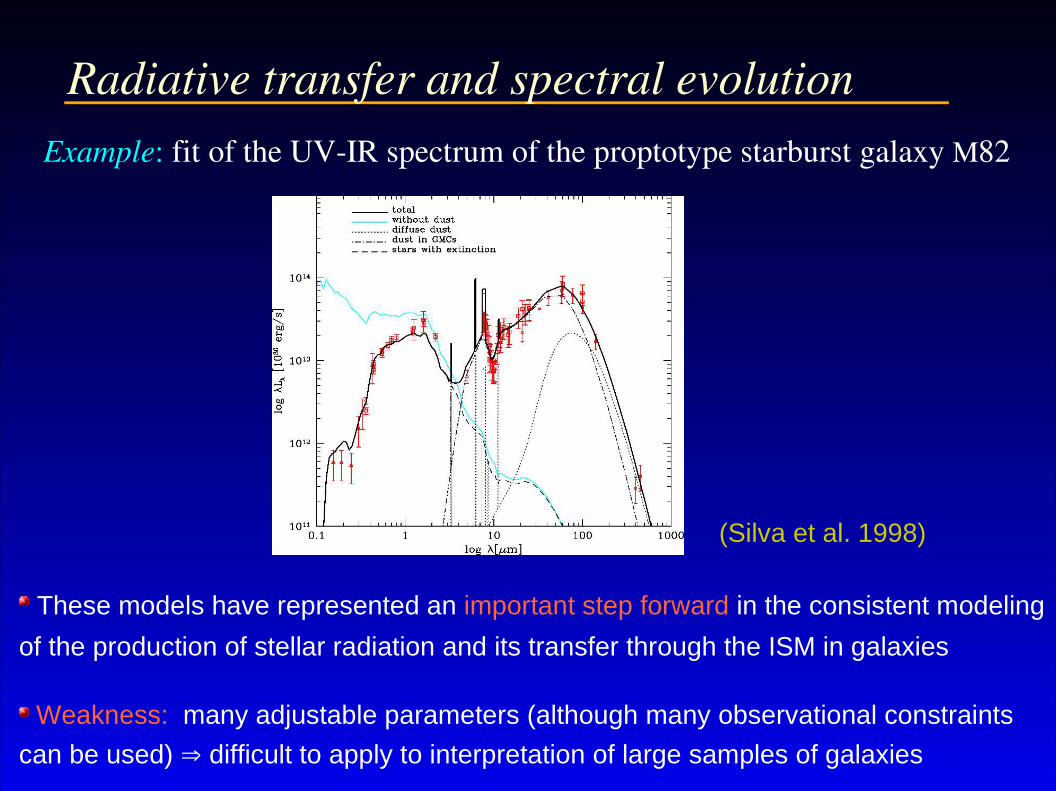
Example: fit of the UVIR spectrum of the proptotype starburst galaxy M82
(Silva et al. 1998)
These models have represented an important step forward in the consistent modeling
of the production of stellar radiation and its transfer through the ISM in galaxies
Weakness: many adjustable parameters (although many observational constraints
can be used) ⇒ difficult to apply to interpretation of large samples of galaxies
Radiative transfer and spectral evolution
Include the effects of the dynamical expansion of HII regions (as driven by
winds & supernovae) on the spectra of young (<100 Myr) starburst galaxies
Compute emission by dust in a self-consistent way (MAPPINGS), including PAH
emission from the inner regions of molecular shells (photodissociation regions;
the PAHs are photodestructed in the ionized gas)
Note: does not (yet) include emission by dust in the diffuse ISM
Radiative transfer, dust physics, and evolution
Recent model of Dopita, Groves & collaborators (MAPPINGS/STARBURST99)
HII regions surrounded by opaque molecular shells with finite lifetimes
The entire starburst region baded in a warm, dusty, diffuse ISM
Expansion of an HII region set by the pressure (density) of the diffuse ISM
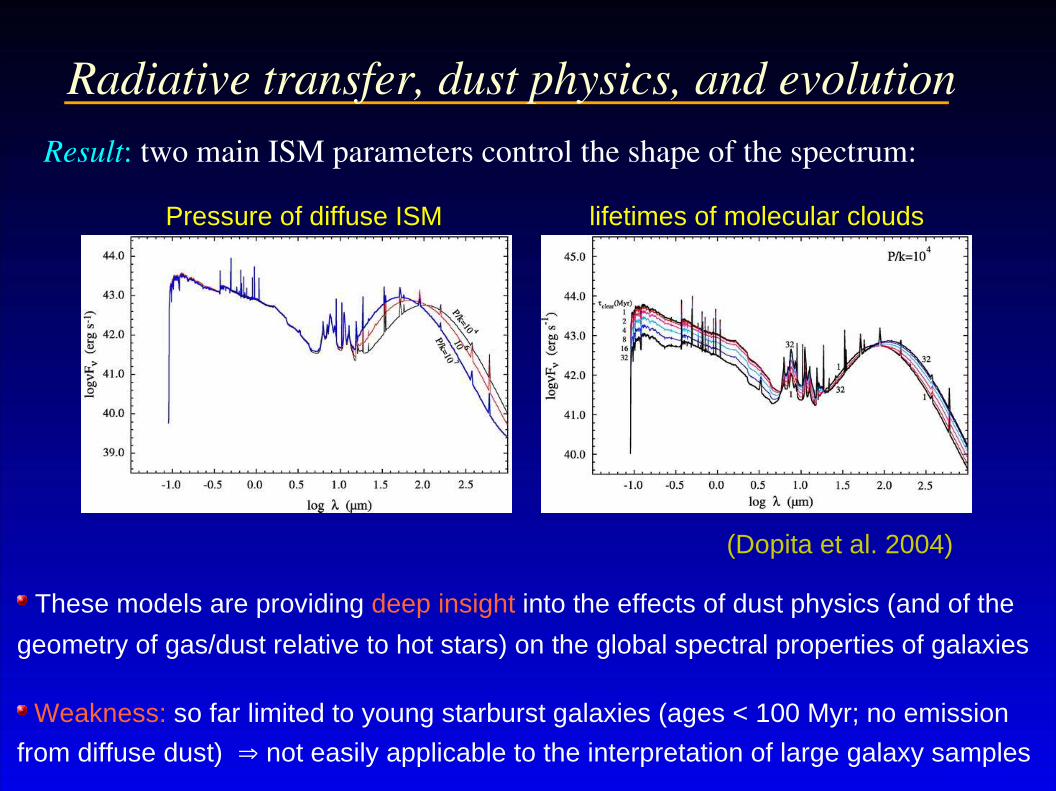
Result: two main ISM parameters control the shape of the spectrum:
(Dopita et al. 2004)
These models are providing deep insight into the effects of dust physics (and of the
geometry of gas/dust relative to hot stars) on the global spectral properties of galaxies
Weakness: so far limited to young starburst galaxies (ages < 100 Myr; no emission
from diffuse dust) ⇒ not easily applicable to the interpretation of large galaxy samples
Radiative transfer, dust physics, and evolution
Pressure of diffuse ISM lifetimes of molecular clouds
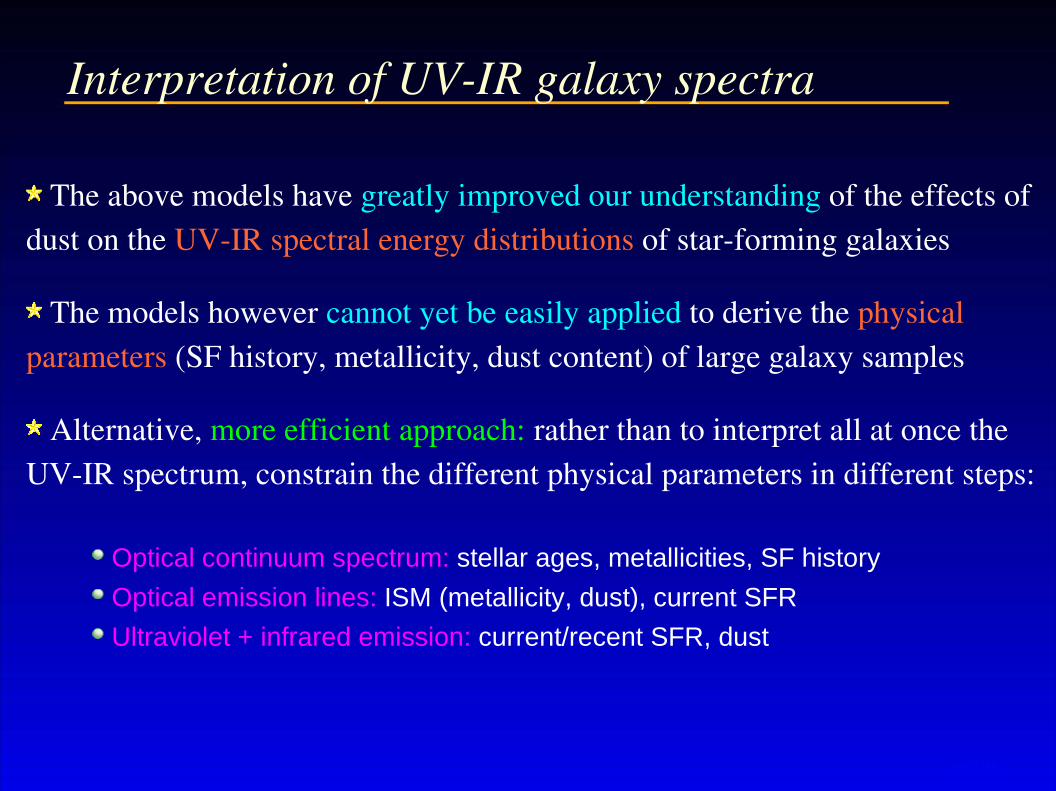
Interpretation of UVIR galaxy spectra
The above models have greatly improved our understanding of the effects of dust on the UVIR spectral energy distributions of starforming galaxies
The models however cannot yet be easily applied to derive the physical parameters (SF history, metallicity, dust content) of large galaxy samples
Alternative, more efficient approach: rather than to interpret all at once the UVIR spectrum, constrain the different physical parameters in different steps:
Optical continuum spectrum: stellar ages, metallicities, SF history
Optical emission lines: ISM (metallicity, dust), current SFR
Ultraviolet + infrared emission: current/recent SFR, dust
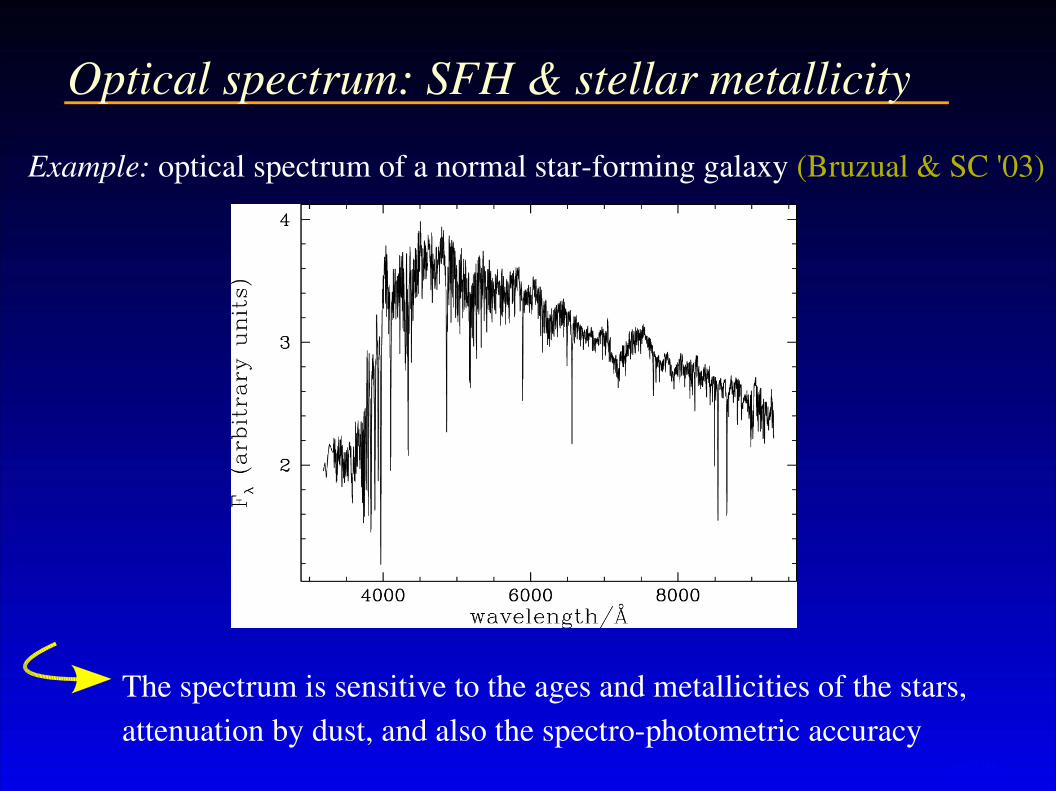
Optical spectrum: SFH & stellar metallicityExample: optical spectrum of a normal starforming galaxy (Bruzual & SC '03)
The spectrum is sensitive to the ages and metallicities of the stars, attenuation by dust, and also the spectrophotometric accuracy
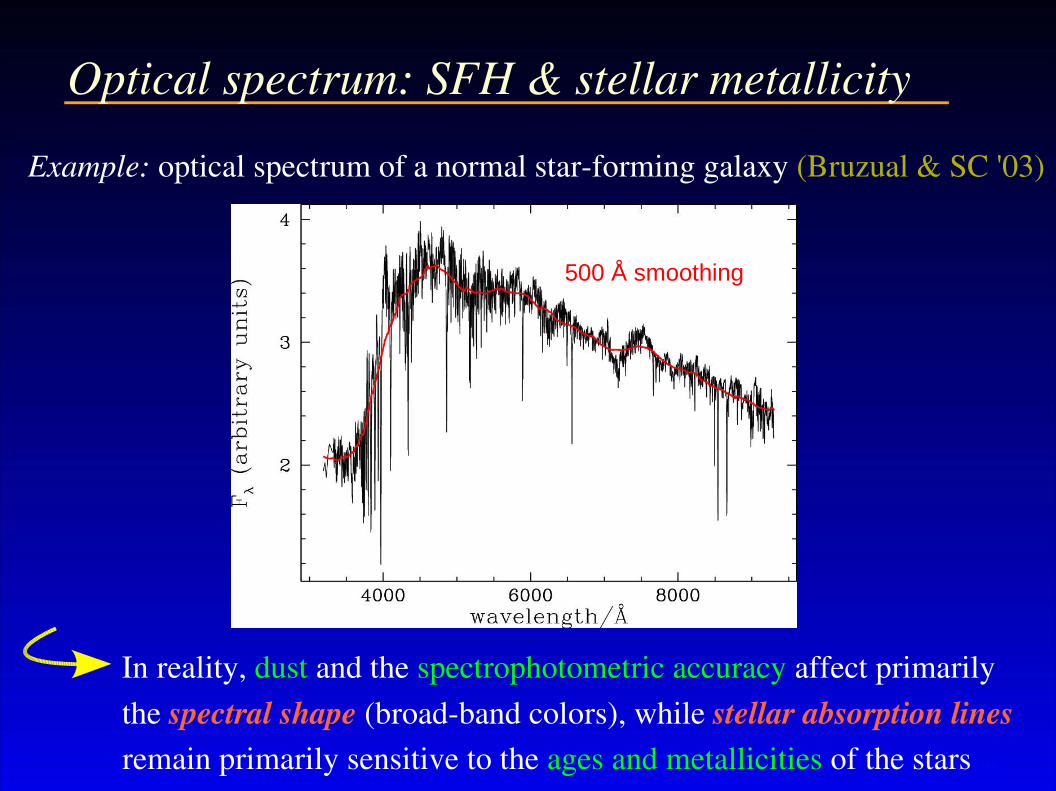
Optical spectrum: SFH & stellar metallicityExample: optical spectrum of a normal starforming galaxy (Bruzual & SC '03)
In reality, dust and the spectrophotometric accuracy affect primarily the spectral shape (broadband colors), while stellar absorption lines remain primarily sensitive to the ages and metallicities of the stars
500 Å smoothing
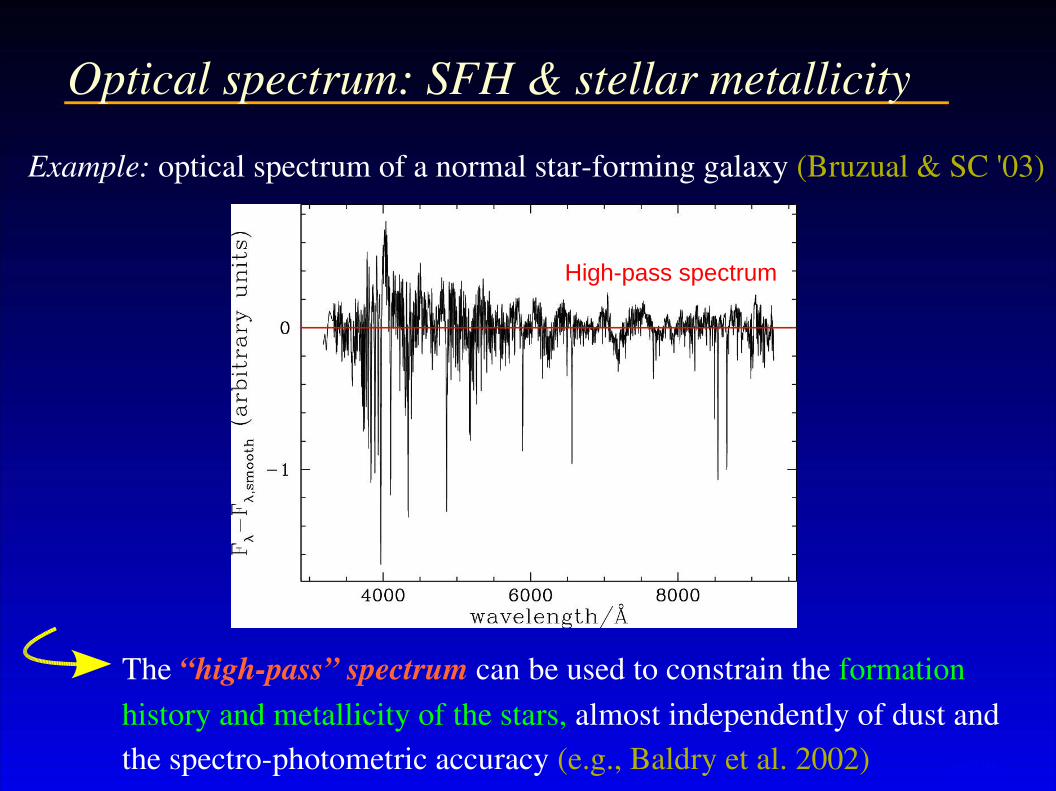
Optical spectrum: SFH & stellar metallicityExample: optical spectrum of a normal starforming galaxy (Bruzual & SC '03)
The “highpass” spectrum can be used to constrain the formation history and metallicity of the stars, almost independently of dust and the spectrophotometric accuracy (e.g., Baldry et al. 2002)
High-pass spectrum
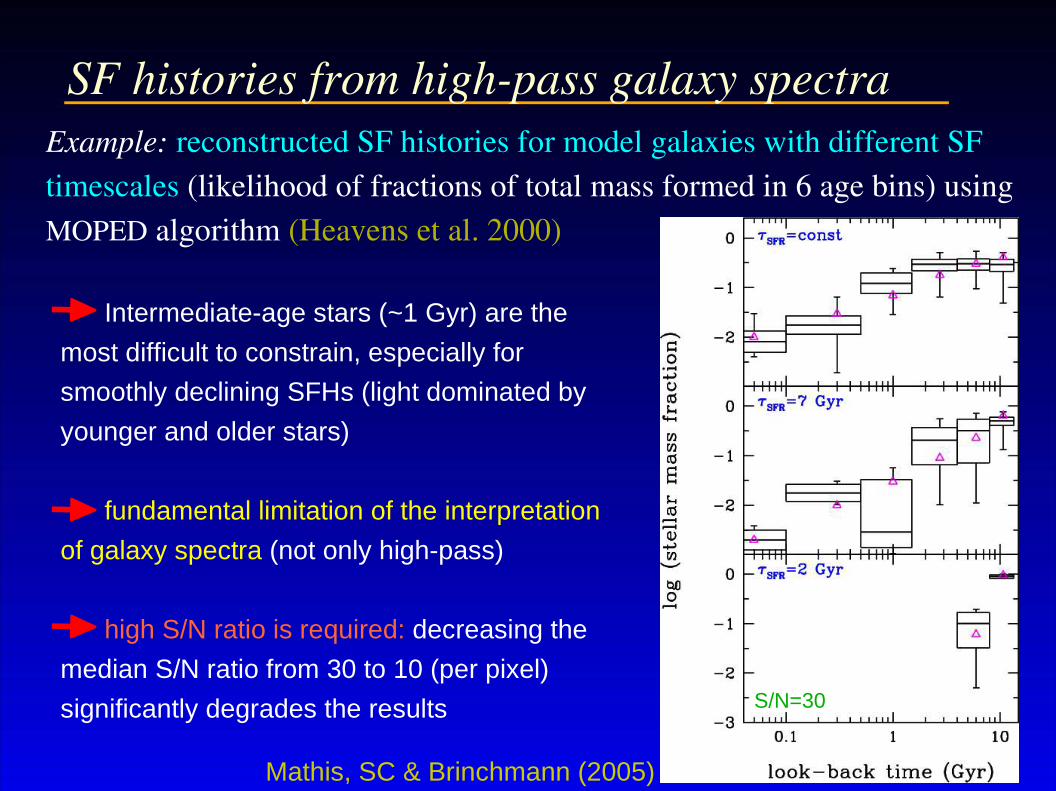
Example: reconstructed SF histories for model galaxies with different SF timescales (likelihood of fractions of total mass formed in 6 age bins) using MOPED algorithm (Heavens et al. 2000)
SF histories from highpass galaxy spectra
Intermediate-age stars (~1 Gyr) are the
most difficult to constrain, especially for
smoothly declining SFHs (light dominated by
younger and older stars)
fundamental limitation of the interpretation
of galaxy spectra (not only high-pass)
high S/N ratio is required: decreasing the
median S/N ratio from 30 to 10 (per pixel)
significantly degrades the results S/N=30
Mathis, SC & Brinchmann (2005)
Optical spectrum: stellar metallicity
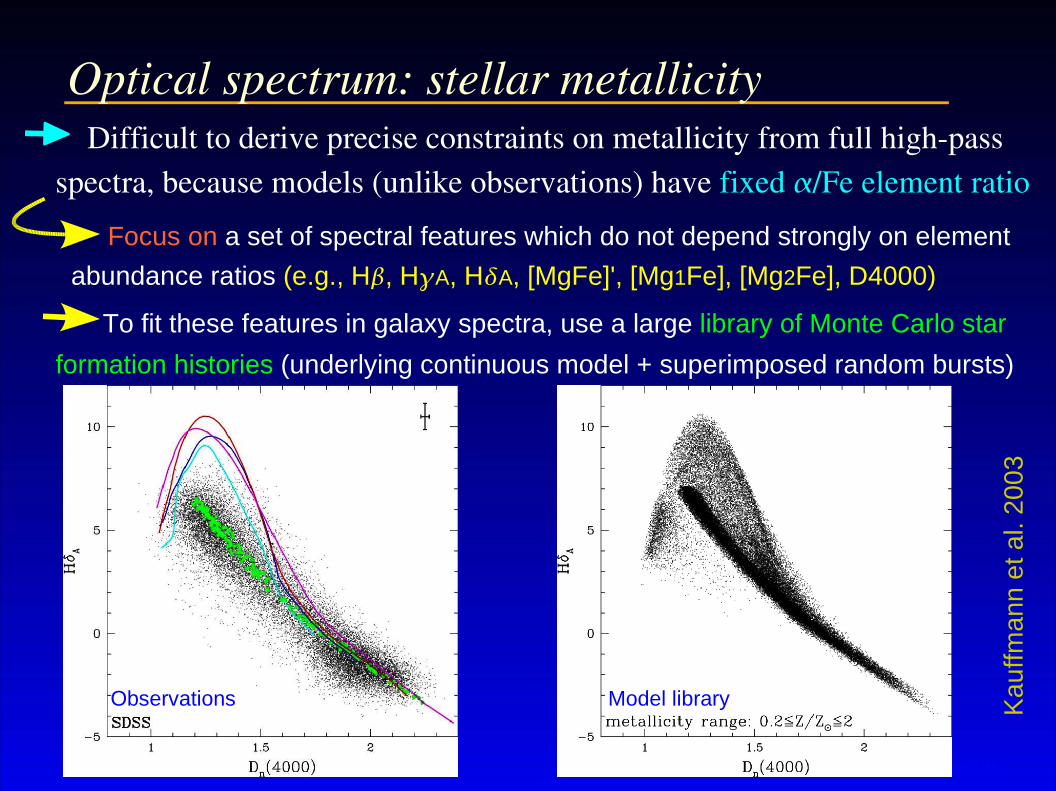
Focus on a set of spectral features which do not depend strongly on element
abundance ratios (e.g., H, HA, HA, [MgFe]', [Mg1Fe], [Mg2Fe], D4000)
Difficult to derive precise constraints on metallicity from full highpass spectra, because models (unlike observations) have fixed /Fe element ratio
Optical spectrum: stellar metallicity
Focus on a set of spectral features which do not depend strongly on element
abundance ratios (e.g., H, HA, HA, [MgFe]', [Mg1Fe], [Mg2Fe], D4000)
To fit these features in galaxy spectra, use a large library of Monte Carlo star
formation histories (underlying continuous model + superimposed random bursts)
Model libraryObservations
Difficult to derive precise constraints on metallicity from full highpass spectra, because models (unlike observations) have fixed /Fe element ratio
Kau
ffman
n et
al.
2003
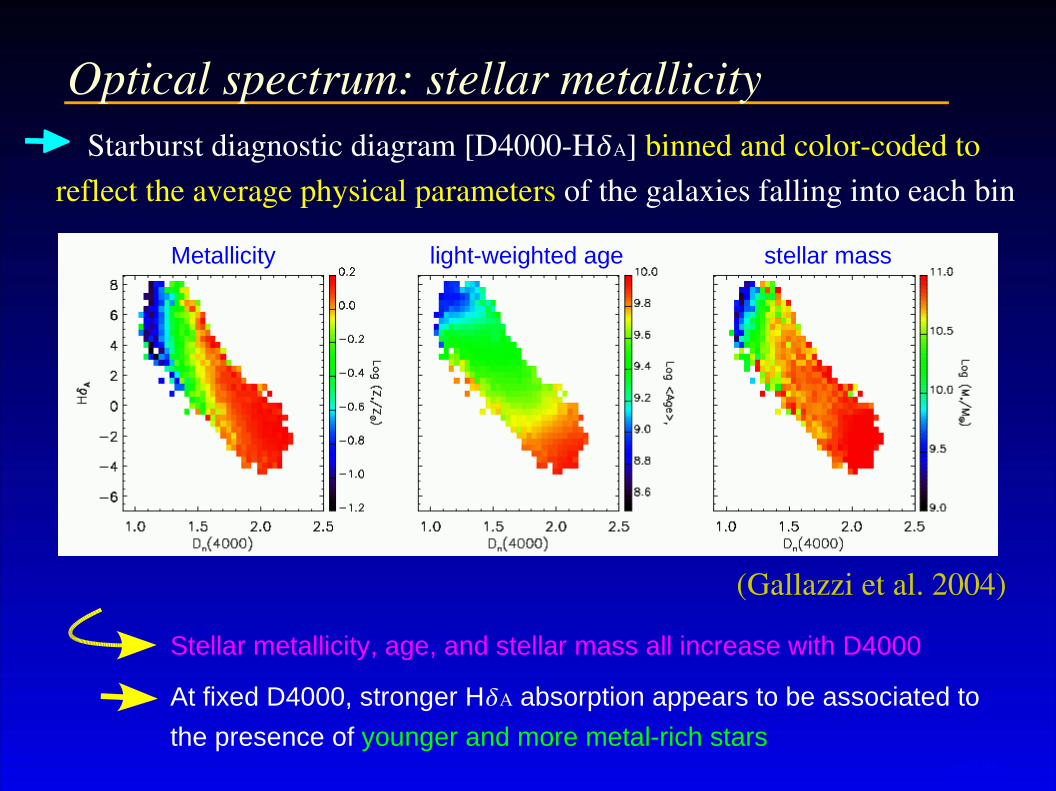
Optical spectrum: stellar metallicity Starburst diagnostic diagram [D4000HA] binned and colorcoded to reflect the average physical parameters of the galaxies falling into each bin
Metallicity light-weighted age stellar mass
Stellar metallicity, age, and stellar mass all increase with D4000
At fixed D4000, stronger HA absorption appears to be associated to
the presence of younger and more metal-rich stars
(Gallazzi et al. 2004)
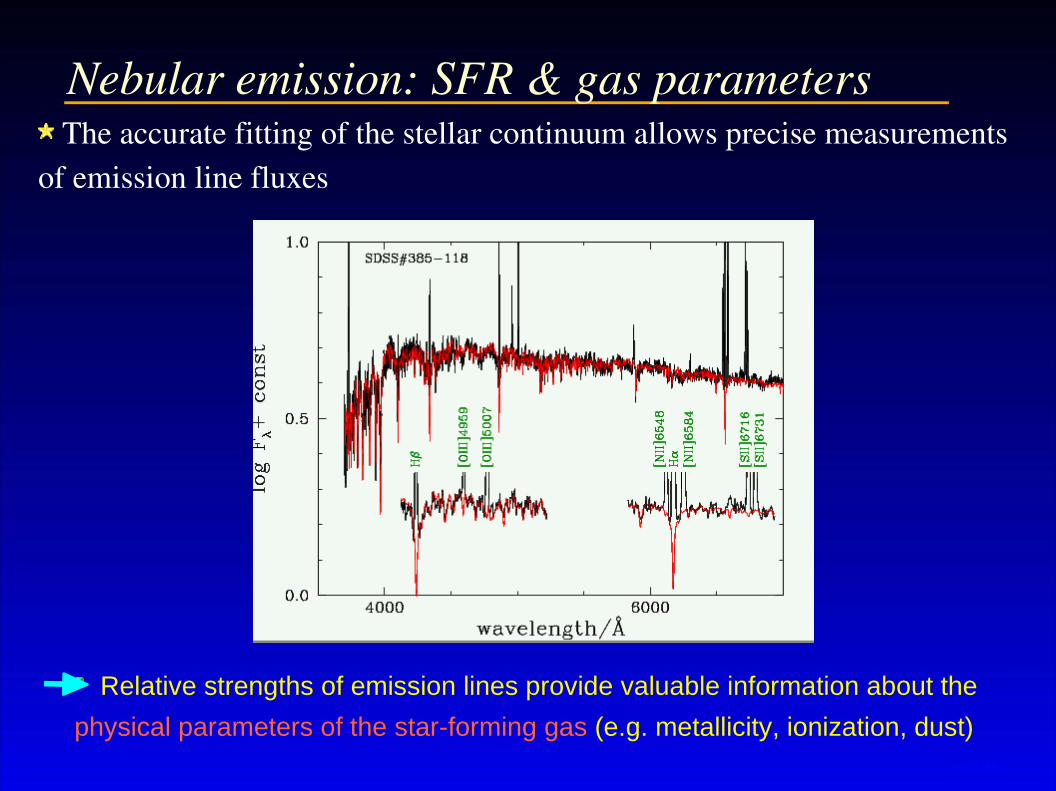
Relative strengths of emission lines provide valuable information about the
physical parameters of the star-forming gas (e.g. metallicity, ionization, dust)
The accurate fitting of the stellar continuum allows precise measurements of emission line fluxes
Nebular emission: SFR & gas parameters
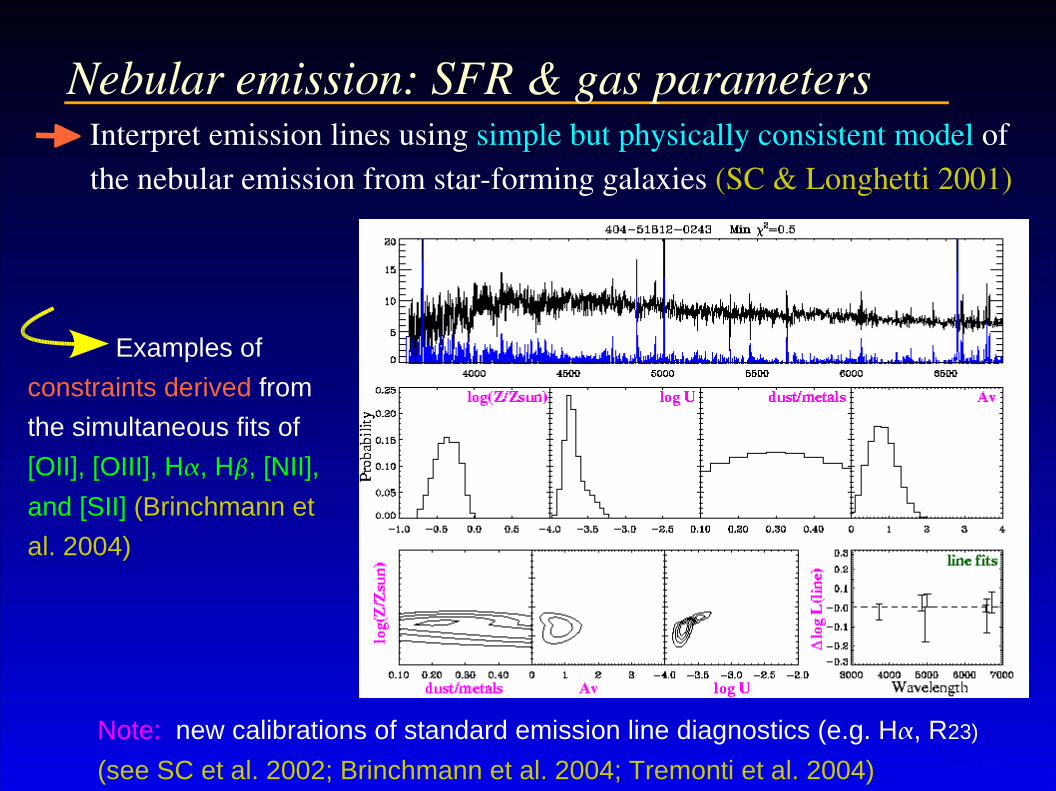
Interpret emission lines using simple but physically consistent model of the nebular emission from starforming galaxies (SC & Longhetti 2001)
Note: new calibrations of standard emission line diagnostics (e.g. H, R23)
(see SC et al. 2002; Brinchmann et al. 2004; Tremonti et al. 2004)
Nebular emission: SFR & gas parameters
Examples of
constraints derived from
the simultaneous fits of
[OII], [OIII], H, H, [NII],
and [SII] (Brinchmann et
al. 2004)
Ultraviolet & infrared emission: dust Attenuation by dust affects negligibly constraints on SF history and stellar
metallicity that can be derived from highpass galaxy spectra
Also, attenuation of optical emissionline fluxes well constrained by Balmerline ratios (caution: dependence on Te and ne; absorption of ionizing photons!) The attenuation of continuum emission by dust must also be evaluated to infer
galaxy stellar masses from SFHconstrained (dustfree) M/L ratios
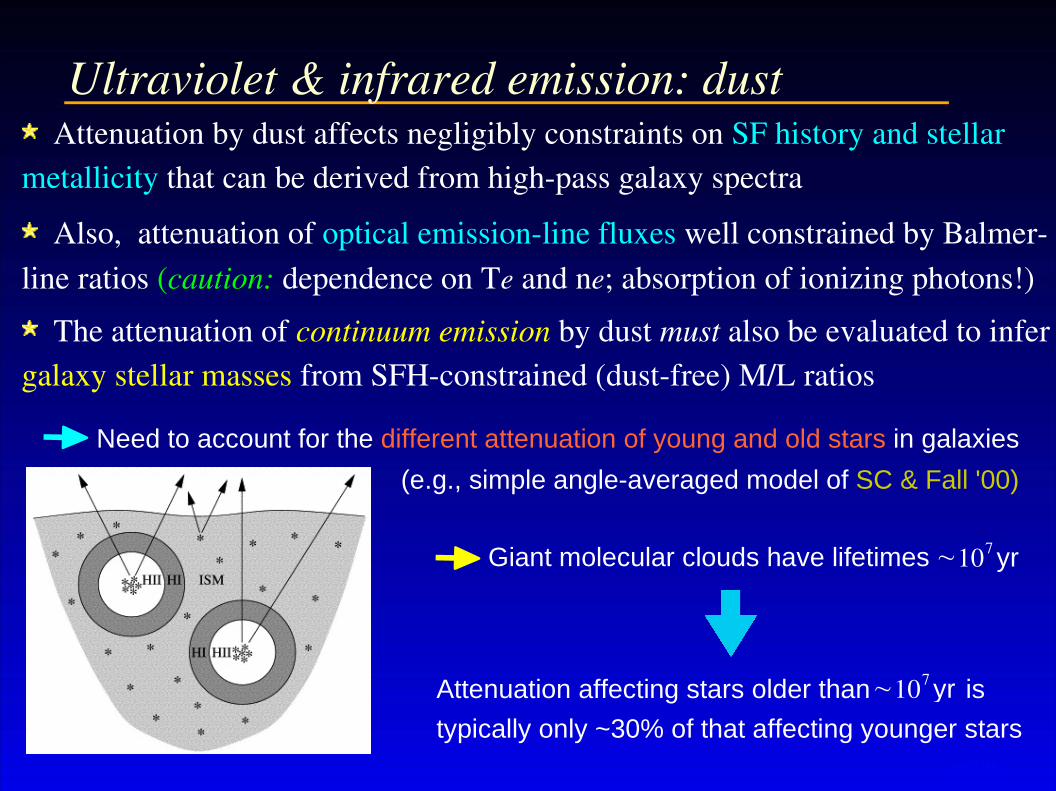
Ultraviolet & infrared emission: dust
~107 yr Giant molecular clouds have lifetimes
Attenuation affecting stars older than is
typically only ~30% of that affecting younger stars
~107 yr
Need to account for the different attenuation of young and old stars in galaxies
(e.g., simple angle-averaged model of SC & Fall '00)
Attenuation by dust affects negligibly constraints on SF history and stellar metallicity that can be derived from highpass galaxy spectra
Also, attenuation of optical emissionline fluxes well constrained by Balmerline ratios (caution: dependence on Te and ne; absorption of ionizing photons!) The attenuation of continuum emission by dust must also be evaluated to infer
galaxy stellar masses from SFHconstrained (dustfree) M/L ratios
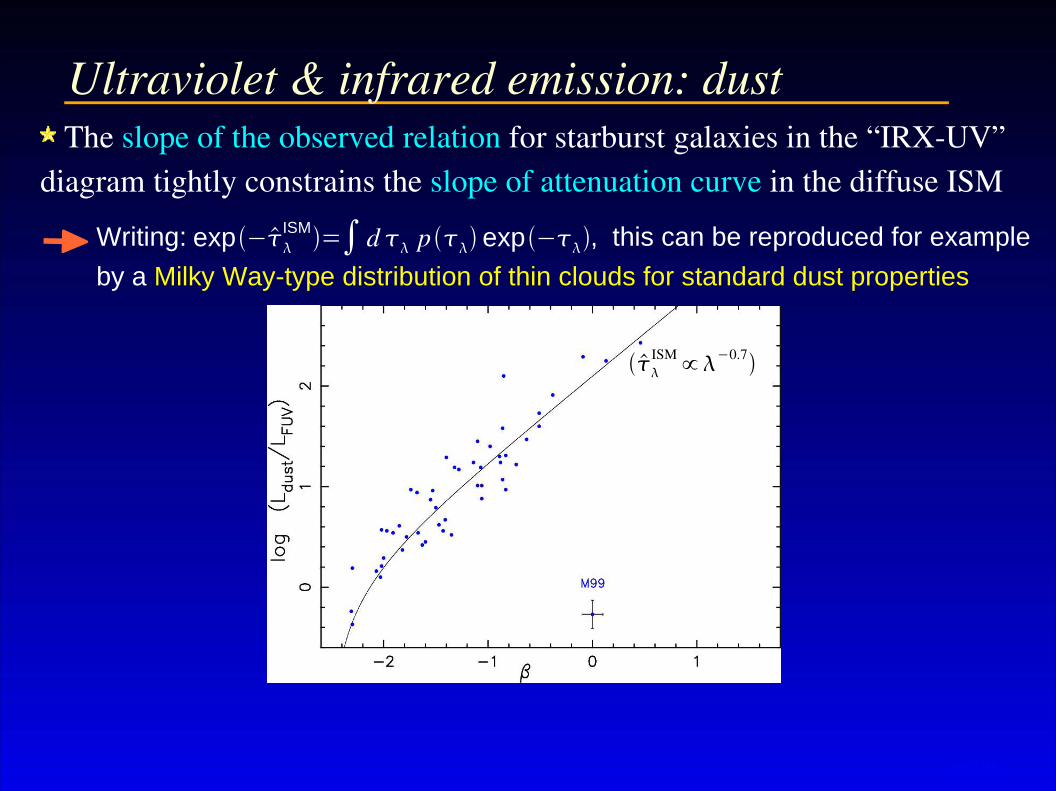
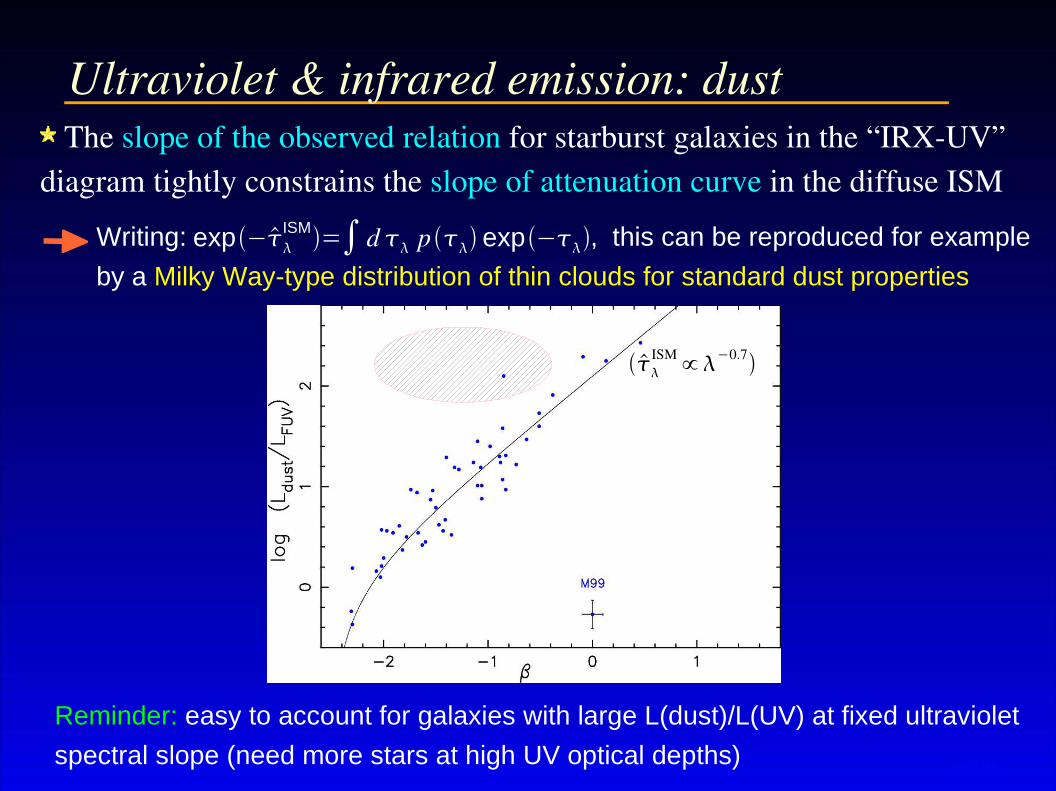
Writing: , this can be reproduced for example
by a Milky Way-type distribution of thin clouds for standard dust properties
The slope of the observed relation for starburst galaxies in the “IRXUV” diagram tightly constrains the slope of attenuation curve in the diffuse ISM
Ultraviolet & infrared emission: dust
exp−ISM=∫d p exp−
ISM ∝−0.7
Reminder: easy to account for galaxies with large L(dust)/L(UV) at fixed ultraviolet
spectral slope (need more stars at high UV optical depths)
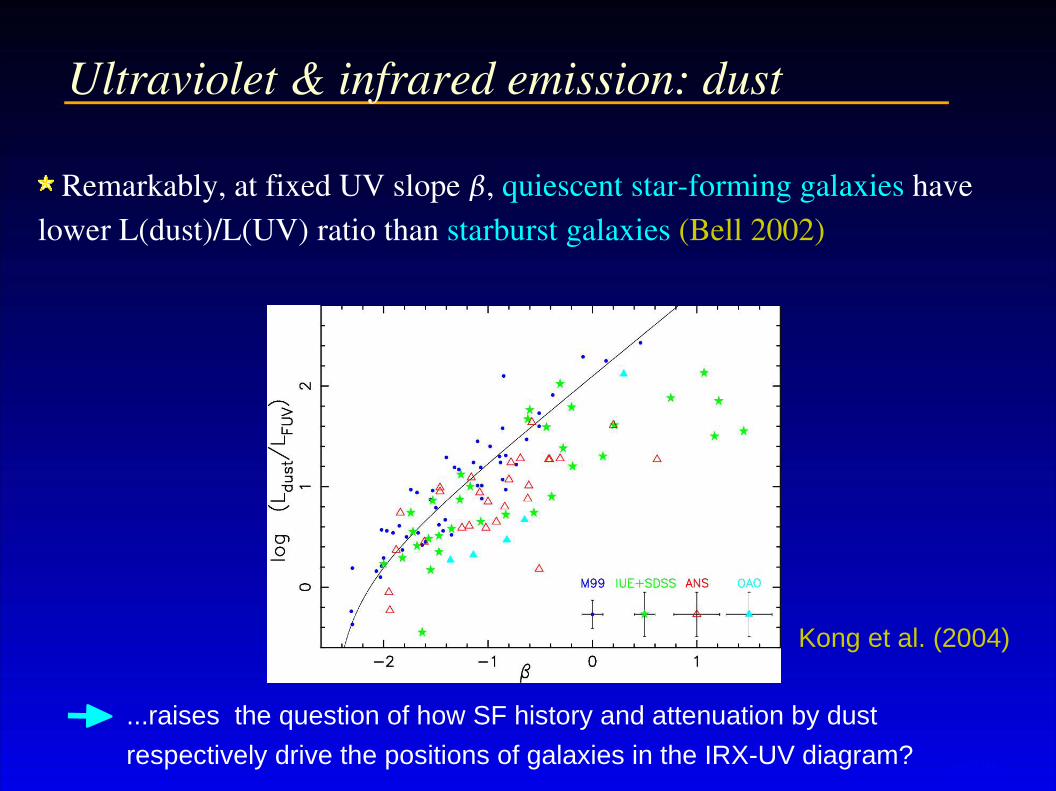
...raises the question of how SF history and attenuation by dust
respectively drive the positions of galaxies in the IRX-UV diagram?
Remarkably, at fixed UV slope , quiescent starforming galaxies have lower L(dust)/L(UV) ratio than starburst galaxies (Bell 2002)
Kong et al. (2004)
Ultraviolet & infrared emission: dust
(Kong et al. 2004)
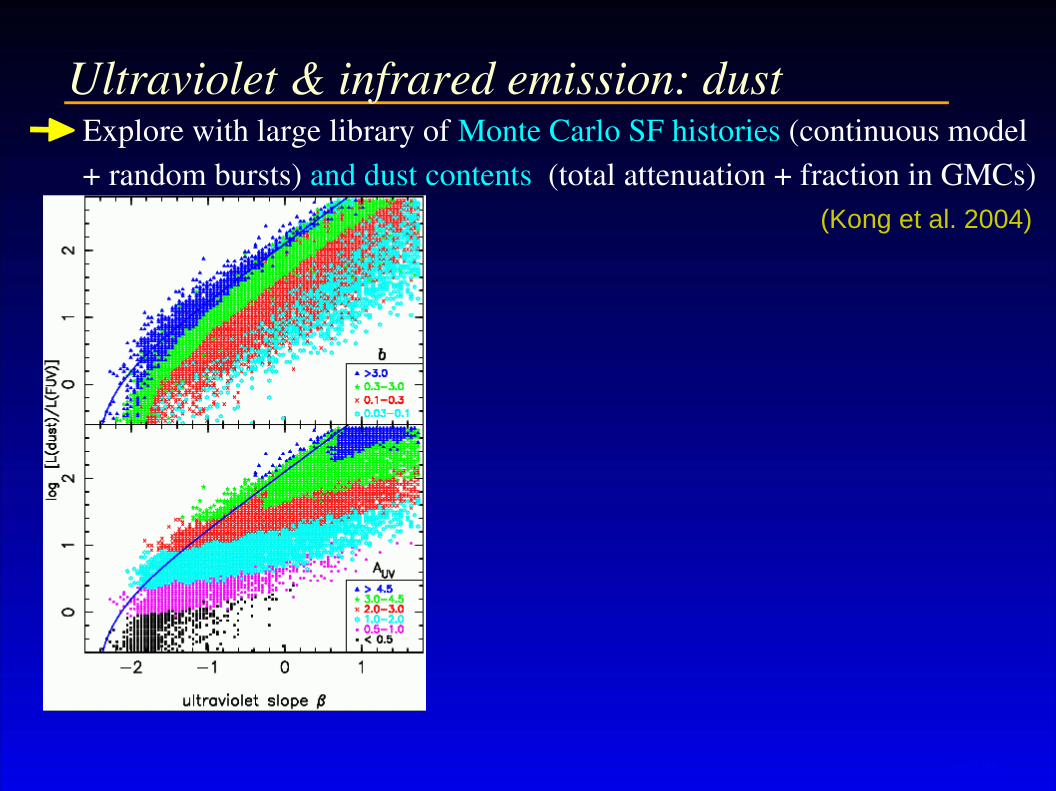
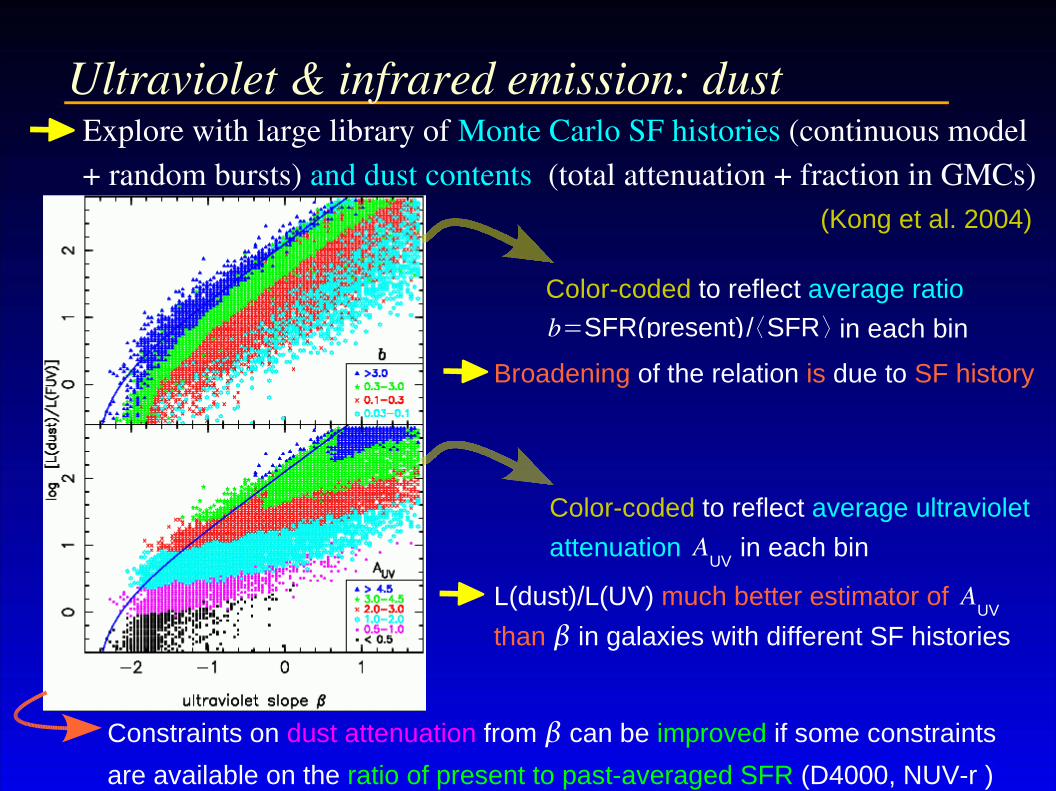
Ultraviolet & infrared emission: dustExplore with large library of Monte Carlo SF histories (continuous model + random bursts) and dust contents (total attenuation + fraction in GMCs)
(Kong et al. 2004)
Ultraviolet & infrared emission: dust
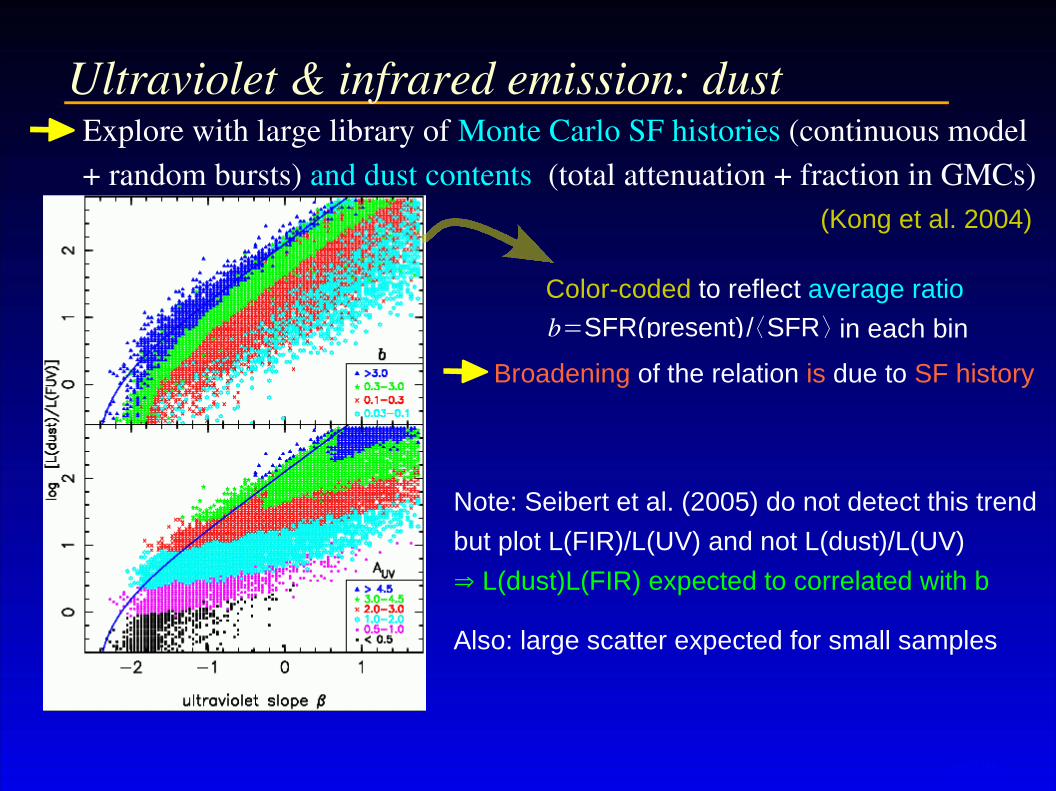
Note: Seibert et al. (2005) do not detect this trend
but plot L(FIR)/L(UV) and not L(dust)/L(UV)
⇒ L(dust)L(FIR) expected to correlated with b
Also: large scatter expected for small samples
Color-coded to reflect average ratio
in each bin b=SFR(present)/⟨SFR⟩
Broadening of the relation is due to SF history
Explore with large library of Monte Carlo SF histories (continuous model + random bursts) and dust contents (total attenuation + fraction in GMCs)
(Kong et al. 2004)
Ultraviolet & infrared emission: dust
L(dust)/L(UV) much better estimator of
than in galaxies with different SF histories
Color-coded to reflect average ultraviolet
attenuation in each binAUV
Color-coded to reflect average ratio
in each bin b=SFR(present)/⟨SFR⟩
Broadening of the relation is due to SF history
AUV
Constraints on dust attenuation from can be improved if some constraints
are available on the ratio of present to past-averaged SFR (D4000, NUV-r )
Explore with large library of Monte Carlo SF histories (continuous model + random bursts) and dust contents (total attenuation + fraction in GMCs)
Conclusions
Simple but physically motivated models available to derive physical parameters from integrated UVIR spectra of large statistical galaxy samples
More detailed models of the production of stellar radiation and its transfer through the ISM have allowed important progress in understanding influence of geometry, orientation and dust physics on the global properties of galaxies
These various models also instrumental in understanding the connection between star formation and AGN (Groves et al. 2004; Heckman et al. 2004)
Unprecedented new constraints from spatially resolved UVopticalIR observations of galaxies (Gordon et al. 2005, Popescu et al. 2005; C. Martin)
Toward better understanding of the parameters that control galaxy evolution