modeling and evaluation of moisture diffusion in polymer
TRANSCRIPT

Scholars' Mine Scholars' Mine
Doctoral Dissertations Student Theses and Dissertations
Summer 2016
Modeling and evaluation of moisture diffusion in polymer Modeling and evaluation of moisture diffusion in polymer
composite materials composite materials
Zhen Huo
Follow this and additional works at: https://scholarsmine.mst.edu/doctoral_dissertations
Part of the Chemical Engineering Commons, Materials Science and Engineering Commons, and the
Mechanical Engineering Commons
Department: Mechanical and Aerospace Engineering Department: Mechanical and Aerospace Engineering
Recommended Citation Recommended Citation Huo, Zhen, "Modeling and evaluation of moisture diffusion in polymer composite materials" (2016). Doctoral Dissertations. 2649. https://scholarsmine.mst.edu/doctoral_dissertations/2649
This thesis is brought to you by Scholars' Mine, a service of the Missouri S&T Library and Learning Resources. This work is protected by U. S. Copyright Law. Unauthorized use including reproduction for redistribution requires the permission of the copyright holder. For more information, please contact [email protected].

MODELING AND EVALUATION
OF MOISTURE DIFFUSION IN POLYMER COMPOSITE MATERIALS
by
ZHEN HUO
A DISSERTATION
Presented to the Faculty of the Graduate School of the
MISSOURI UNIVERSITY OF SCIENCE AND TECHNOLOGY
In Partial Fulfillment of the Requirements for the Degree
DOCTOR OF PHILOSOPHY
in
MECHANICAL ENGINEERING
2016
Approved
K. Chandrashekhara, Advisor
Xiaoping Du
Ming C. Leu
Thomas Schuman
Lesley H. Sneed


iii
PUBLICATION DISSERTATION OPTION
This dissertation consists of the following four papers, formatted in the style used
by the Missouri University of Science and Technology:
Paper I, Pages 9-36 have been published in Journal of Composite Materials.
Paper II, Pages 37-63 have been published in Journal of Sandwich Structures and
Materials.
Paper III, Pages 64-88 are intended for submission to Composite Structures
Journal.
Paper IV, Pages 89-111 are intended for submission to Composite Structures
Journal.

iv
ABSTRACT
Fiber-reinforced polymer composites have extensive applications due to their high
specific strength, improved product performance, low maintenance and design flexibility.
However, moisture absorbed by polymer composites during the service life plays a
detrimental role in both the integrity and durability of composite structure. It is essential
to understand the moisture diffusion behavior and induced damage in polymer matrix
composites under varying hygrothermal conditions. In Part I, the moisture diffusion
characteristics in hybrid composites using moisture concentration-dependent diffusion
method have been investigated. Also, a multi-stage diffusion model was proposed to
explain the deviation of moisture diffusion behavior for sandwich composites from
classical Fick’s law using a time-dependent diffusivity scheme. User-defined subroutines
were developed to implement these methods into commercial finite element code. To
validate the simulation results, an open-edge moisture diffusion experiment was
conducted for sandwich composites composed of woven E-glass fiber-reinforced
polyurethane (PU) face sheets and a closed-cell rigid PU foam core. In Part II, the behavior
of moisture diffusion and its effects on the mechanical properties of carbon/bismaleimide
composites exposed to seawater conditioning at elevated temperatures were investigated.
The degradation of mechanical properties due to hygrothermal aging was assessed by
conducting short beam shear test and flexural test at three immersion time points. In Part
III, the effect of moisture on mechanical performance of PU sandwich composites was
investigated. Mechanical property degradation due to moisture absorption was evaluated
by conducting compression test of the foam core, flexural test of the laminates, and double
cantilever beam Mode-I interfacial fracture test of sandwich composites.

v
ACKNOWLEDGMENTS
I would like to express my sincere gratitude to Dr. K Chandrashekhara for his
valuable guidance, assistance and encouragement during my graduate study at Missouri
University of Science and Technology. I would like to thank him for generous support of
providing excellent working environment and teamwork. It has been a great pleasure
working with him.
I want to extend my sincere appreciation to my advisory committee members, Dr.
Du, Dr. Leu, Dr. Schuman, and Dr. Sneed for their valuable time and advice in the review
of this dissertation. I also would like to thank the assistance from my research group
members.
Finally, I wish to express my deepest gratitude to my family and my friends for
their company and encouragement. Without their support, I would not be able to
accomplish and fulfill this work.

vi
TABLE OF CONTENTS
Page
PUBLICATION DISSERTATION OPTION ............................................................................... iii
ABSTRACT .................................................................................................................................. iv
ACKNOWLEDGMENTS .............................................................................................................. v
LIST OF ILLUSTRATIONS ........................................................................................................ ix
LIST OF TABLES ...................................................................................................................... xiii
SECTION
1. INTRODUCTION ................................................................................................................. 1
2. LITERATURE REVIEW ...................................................................................................... 3
3. SCOPE AND OBJECTIVES ................................................................................................. 7
PAPER
I.MODELING OF CONCENTRATION-DEPENDENT MOISTURE DIFFUSION IN
HYBRID FIBER-REINFORCED POLYMER COMPOSITES ............................................ 9
ABSTRACT .......................................................................................................................... 9
1. INTRODUCTION ........................................................................................................... 11
2. MOISTURE DIFFUSION MODELING ......................................................................... 14
2.1 MATHEMATICAL BACKGROUND ..................................................................... 14
2.2 NORMALIZATION APPROACH ........................................................................... 15
2.3 FINITE ELEMENT MODELING ............................................................................ 17
3. NUMERICAL SIMULATION ........................................................................................ 19
4. CONCLUSIONS ............................................................................................................. 33
5. ACKNOWLEDGEMENT ............................................................................................... 34
REFERENCES .................................................................................................................... 35

vii
II. EXPERIMENTATION AND SIMULATION OF MOISTURE DIFFUSION IN FOAM-
CORED POLYURETHANE SANDWICH STRUCTURE .................................................. 37
ABSTRACT ........................................................................................................................ 37
1. INTRODUCTION ........................................................................................................... 38
2. EXPERIMENTATION.................................................................................................... 41
2.1 MATERIALS ............................................................................................................ 41
2.2 SAMPLE PREPARATION ....................................................................................... 41
2.3 CONDITIONING AND MOISTURE UPTAKE MEASUREMENTS .................... 42
3. METHODS AND ANALYSIS........................................................................................ 45
3.1 DETERMINATION OF DIFFUSION PARAMETERS FOR FACE SHEETS ....... 45
3.2 DETERMINATION OF DIFFUSION PARAMETERS FOR PU NEAT RESIN.... 49
3.3 DETERMINATION OF DIFFUSION PARAMETERS FOR CLOSED-CELL
POLYURETHANE FOAM ...................................................................................... 50
4. RESULTS ........................................................................................................................ 53
5. CONCLUSIONS ............................................................................................................. 60
REFERENCES .................................................................................................................... 61
III.INVESTIGATION OF THREE-DIMENSIONAL MOISTURE DIFFUSION
MODELING AND MECHANICAL DEGRADATION OF CARBON/BMI
COMPOSITES UNDER SEAWATER CONDITIONING................................................... 64
ABSTRACT ........................................................................................................................ 64
1. INTRODUCTION ........................................................................................................... 65
2. EXPERIMENTAL ........................................................................................................... 68
2.1 MATERIALS AND MANUFACTURING .............................................................. 68
2.2 CONDITIONING AND MOISTURE UPTAKE MEASUREMENTS .................... 69
2.3 THREE-POINT BENDING AND SHORT BEAM SHEAR TESTS ....................... 70
2.4 MICROSTRUCTURAL ANALYSIS ....................................................................... 72
3. RESULTS AND DISCUSSION ...................................................................................... 73

viii
3.1 DETERMINATION OF DIFFUSION PARAMETERS AND FEA ........................ 73
3.2 EFFECTS OF SEAWATER AGING ON FLEXURAL STRENGTH AND ILSS .. 80
4. CONCLUSIONS ............................................................................................................. 85
REFERENCES .................................................................................................................... 86
IV.EFFECT OF SALT WATER EXPOSURE ON FOAM-CORED POLYURETHANE
SANDWICH COMPOSITES ................................................................................................ 89
ABSTRACT ........................................................................................................................ 89
1. INTRODUCTION ........................................................................................................... 90
2. EXPERIMENTAL ........................................................................................................... 93
2.1 MATERIALS ............................................................................................................ 93
2.2 SAMPLE MANUFACTURING AND ENVIRONMENTAL CONDITIONING .... 93
2.3 COMPRESSION TEST FOR FOAM CORE ........................................................... 94
2.4 THREE-POINT BENDING TEST FOR PU LAMINATE ....................................... 95
2.5 DCB MODE-I FRACTURE TEST FOR PU SANDWICH ..................................... 96
3. ANALYSIS AND DISCUSSION ................................................................................... 98
3.1 COMPRESSION TEST FOR FOAM CORE ........................................................... 98
3.2 THREE-POINT BENDING TEST FOR PU LAMINATE ..................................... 100
3.3 DCB MODE-I FRACTURE TEST FOR PU SANDWICH ................................... 101
4. CONCLUSIONS ........................................................................................................... 108
REFERENCES .................................................................................................................. 109
SECTION
4. CONCLUSIONS ............................................................................................................... 112
BIBLIOGRAPHY ................................................................................................................. 115
VITA…............. .................................................................................................................... 118

ix
LIST OF ILLUSTRATIONS
PAPER I Page
Figure 2.1. (a) Discontinuity of moisture concentration at the interface for a bi-material
system, (b) continuity of normalized concentration at the interface for a bi-
material system ....................................................................................................... 17
Figure 3.1. Geometry of three-layer hybrid plate (Case 1) ......................................................... 19
Figure 3.2. (a) Mesh convergence of moisture concentration (Case 1), (b) mesh convergence
of normalized moisture concentration (Case 1) ...................................................... 22
Figure 3.3. (a) Effective diffusivities of CFRP and GFRP (Case 1), (b) comparison between
simulation results and experimental findings (Case 1) ........................................... 23
Figure 3.4. Flowchart of user-defined subroutine USDFLD ...................................................... 24
Figure 3.5. Hybrid laminate configuration without (left) and with (right) adhesive layers
(Case 2) ................................................................................................................... 25
Figure 3.6. (a) 1/8th model of four-layer symmetric hybrid composites with adhesive (Case
2), (b) 1/8th model of four-layer symmetric hybrid composites without adhesive
(Case 2) ................................................................................................................... 27
Figure 3.7. (a) Effective diffusivity of CFRP (Case 2), (b) effective diffusivity of GFRP
(Case 2), (c) moisture weight gain curves with and without adhesive layers
(Case 2) ................................................................................................................... 28
Figure 3.8. Moisture concentration and normalized concentration contour after 1.5 years’
exposure (without-adhesive) ................................................................................... 29
Figure 3.9. Moisture concentration and normalized concentration contour after 1.5 years’
exposure (0.12 mm adhesive) ................................................................................. 29
Figure 3.10. Moisture concentration and normalized concentration contour after 1.5 years’
exposure (0.76 mm adhesive) ................................................................................. 29
Figure 3.11. Comparison of moisture concentration along path line 1 among three different
hybrid structures after 1.5 years’ exposure ............................................................. 31
Figure 3.12. Comparison of moisture concentration along path line 2 among three different
hybrid structures after 1.5 years’ exposure ............................................................. 32
PAPER II
Figure 2.1. Schematic of VARTM process used to manufacture PU sandwich panels .............. 42

x
Figure 3.1. Geometry of orthotropic composite plate ................................................................. 45
Figure 3.2. Derivation of the effective diffusivity using the initial constant slope..................... 46
Figure 3.3. Schematic of √D vs. (ℎ/𝑙 + ℎ/𝑤) ........................................................................... 47
Figure 3.4.√D.
vs. (h/l + h/w) for three sets of face sheets ...................................................... 48
Figure 3.5. Representative moisture uptake curves for neat resin RN and face sheet L-A ........ 49
Figure 3.6. A representative moisture uptake curve for closed-cell polyurethane foam ............ 50
Figure 3.7. Micrographs of closed-cell foam core (a) dry sample, (b) fully saturated sample
................................................................................................................................. 52
Figure 3.8. Thermographs of closed-cell foam core (a) dry sample, (b) partially saturated
sample, (c) fully saturated sample ........................................................................... 52
Figure 4.1. Mesh convergence study (Case I) ............................................................................ 55
Figure 4.2. Normalized moisture concentration contour after 1853 hours of immersion for
neat resin (Case Ⅰ), (b) face sheet L-A (Case Ⅱ) ................................................. 55
Figure 4.3. Comparisons between the simulation results and experimental data for neat resin
(Case I) and face sheet L-A (Case II) ...................................................................... 56
Figure 4.4. Normalized moisture concentration contour for the foam core (Case III) after
4927 hours of immersion ........................................................................................ 57
Figure 4.5. Comparison between simulation results and experimental data for the foam core
(Case III) ................................................................................................................. 58
Figure 4.6. Contours for sandwich S-S (Case IV) after 4927 hours of immersion (a) moisture
concentration, (b) normalized moisture concentration ............................................ 58
Figure 4.7. Comparison between simulation results and experimental data (Case IV) .............. 59
PAPER III
Figure 2.1. Schematic of out-of-autoclave process bagging assembly ....................................... 69
Figure 2.2. Manufacturer recommended cure cycle ................................................................... 69
Figure 2.3. Experimental setup for (a) three-point bending test, (b) short beam shear test ........ 71

xi
Figure 3.1. (a) √.
vs. (ℎ/𝑙)for unidirectional sample, (b) √.
vs. (ℎ/𝑙 + ℎ/𝑤) for cross-
ply sample ............................................................................................................... 74
Figure 3.2. √.
vs. (ℎ/𝑙) for three sets of unidirectional laminates at (a) 50 °C, (b) 90 °C ....... 74
Figure 3.3. √.
vs. (ℎ/𝑙 + ℎ/𝑤) for cross-ply laminates at (a) 50 °C, (b) 90 °C ....................... 75
Figure 3.4. Normalized moisture concentration contour of unidirectional laminate U-C (a)
after 1977 hours’ immersion at 50 °C, (b) after 300 hours’ immersion at 90 °C .... 78
Figure 3.5. Normalized moisture concentration contour of cross-ply laminate C-C (a) after
893 hours’ immersion at 50 °C, (b) after 186 hours’ immersion at 90 °C .............. 78
Figure 3.6. Comparison between the simulation results and experimental data for
unidirectional laminates at 50 °C (Case Ⅰ) ............................................................ 79
Figure 3.7. Comparison between the simulation results and experimental data for
unidirectional laminates at 90 °C (Case Ⅱ) ............................................................ 79
Figure 3.8. Comparison between the simulation results and experimental data for cross-ply
laminates at 50 °C (Case Ⅲ) ................................................................................... 80
Figure 3.9. Comparison between the simulation results and experimental data for cross-ply
laminates at 90 °C (Case Ⅳ) ................................................................................... 80
Figure 3.10. Effects of hygrothermal aging on flexural strength ................................................ 83
Figure 3.11. Effects of hygrothermal aging on ILSS .................................................................. 83
Figure 3.12. SEM micrograph of cross section area of cross-ply BMI samples after 3 months’
immersion at 90 °C ................................................................................................. 84
Figure 3.13. SEM micrograph of cross section area of dry cross-ply BMI samples .................. 84
PAPER IV
Figure 2.1. VARTM setups used to manufacture (a) PU sandwich, (b) PU laminates............... 94
Figure 2.2. Experiment setup for compression test .................................................................... 95
Figure 2.3. Experiment setup for three-point bending test ......................................................... 96
Figure 2.4. Double cantilever beam sandwich specimen configuration ..................................... 97
Figure 2.5. Experiment setup for sandwich DCB interfacial Mode-I fracture test ..................... 97

xii
Figure 3.1. Representative load-displacement curve of compression test for foam core ........... 98
Figure 3.2. Effect of salt water exposure on foam core (a) compressive modulus, (b)
compressive strength ............................................................................................... 99
Figure 3.3. Representative failure mode of PU foam core specimens under compression ......... 99
Figure 3.4. Representative load-deflection curve of flexural test for PU laminates ................. 101
Figure 3.5. Effect of salt water exposure on laminates (a) flexural modulus, (b) flexural
strength .................................................................................................................. 103
Figure 3.6. Representative failure mode of PU laminates under flexural test (a) dry specimen,
(b) wet specimen ................................................................................................... 103
Figure 3.7. Representative load-displacement curve of DCB test for PU sandwich specimens
............................................................................................................................... 104
Figure 3.8. Representative curve of 𝐶1/3 vs. crack length for PU sandwich specimen........... 106
Figure 3.9. Effect of salt water exposure on interfacial fracture toughness of PU sandwich
composites ............................................................................................................. 107

xiii
LIST OF TABLES
PAPER I Page
Table 3.1. Diffusion properties for CFRP and GFRP .................................................................. 22
PAPER II
Table 2.1. Nominal dimensions of test coupons .......................................................................... 43
Table 3.1. Diffusion parameters for woven E-glass/PU face sheets ............................................ 49
Table 3.2. Diffusion parameters for PU neat resin ....................................................................... 50
Table 4.1. Weight gain of sliced sandwich constituents .............................................................. 58
PAPER III
Table 2.1. Nominal dimensions of coupons for moisture diffusion test ...................................... 70
Table 2.2. Parameters of three-point bending and short beam shear tests.................................... 71
Table 3.1. Diffusion parameters for unidirectional BMI laminates ............................................. 76
Table 3.2. Diffusion parameters for cross-ply BMI laminates ..................................................... 76
Table 3.3. Results of three-point bending and short beam shear tests ......................................... 81
PAPER IV
Table 2.1. Parameters of compression test for foam core ............................................................ 95
Table 2.2. Parameters of three-point bending test ........................................................................ 96
Table 3.1. Effect of salt water exposure on compressive properties of foam core exposed to
50% salinity salt water at 23 °C ............................................................................... 100
Table 3.2. Effect of salt water exposure on flexural properties of PU laminates exposed to
50% salinity salt water at 34 °C ............................................................................... 106
Table 3.3. Effect of salt water exposure on fracture toughness of PU sandwich exposed to
50% concentration salt water at 34 °C ..................................................................... 107

1. INTRODUCTION
Polymer composites have been utilized broadly in the aerospace, marine, energy,
automotive and civil industries due to their superior properties such as high strength-to-
weight ratio, excellent corrosion resistance and design flexibility. In many cases these
materials are frequently subjected to environments involving temperature and humidity
during the expected life of service. Though most engineering fibers are generally
considered to be impermeable, it is widely known that polymer composites are susceptible
to the humid conditions, especially at elevated temperatures. Moisture absorption in
thermoplastic/thermoset resin matrices is substantial. Complex phenomena including
matrix plasticization, swelling, relaxation, fiber/matrix interfacial debonding and chemical
structure rearrangement may occur under the exposure to hygrothermal environments.
Absorbed moisture plays a detrimental role in both the integrity and durability of composite
structures since it can degrade the mechanical properties and induce interfacial failures. As
a result, it is essential to understand the moisture diffusion behavior and moisture-induced
damage in polymer matrix composites under varying hygrothermal conditions to predict
the long-term material performance and optimize structural design.
One-dimensional Fick’s law is the most frequently used approach by researchers to
investigate moisture diffusion behavior into fiber-reinforced polymer composites.
However, classical Fick’s law is not always adequate to explain all the moisture diffusion
behavior in polymers or polymer composites. In the current study, the moisture diffusion
characteristics in hybrid composites using moisture concentration-dependent diffusion
method have been investigated. Also, a multi-stage diffusion model was proposed to
explain the deviation of moisture diffusion behavior for sandwich composites from

2
classical Fick’s law using a time-dependent diffusivity scheme. Also, the degradation of
mechanical properties of two different composite structures due to hygrothermal aging was
assessed by conducting mechanical tests at target immersion time points.

3
2. LITERATURE REVIEW
From the aspect of experimental investigation, considerable efforts have been made
to investigate the effects of moisture absorption on the mechanical properties of
thermoplastic/thermoset resin, fiber-reinforced composite laminates, polymeric foams and
sandwich structures. Extensive studies [1-4] have indicated that absorption of water
molecules degraded mechanical properties of polymer composites due to plasticizing
effects and resin deterioration. The fiber/matrix interfacial strength degraded significantly
as the water preferentially diffused along the fiber/matrix interface under hygrothermal
conditioning [5-8]. Additional studies have also indicated that polymer foams’ mechanical
properties are substantially affected by moisture absorption. For polymeric foams, several
studies also indicated that the mechanical properties of polymeric foams are substantially
affected by moisture absorption. Tagliavia et al. [9] found that the exposure of syntactic
foams to a water environment yields a deterioration of Young’s modulus and flexural
strength. Gupta and Woldesenbet [10] investigated the hygrothermal effects on
compressive strength of syntactic foams. Considerable decrease in modulus was observed
in wet samples compared to the dry reference samples but no significant difference was
observed in the peak compressive strength of specimens under low temperature. Sadler et
al. [11] investigated the effect of water immersion on swelling and compression properties
of Eco-Core, PVC foam and balsa wood. The results indicated that Eco-Core is as good as
PVC foam in resisting swelling, water absorption and changes in compression properties
due to water immersion. Balsa wood showed a significant swelling, water absorption and
deterioration of compression properties. Several researchers investigated the mechanical
degradation of foam-cored sandwich structures exposed to varying hygrothermal

4
conditions. A predominant structural failure mechanism that occurs in foam-cored
sandwich structures during the expected service life is the debonding between face sheets
and foam core. Some researchers have investigated the interfacial fracture toughness
degradation of foam-cored sandwich structures exposed to varying hygrothermal
conditions. Veazie et al. [12] investigated the facing/core interfacial fracture toughness of
sandwich composites made of E-glass/vinylester face sheets bonded to a closed-cell
polyvinyl chloride (PVC) core under hygrothermal conditioning. The results showed that
the interfacial fracture toughness was reduced considerably (greater than 50%) in
specimens submerged in sea-water, and significantly (approximately 90%) due to 5000
hours of the ‘hot/wet’ and hot/dry exposure. Avilés and Aguilar-Montero [13] investigated
the mechanical degradation of sandwich specimens composed of E-glass/polyester face
sheets bonded to a PVC core exposed to high moisture conditioning. It was observed that
the debond fracture toughness of the facing/core interface degraded around 11.5% after
210 days in the 95% relative humidity (RH) condition and degraded 30.8% after 92 days
immersion in seawater. Other studies [14, 15] found that the facing/core interface fracture
toughness showed a reduction of approximately 30% for carbon fiber vinylester facing and
PVC H100 foam sandwich due to sustained exposure to seawater. However, few
researchers have investigated the effect of moisture absorption on the mechanical property
of polyurethane sandwich composites.
From the aspect of numerical investigation, numerous diffusion models have been
proposed to study moisture diffusion into various composites under different external
hygrothermal conditioning. One-dimensional Fick’s law is the most frequently used one
by researchers [16-20] to investigate moisture diffusion behavior into fiber-reinforced

5
composites. Gopalan et al. [21] observed that the absorption curve in a mixed fiber-
reinforced composite obeys Fick’s law. However, classical Fick’s law is not always
adequate when explaining all the moisture diffusion behavior in polymers or polymer
composites. Some researchers [22, 23] suggested using a two-stage Fickian process to
explain the derivation from theoretical Fickian curve for composites. Bao and Yee [24]
proposed a dual-diffusivity model for hybrid composites to fit observed weight gain curves.
Weitsman [25] developed a coupled damage and moisture transport non-Fickian model to
describe moisture diffusion in transversely isotropic fiber-reinforced polymer composites.
This model, however, was mathematically complex. Some anomalies in moisture diffusion
can be explained by the coupling between moisture transportation and local stress state.
Both graphite and glass fibers are generally considered as impermeable. Compared with
polymeric resin matrix, neither graphite fibers nor glass fibers are significantly affected by
the presence of moisture or temperature changes. As moisture penetration proceeds or/and
the environmental temperature elevates, the fibers will inhibit the matrix from free-
swelling or thermal expansion. Consequently, the residual stresses will build up at the
fiber/matrix interface. Some researchers have indicated a significant influence of internal
(or external) stress on moisture diffusion behavior. Whitney and Browning [26] observed
that the absorption curve of graphite/epoxy laminates deviates from the theoretical Fickian
curve and proposed a stress-dependent diffusion method. In this method, the decrease in
diffusivity corresponding to the swelling of the laminates relieves the tensile residual stress.
Other researchers [27, 28] also observed that the moisture diffusion process in carbon-
epoxy composite is either accelerated under external tensile stresses or retarded under
external compressive stresses. Researchers [29, 30] also suggested that the swelling

6
internal stresses in a polymer sheet influence the diffusion coefficients. However, most of
work available in the literature deals with the stress-dependent diffusion mechanism in
homogeneous composites, and few researchers have investigated three-dimensional
moisture diffusion behavior in polyurethane sandwich structures and carbon fiber-
reinforced bismaleimide composites under high moisture conditioning.

7
3. SCOPE AND OBJECTIVES
This dissertation comprises four papers corresponding to the following problems.
The first paper is titled “Modeling of Concentration-dependent Moisture Diffusion
in Hybrid Fiber-Reinforced Polymer Composites.” In this paper, the moisture diffusion
characteristics in two-phase (unidirectional S-glass fiber-reinforced epoxy matrix and
unidirectional graphite fiber-reinforced epoxy matrix) hybrid composites using moisture
concentration-dependent diffusion method have been investigated. In the moisture
concentration-dependent diffusion method, the diffusion coefficients are not only
dependent on the environmental temperature, but also dependent on the nodal moisture
concentration due to the internal swelling stress built during the diffusion process. A user-
defined subroutine was developed to implement this method into commercial finite element
code. Three-dimensional finite element models were developed to investigate the moisture
diffusion in hybrid composites.
The second paper is titled “Experimentation and Simulation of Moisture Diffusion
in Foam-Cored Polyurethane Sandwich Structure.” In this paper, The moisture diffusion
behavior of two-part thermoset polyurethane (PU) neat resin, woven E-glass fiber-
reinforced PU face sheet, closed-cell rigid PU foam core and their corresponding sandwich
specimens, was investigated in this study. Moisture diffusivities and solubility for neat
resin, face sheet and foam core specimens were characterized according to the experimental
analysis. A three-dimensional dynamic finite element model was developed to predict the
moisture diffusion behavior in neat resin, face sheet, foam core and sandwich specimens.
This finite element model was then validated by comparing simulation results with
experimental findings.

8
The third paper is titled “Investigation of Three-dimensional Moisture Diffusion
Modeling and Mechanical Degradation of Carbon/BMI Composites under Seawater
Exposure.” In this paper, the behavior of moisture diffusion and its effects on the
mechanical properties of carbon/bismaleimide (BMI) composites exposed to seawater
conditioning at elevated temperatures were investigated. Carbon/BMI composites of two
stacking sequences (unidirectional and cross-ply) were fabricated using out-of-autoclave
(OOA) process, and carbon/BMI specimens were immersed in the sea water at two elevated
temperatures for approximately three months. Moisture diffusivities and solubility for each
type of carbon/BMI specimen at two temperatures were characterized according to the
experimental data, and these parameters were implemented in a three-dimensional dynamic
finite element model to predict the moisture diffusion behavior. Mechanical properties
degradation due to hygrothermal aging was assessed by conducting short-beam shear test
and three-point bending test at target immersion time points.
The fourth paper is titled “Effect of Salt Water Exposure on Foam-cored
Polyurethane Sandwich Composites.” This paper investigated the effect of moisture
absorption on mechanical performance of polyurethane (PU) sandwich composites
composed of E-glass/polyurethane face sheets bonded to a polyurethane closed-cell foam
core. The vacuum assisted resin transfer molding (VARTM) process was used to
manufacture E-glass/polyurethane laminates and sandwich composite panels. Mechanical
property degradation due to moisture absorption was evaluated by conducting compression
test of the foam core, three-point bending test of the laminates, and double cantilever beam
(DCB) Mode-I interfacial fracture test of sandwich composites.

9
PAPER
I. MODELING OF CONCENTRATION-DEPENDENT MOISTURE DIFFUSION
IN HYBRID FIBER-REINFORCED POLYMER COMPOSITES
Z. Huo, V. Bheemreddy and K. Chandrashekhara*
Department of Mechanical and Aerospace Engineering
Missouri University of Science and Technology, Rolla, MO 65409
R. A. Brack
Bell Helicopter Textron, Inc., Fort Worth, TX 76101
ABSTRACT
Hybrid fiber-reinforced polymer composites have extensive applications due to
their high strength, cost effectiveness, improved product performance, low maintenance,
and design flexibility. However, moisture absorbed by composite components plays a
detrimental role in both the integrity and durability of hybrid structure since it can degrade
the mechanical properties and induce interfacial delamination failures. In this study, the
moisture diffusion characteristics in two-phase hybrid composites using moisture
concentration-dependent diffusion method have been investigated. The two phases are
unidirectional S-glass fiber-reinforced epoxy matrix and unidirectional graphite fiber-
reinforced epoxy matrix. In the moisture concentration-dependent diffusion method, the
diffusion coefficients are not only dependent on the environmental temperature, but also
dependent on the nodal moisture concentration due to the internal swelling stress built
during the diffusion process. A user-defined subroutine was developed to implement this
method into commercial finite element code. Three-dimensional finite element models
were developed to investigate the moisture diffusion in hybrid composites. A normalization
approach was also integrated in the model to remove the moisture concentration

10
discontinuity at the interface of different material components. The moisture diffusion in
the three-layer hybrid composite exposed to 45 /84% relative humidity for 70 days was
simulated and validated by comparing the simulation results with experimental findings.
The developed model was extended to simulate the moisture diffusion behavior in an
adhesive-bonded four-layer thick hybrid composite exposed to 45 /84% relative
humidity for 1.5 years. The results indicated that thin adhesive layers (0.12 mm thick)
didn’t significantly affect the overall moisture uptake as compared to thick adhesive layers
(0.76 mm thick).

11
1. INTRODUCTION
Hybrid fiber-reinforced polymer composites have been widely utilized in aerospace
and marine structural applications where high strength and design flexibility are required.
The combined properties of different components in hybrid composites are the weighed
sum of the individual component’s properties so that some desirable balance between the
inherent advantages and disadvantages can be achieved [1]. Hybrid fiber-reinforced
polymer composites can generally be divided into two types: (a) polymeric matrix
reinforced by several different types of fibers and (b) laminates of different types of fiber-
reinforced composites. It is well known that hybrid composites are susceptible to the
hygrothermal environment [2, 3], especially at elevated temperatures. Moisture penetrating
from surfaces plays a detrimental role in both the integrity and durability of composite
structures since it can degrade the mechanical properties [4-6] and induce interfacial
delamination failures [7].
Numerous diffusion models have been proposed to study moisture diffusion into
various composites under different external hygrothermal conditioning. One-dimensional
Fick’s law is the most frequently used one by researchers [3, 8, 9] to investigate moisture
diffusion behavior into single-fiber-reinforced composites. Gopalan et al. [10] observed
that the absorption curve in a mixed fiber-reinforced composite obeys Fick’s law. However,
classical Fick’s law is not always adequate when explaining all the moisture diffusion
behavior in polymers or polymer composites. Gurtin and Yatomi [11] suggested using a
two-stage Fickian process to explain the derivation from theoretical Fickian curve for fiber-
reinforced composites. Bao and Yee [7] proposed a dual-diffusivity model for hybrid
composites to fit observed weight gain curves. Weitsman [12] developed a coupled damage

12
and moisture transport non-Fickian model to describe moisture diffusion in transversely
isotropic fiber-reinforced polymer composites. This model, however, was mathematically
complex.
Some anomalies in moisture diffusion can be explained by the coupling between
moisture transportation and local stress state. Both graphite and glass fibers are generally
considered as impermeable. Compared with polymeric resin matrix, neither graphite fibers
nor glass fibers are significantly affected by the presence of moisture or temperature
changes. As moisture penetration proceeds or/and the environmental temperature elevates,
the fibers will inhibit the matrix from free-swelling or thermal expansion. Consequently,
the residual stresses will build up at the fiber/matrix interface. Some researchers have
indicated a significant influence of internal (or external) stress on moisture diffusion
behavior. Whitney and Browning [13] observed that the absorption curve of graphite/epoxy
laminates deviates from the theoretical Fickian curve and proposed a stress-dependent
diffusion method. In this method, the decrease in diffusivity corresponding to the swelling
of the laminates relieves the tensile residual stress. Other researchers [14, 15] also observed
that the moisture diffusion process in carbon-epoxy composite is either accelerated under
external tensile stresses or retarded under external compressive stresses. Crank [16]
suggested that the swelling internal stresses in a polymer sheet influence the diffusion
coefficients. However, most of work available in the literature deals with the stress-
dependent diffusion mechanism in homogeneous composites.
In this study, a moisture concentration-dependent diffusion model is proposed to
investigate moisture diffusion behavior in multi-layer unidirectional hybrid composites.
The moisture model previously developed for the composite laminate by the authors [17]

13
is extended for hybrid composites. In order to guarantee the continuity of the nodal
concentration at the interface of different material phases, normalized concentration is
incorporated into the modeling. In the moisture concentration-dependent diffusion model
proposed in this study, the diffusion coefficients are not only dependent on temperature,
but also depend on the nodal moisture concentration at every material point. Compared
with the coupled damage and moisture transport non-Fickian model developed by
Weitsman [12], this model provides a significant simplification for this type of stress-
dependent diffusion problems, thus it is easy to be implemented in common finite element
commercial codes using user-defined subroutines. In the current study, the damage
resulting from moisture diffusion is not considered and is limited to temperature and
moisture concentration-dependent diffusion only. For model validation, the simulation
results were compared with experimental findings of moisture absorption in three-layer
unidirectional hybrid composites exposed to 45 /84% RH for 70 days.
14
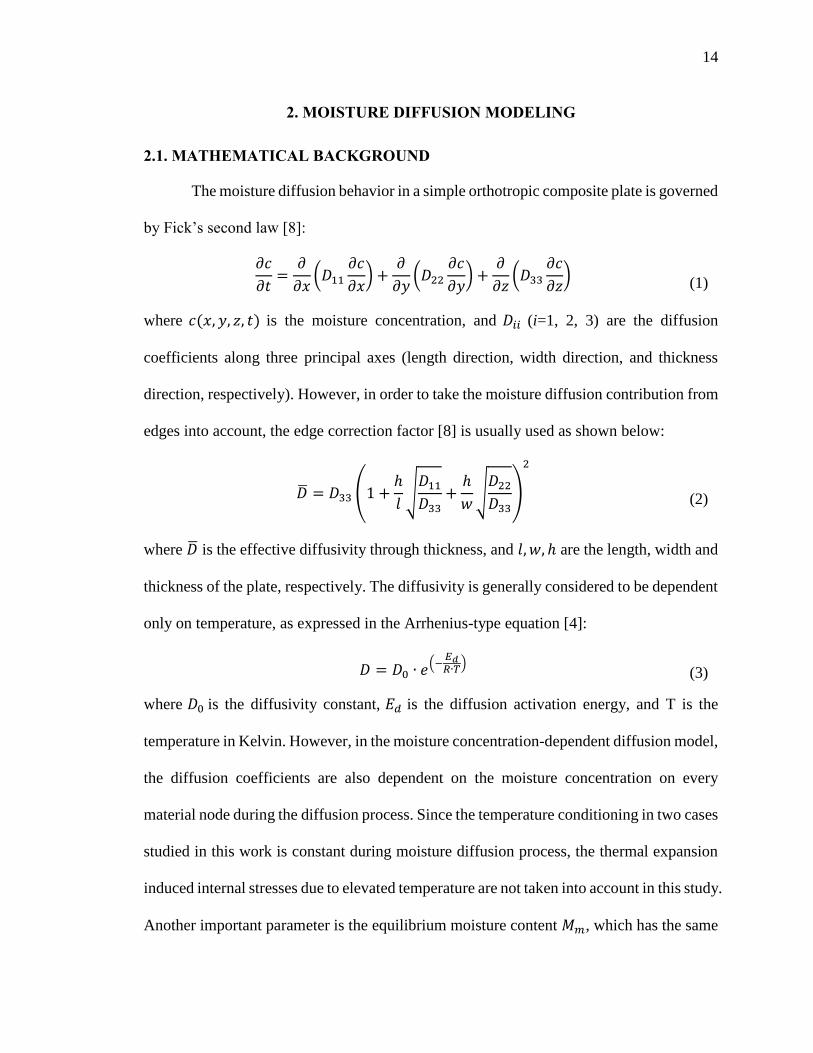
2. MOISTURE DIFFUSION MODELING
2.1. MATHEMATICAL BACKGROUND
The moisture diffusion behavior in a simple orthotropic composite plate is governed
by Fick’s second law [8]:
𝜕𝑐
𝜕𝑡=𝜕
𝜕𝑥(𝐷11
𝜕𝑐
𝜕𝑥) +
𝜕
𝜕𝑦(𝐷22
𝜕𝑐
𝜕𝑦) +
𝜕
𝜕𝑧(𝐷33
𝜕𝑐
𝜕𝑧)
(1)
where 𝑐(𝑥, 𝑦, 𝑧, 𝑡) is the moisture concentration, and 𝐷𝑖𝑖 (i=1, 2, 3) are the diffusion
coefficients along three principal axes (length direction, width direction, and thickness
direction, respectively). However, in order to take the moisture diffusion contribution from
edges into account, the edge correction factor [8] is usually used as shown below:
= 𝐷33 (1 +ℎ
𝑙√𝐷11𝐷33
+ℎ
𝑤√𝐷22𝐷33
)
2
(2)
where is the effective diffusivity through thickness, and 𝑙, 𝑤, ℎ are the length, width and
thickness of the plate, respectively. The diffusivity is generally considered to be dependent
only on temperature, as expressed in the Arrhenius-type equation [4]:
𝐷 = 𝐷0 ∙ 𝑒(−
𝐸𝑑𝑅∙𝑇
) (3)
where 𝐷0 is the diffusivity constant, 𝐸𝑑 is the diffusion activation energy, and T is the
temperature in Kelvin. However, in the moisture concentration-dependent diffusion model,
the diffusion coefficients are also dependent on the moisture concentration on every
material node during the diffusion process. Since the temperature conditioning in two cases
studied in this work is constant during moisture diffusion process, the thermal expansion
induced internal stresses due to elevated temperature are not taken into account in this study.
Another important parameter is the equilibrium moisture content 𝑀𝑚, which has the same

15
physical meaning as solubility. This parameter indicates the saturated moisture
concentration under certain moist conditioning and temperature. This value is typically a
constant if water immersion conditioning is applied, or in an exponential relationship with
relative humidity if the humid air conditioning is applied, as follows [8]:
Mm = constant (liquid immersion) (4)
Mm = a ∙ RHb (humid air) (5)
where 𝑎 and 𝑏 are both experimentally determined constants.
2.2. NORMALIZATION APPROACH
A few similarities exist between Fick’s law and Fourier’s law, which govern the mass
diffusion and heat transfer, respectively. The governing equation for three-dimensional
heat transfer in orthotropic materials is given by [8]
𝜌𝐶𝑃𝜕𝑇
𝜕𝑡=𝜕
𝜕𝑥(𝐾𝑥
𝜕𝑇
𝜕𝑥) +
𝜕
𝜕𝑦(𝐾𝑦
𝜕𝑇
𝜕𝑦) +
𝜕
𝜕𝑧(𝐾𝑧
𝜕𝑇
𝜕𝑧)
(6)
where 𝜌 is the material density, 𝐶𝑃 is the specific heat capacity, and T is the temperature.
The thermal diffusivity 𝐾/(𝜌𝐶𝑃) is the change rate of the temperature. For most materials,
the thermal diffusivity is several orders higher than the mass diffusivity, which means that
the material can reach thermal equilibrium state much faster than moisture equilibrium
state.
The difference between heat transfer and mass diffusion is the continuity of primary
variables at the interface for layered multi-material system. For heat transfer, the
temperature is always continuous at the interface between different materials. While for
moisture diffusion, the moisture concentration is discontinuous at the interface of different
materials since different materials have different saturated moisture concentration. The

16
moisture concentration discontinuity at the interface for bi-materials system can be
expressed as
𝐶1 ≠ 𝐶2 (7)
Material-1 has a higher saturated moisture concentration (solubility) than material-2 (See
Figure 2.1(a)). In both unsaturated and saturated conditions, the moisture concentration at
the interface of a layered bi-material system is not continuous. To remove the concentration
discontinuity at the interface, a new term- normalized concentration was introduced [18]
and expressed as
∅ = 𝐶/𝑆 (8)
where 𝐶 is the moisture concentration and 𝑆 is the solubility. 𝑆 primarily depends on
material type and conditioning approach. After this new term is introduced, the moisture
concentration discontinuity at the interface is removed. The continuity of moisture
concentration at interface nodes is expressed as
∅ =𝐶1𝑆1=𝐶2𝑆2 𝑜𝑟
𝐶1𝐶2=𝑆1𝑆2= 𝑐𝑜𝑛𝑠𝑡𝑎𝑛𝑡
(9)
The normalized concentration ∅ is continuous at the interface nodes in both unsaturated
and saturated conditions (see Figure 2.1(b)). Essentially, 𝐶1
𝐶2= 𝑐𝑜𝑛𝑠𝑡𝑎𝑛𝑡 is the necessary
condition for the continuity of normalized concentration at interfacial nodes. The necessity
of this condition could be further proved by Henry’s law [19].

17
(a)
(b)
Figure 2.1. (a) Discontinuity of moisture concentration at the interface for a bi-material
system, (b) continuity of normalized concentration at the interface for a bi-material
system
2.3. FINITE ELEMENT MODELING
The three-dimensional Fickian equation with normalized concentration ∅ can be
expressed as
𝜕∅
𝜕𝑡=𝜕
𝜕𝑥(𝐷11
𝜕∅
𝜕𝑥) +
𝜕
𝜕𝑦(𝐷22
𝜕∅
𝜕𝑦) +
𝜕
𝜕𝑧(𝐷33
𝜕∅
𝜕𝑧)
(10)
The finite element equations are given by
[𝐾]∅ + [𝑀]∅ = 𝐹 (11)
[𝑀] = ∫[𝑁]𝑇[𝑁] 𝑑Ω (12)
[𝐾] = ∫[𝐵]𝑇[𝐷] [𝐵]𝑑Ω (13)
𝐹 = ∫𝑞 [𝑁]𝑇 𝑑Ω (14)

18
where [𝐾] is the moisture diffusivity matrix, [𝑀] is the moisture velocity matrix, [𝑁] is the
shape function, 𝐹 is the moisture flow vector, ∅ is the nodal normalized moisture
content, and∅ is the change rate of the nodal normalized moisture concentration. The
diffusivity matrix [D] is given by
[𝐷] = [𝐷11 0 00 𝐷22 00 0 𝐷33
] (15)
The matrix of derivatives of shape functions [𝐵] is given by
[𝐵] =
[ 𝜕[𝑁]
𝜕𝑥𝜕[𝑁]
𝜕𝑦𝜕[𝑁]
𝜕𝑧 ]
(16)

19
3. NUMERICAL SIMULATION
To validate the moisture concentration-dependent diffusion model for layered
hybrid composites, a case study was conducted and the results were compared with
experimental findings from the literature [20, 21]. A detailed manufacturing process is
presented in the same literature. All experimental specimens were made from
unidirectional S-glass fiber-reinforced epoxy polymer GFRP prepreg 3M SP250-S29 and
unidirectional high modulus carbon fiber-reinforced epoxy polymer CFRP prepreg
Cyanamid T152/751/135. In Case 1, unidirectional three-layer hybrid composite
specimens were layered up with 4 plies of GFRP prepregs on both the top and bottom and
8 plies of CFRP prepregs in the middle (see Figure 3.1). The dimensions after curing were
2.76 in. x 2.76 in. x 0.13 in. (70 mm x 70 mm x 3.2 mm). The specimens were conditioned
at 45 and 84% RH for 70 days. The moisture weight gain of multi-layer hybrid structure
was calculated with
𝑀𝑡𝑜𝑡𝑎𝑙 =𝑊𝑤1 +𝑊𝑤2 +⋯𝑊𝑤𝑛𝑊𝑑1 +𝑊𝑑2 +⋯𝑊𝑑𝑛
(17)
where 𝑊𝑤𝑖 and 𝑊𝑑𝑖 (i=1, 2, …..n) are the weight of absorbed moisture and initial weight
for the nth layer component, respectively.
Figure 3.1. Geometry of three-layer hybrid plate (Case 1)

20
In Case 1, both the length and width of the plate are much larger than the thickness
(the aspect ratio was 21.88), the moisture diffusion from four edge sides can be ignored.
Hence, this case can be modeled as a one-dimensional diffusion problem along the
thickness direction, which significantly reduces the computational cost. A mesh
convergence study was conducted in this one-dimensional model. Four different mesh sizes,
with 7, 11, 32, and 64 elements, in the thickness direction were investigated. Differences
were evident in 7 and 11 elements, both of which had higher moisture concentration and
normalized moisture concentration compared with the other two cases (see Figure 3.2(a)
and Figure 3.2(b)). Finite element models with mesh sizes of 32 and 64 elements showed
the results overlapping over each other, implying convergence of results. The moisture
content value jump in Figure 3.2(a) indicated the discontinuity of moisture concentration
at the interfaces of CFRP and GFRP laminates, while the normalized moisture
concentration is always continuous at the interfaces (see Figure 3.2(b)). The convergence
study was also conducted for later three-dimensional cases. In both one-dimensional and
three-dimensional cases, the initial time increment is 0.01 h and maximum time increment
is 60 h. The solution convergence with time is adaptively controlled by an iteration
algorithm in ABAQUS.
The saturated moisture content and various material properties for both fiber-
reinforced composites were obtained from previous studies [20-22], as listed in Table 3.1.
Another important diffusion parameter was the diffusion coefficient along the thickness
direction. Unlike the traditional Arrhenius relationship for diffusivities used in finite
difference code [21], a moisture concentration-dependent diffusion method is incorporated
in finite element modeling to explain the moisture weight gain for layered hybrid structures.

21
In this method, as moisture penetrates into composites, the fibers restrain the matrix from
free-swelling. Thus, the swelling stress builds up gradually, resulting in the decrease of
diffusion coefficients. Consequently, the diffusion coefficients are not only dependent on
temperature, but also dependent on the nodal moisture concentration at each time increment.
The moisture concentration-dependent diffusion coefficients are expressed as:
𝐷𝑧 = 𝐷0 ∙ 𝛹(𝐶) ∙ 𝑀(ℎ) ∙ 𝑒(−
𝐸𝑑𝑅∙𝑇
) (18)
where 𝛹(𝐶) is the pattern function representing the dependence of diffusivity on nodal
moisture concentration. 𝑀(ℎ) is an experimentally determined thickness factor which is
similar to the edge correction factor, representing the dependence of diffusivity on the
specimen thickness. In this study, the initial effective diffusivities were obtained from the
initial slopes of moisture absorption curves. The pattern functions were obtained by trial-
and-error methods. The resultant effective diffusivities of CFRP and GFRP in Case 1 are
illustrated in Figure 3.3(a). For both CFRP and GFRP composites, when nodal moisture
concentration increases, the diffusivities continuously decrease, and when the moisture
concentration approaches solubility value 𝑀𝑚, the diffusivities gradually drift to a constant
value. The concentration-dependent diffusivity curves in Figure 3.3(a) are continuous fifth-
order polynomial curves. The corresponding normalized pattern functions are given by
𝛹𝐶𝐹𝑅𝑃 = 2.011 ∙ 10−20 ∙ 𝐶5 − 8.179 ∙ 10−16 ∙ 𝐶4 + 1.190 ∙ 10−11 ∙ 𝐶3 − 6.443∙ 10−8 ∙ 𝐶2 − 2.650 ∙ 10−5 ∙ 𝐶 + 1 (19)
𝛹𝐺𝐹𝑅𝑃 = 9.219 ∙ 10−20 ∙ 𝐶5 − 2.878 ∙ 10−15 ∙ 𝐶4 + 3.197 ∙ 10−11 ∙ 𝐶3 − 1.338∙ 10−7 ∙ 𝐶2 + 5.339 ∙ 10−6 ∙ 𝐶 + 1 (20)
The pattern function for CFRP is different from that of GFRP. The initial effective
diffusivities for CFRP and GFRP were 2.708 × 10⁻⁶ 𝑚𝑚2/𝑠𝑒𝑐 and1.075 × 10−6 𝑚𝑚2/
𝑠𝑒𝑐, respectively. Figure 3.3(b) illustrates that the simulation results from day 3 to day 49

22
overestimate the moisture uptake. But overall, the simulation results reasonably match with
experimental findings.
(a)
(b)
Figure 3.2. (a) Mesh convergence of moisture concentration (Case 1), (b) mesh
convergence of normalized moisture concentration (Case 1)
Table 3.1. Diffusion properties for CFRP and GFRP
CFRP GFRP
𝑀∞ 1.23% @ 84% RH 0.86% @ 84% RH
Density after Curing 1.54 g/cm3 1.90 g/cm3
Fiber Volume Fraction 56% 54%
0 0.5 1 1.5 2 2.5 3 3.50.5
0.55
0.6
0.65
0.7
0.75
0.8
0.85
Depth (mm)
Mo
istu
re C
on
ce
ntr
atio
n (
%)
7 elements
11 elements
32 elements
64 elements
0 0.5 1 1.5 2 2.5 3 3.50.55
0.6
0.65
0.7
0.75
0.8
0.85
0.9
0.95
1
Depth (mm)
No
rma
lize
d M
ois
ture
Co
nce
ntr
atio
in
7 elements
11 elements
32 elements
64 elements

23
(a)
(b)
Figure 3.3. (a) Effective diffusivities of CFRP and GFRP (Case 1), (b) comparison
between simulation results and experimental findings (Case 1)
The moisture concentration-dependent method was implemented using a user-
defined subroutine USDFLD in ABAQUS version 6.10. Figure 3.4 illustrates the flowchart
of subroutine USDFLD. At the beginning of every time step, the normalized moisture
concentration ∅ and moisture concentration 𝑐 are calculated at all integration points. The
0 0.2 0.4 0.6 0.8 1 1.2 1.40
0.5
1
1.5
2
2.5
3x 10
-6
Moisture Concentration (%)
Diffu
siv
ity (
mm
2/s
ec)
Effective diffusivity Dz of CFRP in case 1
Effective diffusivity Dz of GFRP in case 1
0 1 2 3 4 5 6 7 8 9 100
0.1
0.2
0.3
0.4
0.5
0.6
0.7
0.8
Square Root (time) (days 1/2)
Mt (
%)
Simulation results in case 1
Experimental results in case 1

24
user-defined subroutine USDFLD checks the new ∅ and 𝑐 at all material points, and the
moisture diffusivity matrix is updated according to these values. Then the updated moisture
diffusivity matrix is incorporated in new assembly equation, which is iteratively solved to
get new normalized moisture concentration and moisture concentration for next time step.
Figure 3.4. Flowchart of user-defined subroutine USDFLD
The moisture concentration-dependent diffusion method had been validated by
comparing simulation results with experimental findings in Case 1 (see Figure 3.3(b)). This
case study was extended to Case 2. In Case 2, four-layer unidirectional hybrid laminates
with or without adhesive layers were conditioned at 45 and 84% RH for 1.5 years, and
the effect of adhesives on the moisture diffusion behavior was investigated. The laminate
configuration, with and without adhesive layers, is illustrated in Figure 3.5. Two different
adhesive thicknesses (0.12 mm and 0.76 mm) were considered in this case.
In this case, the thickness of multi-layer hybrid composite structure was
considerable, thus the moisture contribution from four edges must be taken into account.
Start of New Step
Start of Increment
Solve
Converged?No
Calculate at integration point
USDFLD
Start of Iteration
Write Output
End of Step?No
FMK
Yes

25
The laminate configuration under investigation was symmetric with respect to both
geometry and boundary conditions along three principle axes. To save computational cost,
1/8th of the geometry was modeled for hybrid laminates (see Figure 3.6(a) and Figure
3.6(b)). The three outer surfaces of the laminate configuration, with and without adhesive
layers, were subjected to saturated boundary conditions.
Figure 3.5. Hybrid laminate configuration without (left) and with (right) adhesive layers
(Case 2)
Since Case 1 and Case 2 are under the same temperature and relative humidity
conditions, the same normalized pattern functions for both CFRP and GFRP in Case 1
applied to Case 2. In Case 2, the through-thickness diffusivities for CFRP and GFRP were
calculated by dividing the effective diffusivities in Case 1 with edge correction factor. The
edge correction factor in Case 1 was 1.191 which was determined using Equation (2). The
longitudinal diffusivities were derived using the following equations [8]:
𝐷11 = (1 − 𝑣𝑓) ∙ 𝐷𝑟 (21)
𝐷22 = (1 − 2√𝑣𝑓𝜋⁄ ) ∙ 𝐷𝑟 (22)
where 𝐷11 is the longitudinal diffusivity, 𝐷22 is the transverse diffusivity, and 𝐷𝑟 is
diffusivity in resin matrix. Because both the composite components are unidirectional, the
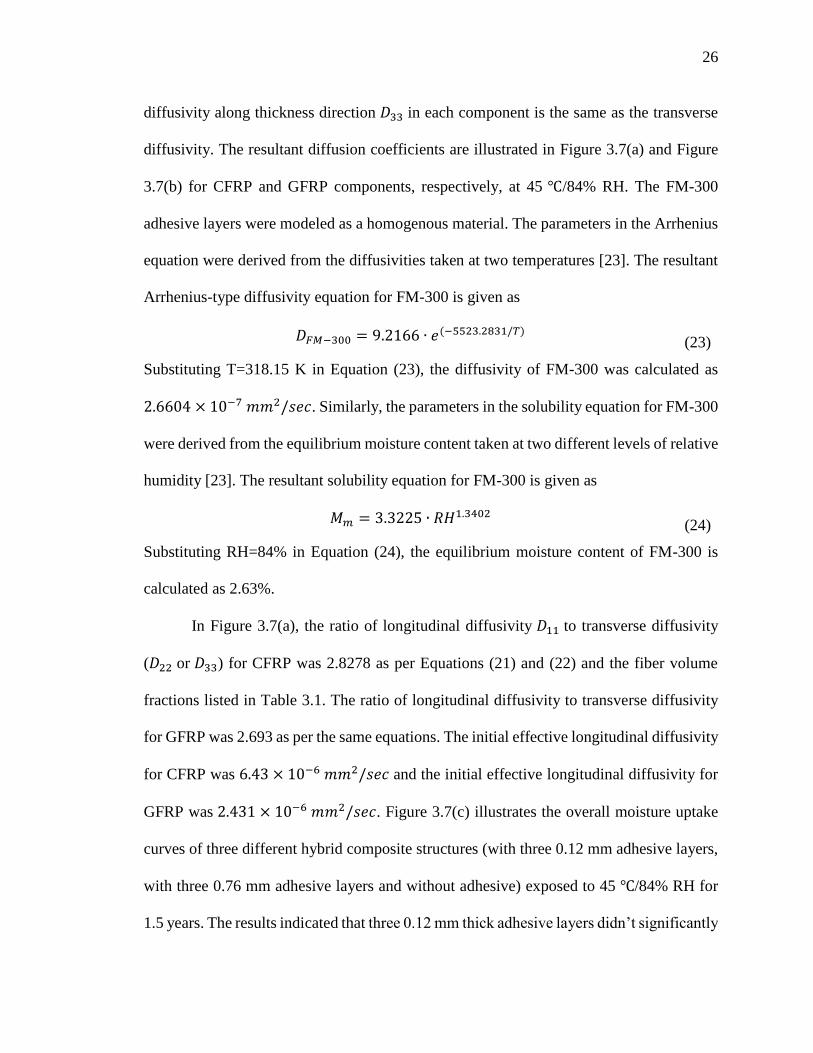
26
diffusivity along thickness direction 𝐷33 in each component is the same as the transverse
diffusivity. The resultant diffusion coefficients are illustrated in Figure 3.7(a) and Figure
3.7(b) for CFRP and GFRP components, respectively, at 45 /84% RH. The FM-300
adhesive layers were modeled as a homogenous material. The parameters in the Arrhenius
equation were derived from the diffusivities taken at two temperatures [23]. The resultant
Arrhenius-type diffusivity equation for FM-300 is given as
𝐷𝐹𝑀−300 = 9.2166 ∙ 𝑒(−5523.2831/𝑇) (23)
Substituting T=318.15 K in Equation (23), the diffusivity of FM-300 was calculated as
2.6604 × 10⁻⁷ 𝑚𝑚2/𝑠𝑒𝑐. Similarly, the parameters in the solubility equation for FM-300
were derived from the equilibrium moisture content taken at two different levels of relative
humidity [23]. The resultant solubility equation for FM-300 is given as
𝑀𝑚 = 3.3225 ∙ 𝑅𝐻1.3402 (24)
Substituting RH=84% in Equation (24), the equilibrium moisture content of FM-300 is
calculated as 2.63%.
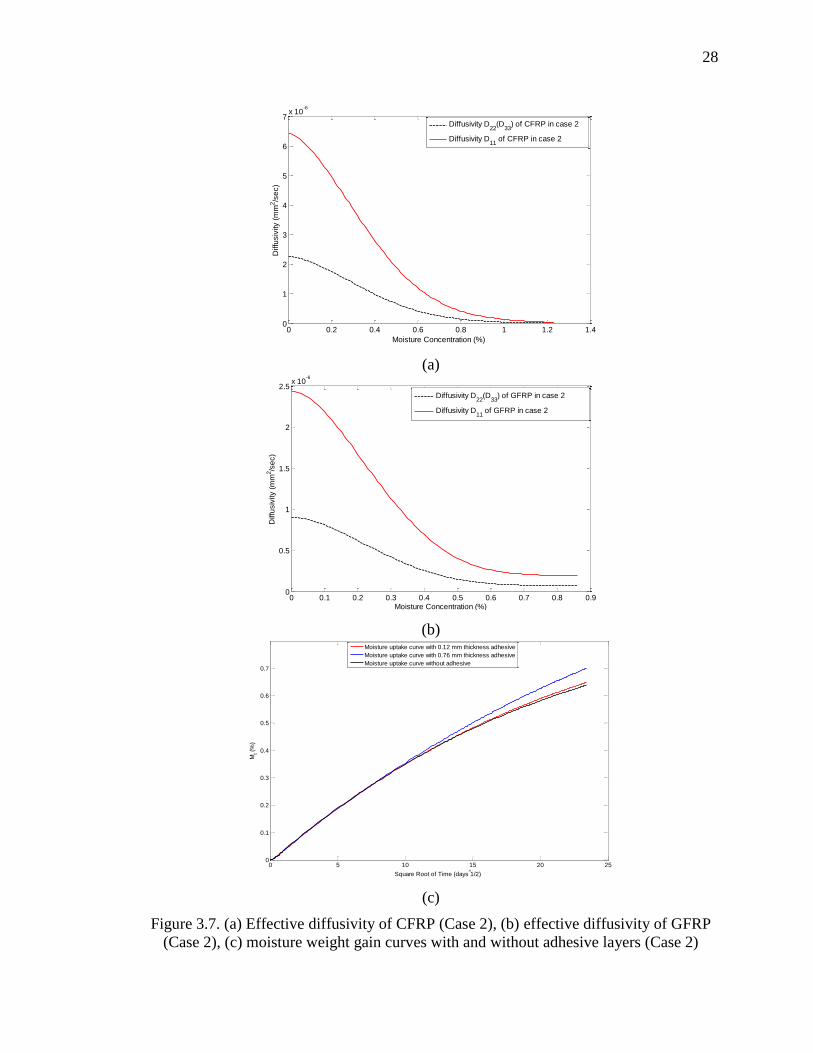
In Figure 3.7(a), the ratio of longitudinal diffusivity 𝐷11 to transverse diffusivity
(𝐷22 or 𝐷33) for CFRP was 2.8278 as per Equations (21) and (22) and the fiber volume
fractions listed in Table 3.1. The ratio of longitudinal diffusivity to transverse diffusivity
for GFRP was 2.693 as per the same equations. The initial effective longitudinal diffusivity
for CFRP was 6.43 × 10⁻⁶ 𝑚𝑚2/𝑠𝑒𝑐 and the initial effective longitudinal diffusivity for
GFRP was 2.431 × 10⁻⁶ 𝑚𝑚2/𝑠𝑒𝑐. Figure 3.7(c) illustrates the overall moisture uptake
curves of three different hybrid composite structures (with three 0.12 mm adhesive layers,
with three 0.76 mm adhesive layers and without adhesive) exposed to 45 /84% RH for
1.5 years. The results indicated that three 0.12 mm thick adhesive layers didn’t significantly

27
influence the overall moisture uptake as compared to without-adhesive case. At the end of
1.5 years’ exposure, the overall moisture weight gain for hybrid structure without adhesive
was 0.64%. For hybrid structure with 0.12 mm thickness adhesive, the moisture weight
gain was 0.65%. For hybrid structure with 0.76 mm adhesive, the adhesive’s effect on
moisture weight gain is negligible for the first 81 days, but after that, the difference of
average moisture uptake between without-adhesive case and 0.76 mm adhesive case
gradually increased. At the end of exposure, the moisture uptake percentage for hybrid
structure with 0.76 mm thickness adhesive was 0.70%, which was 9.38% higher than
without-adhesive case. The moisture concentration and normalized concentration
distribution of three different hybrid composite structures after 1.5 years’ exposure are
shown in Figure 3.8, Figure 3.9 and Figure 3.10. Both discontinuity of the moisture
concentration and continuity of the normalized concentration at the interfaces of different
components can be clearly observed from these contours.
(a)
(b)
Figure 3.6. (a) 1/8th model of four-layer symmetric hybrid composites with adhesive
(Case 2), (b) 1/8th model of four-layer symmetric hybrid composites without adhesive
(Case 2)
28
(a)
(b)
(c)
Figure 3.7. (a) Effective diffusivity of CFRP (Case 2), (b) effective diffusivity of GFRP
(Case 2), (c) moisture weight gain curves with and without adhesive layers (Case 2)
0 0.2 0.4 0.6 0.8 1 1.2 1.40
1
2
3
4
5
6
7x 10
-6
Moisture Concentration (%)
Diffu
siv
ity (
mm
2/s
ec)
Diffusivity D22
(D33
) of CFRP in case 2
Diffusivity D11
of CFRP in case 2
0 0.1 0.2 0.3 0.4 0.5 0.6 0.7 0.8 0.90
0.5
1
1.5
2
2.5x 10
-6
Moisture Concentration (%)
Diffu
siv
ity (
mm
2/s
ec)
Diffusivity D22
(D33
) of GFRP in case 2
Diffusivity D11
of GFRP in case 2
0 5 10 15 20 250
0.1
0.2
0.3
0.4
0.5
0.6
0.7
Square Root of Time (days^1/2)
Mt (
%)
Moisture uptake curve with 0.12 mm thickness adhesive
Moisture uptake curve with 0.76 mm thickness adhesive
Moisture uptake curve without adhesive

29
Figure 3.8. Moisture concentration and normalized concentration contour after 1.5 years’
exposure (without-adhesive)
Figure 3.9. Moisture concentration and normalized concentration contour after 1.5 years’
exposure (0.12 mm adhesive)
Figure 3.10. Moisture concentration and normalized concentration contour after 1.5
years’ exposure (0.76 mm adhesive)
30
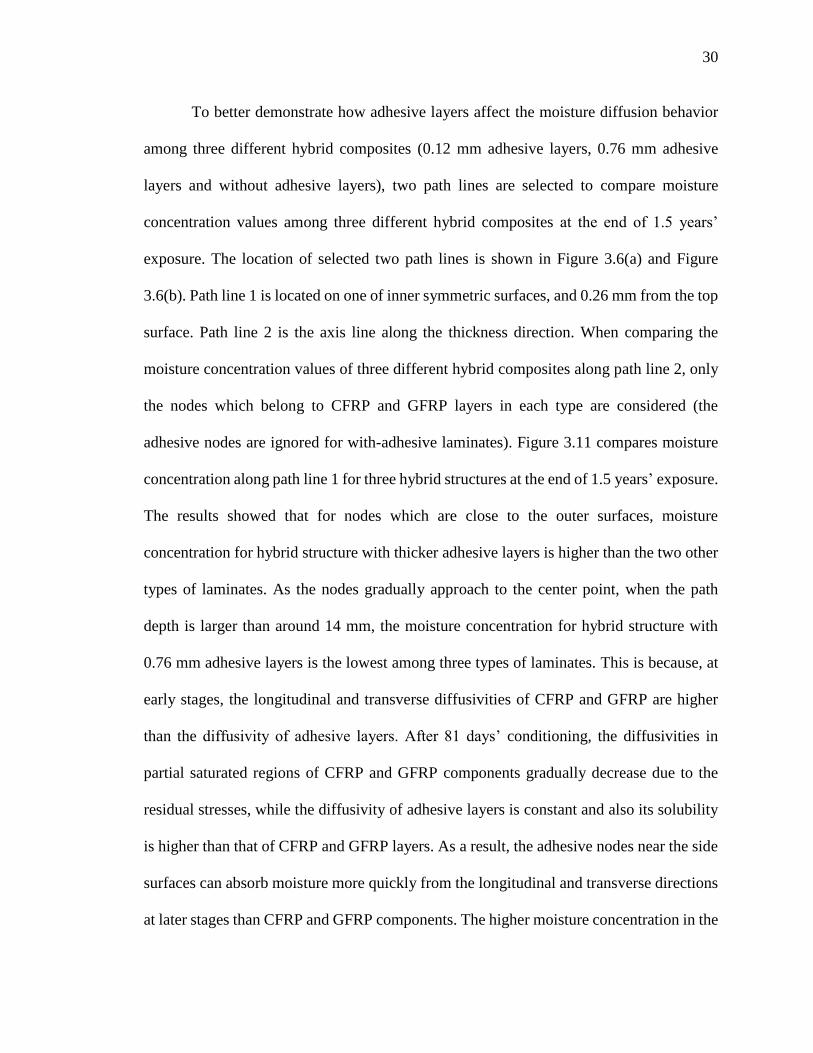
To better demonstrate how adhesive layers affect the moisture diffusion behavior
among three different hybrid composites (0.12 mm adhesive layers, 0.76 mm adhesive
layers and without adhesive layers), two path lines are selected to compare moisture
concentration values among three different hybrid composites at the end of 1.5 years’
exposure. The location of selected two path lines is shown in Figure 3.6(a) and Figure
3.6(b). Path line 1 is located on one of inner symmetric surfaces, and 0.26 mm from the top
surface. Path line 2 is the axis line along the thickness direction. When comparing the
moisture concentration values of three different hybrid composites along path line 2, only
the nodes which belong to CFRP and GFRP layers in each type are considered (the
adhesive nodes are ignored for with-adhesive laminates). Figure 3.11 compares moisture
concentration along path line 1 for three hybrid structures at the end of 1.5 years’ exposure.
The results showed that for nodes which are close to the outer surfaces, moisture
concentration for hybrid structure with thicker adhesive layers is higher than the two other
types of laminates. As the nodes gradually approach to the center point, when the path
depth is larger than around 14 mm, the moisture concentration for hybrid structure with
0.76 mm adhesive layers is the lowest among three types of laminates. This is because, at
early stages, the longitudinal and transverse diffusivities of CFRP and GFRP are higher
than the diffusivity of adhesive layers. After 81 days’ conditioning, the diffusivities in
partial saturated regions of CFRP and GFRP components gradually decrease due to the
residual stresses, while the diffusivity of adhesive layers is constant and also its solubility
is higher than that of CFRP and GFRP layers. As a result, the adhesive nodes near the side
surfaces can absorb moisture more quickly from the longitudinal and transverse directions
at later stages than CFRP and GFRP components. The higher moisture concentration in the

31
adhesive layers compared with surrounding CFRP and GFRP laminate can be observed
from Figure 3.9 and Figure 3.10. Since adhesive nodes near the side surfaces have higher
moisture concentration than that of surrounding CFRP and CFRP laminate, those nodes
play a role of accelerating the moisture diffusion to the surrounding CFRP and CFRP nodes.
While in the center region, the number of saturated adhesive nodes is not as many as the
side adhesive nodes, thus the adhesive nodes near the center will not be able to play the
acceleration role as the side adhesive nodes do. Also in the center region, most of CFRP
and CFRP are not fully saturated; the diffusivity of CFRP and CFRP components is still
higher than the diffusivity of adhesive layers. This is the reason that moisture concentration
of hybrid structure with thicker adhesive layers along path line 2 is lower than the other
two structures (as shown in Figure 3.12). However, as time elapses, more and more
adhesive nodes will gradually get saturated and its acceleration role will be more evident
(as shown in Figure 3.7(c)).
Figure 3.11. Comparison of moisture concentration along path line 1 among three
different hybrid structures after 1.5 years’ exposure
0 5 10 15 20 25
0.4
0.5
0.6
0.7
0.8
0.9
1
Path Line Depth (mm)
Mois
ture
Concentr
ation (
%)
0.12 mm adhesive
0.76 mm adhesive
Without adhesive

32
Figure 3.12. Comparison of moisture concentration along path line 2 among three
different hybrid structures after 1.5 years’ exposure
0 1 2 3 4 5 6
0.4
0.5
0.6
0.7
0.8
0.9
1
Path Line Depth (mm)
Mo
istu
re C
on
ce
ntr
atio
n (
%)
Without adhesive
0.12 mm adhesive (ignored adhesive layers)
0.76 mm adhesive (ignored adhesive layers)

33
4. CONCLUSIONS
A moisture concentration-dependent method was proposed and implemented using
user-defined subroutine USDFLD in commercial finite element code to simulate moisture
diffusion behavior in multi-layer unidirectional fiber-reinforced hybrid composite
structures. The moisture concentration-dependent method assumes that the fibers restrain
the matrix from free-swelling. As a result, the diffusion coefficients gradually decrease due
to swelling stress built inside the material during the diffusion process, and then drift to a
constant value when moisture concentration approaches equilibrium moisture content. The
concentration-dependent diffusivity curves are continuous fifth-order polynomial curves.
The curve pattern function for CFRP component was different from that of GFRP. Finite
element model for a three-layer hybrid composite structure was developed, and the
simulation results were validated with experimental findings. This model was extended to
simulate the moisture diffusion behavior in adhesive-bonded four-layer hybrid symmetric
composite laminates. The results indicated that thinner adhesive layers (0.12 mm thick)
didn’t significantly affect the overall moisture uptake. Thicker adhesive layers (0.76 mm
thick) noticeably accelerated the overall moisture uptake after 81 days’ conditioning. This
is because, the diffusivities in partial saturated regions of CFRP and GFRP components
gradually decrease due to the residual stresses, while the diffusivity of adhesive layers is
constant and also its solubility is higher than that of CFRP and GFRP layers. As a result,
the adhesive nodes near the side surfaces can absorb moisture more quickly from the
longitudinal and transverse directions at later stages than CFRP and GFRP components.
The dependency of adhesive’s diffusion coefficients on moisture concentration will be
investigated in the future.

34
5. ACKNOWLEDGEMENT
This research is sponsored by Bell Helicopter Textron, Inc., Fort Worth, TX. Partial
support from National University Transportation Center (NUTC) at Missouri University of
Science and Technology is gratefully acknowledged.
35
REFERENCES
1) Gururaja, M.N. and Rao, A.N.H. “A Review on Recent Applications and Future
Prospectus of Hybrid Composites.” International Journal of Soft Computing and
Engineering, Vol. 1, pp. 352-355, 2012.
2) Springer, G.S. Environmental Effects on Composite Materials, Technomic Publishing
Co., Westport, CT, 1981.
3) Loos, A.C. and Springer, G.S. “Moisture Absorption of Graphite-Epoxy Composites
Immersed in Liquids and in Humid Air.” Journal of Composite Materials, Vol. 13, pp.
131-147, 1979.
4) Shen, C.H. and Springer, G.S. “Effects of Moisture and Temperature on the Tensile
Strength of Composite Materials.” Journal of Composite Materials, Vol. 11, pp. 2-16,
1977.
5) Browning, C.E. “The Mechanism of Elevated Temperature Property Losses in High
Performance Structural Epoxy Resin Matrix Material after Exposure to High Humidity
Environments.” Polymer Engineering and Science, Vol. 18, pp. 16-24, 1978.
6) Tsai, Y.I., Bosze, E.J., Barjasteh, E., and Nutt, S.R. “Influence of Hygrothermal
Environment on Thermal and Mechanical Properties of Carbon Fiber/Fiberglass
Hybrid Composites.” Composite Science and Technology, Vol. 69, pp. 432-437, 2009.
7) Bao, L.R. and Yee, A.F. “Moisture Diffusion and Hygrothermal Aging in
Bismaleimide Matrix Carbon Fiber Composites: Part II-Woven and Hybrid
Composites.” Composites Science and Technology, Vol. 62, pp. 2111-2119, 2002.
8) Shen, C.H. and Springer, G.S. “Moisture Absorption and Desorption of Composite
Materials.” Journal of Composite Materials, Vol. 10, pp. 2-20, 1976.
9) Loos, A.C. and Springer, G.S. “Moisture Absorption of Polyester-E Glass
Composites.” Journal of Composite Materials, Vol. 14, pp. 142-154, 1980.
10) Gopalan, R., Rao, R.M.V.G.K., Murthy, M.V.V., and Dattaguru, B. “Diffusion Studies
on Advanced Fibre Hybrid Composites.” Journal of Reinforced Plastics and
Composites, Vol. 5, pp. 51-61, 1986.
11) Gurtin, M.E. and Yatomi, C. “On a Model for Two Phase Diffusion in Composite
Materials.” Journal of Composite Materials, Vol. 13, pp. 126-130, 1979.
12) Weitsman, Y. “Coupled Damage and Moisture-transport in Fiber-reinforced,
Polymeric Composites.” International Journal of Solids and Structures, Vol. 23, pp.
1003-1025, 1987.

36
13) Whitney, J.M. and Browning, C.E. “Some Anomalies Associated with Moisture
Diffusion in Epoxy Matrix Composite Materials.” Advanced Composite Materials-
Environmental Effects, ASTM STP 658, American Society for Testing and Materials,
pp. 43-60, 1978.
14) Gillat, O. and Broutman, L.J. “Effect of an External Stress on Moisture Diffusion and
Degradation in a Graphite-Reinforced Epoxy Laminate.” Advanced Composite
Materials-Environmental Effects, ASTM STP 658, Vinson, J. R., Ed., American
Society for Testing and Materials, pp. 61-83, 1978.
15) Wan, Y.Z., Wang, Y.L., Huang, Y., He, B.M., and Han, K.Y. “Hygrothermal Aging
Behaviour of VARTMed Three-dimensional Braided Carbon-epoxy Composites under
External Stresses.” Composite Part A: Applied Science and Manufacturing, Vol. 36,
pp. 1102-1109, 2005.
16) Crank, J. “A Theoretical Investigation of the Influence of Molecular Relaxation and
Internal Stress on Diffusion in Polymers.” Journal of Polymer Science, Vol. 11, pp.
151-168, 1953.
17) Roe, N., Huo, Z., Chandrashekhara, K., Buchok, A., and Brack, R.A. “Advanced
Moisture Modeling of Polymer Composites.” Journal of Reinforced Plastics and
Composites, Vol. 32, pp. 437-449, 2013.
18) Galloway, J.E. and Miles, B.M. “Moisture Absorption and Desorption Predictions for
Plastic Ball Grid Array Packages.” IEEE Transactions on Components, Packaging, and
Manufacturing Technology. Part A, Vol. 20, pp. 274-279, 1997.
19) Wong, E.H., Teo, Y.C., and Lim, T.B. “Moisture Diffusion and Vapour Pressure
Modeling of IC Packaging.” Proceedings of the 48th Electronic Components and
Technology Conference, pp. 1372-1378, 1998.
20) Zaffaroni, G. “Two-dimensional Moisture Diffusion in Hybrid Composite
Components.” High Temperature and Environmental Effects on Polymeric
Composites, ASTM STP 1302, Gates, T. S. and Zureick, A., Eds., American Society
for Testing and Materials, pp. 97-109, 1997.
21) Cappelletti, C., Rivolta, A., and Zaffaroni, G. “Environmental Effects on Mechanical
Properties of Thick Composite Structural Elements.” Journal of Composites
Technology and Research, Vol. 17, pp. 107-114, 1995.
22) Renzo, D.J. Advanced Composite Materials: Products and Manufacturers, Noyes Data
Corp., Park Ridge, New Jersey, 1988.
23) Deiasi, R. J. and Schulte, R. L. “Experimental Determination of the Effects of Moisture
on Composite-to-Composite Adhesive Joints.” NASA-CR-3387, pp. 1-63, 1981.

37
II. EXPERIMENTATION AND SIMULATION OF MOISTURE DIFFUSION IN
FOAM-CORED POLYURETHANE SANDWICH STRUCTURE
Z. Huo, M. Mohamed, J.R. Nicholas, X. Wang, and K. Chandrashekhara*
Department of Mechanical and Aerospace Engineering
Missouri University of Science and Technology, Rolla, MO 65409
ABSTRACT
The moisture diffusion behavior of two-part thermoset polyurethane (PU) neat resin,
woven E-glass fiber-reinforced PU face sheet, closed-cell rigid PU foam core and their
corresponding sandwich specimens, was investigated in this study. The vacuum assisted
resin transfer molding (VARTM) process was used to manufacture the polyurethane
sandwich panels. Open-edge moisture diffusion experiment was conducted for sandwich
panel and its constituents by immersing each type of samples in distilled water at room
temperature for nearly seven months. Moisture diffusivities and solubility for neat resin,
face sheet and foam core specimens were characterized according to the experimental
analysis. The moisture diffusion behavior for closed-cell PU foam was found to deviate
significantly from classical Fick’s law, and a multi-stage diffusion model was thus
proposed to explain this deviation using a time-dependent diffusivity scheme. A user-
defined subroutine was developed to implement this scheme into the commercial finite
element analysis code ABAQUS. A three-dimensional dynamic finite element model was
developed to predict the moisture diffusion behavior in neat resin, face sheet, foam core
and sandwich specimens. This finite element model was then validated by comparing
simulation results with experimental findings.

38
1. INTRODUCTION
Sandwich composites are a class of load-carrying efficient structures that are
composed of two thin, stiff, strong face sheets bonded to a thick, lightweight core. Such an
optimized design provides high bending stiffness and strength at a low weight. As a result,
sandwich composites have been utilized broadly in the transportation, energy, aerospace
and marine industries [1-4]. One essential concern for such sandwich composites during
service is their structural durability when exposed to high relative humidity (RH) or water
immersion conditioning. Though most engineering fibers are generally considered to be
impermeable, moisture absorption in polymer foams and thermoplastic/thermoset resin
matrices is substantial.
Considerable efforts have been made to experimentally investigate the effects of
moisture absorption on the mechanical properties of thermoplastic/thermoset resin, fiber-
reinforced composite laminates, polymeric foams and sandwich structures. Extensive
studies [5-7] have indicated that absorption of water molecules degraded mechanical
properties of polymer composites due to plasticizing effects and resin deterioration. The
fiber/matrix interfacial strength degraded significantly as the water preferentially diffused
along the fiber/matrix interface under hygrothermal conditioning [8-10]. Additional studies
[11-13] have also indicated that polymer foams’ mechanical properties are substantially
affected by moisture absorption. Several researchers [14-16] investigated the mechanical
degradation of foam-cored sandwich structures exposed to varying hygrothermal
conditions.
From the aspect of numerical investigation, one-dimensional Fick’s law was most
frequently used by researchers [17-19] to investigate the moisture diffusion behavior in

39
fiber-reinforced composite laminates. Gopalan et al. [20] observed that moisture diffusion
in both simple and hybrid unidirectional fiber-reinforced composites exposed to water
immersion conditioning correlated well with analytical Fickian diffusion plots. However,
classical Fickian diffusion model is not always adequate in predicting the moisture
diffusion behavior in polymers or polymer composites in many circumstances. As a result,
several numerical models were proposed to explain these deviations. Bao and Yee [21]
proposed a dual-diffusivity model to describe moisture uptake curves in woven and
woven/uni-weave hybrid composites. Whitney and Browning [22] observed that moisture
diffusion in graphite/epoxy composites departs from classical Fickian behavior, and they
proposed a time-dependent diffusivity method associated with matrix cracking during
diffusion to explain this deviation. Weitsman [23] developed a coupled damage and
moisture-transport non-Fickian model to explain the moisture diffusion anomaly in
transversely isotropic fiber-reinforced polymer composites. A number of researchers have
also examined the moisture diffusion anomalies in polymer foams and sandwich structures.
Earl and Shenoi [24] observed a multi-stage moisture diffusion process in closed-cell PVC
foam under fresh-water immersion conditioning. They noted that this non-Fickian behavior
could be attributed to internal stress relaxation and complex geometry within the cellular
structure. Avilés et al. [25] observed similar multi-step moisture diffusion behavior in PVC
foam and PVC foam-cored E-glass/polyester sandwich specimens which were exposed to
either 95% relative humidity or sea water immersion conditioning. Reasonable agreement
was achieved between one-dimensional Fickian diffusion model and experimental data
when effective diffusivities were used for foam and sandwich specimens in the case of
water immersion conditioning. While in the case of 95% relative humidity conditioning,

40
the multi-step moisture uptake curves of foam core and sandwich specimens deviated
significantly from one-dimensional Fickian diffusion’s prediction. As a result, multi-step
diffusion models are suggested by the authors to achieve a better correlation.
However, few researchers have investigated the moisture diffusion behavior in
fiber-reinforced thermoset polyurethane composites and their corresponding sandwich
structures. In this study, VARTM process was used to manufacture sandwich composites
composed of woven E-glass fiber-reinforced thermoset polyurethane face sheets and
closed-cell polyurethane foam core. Polyurethane neat resin, sandwich specimens, and the
constituents were conditioned under 22°C/distilled water to investigate the moisture
diffusion behavior in those specimens. Diffusion parameters (moisture diffusivities and
equilibrium moisture contents) for neat resin, face sheet, and foam core specimens were
extracted from the experimental data. A three-dimensional dynamic finite element model
was developed to predict the moisture diffusion process in the constituents and sandwich
specimens. The simulation results were compared with experimental data to validate the
finite element model for predicting moisture absorption in test coupons.

41
2. EXPERIMENTATION
2.1. MATERIALS
The sandwich structures investigated in this study were made of closed-cell rigid
polyurethane foam core with density of 96 kg/m3 and woven E-glass fiber-reinforced
thermoset polyurethane matrix face sheets. The TRYMER™ 6000 foam was provided by
ITW (ITW Insulation Systems, Houston, TX) in the form of 12.7 mm thickness. The E-
glass fiber reinforcement in the form of a balanced 0/90˚ weave was obtained from Owens
Corning (Owens Corning, Toledo, OH). The matrix employed was a two-part thermoset
polyurethane resin system obtained from Bayer MaterialScience.
2.2. SAMPLE PREPARATION
Neat resin samples were manufactured by pouring the two-part resin system in a
steel mold after mixing and degassing. The cured neat resin panels were then cut into small
pieces of test specimens. VARTM process was adopted to manufacture polyurethane
sandwich samples. This process has several advantages over traditional resin transfer
molding and filament winding processes (e.g., low tooling costs). As a result, it has been
widely employed in the aerospace and marine industries. Prior to the resin infusion, an
aluminum mold was prepared by sanding smoothly to remove any surface imperfections.
A mold release agent was then applied on the mold surface to ease the sample removal
later. A layer of distribution medium was placed on the mold surface first, followed by a
peel ply, the preform, a peel ply and another layer of distribution medium. The sandwich
preform consisted of three layers of woven E-glass fabric on the both top and bottom, and
foam core in the center. A vacuum bag was placed over the mold and sealed with tacky
tape around the perimeter of the mold surface, thus creating a sealed environment. A

42
vacuum pump was applied to evacuate the sealed mold. A curing cycle of 70 °C for 1 hour
and then 80°C for 4 hours was selected. A schematic of VARTM process adopted in this
study is illustrated in Figure 2.1. Three sandwich panels (each 254 mm x 254 mm) were
manufactured. The average thickness of final sandwich panels was 19.0 mm. The face sheet
specimens were cut from the sandwich panels and then peeled from the foam core. A fine
grade sand paper was used to remove any remaining core residue from the surface. The
average fiber volume fraction of face sheets was determined as 55% by matrix digestion
method [26] using three replicates.
Figure 2.1. Schematic of VARTM process used to manufacture PU sandwich panels
2.3. CONDITIONING AND MOISTURE UPTAKE MEASUREMENTS
Test coupons of closed-cell polyurethane foam were cut directly from the as-
received panels. Face sheets were peeled from the manufactured sandwich panels. A
diamond saw was used to cut them into pieces with required dimensions. ASTM standards
C272 [27] and D5229 [28] were adopted as guidelines to conduct the open-edge moisture
absorption experiment for the neat resin, foam core, face sheet and sandwich specimens.
Three sets of facing samples with varying dimensions were used to characterize face
sheet’s diffusivities along three principal axes. Both neat resin and foam core were
considered to be globally homogenous in this study. Thus, only one set of test specimens

43
was selected. The moisture absorption behavior of one sandwich structure was studied after
diffusion parameters for both face sheet and foam core were evaluated. The test coupons’
nominal dimensions are listed in Table 2.1.
Table 2.1. Nominal dimensions of test coupons
Sample Label Dimensions (mm)
Length Width Thickness
Neat PU resin RN 42.3 19.6 2.6
PU foam FM 51.9 51.0 12.7
E-glass/PU face sheet L-A 70.4 70.3 3.2
L-B 70.2 22.6 3.6
L-C 70.4 35.6 3.7
PU sandwich S-S 49.6 22.1 19.0
Prior to immersion, all of the coupons were weighed and then dried in an oven at
60 °C for 72 hours until the weights stabilized. Coupons were then conditioned under
22°C/distilled water immersion for more than 6 months. Cotton cords were used to tie the
glass lids to foam core and sandwich specimens to ensure all six surfaces of those low
density samples were in full contact with distilled water. To monitor the moisture uptake,
the specimens were periodically taken out of distilled water, wiped off the surface water
using an absorbent paper and then immediately weighed using a Mettler Toledo XP204S
model analytical balance with a precision of 0.1 mg. The test coupons were always
removed and weighed in the same order and the surface water was absorbed by paper towel
in the same way to eliminate variations in the results. The moisture uptake of test coupons
at a specific time point was calculated as
𝑀(𝑡) =𝑊(𝑡) −𝑊𝑑
𝑊𝑑 (1)
where 𝑊(𝑡) is the wet sample’s weight at time 𝑡, and 𝑊𝑑 is the dry sample’s initial weight.
The weight measurements were initially taken with a short time interval during the first

44
week, and later with a longer periodicity since weight changes in the later stages were not
as large as that in the initial stages. The measurement time interval during which any
coupon was out of immersion conditioning was approximately six minutes and thus this
interval was considered to be negligible for the entire immersion time. Three replicates
were tested for each type of coupon to report the average and the standard deviation of
measurements.

45
3. METHODS AND ANALYSIS
3.1. DETERMINATION OF DIFFUSION PARAMETERS FOR FACE SHEETS
The moisture diffusion behavior in a simple orthotropic composite plate is governed
by Fick’s second law:
𝜕𝑐
𝜕𝑡=𝜕
𝜕𝑥(𝐷𝑥
𝜕𝑐
𝜕𝑥) +
𝜕
𝜕𝑦(𝐷𝑦
𝜕𝑐
𝜕𝑦) +
𝜕
𝜕𝑧(𝐷𝑧
𝜕𝑐
𝜕𝑧) (2)
where 𝑐(𝑥, 𝑦, 𝑧, 𝑡) is the moisture concentration, and 𝐷𝑥 , 𝐷𝑦 and 𝐷𝑧 are the diffusion
coefficients along three principal axes (length, width and thickness direction, respectively),
as illustrated in Figure 3.1. For thin plate in which the dimensions of length and width are
considerably larger than the dimension of thickness, only moisture diffusion through
thickness is considered, Equation (2) can be simplified as one-dimensional:
𝜕𝑐
𝜕𝑡=𝜕
𝜕𝑧(𝐷𝑧
𝜕𝑐
𝜕𝑧)
(3)
Figure 3.1. Geometry of orthotropic composite plate
However, an edge correction factor [18] is typically applied so that the moisture diffusion
contribution from four sides can be taken into account. The effective diffusivity is
expressed as
= 𝐷𝑧 (1 +ℎ
𝑙√𝐷𝑥𝐷𝑧+ℎ
𝑤√𝐷𝑦
𝐷𝑧)
2
(4)

46
where is the effective diffusivity along the thickness direction, and 𝑙, 𝑤, ℎ are the plate’s
length, width, and thickness, respectively. The interaction among six surfaces can be
neglected during the early stage of moisture diffusion, thus the moisture uptake is
expressed as function of time:
𝑀(𝑡) =4𝑀𝑠𝑎𝑡√𝑡
ℎ√𝜋(√𝐷𝑍 +
ℎ
𝑙√𝐷𝑥 +
ℎ
𝑤√𝐷𝑦) (5)
where 𝑀𝑠𝑎𝑡is the equilibrium moisture content (solubility). Substituting in Equation (4)
into Equation (5) obtains the following:
𝑀(𝑡) =4𝑀𝑠𝑎𝑡√𝑡
ℎ√𝜋√ (6)
The effective diffusivity for the thin plate can be calculated from the slope of the initial
linear portion of a typical moisture uptake curve (Figure 3.2):
√ = (𝑀2 −𝑀1
√𝑡2 − √𝑡1)ℎ√𝜋
4𝑀𝑠𝑎𝑡 (7)
where 𝑡1 and 𝑡2 are two specific time points on the linear portion of the moisture uptake
curve, 𝑀1 and 𝑀2 are corresponding moisture uptakes.
Figure 3.2. Derivation of the effective diffusivity using the initial constant slope
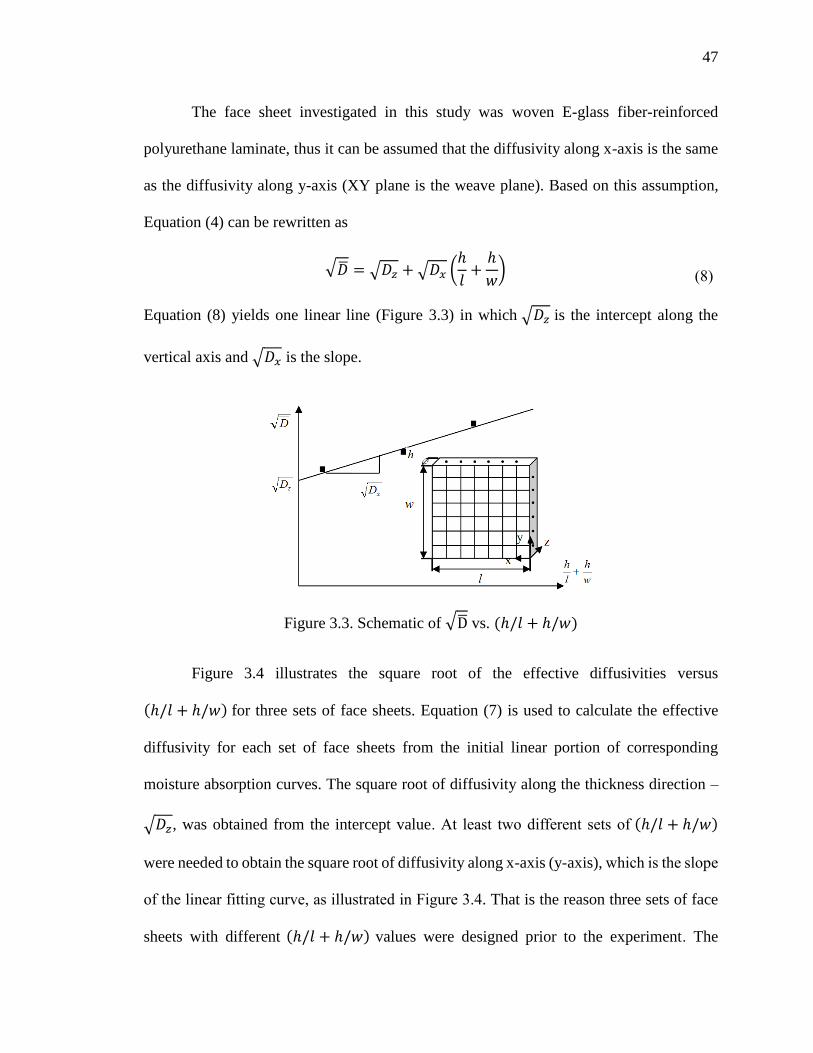
47
The face sheet investigated in this study was woven E-glass fiber-reinforced
polyurethane laminate, thus it can be assumed that the diffusivity along x-axis is the same
as the diffusivity along y-axis (XY plane is the weave plane). Based on this assumption,
Equation (4) can be rewritten as
√ = √𝐷𝑧 +√𝐷𝑥 (ℎ
𝑙+ℎ
𝑤) (8)
Equation (8) yields one linear line (Figure 3.3) in which √𝐷𝑧 is the intercept along the
vertical axis and √𝐷𝑥 is the slope.
Figure 3.3. Schematic of √D vs. (ℎ/𝑙 + ℎ/𝑤)
Figure 3.4 illustrates the square root of the effective diffusivities versus
(ℎ/𝑙 + ℎ/𝑤) for three sets of face sheets. Equation (7) is used to calculate the effective
diffusivity for each set of face sheets from the initial linear portion of corresponding
moisture absorption curves. The square root of diffusivity along the thickness direction –
√𝐷𝑧, was obtained from the intercept value. At least two different sets of (ℎ/𝑙 + ℎ/𝑤)
were needed to obtain the square root of diffusivity along x-axis (y-axis), which is the slope
of the linear fitting curve, as illustrated in Figure 3.4. That is the reason three sets of face
sheets with different (ℎ/𝑙 + ℎ/𝑤) values were designed prior to the experiment. The

48
resultant diffusivities for the woven face sheets are listed in Table 3.1. As expected, the
diffusivities along the fiber weave directions (𝐷𝑥 and 𝐷𝑦 ) were much larger than the
diffusivity along the stacking thickness direction (𝐷𝑧), indicating that moisture diffusion
preferentially occurs along fiber direction and fiber/matrix interface [29]. Solubility for
three sets of face sheets (L-A, L-B, and L-C) were obtained directly from the plateau values
of the moisture uptake curves. The average solubility value was 1.25% with a standard
deviation of 0.12. Small variations in the solubility for composite laminates with different
geometries exposed to the same conditioning were also observed in previous studies [25,
29]. These variations could have occurred because the larger samples were not in the
absolute saturation status yet after equal exposure duration. A representative moisture
uptake curve for face sheet L-A is illustrated in Figure 3.5 with red triangular marker. The
typical Fickian diffusion behavior is presented in this curve, which exhibits an initial linear
moisture uptake with respect to the square root of time, followed by an apparent saturation
plateau.
Figure 3.4. √D vs. (ℎ/𝑙 + ℎ/𝑤) for three sets of face sheets

49
Figure 3.5. Representative moisture uptake curves for neat resin RN and face sheet L-A
Table 3.1. Diffusion parameters for woven E-glass/PU face sheets
Parameters Value
𝑀𝑠𝑎𝑡_𝑓𝑎𝑐𝑖𝑛𝑔 (%)
L-A 1.12
L-B 1.36
L-C 1.28
𝐷𝑥_𝑓𝑎𝑐𝑖𝑛𝑔(𝐷𝑦_𝑓𝑎𝑐𝑖𝑛𝑔) (mm2/s) 7.67 x 10⁻⁶
𝐷𝑧_𝑓𝑎𝑐𝑖𝑛𝑔 (mm2/s) 7.45 x 10⁻⁷
3.2. DETERMINATION OF DIFFUSION PARAMETERS FOR PU NEAT RESIN
The representative moisture uptake curve for PU neat resin in 22°C/distilled water
is presented in Figure 3.5 with black rectangular marker, in which the classical Fickian
diffusion behavior can also be observed. In this study, PU neat resin was modeled as a
homogeneous material. Equation (7) was used to derive the diffusivity from the initial
linear portion of the moisture uptake curve. The equilibrium moisture content for PU neat
resin was 2.54%, which is almost as twice as that of face sheet. The resultant diffusion
parameters for the neat resin are listed in Table 3.2. It can also be observed that neat resin’s
diffusivity is close to the face sheets’ diffusivity along the thickness direction, indicating
face sheets’ diffusion behavior along thickness direction is matrix-dominant.

50
Table 3.2. Diffusion parameters for PU neat resin
Parameters Value
𝑀𝑠𝑎𝑡_𝑟𝑒𝑠𝑖𝑛 (%) 2.54
𝐷𝑟𝑒𝑠𝑖𝑛 (mm2/s) 4.09 x 10⁻⁷
3.3. DETERMINATION OF DIFFUSION PARAMETERS FOR CLOSED-CELL
POLYURETHANE FOAM
A representative moisture uptake curve for closed-cell polyurethane foam is
illustrated in Figure 3.6. An apparent multi-stage diffusion process is evident in this plot,
which exhibited an initial linear moisture uptake up to around 4 hours, followed by weight
increase with a slower rate up to 2791 hours, then followed by an almost linear weight
increase with relatively lower uptake rate compared with that in the first stage.
Figure 3.6. A representative moisture uptake curve for closed-cell polyurethane foam
The complexity of diffusion behavior in polymer foams due to internal stress
relaxation and complex microscopic cellular foam structure has been examined in previous
studies. Several researchers [24, 30, 31] applied a diffusion model to predict the moisture
diffusion behavior in polymeric foams. A multi-stage diffusion model that incorporates a
time-dependent diffusivity scheme was proposed in this study to explain the deviation of
PU foam’s moisture diffusion behavior from classical Fick’s law. The closed-cell PU foam

51
was modeled as a globally homogeneous material for the sake of simplicity. In the time-
dependent diffusivity scheme, for the first stage (0 to 4 hours), a constant diffusivity is
derived from the initial slope of the moisture uptake curve. A trial-and-error method was
used to determine a rational time-dependent diffusivity function during the second stage (4
to 2791 hours). This function was implemented by a user-defined subroutine USDFLD in
the commercial finite element code ABAQUS. Equation (7) was used to determine another
constant diffusivity during the third stage (2791 to 4927 hours). The resultant time-
dependent diffusivity for the foam core was expressed as
𝐷𝑓𝑜𝑎𝑚 =
3.55 ∙ 10−5 𝑚𝑚2/𝑠 ⋯0 ≤ 𝑡 ≤ 4
(−2.34 ∙ √𝑡 + 242.3)
3.6 ∙ 107(√𝑡 + 3.03)𝑚𝑚2/𝑠⋯4 ≤ 𝑡 < 2791
1.82 ∙ 10−7 𝑚𝑚2/𝑠⋯2791 ≤ 𝑡 ≤ 4927
(9)
The high foam diffusivity in the first stage could be attributed to the initial rapid
moisture ingress into the first ‘layer’ open cells on the foam cut surface. For the second
stage, moisture diffusion along the cell walls driven by moisture concentration gradient
dominated this stage, and the gradually decreased moisture uptake rate could be attributed
to the influence of internal material stress (elastic swelling) induced by the sorption of
water. The moisture ingress possibly reached the next ‘layer’ of cellular structure after
2791 hours of exposure. Water aggregation dominated the moisture uptake behavior in this
stage, resulting in the increased effective diffusivity compared with that in the second stage.
The foam core’s solubility was determined by immersing three small foam samples,
with the same dimensions (12.7 mm x 12.7 mm x 51.0 mm), in distilled water at an
accelerated temperature (60 °C) for approximately 16 days. The specimens were then
immersed under room temperature for one month. Each sample was taken out of the

52
immersion condition periodically and measured using the same method mentioned before
until the weights stabilized. The foam core’s resultant solubility was 210.35%, which is
much higher than that of common polymer composites. Previous literature [31] identified
a similar high solubility in polyurethane foam. Micrographs of both dry and moisture
saturated foam samples are presented in Figure 3.7. The color difference between these
samples is clearly visible in these images. Thermographs of the dry, partially saturated, and
fully saturated foam samples are illustrated in Figure 3.8. These samples were subjected to
a 10 seconds heating cycle and the images were captured after 10 seconds post heating.
The dissimilarities of heat transfer behavior among those samples are evident due to the
different moisture distribution in each test coupon.
(a) (b)
Figure 3.7. Micrographs of closed-cell foam core (a) dry sample, (b) fully saturated
sample
Figure 3.8. Thermographs of closed-cell foam core (a) dry sample, (b) partially saturated
sample, (c) fully saturated sample

53
4. RESULTS
A dynamic three-dimensional finite element model was developed to validate the
diffusion parameters for sandwich constituents. Details of the Galerkin finite element
formulation are given as follows. A new term “normalized concentration” [32] was
introduced to remove moisture concentration discontinuity at the interface of two different
materials:
∅ = 𝐶/𝑆 (10)
where 𝐶 is the moisture concentration, and 𝑆 is the solubility. The solubility depends
primarily on the type of material and conditioning approach employed. The necessity of
normalized moisture concentration continuity at the interface nodes can be further proved
by Henry’s law [33]. The three-dimensional Fickian governing equation with normalized
concentration ∅ can be expressed as
𝜕∅
𝜕𝑡=𝜕
𝜕𝑥(𝐷𝑥
𝜕∅
𝜕𝑥) +
𝜕
𝜕𝑦(𝐷𝑦
𝜕∅
𝜕𝑦) +
𝜕
𝜕𝑧(𝐷𝑧
𝜕∅
𝜕𝑧)
(11)
The finite element equations are given as
[𝐾]∅ + [𝑀]∅ = 𝐹 (12)
[𝑀] = ∫[𝑁]𝑇[𝑁] 𝑑Ω (13)
[𝐾] = ∫[𝐵]𝑇[𝐷] [𝐵]𝑑Ω (14)
𝐹 = ∫𝑞 [𝑁]𝑇 𝑑Ω (15)
where [𝐾]is the moisture diffusivity matrix, [𝑀] is the moisture velocity matrix, [𝑁] is the
shape function, 𝐹 is the moisture flow vector, ∅ is the nodal normalized moisture
content, and ∅ is the change rate of the nodal normalized moisture concentration. The
diffusivity matrix [𝐷] is given by

54
[𝐷] = [
𝐷𝑥 0 00 𝐷𝑦 0
0 0 𝐷𝑧
] (16)
The matrix of derivatives of shape functions [𝐵] is given by
[𝐵] =
[ 𝜕[𝑁]
𝜕𝑥𝜕[𝑁]
𝜕𝑦𝜕[𝑁]
𝜕𝑧 ]
(17)
The following four cases were run to validate the finite element models predicting
the moisture diffusion behavior: CaseⅠ: neat resin, Case Ⅱ: face sheet L-A, Case Ⅲ:
foam core FM, Case Ⅳ: sandwich structure S-S. In each case, the specimens were exposed
to 22°C/distilled water for 4927 hours. The normalized moisture concentration was
introduced in Case Ⅳ to remove the discontinuity of moisture concentration at the
face/core interface. To reduce the computational cost, only one-eighth of the geometry was
modeled in all four cases due to the symmetric geometry and boundary conditions.
Saturation moisture boundary conditions were applied on three outer surfaces in the
symmetric models. A linear eight-node hexahedral element type was employed for both
face sheet and foam core. A mesh convergence study was conducted before the cases were
run. Take Case Ⅰ for example, three different mesh sizes, with 16, 53, and 106 elements
on the symmetric line in the length direction, were investigated. Differences were evident
in the case of 16 elements, which had a lower normalized moisture concentration than
either of other two cases (see Figure 4.1). Finite element models with mesh sizes of 53 and
106 elements showed the results overlapping over each other, implying the convergence of
results. The similar convergence study was also conducted in the width and thickness

55
directions in all cases. The backward Euler time integration method was implemented in
ABAQUS for transient moisture diffusion analysis, and this method is unconditionally
stable for linear problems. The initial time increment was 0.01 hour, and the maximum
time increment was 60 hours. The automatic time increment was adaptively controlled by
an iteration algorithm in ABAQUS.
Figure 4.1. Mesh convergence study (Case I)
Contours of the normalized moisture concentration for the neat resin (Case Ⅰ), and
the face sheet L-A (Case Ⅱ) after 1853 hours of immersion are illustrated in Figures 4.2(a)
and 4.2(b), respectively. It can be observed that both neat resin and face sheet nearly
reached full saturation status at this time point. The simulation results showed a good
correlation with experimental findings (Figure 4.3), validating the diffusion parameters for
neat resin and face sheet specimens.
(a) (b)
Figure 4.2. Normalized moisture concentration contour after 1853 hours of immersion for
neat resin (Case Ⅰ), (b) face sheet L-A (Case Ⅱ)

56
Figure 4.3. Comparisons between the simulation results and experimental data for neat
resin (Case I) and face sheet L-A (Case II)
A user-defined subroutine USDFLD was developed in ABAQUS to implement the
rational time-dependent diffusivity scheme in Case Ⅲ. The effective foam diffusivity in
this scheme changed with time due to internal stress and complex microscopic cellular
foam structure. Contour of the normalized moisture concentration after 4927 hours of
immersion is depicted in Figure 4.4. This contour indicates that the central part of foam
core was far from reaching full saturation status. A good correlation exists between the
simulation results and experimental findings, as illustrated in Figure 4.5, thus validating
the multi-stage time-dependent diffusion model proposed in this study.
The diffusion parameters applied in the finite element model for face sheet and
foam core in Case Ⅳ were the same parameters applied in Case Ⅱ and Case Ⅲ. Perfect
bonding was assumed between the face sheets and foam core. Contours of the moisture
concentration and the normalized moisture concentration after 4927 hours of immersion
are depicted in Figures 4.6(a) and 4.6(b), respectively. Both the discontinuity of moisture
concentration and continuity of normalized moisture concentration at the face/core

57
interface are clearly visible in these contours. Comparison between the simulation results
and the experimental findings indicated an overall reasonable match (see Figure 4.7). The
deviation in the initial hours can be attributed to that the foam diffusivity in the thickness
direction may not be the same as the diffusivity in the other two directions, though this
possibility needs further examination. It can be observed that the moisture uptake curves
for both foam core and sandwich structure exhibited very similar multi-stage diffusion
patterns, indicating that the moisture diffusion in foam core dominates the moisture
diffusion behavior in the sandwich structure.
Figure 4.4. Normalized moisture concentration contour for the foam core (Case III) after
4927 hours of immersion
Sandwich S-S samples were sliced into the top, bottom face sheets, and the foam
core after 4927 hours of conditioning in an attempt to further validate the finite element
model in Case Ⅳ. These constituents were completely dried in an oven at 60°C until the
weight stabilized. Equation (1) was used to calculate the moisture weight gain for each
constituent. A reasonable match between the experimental findings and simulation results
(Table 4.1) further validates the finite element model and diffusion parameters of sandwich
constituents.

58
Table 4.1. Weight gain of sliced sandwich constituents
Constituents Weight gain
experiment simulation
Top face sheet 1.22 % 1.01 %
Bottom face sheet 1.32 % 1.01 %
Foam core 44.93 % 48.59 %
Figure 4.5. Comparison between simulation results and experimental data for the foam
core (Case III)
(a) (b)
Figure 4.6. Contours for sandwich S-S (Case IV) after 4927 hours of immersion (a)
moisture concentration, (b) normalized moisture concentration

59
Figure 4.7. Comparison between simulation results and experimental data (Case IV)

60
5. CONCLUSIONS
An open-edge moisture diffusion experiment was conducted on the PU neat resin,
woven E-glass fiber-reinforced polyurethane face sheet, closed-cell polyurethane foam and
their corresponding sandwich specimens. Each type of specimens was immersed in
22°C/distilled water for nearly 7 months. The experimental data collected was used to
characterize the moisture diffusivities and equilibrium moisture contents for neat resin and
sandwich constituents. The moisture diffusion behavior of both neat resin and face sheet
correlated well with the classical Fickian diffusion plots. While for the closed-cell
polyurethane foam core, a multi-stage diffusion model was proposed to explain the
significant deviation from Fick’s law using a time-dependent diffusivity scheme. This
scheme assumes that water diffusion within the cellular structure and any condensation or
water entrapment is regarded as a diffusion process for the sake of simplicity. It also
assumes that the effective foam diffusivity changes with time due to internal stress and
complex microscopic cellular foam structure. One user-defined subroutine USDFLD was
developed to implement this time-dependent diffusivity scheme into a commercial code
ABAQUS. A three-dimensional dynamic finite element model was developed to validate
the diffusion parameters for neat resin and sandwich constituents. The simulation results
showed a good correlation with the experimental findings.

61
REFERENCES
1) Ding, K., Wang, G. and Yin, W., “Application of Composite Sandwich Panels in
Construction Engineering,” Applied Mechanics and Materials, Vol. 291-294, pp. 1172-
1176, 2013.
2) Dawood, M., Ballew, W. and Seiter, J., “Enhancing the Resistance of Composite
Sandwich Panels to Localized Forces for Civil Infrastructure and Transportation
Applications,” Composite Structures, Vol. 93, pp. 2983-2991, 2011.
3) Di Bella, G., Calabrese, L. and Borsellino, C., “Mechanical Characterisation of a
Glass/Polyester Sandwich Structure for Marine Applications,” Materials and Design,
Vol. 42, pp. 486-494, 2012.
4) Allegri, G., Lecci, U., Marchetti, M. and Poscente, F., “FEM Simulation of the
Mechanical Behaviour of Sandwich Materials for Aerospace Structures,” Key
Engineering Materials, Vol. 221-222, pp. 209-220, 2002.
5) Wan, Y.Z., Wang, Y.L., Huang, Y., Zhou, F.G., He, B.M., Chen, G.C. and Han, K.Y.,
“Moisture Sorption and Mechanical Degradation of VARTMed Three-Dimensional
Braided Carbon–Epoxy Composites,” Composites Science and Technology, Vol. 65,
pp. 1237-1243, 2005.
6) Shen, C.H. and Springer, G.S., “Effects of Moisture and Temperature on the Tensile
Strength of Composite Materials,” Journal of Composite Materials, Vol. 11, pp. 2-16,
1977.
7) Selzer, R. and Friedrich, K., “Mechanical Properties and Failure Behaviour of Carbon
Fibre-reinforced Polymer Composites under the Influence of Moisture,” Composites
Part A: Applied Science and Manufacturing, Vol. 28, pp. 595-604, 1997.
8) Chu, W., Wu, L. and Karbhari, V.M., “Durability Evaluation of Moderate Temperature
Cured E-Glass/Vinylester Systems,” Composite Structures, Vol. 66, pp. 367-376, 2004.
9) Ray, B.C., “Temperature Effect During Humid Ageing on Interfaces of Glass and
Carbon Fibers Reinforced Epoxy Composites,” Journal of Colloid and Interface
Science, Vol. 298, pp. 111-117, 2006.
10) Gaur, U., Chou, C.T. and Miller, B., “Effect of Hydrothermal Ageing on Bond
Strength,” Composites, Vol. 25, pp. 609-612, 1994.
11) Tagliavia, G., Porfiri, M. and Gupta, N., “Influence of Moisture Absorption on Flexural
Properties of Syntactic Foams,” Composites Part B: Engineering, Vol. 43, pp. 115-
123, 2012.

62
12) Gupta, N. and Woldesenbet, E., “Hygrothermal Studies on Syntactic Foams and
Compressive Strength Determination,” Composite Structures, Vol. 61, pp. 311–320,
2003.
13) Sadler, R.L., Sharpe, M., Panduranga, R. and Shivakumar, K., “Water Immersion
Effect on Swelling and Compression Properties of Eco-Core, PVC Foam and Balsa
Wood,” Composite Structures, Vol. 90, pp. 330–336, 2009.
14) Siriruk, A., Penumadu, D. and Sharma, A., “Effects of Seawater and Low Temperatures
on Polymeric Foam Core Material,” Experimental Mechanics, Vol. 52, pp. 25-36,
2012.
15) Manujesh, B.J., Rao, V. and Aan, M.P.S., “Moisture Absorption and Mechanical
Degradation Studies of Polyurethane Foam Cored E-Glass-Reinforced Vinyl-Ester
Sandwich Composites,” Journal of Reinforced Plastics and Composites, Vol. 33, pp.
479-492, 2014.
16) Avilés, F. and Aguilar-Montero, M., “Mechanical Degradation of Foam-Cored
Sandwich Materials Exposed to High Moisture,” Composite Structures, Vol. 92, pp.
122-129, 2010.
17) Loos, A.C. and Springer, G.S. “Moisture Absorption of Graphite-Epoxy Composites
Immersed in Liquids and in Humid Air,” Journal of Composite Materials, Vol. 13, pp.
131-147, 1979.
18) Shen, C.H. and Springer, G.S., “Moisture Absorption and Desorption of Composite
Materials,” Journal of Composite Materials, Vol. 10, pp. 2-20, 1976.
19) Roe, N., Huo, Z., Chandrashekhara, K., Buchok, A. and Brack, R.A., “Advanced
Moisture Modeling of Polymer Composites,” Journal of Reinforced Plastics and
Composites, Vol. 32, pp. 437-449, 2013.
20) Gopalan, R., Rao, R.M.V.G.K., Murthy, M.V.V. and Dattaguru, B. “Diffusion Studies
on Advanced Fibre Hybrid Composites,” Journal of Reinforced Plastics and
Composites, Vol. 5, pp. 51-61, 1986.
21) Bao, L.R. and Yee, A.F., “Moisture Diffusion and Hygrothermal Aging in
Bismaleimide Matrix Carbon Fiber Composites: Part II-Woven and Hybrid
Composites,” Composites Science and Technology, Vol. 62, pp. 2111- 2119, 2002.
22) Whitney, J.M. and Browning, C.E., “Some Anomalies Associated with Moisture
Diffusion in Epoxy Matrix Composite Materials,” Advanced Composite Materials—
Environmental Effects, ASTM STP 658, American Society for Testing and Materials,
pp. 43–60, 1978.
23) Weitsman, Y., “Coupled Damage and Moisture-transport in Fiber-reinforced,
Polymeric Composites,” International Journal of Solids and Structures, Vol. 23, pp.
1003-1025, 1987.
63
24) Earl, J.S. and Shenoi, R.A., “Determination of the Moisture Uptake Mechanism in
Closed Cell Polymeric Structural Foam during Hygrothermal Exposure,” Journal of
Composite Materials, Vol. 38, pp. 1345-1365, 2004.
25) Avilés, F. and Aguilar-Montero, M., “Moisture Absorption in Foam-Cored Composite
Sandwich Structures,” Polymer Composites, Vol. 31, pp. 714-722, 2010.
26) ASTM D3171-11, 2011, “Standard Test Method for Constituent Content of Composite
Materials,” ASTM International, West Conshohocken, PA, 2011, DOI:
10.1520/D3171-11, www.astm.org.
27) ASTM C272/C272M-12, 2012, “Standard Test Method for Water Absorption of Core
Materials for Structural Sandwich Construction”, ASTM International, West
Conshohocken, PA, 2012, DOI: 10.1520/C0272_C0272M-12, www.astm.org.
28) ASTM D5229/D5229M-12, 2012, “Standard Test Method for Moisture Absorption
Properties and Equilibrium Conditioning of Polymer Matrix Composite Materials”,
ASTM International, West Conshohocken, PA, 2012, DOI: 10.1520/D5229_D5229M-
12, www.astm.org.
29) Chateauminois, A., Vincent, L., Chabert, B. and Soulier, J.P., “Study of the Interfacial
Degradation of a Glass-Epoxy Composite During Hygrothermal Ageing Using Water
Diffusion Measurements and Dynamic Mechanical Thermal Analysis,” Polymer, Vol.
35, pp. 4766-4774, 1994.
30) Lee, W.M., “Water Vapor Permeation in Closed Cell Foams,” Journal of Cellular
Plastics, Vol. 9, pp. 125-129, 1973.
31) Sabbahi, A. and Vergnaud, J.M., “Absorption of Water at 100 ˚C by Polyurethane
Foam,” European Polymer Journal, Vol. 27, pp. 845-850, 1991.
32) Galloway, J.E. and Miles, B.M. “Moisture Absorption and Desorption Predictions for
Plastic Ball Grid Array Packages,” IEEE Transactions on Components, Packaging, and
Manufacturing Technology. Part A, Vol. 20, pp. 274-279, 1997.
33) Wong, E.H., Teo, Y.C. and Lim, T.B. “Moisture Diffusion and Vapour Pressure
Modeling of IC Packaging.” Proceedings of the 48th Electronic Components and
Technology Conference, pp. 1372-1378, 1998.

64
III. INVESTIGATION OF THREE-DIMENSIONAL MOISTURE DIFFUSION
MODELING AND MECHANICAL DEGRADATION OF CARBON/BMI
COMPOSITES UNDER SEAWATER CONDITIONING
Z. Huo and K. Chandrashekhara
Department of Mechanical and Aerospace Engineering
Missouri University of Science and Technology, Rolla, MO 65409
ABSTRACT
In this work, the behavior of moisture diffusion and its effects on the mechanical
properties of carbon/bismaleimide (BMI) composites exposed to seawater conditioning at
elevated temperatures were investigated. Carbon/BMI composites of two stacking
sequences (unidirectional and cross-ply) were fabricated using out-of-autoclave process.
Testing coupons were immersed in the seawater at two elevated temperatures (50 °C and
90 °C) for approximately three months. Moisture diffusivities and solubility for each type
of carbon/BMI specimen were characterized according to the experimental data. A three-
dimensional dynamic finite element model was developed using these parameters to predict
the moisture diffusion behavior for two types of carbon/BMI laminates. It was found that
the moisture diffusion characteristics of both types of carbon/BMI laminates followed
classical Fick’s law. The degradation of mechanical properties due to hygrothermal aging
was assessed by conducting short beam shear test and three-point bending test at three
immersion time points (2 weeks, 7 weeks and 12 weeks). It was found that the deterioration
effects of hygrothermal aging on the flexural strength and interlaminar shear strength are
more evident at 90 °C than that at 50 °C. The reduction of mechanical properties for both
types of BMI laminates could be attributed to the fiber/matrix interfacial cracks observed
by scanning electron microscopy.

65
1. INTRODUCTION
Fiber-reinforced polymer composites have been utilized broadly in the aerospace,
marine, energy, automotive and civil industries due to their superior properties such as high
strength-to-weight ratio, excellent corrosion resistance and design flexibility. In many
cases these materials are frequently subjected to environments involving temperature and
humidity during the expected life of service. It is widely known that fiber-reinforced
polymer composites are susceptible to humid conditions, especially at elevated
temperatures. Complex phenomena including matrix plasticization, swelling, relaxation,
fiber/matrix interfacial debonding and chemical structure rearrangement can occur under
exposure to hygrothermal environments. Absorbed moisture plays a detrimental role in
both the integrity and durability of composite structures since it can degrade the mechanical
properties and induce interfacial failures. As a result, it is essential to understand the
moisture diffusion behavior and moisture-induced damage in polymer matrix composites
under varying hygrothermal conditions to predict the long-term material performance and
optimize structural design.
Previous studies [1-4] have indicated that absorption of water molecules degrades
the mechanical properties of polymer composites due to plasticizing effects and matrix
chemical deterioration. In addition, the change of stress state due to hygrothermal swelling
can cause damage initiation/development and delamination in composites [5]. The
fiber/matrix interfacial strength has been shown to degrade as the water preferentially
diffused along the fiber/matrix interface under hygrothermal conditioning [6-8]. From the
aspect of numerical modeling investigation, one-dimensional Fick’s second law is most
frequently used by researchers [9-11] to investigate the moisture diffusion behavior in

66
fiber-reinforced composites. However, classical Fickian diffusion model is not always
adequate in predicting the moisture diffusion behavior in polymer composites in many
circumstances. As a result, several numerical models were proposed to explain these
deviations. Whitney and Browning [12] observed that moisture diffusion in graphite/epoxy
composites deviates from classical Fickian behavior, and they proposed a time-dependent
diffusivity method associated with matrix cracking during diffusion to explain this
deviation. Weitsman [13] developed a coupled damage and moisture-transport non-Fickian
model to explain the moisture diffusion anomaly in transversely isotropic fiber-reinforced
polymer composites. In the authors’ previous study [14], a moisture concentration-
dependent diffusion model was proposed to explain the deviation from classical Fickian
diffusion in two-phase (unidirectional S-glass fiber-reinforced epoxy matrix and
unidirectional graphite fiber-reinforced epoxy matrix) hybrid composites.
Carbon fiber-reinforced bismaleimide matrix composites are mainly used in the
high temperature aerospace structural applications due to their excellent thermal
performance and ease of processing. The primary advantage of BMI-based systems is the
increase in service temperature range over conventional epoxies system from
approximately 300 °F-350 °F to 400 °F-450 °F [15]. However, these composites could
experience extremely severe environments involving high temperature, high humidity,
even sea fog exposure [16] during the service lifetime. The effects of hygrothermal aging
on BMI resin systems and fiber-reinforced BMI composites have been widely studied by
researchers. Several studies [17, 18] reported the glass transition temperature (Tg) of BMI
matrix dropped significantly due to the plasticization effects of absorbed water. The
hygrothermal-induced fiber–matrix interface failure in carbon/BMI composites was also

67
observed by other researchers [18-22]. From the aspect of numerical investigation, both
Fikican [23, 24] and non-Fickian [19, 20, 25, 26] diffusion behaviors have been reported
for BMI resins and their composites. However, few researchers have investigated three-
dimensional moisture diffusion behavior in carbon fiber-reinforced BMI composites under
seawater conditioning. In this study, an out-of-autoclave (OOA) process was used to
fabricate carbon/BMI composites with two different stacking sequences ([0]16 and
[0/90/0/90/0/90]s). In order to simulate the worst possible scenario of water damage, two
types of carbon/BMI specimens were submerged in the seawater at two elevated
temperatures to investigate the effects of absorbed moisture on the degradation of
mechanical properties. Moisture diffusion parameters including three-dimensional
moisture diffusivities and equilibrium moisture contents were extracted from the
experimental data. A three-dimensional dynamic finite element model was developed to
predict the moisture diffusion characteristics for two types of carbon/BMI laminates. A
user-defined subroutine USDFLD was also incorporated in the finite element model to
calculate the overall moisture content during every time increment. The influence of water
absorption on the mechanical properties of carbon/BMI composites was investigated. Short
beam shear test and three-point bending test were performed at three immersion time points
(2 weeks, 7 weeks and 12 weeks) to investigate the effects of moisture absorption on the
interlaminar shear strength (ILSS) and flexural strength of two types of carbon/BMI
composites.

68
2. EXPERIMENTAL
2.1. MATERIALS AND MANUFACTURING
The composite laminates for experimental testing were fabricated using a carbon
fiber/bismaleimide unidirectional prepreg system provided by Aldila (Aldila Composite
Materials, Poway, CA). The unidirectional prepreg tapes are made of continuous high
strength carbon fibers pre-impregnated with a toughened bismaleimide system AR4550,
and prepreg tapes contain 35% resin by weight with a prepreg areal weight of 304.8 g/m2.
The OOA process was employed to manufacture carbon/BMI composites with two
stacking sequences ([0º]16 and [0º/90º/0º/90º/0º/90º]s). The schematic of the OOA bagging
assembly is shown in Figure 2.1. The manufacturing process included laying up the prepreg
tapes which were cut into required dimensions to an aluminum mold. Rollers were used to
remove entrapped air bubbles as well as wrinkles. Every four layers of prepregs were
debulked under 28 in. Hg vacuum pressure during the laying up process to remove the
residual air trapped between layers. Release film, caul plate, edge breather and vacuum
outlets were placed in sequence and sealed with a vacuum bag. The prepregs were cured
in accordance with a manufacturer recommended cure cycle, as shown in Figure 2.2. The
parts were then cooled down to room temperature and post-cured at 232 °C for two hours.
A ramp rate of 3 °C/min was applied for the whole cure cycle. Composite panel with
dimensions of 304.8 mm × 304.8 mm was manufactured for each type of carbon/BMI
composite. The average thicknesses were 2.23 mm and 1.62 mm for the unidirectional and
cross-ply BMI panels, respectively.

69
Figure 2.1. Schematic of out-of-autoclave process bagging assembly
Figure 2.2. Manufacturer recommended cure cycle
2.2. CONDITIONING AND MOISTURE UPTAKE MEASUREMENTS
A low-speed diamond saw was used to cut carbon/BMI panels into small parts with
required test dimensions. ASTM standard D5229 [27] was adopted as guidelines to conduct
the open-edge moisture absorption experiment. For each type of carbon/BMI specimens,
three sets of coupons with different length/width ratios were designed to characterize three-
dimensional diffusivities along three principal axes. The test coupons’ nominal dimensions
are listed in Table 2.1.
Release film Resin dam Vacuum port Sealant tape Mold Prepregs
Vacuum bag
Breather Resin inlet Edge bleeder
Sealant tape
Caul plate

70
The artificial seawater with 3.5% salinity was prepared by dissolving sea salt into
distilled water. Prior to immersion, all of the testing coupons were dried in an oven at 60 °C
for 72 hours until the weights stabilized. Coupons were then submerged in the seawater at
two elevated temperatures (50 °C and 90 °C). To monitor the moisture uptake, the
specimens were periodically taken out of seawater, wiped off the surface water using an
absorbent paper and then immediately weighed using a Mettler Toledo XP204S model
analytical balance with a precision of 0.1 mg. The moisture uptake of test coupons at a
specific time point was calculated as
𝑀(𝑡) =𝑊(𝑡) −𝑊𝑑
𝑊𝑑 (1)
where 𝑊(𝑡) is the wet sample’s weight at time 𝑡, and 𝑊𝑑 is the dry sample’s initial weight.
The measurement time interval during which any coupon was out of immersion
conditioning was approximately six minutes and thus this interval was considered to be
negligible for the entire immersion time. Three replicates were measured each time to
report the average moisture uptake.
Table 2.1. Nominal dimensions of coupons for moisture diffusion test
Sample type Label Dimensions (mm)
Length (𝑙) Width (𝑤) Thickness (ℎ)
Unidirectional
U-A 51.9 51.5 2.2
U-B 30.7 51.4 2.2
U-C 15.4 50.6 2.3
Cross-ply
C-A 51.3 51.6 1.6
C-B 30.7 51.1 1.6
C-C 15.7 51.4 1.6
2.3. THREE-POINT BENDING AND SHORT BEAM SHEAR TESTS
Three-point bending and short beam shear tests were conducted according to
ASTM D790-15 [28] and ASTM D2344/D2344M-13 [29] respectively on an INSTRON

71
universal testing machine. Specimens were tested at three immersion time points (2 weeks,
7 weeks and 12 weeks) to evaluate the effects of hygrothermal aging on the flexural
strength and interlaminar shear strength of two types of carbon/BMI specimens. The testing
parameters are listed in Table 2.2. The experimental setups for both tests are shown in
Figure 2.3. Three replicates were tested at each immersion time to report the average value
and the standard deviation.
(a) (b)
Figure 2.3. Experimental setup for (a) three-point bending test, (b) short beam shear test
Table 2.2. Parameters of three-point bending and short beam shear tests
Test Parameters Unidirectional Cross-ply
Three-point
bending test
Nominal dimensions (mm)
(length × width) 127.0 × 13.5 127.0 × 13.5
Support length (mm) 74 48
Loading rate (mm/min) 3.96 2.56
Short beam
shear test
Nominal dimensions (mm)
(length × width) 16.0 × 4.4 12 × 3.2
Support length (mm) 8 6
Loading rate (mm/min) 1 1

72
2.4. MICROSTRUCTURAL ANALYSIS
Since prolonged environmental exposure may cause interfacial debonding and
cracking in a composite material, scanning electron microscopy (SEM) was employed to
demonstrate the integrity of the fiber/matrix interface after hygrothermal aging. After
seawater absorption, the specimens were cut to reveal a clear cross section area using
ALLIED® TECHCUT 5 slow speed saw with a resin bonded SiC blade. SEM samples were
mounted using LECO® QC Epoxy kits and then polished using progressively fine sand
paper and 3 micron diamond paste. Before SEM observation, a thin layer of gold particles
was sputtered onto the surface of the sample. An ASPEX® 1020 SEM machine operating
at 5 kV accelerating voltage was used for the observation.

73
3. RESULTS AND DISCUSSION
3.1. DETERMINATION OF DIFFUSION PARAMETERS AND FEA
The method used to determine the three-dimensional diffusion parameters from
experimental data for unidirectional and cross-ply carbon/BMI laminate has been reported
previously [30]. For unidirectional carbon/BMI laminates investigated in this study, it can
be assumed that the diffusivity along y-axis is the same as the diffusivity along z-axis (x-
axis is the fiber direction), as shown in Figure 3.1(a). For cross-ply carbon/BMI laminates,
it can be assumed that the diffusivity along x-axis is the same as the diffusivity along y-
axis (z-axis is the thickness direction), as shown in Figure 3.1(b). Based on these
assumptions, the effective diffusivities for two types of carbon/BMI laminates can be
expressed as
√ = (1 + ℎ/𝑤)√𝐷𝑧 + (ℎ/𝑙)√𝐷𝑥 for unidirectional
√D = √Dz +√Dx(h/l + h/w) for cross-ply (2)
Equation (2) yields two linear lines as shown in Figures 3.1(a) and 3.1(b). For
unidirectional BMI laminates, (1 + ℎ/𝑤)√𝐷𝑧 is the intercept along the vertical axis and
√𝐷𝑥 is the slope. Similarly, √𝐷𝑧 is the intercept along the vertical axis and √𝐷𝑥 is the
slope for cross-ply BMI laminates.
Figure 3.2 illustrates the fitting curve of square root of the effective diffusivities
versus (ℎ/𝑙) for three sets of unidirectional laminates at two elevated temperatures. Figure
3.3 presents the fitting curve of square root of the effective diffusivities versus
(ℎ/𝑙 + ℎ/𝑤) for three sets of cross-ply laminates at two elevated temperatures. Equation
(3) is used to calculate the effective diffusivity for each type of laminates from the initial
linear portion of corresponding moisture absorption curves.

74
(a) (b)
Figure 3.1. (a) √ vs. (ℎ/𝑙)for unidirectional sample, (b) √ vs. (ℎ/𝑙 + ℎ/𝑤) for cross-
ply sample
√ = (𝑀2 −𝑀1
√𝑡2 − √𝑡1)ℎ√𝜋
4𝑀𝑠𝑎𝑡 (3)
where 𝑡1 and 𝑡2 are two specific time points on the linear portion of the moisture uptake
curve, 𝑀1 and 𝑀2 are corresponding moisture uptakes, ℎ is the laminate’s thickness, and
𝑀𝑠𝑎𝑡is the equilibrium moisture content (solubility).
(a) (b)
Figure 3.2. √ vs. (ℎ/𝑙) for three sets of unidirectional laminates at (a) 50 °C, (b) 90 °C
xD
x
y z
l
w
h
D
w
h
l
h
zD

75
(a) (b)
Figure 3.3. √ vs. (ℎ/𝑙 + ℎ/𝑤) for cross-ply laminates at (a) 50 °C, (b) 90 °C
As illustrated in Figure 3.2 and Figure 3.3, the square root of diffusivity along the
thickness direction –√𝐷𝑧, was obtained from the intercept value. At least two different sets
of (ℎ/𝑙) or (ℎ/𝑙 + ℎ/𝑤) were needed to obtain √𝐷𝑧 , that is the reason three sets of
laminates with different length/width ratio values for both unidirectional and cross-ply
laminates were designed in the experiments. The resultant diffusivities are listed in Table
3.1 and Table 3.2 for unidirectional and cross-ply laminates, respectively. As expected, the
diffusivities along the fiber directions are much higher than that along the stacking
thickness direction for both laminates, which indicates that moisture diffusion
preferentially occurs along fiber direction and fiber/matrix interface [31]. Also, the
diffusion rate along each axis is higher at 90 °C than that at 50 °C for each type of laminates,
agreeing with the general fact that the diffusion rate increases with elevated temperature.
For the unidirectional laminates, the ratio of longitudinal diffusivity to transverse
diffusivity (𝐷𝑥/𝐷𝑧) is 16.0 at 50 °C and 6.6 at 90 °C. Comparable ratios were also reported
in the study by Bao and Yee [20]. And for the cross-ply laminates, the ratio of longitudinal

76
diffusivity to transverse diffusivity (𝐷𝑥/𝐷𝑧) is 3.9 at 50 °C and 4.6 at 90 °C. These ratio
values are also comparable with the most widely applied theory of moisture diffusion in
unidirectional composites by Shen and Springer [9]. Also it should be noted that, for both
unidirectional and cross-ply laminates, the diffusivity along thickness direction (𝐷𝑧) is
almost the same at 90 °C, however, the difference of 𝐷𝑧 is apparent at 50 °C for two types
of laminates.
Table 3.1. Diffusion parameters for unidirectional BMI laminates
Parameters 50 °C 90 °C
𝑀𝑠𝑎𝑡 (%)
U-A 1.13 1.13
U-B 1.24 1.24
U-C 1.28 1.28
𝐷𝑥 (mm2/s) 4.70×10⁻⁶ 1.33×10⁻⁵
𝐷𝑧(𝐷𝑦) (mm2/s) 2.94×10⁻⁷ 2.01×10⁻⁶
Table 3.2. Diffusion parameters for cross-ply BMI laminates
Parameters 50 °C 90 °C
𝑀𝑠𝑎𝑡 (%)
C-A 1.19 1.19
C-B 1.22 1.22
C-C 1.28 1.28
𝐷𝑥(𝐷𝑦) (mm2/s) 1.45×10⁻⁶ 9.36×10⁻⁶
𝐷𝑧 (mm2/s) 3.73×10⁻⁷ 2.02×10⁻⁶
Solubility for two types of carbon/BMI laminates were obtained directly from the
plateau values of the moisture uptake curves. The average solubility value is 1.22% with a
standard deviation of 0.08 for the unidirectional laminates, and 1.23% with a standard
deviation of 0.05 for the cross-ply laminates. Small variations in the solubility of the
composite laminates with different geometries exposed to the same conditioning were also
observed in other studies [31, 32]. These variations could have occurred since the larger
samples were not in the absolute saturation status yet after equal exposure duration.

77
A dynamic three-dimensional finite element model was developed to validate the
diffusion parameters for two types of carbon/BMI laminates. Details of the Galerkin finite
element formulation are given in our previous study [30]. A user-defined subroutine
USDFLD was also incorporated in the finite element model to calculate the overall
moisture content at every time increment. The following four cases were run to validate
the finite element models predicting the moisture diffusion characteristics for two types of
laminates: CaseⅠ:unidirectional laminates at 50 °C, Case Ⅱ:unidirectional laminates at
90 °C, Case Ⅲ:cross-ply laminates at 50 °C, Case Ⅳ:cross-ply laminates at 90 °C. In each
case, the specimens were submerged into seawater under two elevated temperatures for
around 3 months. To reduce the computational cost, only one-eighth of the geometry was
modeled in all four cases due to the symmetric geometry and boundary conditions.
Saturation moisture boundary conditions were applied on three outer surfaces in the
symmetric models. A linear eight-node hexahedral element type was employed. A mesh
convergence study was conducted before the cases were run. The initial time increment
was 0.01 hour, and the maximum time increment was 60 hours. The solution convergence
with time was adaptively controlled by an iteration algorithm in ABAQUS.
Contour of the normalized moisture concentration for unidirectional laminates (U-
C) after 1977 hours’ immersion at 50 °C is illustrated in Figure 3.4(a), and Figure 3.4(b)
illustrates the contour after 300 hours’ immersion at 90 °C for the same laminate. Contour
of the normalized moisture concentration for cross-ply laminates (C-C) after 893 hours’
immersion at 50 °C is illustrated in Figure 3.5(a), and Figure 3.5(b) illustrates the contour
after 186 hours’ immersion at 90 °C for the same laminate. The contours for other laminates
(U-A, U-B, C-A, C-B) are not presented here due to similar patterns. In the four contours

78
shown, all the plates almost reached full saturation status. However, for each type of
laminate, less time is required to reach full saturation status at 90 °C than that at 50 °C due
to higher diffusivities along three axes at higher temperature. Also it can be observed that
the moisture diffuses faster in the fiber direction (x-axis) in unidirectional laminates due to
higher diffusivity in the fiber direction than that in the transverse direction.
(a) (b)
Figure 3.4. Normalized moisture concentration contour of unidirectional laminate U-C (a)
after 1977 hours’ immersion at 50 °C, (b) after 300 hours’ immersion at 90 °C
(a) (b)
Figure 3.5. Normalized moisture concentration contour of cross-ply laminate C-C (a)
after 893 hours’ immersion at 50 °C, (b) after 186 hours’ immersion at 90 °C
The simulation results showed a good correlation with experimental findings
(Figures 3.6-3.9) in four cases, validating the diffusion parameters for both types of
carbon/BMI laminates. The moisture uptake curves in all four cases show the typical

79
Fickian diffusion behavior, which exhibits an initial linear moisture uptake with respect to
the square root of time, followed by an apparent saturation plateau.
Figure 3.6. Comparison between the simulation results and experimental data for
unidirectional laminates at 50 °C (Case Ⅰ)
Figure 3.7. Comparison between the simulation results and experimental data for
unidirectional laminates at 90 °C (Case Ⅱ)

80
Figure 3.8. Comparison between the simulation results and experimental data for cross-
ply laminates at 50 °C (Case Ⅲ)
Figure 3.9. Comparison between the simulation results and experimental data for cross-
ply laminates at 90 °C (Case Ⅳ)
3.2. EFFECTS OF SEAWATER AGING ON FLEXURAL STRENGTH AND ILSS
In the three-point bending test, since the ratio of support span-to-depth is greater
than 16 to 1, the flexural strength 𝜎𝑓 is calculated using the following equation:

81
𝜎𝑓 = (3𝑃𝑓𝐿/2𝑏ℎ2)[1 + 6(𝐷/𝐿)2 − 4(ℎ/𝐿)(𝐷/𝐿)] (4)
where 𝑃𝑓 is the maximum load, 𝐿 is the support span length, 𝐷 is deflection of the
centerline of the specimen at the middle of the support span, and 𝑏, ℎ are the width and
thickness of the specimen respectively. In the short beam shear test, the interlaminar shear
strength is calculated using the following equation:
𝐹𝑆𝐵𝑆 = 0.75 ×𝑃𝑓
𝑏 × ℎ (5)
where 𝑃𝑓 is the maximum load, and 𝑏, ℎ are the width and thickness of the specimen tested
respectively. Table 3.3 lists the test results of flexural strength and interlaminar shear
strength for both types of laminates. To better illustrate the effects of hygrothermal aging
on the mechanical degradation, the results in Table 3.3 are illustrated in Figure 3.10 and
Figure 3.11.
Table 3.3. Results of three-point bending and short beam shear tests
Laminate Test Immersion
condition
50 °C 90 °C
Value (S.D.)
Unidirectional
Flexural
strength
(MPa)
Dry 2476.73 (32.18)
2 weeks 1966.62 (38.48) 1823.89 (98.08)
7 weeks 1887.79 (102.14) 1761.98 (85.95)
12 weeks 1800.94 (100.53) 1723.63 (23.03)
ILSS (MPa)
Dry 148.39 (5.47)
2 weeks 127.25 (4.22) 117.48 (1.78)
7 weeks 121.36 (1.90) 116.42 (3.01)
12 weeks 118.85 (1.51) 116.32 (4.16)
Cross-ply
Flexural
strength
(MPa)
Dry 1704.91 (48.31)
2 weeks 1524.74 (38.55) 1491.74 (52.76)
7 weeks 1369.27 (40.63) 1368.98 (72.73)
12 weeks 1365.54 (22.35) 1374.45 (24.28)
ILSS (MPa)
Dry 82.01 (3.91)
2 weeks 80.0 (1.43) 68.65 (1.64)
7 weeks 73.96 (3.71) 66.25 (1.53)
12 weeks 75.53 (2.25) 63.78 (1.84)

82
It can be observed that both flexural strength and interlaminar shear strength for
unidirectional carbon/BMI laminates degraded sharply in the first two weeks, but the
reduction rate slowed down afterwards. However, the reduction of flexural strength and
interlaminar shear strength for cross-ply BMI laminates is less noticeable compared with
unidirectional laminates. For unidirectional laminates, the flexural strength decreased 20.6%
and 27.3%, and the ILSS decreased 14.3% and 19.9% corresponding to 2 weeks’ and 12
weeks’ immersion at 50 °C. For cross-ply carbon/BMI laminates, the flexural strength
decreased 10.6% and 19.9%, and the ILSS decreased 2.5% and 7.9% corresponding to 2
weeks’ and 12 weeks’ immersion at 50 °C. It should be noted that both flexural strength
and interlaminar shear strength for unidirectional BMI laminates are higher than that of
cross-ply BMI laminates. It can also be observed that the deterioration of flexural strength
and interlaminar shear strength was more evident at 90 °C than that at 50 °C for both types
of BMI laminates. For unidirectional laminates, the flexural strength decreased 20.6% after
two weeks’ immersion at 50 °C comparing with 26.4% decrease at 90 °C after the same
immersion duration, and the ILSS decreased 14.3% after two weeks’ immersion at 50 °C,
comparing with 20.8% reduction after two weeks’ immersion at 90 °C. For cross-ply
laminates, the flexural strength decreased 10.6% after two weeks’ immersion at 50 °C
comparing with 12.5% decrease at 90 °C after the same immersion duration, and the ILSS
decreased 2.5% after two weeks’ immersion at 50 °C, comparing with 16.3% reduction
after the same immersion duration at 90 °C.

83
Figure 3.10. Effects of hygrothermal aging on flexural strength
Figure 3.11. Effects of hygrothermal aging on ILSS
Fiber/matrix interfacial cracks were observed by SEM on the cross section of
hygrothermally aged laminates as shown in Figure 3.12. For dry cross-ply samples (Figure
3.13), similar cracks are not observed, which indicates that these cracks are the result of
moisture induced damage. The hygrothermal swelling stresses induced by moisture and
temperature are probably responsible for these interfacial debonding cracks. These
interfacial cracks will reduce the structural capability of transmitting the load from the

84
matrix to the fibers. The degradation of flexural strength and ILSS for both types of
laminates can be attributed to this interfacial damage.
Figure 3.12. SEM micrograph of cross section area of cross-ply BMI samples after 3
months’ immersion at 90 °C
Figure 3.13. SEM micrograph of cross section area of dry cross-ply BMI samples

85
4. CONCLUSIONS
Three-dimensional moisture diffusion behavior of carbon/BMI composites with
two stacking sequences (unidirectional and cross-ply) under seawater conditioning at two
elevated temperatures (50 °C and 90 °C) was investigated in this study. Moisture
diffusivities and solubility for each type of laminates at two temperatures were
characterized according to the experimental data, and these parameters were implemented
in a three-dimensional dynamic finite element model to predict the moisture diffusion
behavior. It was found that the moisture diffusion characteristics of both types of laminates
followed classical Fick’s law. For unidirectional carbon/BMI laminates, the flexural
strength decreased 27.3% and the ILSS decreased 19.9% after 3 months’ immersion at
50 °C. For cross-ply carbon/BMI laminates, the flexural strength decreased 19.9% and the
ILSS decreased 7.9% after 3 months’ immersion at 50 °C. The deterioration effects of
hygrothermal aging on the flexural strength and ILSS is more severe at 90 °C than that at
50 °C. Fiber/matrix interfacial cracks were observed by SEM on the cross section of
hygrothermally aged BMI laminates. These interfacial cracks can reduce the structural
capability of transmitting the load from the matrix to the fibers, resulting in the reduction
of both flexural strength and interlaminar shear strength for both types of laminates.

86
REFERENCES
1) Selzer, R. and Friedrich, K., “Mechanical Properties and Failure Behaviour of Carbon
Fibre-reinforced Polymer Composites under the Influence of Moisture,” Composites
Part A: Applied Science and Manufacturing, Vol. 28, pp. 595-604, 1997.
2) Boll, D.J., Bascom, W.D. and Motiee, B., “Moisture Absorption by Structural Epoxy-
Matrix Carbon-Fiber Composites,” Composites Science and Technology, Vol. 24, pp.
253-273, 1985.
3) Kootsookos, A. and Mouritz, A.P., “Seawater Durability of Glass- and Carbon-
Polymer Composites,” Composites Science and Technology, Vol. 64, pp. 1503-1511,
2004.
4) Ellyin, F. and Maser, R., “Environmental Effects on the Mechanical Properties of
Glass-Fiber Epoxy Composite Tubular Specimens,” Composites Science and
Technology, Vol. 64, pp. 1863-1874, 2004.
5) Ogi, K., Kim, H. S., Maruyama, T. and Takao, Y., “The Influence of Hygrothermal
Conditions on the Damage Processes in Quasi-Isotropic Carbon/Epoxy Laminates.”
Composites Science and Technology, Vol. 59, pp. 2375-2382, 1999.
6) Chu, W., Wu, L. and Karbhari, V.M., “Durability Evaluation of Moderate Temperature
Cured E-Glass/Vinylester Systems,” Composite Structures, Vol. 66, pp. 367-376, 2004.
7) Ray, B.C., “Temperature Effect during Humid Ageing on Interfaces of Glass and
Carbon Fibers Reinforced Epoxy Composites,” Journal of Colloid and Interface
Science, Vol. 298, pp.111-117, 2006.
8) Gaur, U., Chou, C.T. and Miller, B., “Effect of Hydrothermal Ageing on Bond
Strength,” Composites, Vol. 25, pp. 609-612, 1994.
9) Shen, C.H. and Springer, G.S., “Moisture Absorption and Desorption of Composite
Materials,” Journal of Composite Materials, Vol. 10, pp. 2-20, 1976.
10) Loos, A.C. and Springer, G.S. “Moisture Absorption of Graphite-Epoxy Composites
Immersed in Liquids and in Humid Air,” Journal of Composite Materials, Vol. 13, pp.
131-147, 1979.
11) Akbar, S. and Zhang, T., “Moisture Diffusion in Carbon/Epoxy Composite and the
Effect of Cyclic Hygrothermal Fluctuations: Characterization by Dynamic Mechanical
Analysis (DMA) and Interlaminar Shear Strength (ILSS),” The Journal of Adhesion,
Vol. 84, pp. 585-600, 2008.

87
12) Whitney, J.M. and Browning, C.E., “Some Anomalies Associated with Moisture
Diffusion in Epoxy Matrix Composite Materials,” Advanced Composite Materials—
Environmental Effects, ASTM STP 658, American Society for Testing and Materials,
pp. 43–60, 1978.
13) Weitsman, Y., “Coupled Damage and Moisture-transport in Fiber-reinforced,
Polymeric Composites,” International Journal of Solids and Structures, Vol. 23, pp.
1003-1025, 1987.
14) Huo, Z., Bheemreddy, V., Brack, R.A. and Chandrashekhara, K., “Modelling of
Concentration-dependent Moisture Diffusion in Hybrid Fibre-reinforced Polymer
Composites,” Journal of Composite Materials, Vol. 49, pp. 321-333, 2015.
15) Rivera, R.O. and Mehta, N.K., “Electrochemical Impedance Spectroscopy Evaluation
of Primed BMI-Graphite/Aluminum Galvanic System,” International SAMPE
Technical Conference, Seattle, WA, Vol. 33, pp. 924-937, 2001.
16) Cochran, R.C., Donnellan, T.M. and Trabocco, R.E., “Environmental Degradation of
High Temperature Composites,” Naval Air Development Center, Warminster, PA,
1992.
17) Yian, Z., Keey, S.L. and Boay, C.G., “Effects of Seawater Exposure on Mode II Fatigue
Delamination Growth of a Woven E-Glass/Bismaleimide Composite,” Journal of
Reinforced Plastics and Composites, Vol. 35, pp. 138-150, 2016.
18) Costa, M.L., Almeida, S.F.M.D. and Rezende, M.C., “Hygrothermal Effects on
Dynamic Mechanical Analysis and Fracture Behavior of Polymeric Composites,”
Materials Research, Vol. 8, pp. 335-340, 2005.
19) Bao, L.R. and Yee, A.F., “Moisture Diffusion and Hygrothermal Aging in
Bismaleimide Matrix Carbon Fiber Composites-Part I: Uni-Weave Composites,”
Composites Science and Technology, Vol. 62, pp. 2099-2110, 2002.
20) Bao, L.R. and Yee, A.F., “Moisture Diffusion and Hygrothermal Aging in
Bismaleimide Matrix Carbon Fiber Composites: Part II-Woven and Hybrid
Composites,” Composites Science and Technology, Vol. 62, pp. 2111-2119, 2002.
21) Ju, J. and Morgan, R.J., “Characterization of Microcrack Development in BMI-Carbon
Fiber Composite under Stress and Thermal Cycling,” Journal of Composite Materials,
Vol. 38, pp. 2007-2024, 2004.
22) Zhang, Y., Fu, H. and Wang, Z., “Effect of Moisture and Temperature on the
Compressive Failure of CCF300/QY8911 Unidirectional Laminates,” Applied
Composite Materials, Vol. 20, pp. 857-872, 2013.
23) Cinquin, J. and Abjean, P., “Correlation between Wet Ageing, Humidity Absorption
and Properties on Composite Materials Based on Different Resins Family,”
International SAMPE, Anaheim, CA, Vol. 38, pp. 1539-1551, May 10-13, 1993.

88
24) Lincoln, J.E., Morgan, R.J. and Shin, E.E., “Moisture Absorption-Network Structure
Correlations in BMPM/DABPA Bismaleimide Composite Matrices,” Journal of
Advanced Materials, Vol. 32, pp. 24-34, 2000.
25) Bao, L.R., Yee, A.F. and Lee, C.Y.C., “Moisture Absorption and Hygrothermal Aging
in a Bismaleimide Resin,” Polymer, Vol. 42, pp. 7327-7333, 2001.
26) Li, Y., Miranda, J. and Sue, H.J., “Hygrothermal Diffusion Behavior in Bismaleimide
Resin,” Polymer, Vol. 42, pp. 7791-7799, 2001.
27) ASTM D5229/D5229M-14, 2014, “Standard Test Method for Moisture Absorption
Properties and Equilibrium Conditioning of Polymer Matrix Composite Materials”,
ASTM International, West Conshohocken, PA, 2014, DOI: 10.1520/D5229_D5229M-
14, www.astm.org.
28) ASTM D790-15, 2015, “Standard Test Methods for Flexural Properties of
Unreinforced and Reinforced Plastics and Electrical Insulating Materials”, ASTM
International, West Conshohocken, PA, 2015, DOI: 10.1520/D0790-15E02,
www.astm.org.
29) ASTM D2344/D2344-M13, 2013, “Standard Test Method for Short-Beam Strength of
Polymer Matrix Composite Materials and Their Laminates,” ASTM International,
West Conshohocken, PA, 2013, DOI: 10.1520/D2344_D2344M-13, www.astm.org.
30) Huo, Z., Mohamed, M., Nicholas, J.R., Wang, X. and Chandrashekhara, K.,
“Experimentation and Simulation of Moisture Diffusion in Foam-Cored Polyurethane
Sandwich Structure,” Journal of Sandwich Structures and Materials, Vol. 18, pp. 30-
49, 2016.
31) Chateauminois, A., Vincent, L., Chabert, B. and Soulier, J.P., “Study of the Interfacial
Degradation of a Glass-Epoxy Composite During Hygrothermal Ageing using Water
Diffusion Measurements and Dynamic Mechanical Thermal Analysis,” Polymer, Vol.
35, pp. 4766-4774, 1994.
32) Avilés, F. and Aguilar-Montero, M., “Moisture Absorption in Foam-Cored Composite
Sandwich Structures,” Polymer Composites, Vol. 31, pp. 714-722, 2010.
89
IV. EFFECT OF SALT WATER EXPOSURE ON FOAM-CORED
POLYURETHANE SANDWICH COMPOSITES
Z. Huo and K. Chandrashekhara
Department of Mechanical and Aerospace Engineering
Missouri University of Science and Technology, Rolla, MO 65409
ABSTRACT
This study investigated the effect of moisture absorption on mechanical
performance of polyurethane (PU) sandwich composites composed of E-
glass/polyurethane face sheets bonded to a polyurethane closed-cell foam core. The
vacuum assisted resin transfer molding (VARTM) process was used to manufacture E-
glass/polyurethane laminates and sandwich composite panels. Polyurethane closed-cell
foam core, polyurethane laminates and sandwich composites were submerged in salt water
for prolonged periods of time. Mechanical property degradation due to moisture absorption
was evaluated by conducting compression test of the foam core, three-point bending test
of the laminates, and double cantilever beam (DCB) Mode-I interfacial fracture test of
sandwich composites. The testing results revealed that the effect of salt water exposure on
the compressive properties of the foam core is insignificant. The flexural modulus of
polyurethane laminates degraded 8.9% and flexural strength degraded 13.0% after 166
days in 50% salinity salt water at 34 °C conditioning. The interfacial fracture toughness of
polyurethane sandwich composites degraded 22.4% after 166 days in 50% salinity salt
water at 34 °C conditioning.

90
1. INTRODUCTION
Structural sandwich composites which are composed of two thin, stiff, strong face
sheets bonded to a thick, lightweight core have received a great deal of attention for the
design of light-weight structures. These materials offer many advantages such as high
stiffness to weight ratio, excellent corrosion resistance and design flexibility. As a result,
sandwich composites have been utilized broadly in the transportation, energy, aerospace
and marine industries. However, it is widely known that polymers and polymeric
composites are susceptible to humid conditions, especially at elevated temperatures.
Absorbed moisture plays a detrimental role in both the integrity and durability of sandwich
composites since it can degrade the mechanical properties of the sandwich constituents and
induce interfacial failures. Complex phenomena including polymeric plasticization,
swelling, fiber/matrix interfacial cracking and facing/core debonding may occur on
structural sandwich composites when exposed to high moisture conditionings.
Though most engineering fibers are generally considered to be impermeable,
moisture absorption in thermoplastic/thermoset resin matrices is substantial. Extensive
studies [1-4] have indicated that absorption of water molecules degrades mechanical
properties of polymer composites due to plasticizing effects and resin deterioration. As
water preferentially diffuses along the fiber/matrix interface under hygrothermal
conditioning, fiber/matrix debonding and matrix cracking may occur resulting in the
degradation of fiber/matrix interfacial strength [5-7]. For polymeric foams, several studies
also have indicated that the mechanical properties of polymeric foams are substantially
affected by moisture absorption. Tagliavia et al. [8] found that the exposure of syntactic
foams to a water environment yields a deterioration of Young’s modulus and flexural
91
strength. Gupta and Woldesenbet [9] investigated the hygrothermal effects on compressive
strength of syntactic foams. Considerable decrease in modulus was observed in wet
samples compared to the dry reference samples, but no significant difference was observed
in the peak compressive strength of specimens under low temperature. Sadler et al. [10]
investigated the effect of water immersion on swelling and compression properties of Eco-
Core, PVC foam and balsa wood. The results indicated that Eco-Core is as good as PVC
foam in resisting swelling, water absorption and changes in compression properties due to
water immersion. Balsa wood showed a significant swelling, water absorption and
deterioration of compression properties.
The predominant structural failure mechanism that occurs in foam-cored sandwich
structures during the expected service life is the debonding between face sheets and foam
core. Several researchers have investigated the interfacial fracture toughness degradation
of foam-cored sandwich structures exposed to varying hygrothermal conditions. Veazie et
al. [11] investigated the facing/core interfacial fracture toughness of sandwich composites
made of E-glass/vinylester face sheets bonded to a closed-cell polyvinyl chloride (PVC)
core under hygrothermal conditioning. The results showed that the interfacial fracture
toughness was reduced considerably (greater than 50%) in specimens submerged in sea-
water, and significantly (approximately 90%) due to 5000 hours of the ‘hot/wet’ and
hot/dry exposure. Avilés and Aguilar-Montero [12] investigated the mechanical
degradation of sandwich specimens composed of E-glass/polyester face sheets bonded to
a PVC core exposed to high moisture conditioning. It was observed that the debond fracture
toughness of the facing/core interface degraded around 11.5% after 210 days in the 95%
relative humidity (RH) condition and degraded 30.8% after 92 days immersion in seawater.

92
Other studies [13, 14] found that the facing/core interface fracture toughness showed a
reduction of approximately 30% for carbon fiber vinylester facing and PVC H100 foam
sandwich due to sustained exposure to seawater.
However, few researchers have investigated the effect of moisture absorption on
the mechanical property of polyurethane sandwich composites. As an ideal matrix material
for composites, polyurethane has high impact properties, excellent abrasion/thermal
resistance and chemical inertness. Compared with conventional resin systems such as
polyester, vinyl ester, phenolics and epoxies, polyurethane can be produced in various
forms from flexible to rigid structures [15]. In this study, VARTM process was used to
manufacture E-glass/polyurethane laminates and polyurethane sandwich composites made
of E-glass/polyurethane face sheets and polyurethane foam core. Polyurethane rigid foam
core, laminates and sandwich samples were immersed in salt water for prolonged periods
of time. The degradation of mechanical properties due to salt water immersion was
evaluated by conducting compression test of the foam core, three-point bending test of the
laminates and DCB Mode-I interfacial fracture toughness test of sandwich samples.

93
2. EXPERIMENTAL
2.1. MATERIALS
The sandwich structures investigated in this study were composed of woven E-glass
fiber-reinforced thermoset polyurethane matrix face sheets and closed-cell rigid
polyurethane foam core with density of 96 kg/m3. The TRYMER™ 6000 foam was
provided by ITW (ITW Insulation Systems, Houston, TX) in the form of 50.8 mm thickness.
The E-glass fiber reinforcement in the form of a balanced 0/90˚ weave was obtained from
Owens Corning (Owens Corning, Toledo, OH). The matrix material employed was a two-
part thermoset polyurethane resin system obtained from Bayer MaterialScience.
2.2. SAMPLE MANUFACTURING AND ENVIRONMENTAL CONDITIONING
VARTM process was adopted to manufacture polyurethane laminates and
sandwich panels. The details of the process for manufacturing polyurethane sandwich
panels were described in the previous study [16]. During the bagging process, a non-
sticking Teflon film of 25 μm thickness was inserted between the bottom face sheet and
foam core to create a precrack of 50.8 mm nominal length at one end of polyurethane
sandwich panel, as shown in Figure 2.1(a). For the process of manufacturing polyurethane
laminates, the difference is that there is no foam core and only three layers of woven E-
glass fabric were laid between top and bottom peel plies. The experiment setups for
manufacturing polyurethane sandwich and laminates panels are illustrated in Figure 2.1(a)
and Figure 2.1(b) respectively. One sandwich panel with dimensions of 304.8 mm × 609.6
mm and one laminate panel with dimensions of 355.6 mm × 355.6 mm were manufactured.
The average thicknesses for final sandwich and laminate panel were 55.9 mm and 2.8 mm,
respectively. As-received PU foam core, PU laminate and PU sandwich panels were then

94
cut into required testing dimensions by a diamond saw. The artificial seawater with 50%
salinity was prepared by dissolving sea salt into distilled water. PU foam core samples were
submerged into 50% salinity salt water at room temperature (23 °C). PU laminates and
sandwich samples were submerged into more severe conditioning of 50% salinity salt
water at 34 °C. The isothermal exposure was controlled by a glass submersible heater with
digital controller. All the specimens were completely submerged in the immersion tanks
so that all the surfaces were in full contact with salt water.
(a)
(b)
Figure 2.1. VARTM setups used to manufacture (a) PU sandwich, (b) PU laminates
2.3. COMPRESSION TEST FOR FOAM CORE
Compression test for the foam core was performed according to ASTM D1621-10
[17] on a universal INSTRON machine. Specimens were taken out of immersion
conditioning and tested at three immersion time points (1 week, 3.5 months and 7 months)

95
to evaluate the effect of salt water immersion on the compressive modulus and strength of
foam core. The testing parameters are listed in Table 2.1 and the experiment setup is shown
in Figure 2.2.
Table 2.1. Parameters of compression test for foam core
Test Parameters
Compression
test
Nominal dimensions (mm)
(length × width × thickness) 50.8×50.8×50.8
Loading rate (mm/min) 5
Figure 2.2. Experiment setup for compression test
2.4. THREE-POINT BENDING TEST FOR PU LAMINATE
Three-point bending test was performed according to ASTM D790-15 [18] on a
universal INSTRON machine. Specimens were taken out of immersion conditioning and
then tested at two target time points (1.5 months and 5.5 months) to evaluate the effect of
moisture absorption on the flexural modulus and strength. The test parameters are listed in
Table 2.2 and the experiment setup is shown in Figure 2.3.

96
Figure 2.3. Experiment setup for three-point bending test
Table 2.2. Parameters of three-point bending test
Test Parameters
Three-point
bending test
Nominal dimensions (mm)
(length × width × thickness) 127×13.1×2.8
Support length (mm) 91.4
Loading rate (mm/min) 5.0
2.5. DCB MODE-I FRACTURE TEST FOR PU SANDWICH
Since there is no ASTM standard of double cantilever beam (DCB) Mode-I fracture
test for foam-cored sandwich composites, ASTM D5528-13 [19], D3433-99 [20] and
references [21, 22] were adopted as the guidelines for sandwich DCB Mode-I fracture test.
The nominal dimensions of PU sandwich specimens are 254 mm × 39.2 mm × 55.9 mm
(length × width × thickness), the detailed DCB configuration is illustrated in Figure 2.4. A
precrack of 50.8 mm nominal length between bottom face sheet and foam core was created
by inserting Teflon film during the manufacturing process and the crack tip was sharpened
using a surgical knife before immersion. The DCB sandwich specimens exposed to 50%
salinity salt water at 34 °C conditioning were first subjected to environmental conditioning,

97
and then taken out of the immersion tank at target time point for hinge bonding. Steel piano
hinges of 25.4 mm length were adhesively bonded to the top and bottom face sheets using
Loctite two-part epoxy adhesive. The bonding process includes drying, sanding and
cleaning the bonding surfaces of face sheets and piano hinges. The distance from the hinge
axis to the crack tip was nominally 25.4 mm which was the initial crack length. The
experiment setup is shown in Figure 2.5.
Figure 2.4. Double cantilever beam sandwich specimen configuration
Figure 2.5. Experiment setup for sandwich DCB interfacial Mode-I fracture test

98
3. ANALYSIS AND DISCUSSION
3.1. COMPRESSION TEST FOR FOAM CORE
The representative load-displacement curve of compression test for foam core is
illustrated in Figure 3.1 which presents an initial linear elastic behavior followed by a
plateau from which cellular cells begin to collapse. The compressive strength is calculated
using the ultimate load divided by the initial horizontal cross-sectional area, and
compressive modulus is calculated from the initial linear portion of the load-displacement
curve. Three replicates were tested at each immersion time point to report the average result
and the standard deviation (S.D.). The test results are listed in Table 3.1 and illustrated in
Figures 3.2(a) and 3.2(b).
Figure 3.1. Representative load-displacement curve of compression test for foam core
It can be observed from Figure 3.2 that the reference PU foam core without
moisture conditioning failed at an average compressive strength of 994.5 kPa with an
average compressive modulus of 30.5 MPa. There is no noticeable degradation of
compressive modulus due to salt water exposure, while the compressive strength degraded
8.6% compared with reference dry samples after the exposure to 50% salinity salt water
immersion at 23 °C for 7 months. The almost no change in compressive modulus and minor

99
degradation in compressive strength of PU foam core indicate that the moisture may only
diffuse a short distance from the outer surface of the foam, and thus any possible damage
in closed-cell foam core is confined to only a short distance from its outer surface [14]. The
failure modes for all PU foam core specimens (with and without moisture conditioning)
are almost identical: cellular cells collapse at the top and mid-section, as shown in Figure
3.3.
(a) (b)
Figure 3.2. Effect of salt water exposure on foam core (a) compressive modulus, (b)
compressive strength
Figure 3.3. Representative failure mode of PU foam core specimens under compression

100
Table 3.1. Effect of salt water exposure on compressive properties of foam core exposed
to 50% salinity salt water at 23 °C
Immersion
time
Compressive modulus (MPa)
Value (S.D.)
Compressive strength (kPa)
Value (S.D.)
Dry 30.5 (5.1) 994.5 (27.0)
1 week 29.9 (0.7) 941.1 (11.9)
3.5 months 30.5 (1.4) 924.1 (11.0)
7 months 29.6 (0.8) 909.2 (25.4)
3.2. THREE-POINT BENDING TEST FOR PU LAMINATE
The representative load-deflection curve of three-point bending test for laminates
is illustrated in Figure 3.4 from which the progressive failure mechanism can be observed.
Since the ratio of support span-to-depth is greater than 16 to 1, the flexural strength is
calculated using the following equation:
𝜎𝑓 = (3𝑃𝑓𝐿/2𝑏ℎ2)[1 + 6(𝐷/𝐿)2 − 4(ℎ/𝐿)(𝐷/𝐿)]
(1)
where 𝑃𝑓 is the maximum load, 𝐿 is the support span length, 𝐷 is deflection of the
centerline of the specimen at the middle of the support span, and 𝑏, ℎ are the width and
thickness of the specimen respectively. The flexural modulus is calculated using the
following equation:
𝐸𝐵 = 𝐿3𝑚/(4𝑏ℎ3)
(2)
where 𝐿 is the support span length, 𝑚 is slope of the tangent to the initial straight-line
portion of the load-deflection curve, 𝑏, ℎ are the width and thickness of the specimen,
respectively.
Three replicates were tested at each immersion time point to report the average
value and the standard deviation. The test results are listed in Table 3.2 and plotted in
Figure 3.5. The reference PU laminate without moisture conditioning failed at an average
strength of 608.1 MPa with an average flexural modulus of 23.7 GPa. All PU laminate

101
specimens (with and without moisture conditioning) failed by fiber failure in the tension
side and matrix crushing in the compression side, as shown in Figure 3.6. Compared with
reference dry samples, the flexural modulus of PU laminates degraded 8.9% and flexural
strength degraded 13.0% after the exposure to 50% salinity salt water at 34 °C for 5.5
months. The decrease in flexural strength and flexural modulus can be attributed to the
weakening of fiber/matrix interfacial bonding strength and the plasticization of the matrix
materials. The fiber/matrix interfacial damage can reduce the structural capability of
transmitting the load from the matrix to the fibers. The reduction percentage of flexural
modulus is negligible and this value is comparable with that of composite laminates made
of glass fiber with other resin system such as epoxy after the exposure to similar moisture
conditioning reported in other literature [4]. The minor degradation in flexural modulus is
due to that the hygrothermal conditioning did not significantly influence elastic modulus
of the fiber reinforcement and fiber/matrix interfacial bonding strength.
Figure 3.4. Representative load-deflection curve of flexural test for PU laminates
3.3. DCB MODE-I FRACTURE TEST FOR PU SANDWICH
The DCB Mode-I fracture tests were conducted using a 10 kN servo-hydraulic
loading cell with a crosshead loading rate of 1.0 mm/min. The piano hinge tabs were

102
mounted in the hydraulic grips of the loading frame. A roller support was used to support
the specimen weight and mounted on the loading frame to prevent the specimen from
rotating during the test setting up. A digital video camera was used to record and track the
crack tip during the testing. As the test started, the crack tip was monitored for propagation.
If the crack propagated steadily, the crack propagation was monitored and flag was placed
in the data file as the crack tip passed through the 10.0 mm intervals marked on the
specimen. The crack was allowed to propagate approximately 15.0 mm and then the
crosshead displacement was reversed. If the crack propagated in an unstable manner, the
crosshead displacement was stopped, the new crack tip location was marked using a marker
pen, and then the crosshead displacement was reversed. Loading/unloading force and
crosshead displacement were recorded throughout the test. This procedure was repeated
over approximately 60 mm of crack growth. Although the bi-material nature of the
sandwich composites may induce Mode-II shear loading contributions at the crack tip,
crack propagation in sandwich DCB specimens is considered to be Mode-I dominant [23,
24], which matched with the present experiment observations. For all specimens examined,
the crack propagated at the facing/core interface without noticeable kinking, as shown in
Figure 2.5. It is generally accepted that minor shear loading contributions do not greatly
influence the measured Mode-I fracture toughness of DCB sandwich specimens. The
digital images of the interfacial cracks were analyzed using the image analysis software
ImageJ® to determine the crack increment length in each loading/unloading cycle. The
representative load-displacement curve of DCB Mode-I interfacial fracture test is
illustrated in Figure 3.7 which presents an essentially linear load-displacement behavior.

103
As expected, the critical load for crack propagation and the specimen stiffness decreased
as the crack length increased for the same sandwich DCB specimen.
(a)
(b)
Figure 3.5. Effect of salt water exposure on laminates (a) flexural modulus, (b) flexural
strength
(a)
(b)
Figure 3.6. Representative failure mode of PU laminates under flexural test (a) dry
specimen, (b) wet specimen

104
Figure 3.7. Representative load-displacement curve of DCB test for PU sandwich
specimens
The strain energy release rate is one fracture mechanics parameter which measures
the amount of energy required to extend a crack over a unit bonded surface area. The
critical strain energy release rate can be considered as the fracture toughness, GIC, of the
sandwich facing/core interface. In this study, two methods were adopted to calculate the
Mode-I fracture toughness: the area method [21, 22] and modified beam theory (MBT)
method [11, 25, 26]. The fracture toughness calculated using area method is expressed in
the following equation:
𝐺𝐼 =∆𝐸
𝑏∆𝑎 (3)
where ∆𝐸 is the area under the load-displacement curve in each loading/unloading cycle,
and is calculated using the trapezoid rule in Matlab; 𝑏 is the width of the specimen, ∆𝑎 is
the crack increment in each loading/unloading cycle. This value was calculated for each
loading/unloading cycle and the average value was reported from a single test specimen.
The use of linear elastic fracture mechanics (LEFM) was first introduced to measure the
Mode-I adhesive fracture energy of adhesive joints by Ripling and co-workers [26, 27]

105
who developed a Mode-I test method to measure the fracture toughness of structural bonds
between metallic substrates. The beam theory expression for the strain energy release rate
of a perfectly built-in double cantilever beam is expressed as follows:
𝐺𝐼 =3𝑃𝛿
2𝑏𝑎 (4)
where 𝑃 is the load, 𝛿 is the load point displacement, 𝑏 is the specimen width, 𝑎 is the
crack length. However, this expression will overestimate 𝐺𝐼𝐶 due to the perfectly build-in
assumption. This assumption can introduce errors in the calculation due to that the rotation
may occur at the delamination front. One way of correcting for this rotation is to treat the
DCB as if it contains a slightly longer delamination length, 𝑎 + |∆|, where ∆ is determined
experimentally by generating a least squares plot of the cube root of compliance, 𝐶1/3, as
a function of crack length. The compliance, 𝐶, is the ratio of the load point displacement
to the applied load, 𝛿/𝑃. The values used to generate this plot should be the load and
displacements corresponding to the visually observed crack onset on the edge and all the
propagation values. The representative curve of 𝐶1/3 as a function of crack length for PU
sandwich specimen is illustrated in Figure 3.8. The Mode-I interfacial fracture toughness
calculated using MBT method is expressed as the following equation.
𝐺𝐼 =3𝑃𝛿
2𝑏(𝑎 + ∆) (5)
Three replicates were tested at each immersion time point to report the average value and
the standard deviation for both methods. The results of interfacial DCB Mode-I fracture
test are listed in Table 3.3 and illustrated in Figure 3.9. It can be observed that both the area
method and MBT method gave almost identical results. For the reference sandwich DCB
specimens without moisture conditioning, the average interfacial fracture toughness

106
measured are 124.1 J/m2 and 120.1 J/m2 using the area method and MBT method
respectively. This value is comparable with previous measurement of sandwich material
composed of similar material constituents reported in other literature [21]. The interfacial
fracture toughness degraded around 22.4% (22.1% for the area method and 22.7% for MBT
method) after the exposure to 50% salinity salt water at 34 °C for 5.5 months. The decrease
in interfacial fracture toughness is mainly due to the weakening of the bonding strength
between face sheets and foam core.
Table 3.2. Effect of salt water exposure on flexural properties of PU laminates exposed to
50% salinity salt water at 34 °C
Immersion
time
Flexural modulus (GPa)
Value (S.D.)
Flexural strength (MPa)
Value (S.D.)
Dry 23.7 (0.4) 608.1 (11.2)
1.5 months 22.7 (0.1) 580.2 (21.2)
5.5 months 21.6 (1.7) 529.0 (19.8)
Figure 3.8. Representative curve of 𝐶1/3 vs. crack length for PU sandwich specimen

107
Figure 3.9. Effect of salt water exposure on interfacial fracture toughness of PU sandwich
composites
Table 3.3. Effect of salt water exposure on fracture toughness of PU sandwich exposed to
50% concentration salt water at 34 °C
Immersion
time
Interfacial fracture toughness (J/m2)
Value (S.D.)
Area method MBT method
Dry 124.1 (12.1) 120.1 (14.8)
1.5 months 111.9 (11.5) 112.1 (10.6)
5.5 months 96.7 (10.5) 92.9 (10.1)

108
4. CONCLUSIONS
In this study, E-glass/polyurethane laminates and sandwich composites composed
of E-glass/polyurethane face sheets bonded to a polyurethane foam core were
manufactured using VARTM process. Polyurethane closed-cell foam, polyurethane
laminates and sandwich composites were submerged in salt water for prolonged periods of
time. The degradation of mechanical properties due to salt water exposure was evaluated
by conducting compression test of the foam core, three-point bending test of the laminates,
and interfacial Mode-I fracture test of sandwich panels. The results revealed that the effect
of moisture absorption on the compressive properties of foam core is negligible. The
flexural modulus of polyurethane laminates degraded 8.9% and flexural strength degraded
13.0% after 166 days in 50% salinity salt water and 34 °C conditioning. Significant
reduction (~22.4 %) in the interfacial fracture toughness of PU sandwich due to salt water
exposure was found and needs to be considered for the product design.

109
REFERENCES
1) Shen, C.H. and Springer, G.S., “Effects of Moisture and Temperature on the Tensile
Strength of Composite Materials,” Journal of Composite Materials, Vol. 11, pp. 2-16,
1977.
2) Wan, Y.Z., Wang, Y.L., Huang, Y., Zhou, F.G., He, B.M., Chen, G.C. and Han, K.Y.,
“Moisture Sorption and Mechanical Degradation of VARTMed Three-Dimensional
Braided Carbon–Epoxy Composites,” Composites Science and Technology, Vol. 65,
pp. 1237-1243, 2005.
3) Selzer, R. and Friedrich, K., “Mechanical Properties and Failure Behaviour of Carbon
Fibre-reinforced Polymer Composites under the Influence of Moisture,” Composites
Part A: Applied Science and Manufacturing, Vol. 28, pp. 595-604, 1997.
4) Abdel-Magid, B., Saeed, Z., Katrina, G. and Marcus S., “The Combined Effects of
Load, Moisture and Temperature on the Properties of E-Glass/Epoxy Composites,”
Composite Structures, Vol. 71, pp. 320-326, 2005.
5) Chu, W., Wu, L. and Karbhari, V.M., “Durability Evaluation of Moderate Temperature
Cured E-Glass/Vinylester Systems,” Composite Structures, Vol. 66, pp. 367-376, 2004.
6) Ray, B.C., “Temperature Effect During Humid Ageing on Interfaces of Glass and
Carbon Fibers Reinforced Epoxy Composites,” Journal of Colloid and Interface
Science, Vol. 298, pp. 111-117, 2006.
7) Gaur, U., Chou, C.T. and Miller, B., “Effect of Hydrothermal Ageing on Bond
Strength,” Composites, Vol. 25, pp. 609-612, 1994.
8) Tagliavia, G., Porfiri, M. and Gupta, N., “Influence of Moisture Absorption on Flexural
Properties of Syntactic Foams,” Composites Part B: Engineering, Vol. 43, pp.115-123,
2012.
9) Gupta, N. and Woldesenbet, E., “Hygrothermal Studies on Syntactic Foams and
Compressive Strength Determination,” Composite Structures, Vol. 61, pp. 311–320,
2003.
10) Sadler, R.L., Sharpe, M., Panduranga, R. and Shivakumar, K., “Water Immersion
Effect on Swelling and Compression Properties of Eco-Core, PVC Foam and Balsa
Wood,” Composite Structures, Vol. 90, pp. 330–336, 2009.
11) Veazie, D.R., Robinson, K.R. and Shivakumar, K., “Effects of the Marine Environment
on the Interfacial Fracture Toughness of PVC Core Sandwich Composites,”
Composites Part B: Engineering, Vol. 35, pp. 461-466, 2004.

110
12) Avilés, F. and Aguilar-Montero, M., “Mechanical Degradation of Foam-Cored
Sandwich Materials Exposed to High Moisture,” Composite Structures, Vol. 92, pp.
122-129, 2010.
13) Penumadu, D., Weitsman, Y.J. and Siriruk, A., “Effect of Sea Environment on
Interfacial Delamination Behavior of Sandwich Layups,” 16th International
Conference on Composite Materials, Kyoto, Japan, pp.1-5, July 8-13, 2007.
14) Li, X. and Weitsman, Y.J., “Sea-Water Effects on Foam-Cored Composite Sandwich
Lay-Ups,” Composites Part B: Engineering, Vol. 35, pp. 451-459, 2004.
15) Szycher, M., Szycher’s Handbook of Polyurethanes, 2nd ed., CRC Press, Boca Raton,
FL, 2012.
16) Huo, Z., Mohamed, M., Nicholas, J.R., Wang, X., and Chandrashekhara, K.,
“Experimentation and Simulation of Moisture Diffusion in Foam-Cored Polyurethane
Sandwich Structure,” Journal of Sandwich Structures and Materials, Vol. 18, pp. 30-
49, 2016.
17) ASTM D1621-10, 2010, “Standard Test Methods for Compressive Properties of Rigid
Cellular Plastics”, ASTM International, West Conshohocken, PA, 2010, DOI:
10.1520/D1621-10, www.astm.org.
18) ASTM D790-15, 2015, “Standard Test Methods for Flexural Properties of
Unreinforced and Reinforced Plastics and Electrical Insulating Materials”, ASTM
International, West Conshohocken, PA, 2015, DOI: 10.1520/D0790-15E02,
www.astm.org.
19) ASTM D5528-13, 2013, “Standard Test Methods for Mode I Interlaminar Fracture
Toughness of Unidirectional Fiber-Reinforced Polymer Matrix Composites”, ASTM
International, West Conshohocken, PA, 2013, DOI: 10.1520/ D5528-13,
www.astm.org.
20) ASTM D3433-99, 2012, “Standard Test Methods for Fracture Strength in Cleavage of
Adhesives in Bonded Metal Joints”, ASTM International, West Conshohocken, PA,
2012, DOI: 10.1520/ D3433-99R12, www.astm.org.
21) Kolat, K., Neser, G. and Özes, C., “The Effect of Sea Water Exposure on the Interfacial
Fracture of Some Sandwich Systems in Marine Use”, Journal of Composite Structures,
Vol. 78, pp. 11-17, 2007.
22) Smith, S.A. and Shivakumar, K.N., “Modified Mode-I Cracked Sandwich Beam
Fracture Test,” AIAA paper, Vol. 1221, pp. 1-18, 2001.
23) Shivakumar, K., Chen, H. and Smith, S.A., “An Evaluation of Data Reduction Methods
for Opening Mode Fracture Toughness of Sandwich Panels,” Journal of Sandwich
Structures and Materials, Vol. 7, pp. 77-90, 2005.

111
24) Avilés, F and Carlsson, L.A., “Analysis of the Sandwich DCB Specimen for Debond
Characterization,” Engineering Fracture Mechanics, Vol. 75, pp. 153-168, 2008.
25) Williams, J.G., “The Fracture Mechanics of Delamination Tests,” Journal of Strain
Analysis for Engineering Design, Vol. 24, pp. 207-214, 1989.
26) Ripling, E.J., Mostovoy, S. and Patrick, R.L., “Measuring Fracture Toughness of
Adhesive Joints,” Materials Research and Standards, Vol. 4, pp. 129-134, 1964.
27) Mostovoy, S., Crosley, P.B. and Ripling, E.J., “Use of Crack-line Loaded Specimens
for Measuring Plane-Strain Fracture Toughness,” Journal of Materials, Vol. 2, pp. 661-
681, 1967.

112
SECTION
4. CONCLUSIONS
The first paper proposed a moisture concentration-dependent method and
implemented using user-defined subroutine USDFLD in commercial finite element code
to simulate moisture diffusion behavior in multi-layer unidirectional fiber-reinforced
hybrid composite structures. The moisture concentration-dependent method assumes that
the fibers restrain the matrix from free-swelling. As a result, the diffusion coefficients
gradually decrease due to swelling stress built inside the material during the diffusion
process, and then drift to a constant value when moisture concentration approaches
equilibrium moisture content. The concentration-dependent diffusivity curves are
continuous fifth-order polynomial curves. The curve pattern function for CFRP component
was different from that of GFRP. Finite element model for a three-layer hybrid composite
structure was developed, and the simulation results were validated with experimental
findings. This model was extended to simulate the moisture diffusion behavior in adhesive-
bonded four-layer hybrid symmetric composite laminates. The results indicated that
thinner adhesive layers (0.12 mm thick) didn’t significantly affect the overall moisture
uptake. Thicker adhesive layers (0.76 mm thick) noticeably accelerated the overall
moisture uptake after 81 days’ conditioning.
The second paper proposed a multi-stage diffusion model was proposed to explain
the significant deviation from Fick’s law using a time-dependent diffusivity scheme for the
closed-cell polyurethane foam core. This scheme assumes that water diffusion within the
cellular structure and any condensation or water entrapment is regarded as a diffusion
process for the sake of simplicity. It also assumes that the effective foam diffusivity

113
changes with time due to internal stress and complex microscopic cellular foam structure.
One user-defined subroutine USDFLD was developed to implement this time-dependent
diffusivity scheme into a commercial code ABAQUS. A three-dimensional dynamic finite
element model was developed to validate the diffusion parameters for neat resin and
sandwich constituents. The simulation results showed a good correlation with the
experimental findings.
The third paper investigated the three-dimensional moisture diffusion behavior of
carbon/BMI composites with two stacking sequences (unidirectional and cross-ply) under
seawater conditioning at two elevated temperatures (50 °C and 90 °C). Moisture
diffusivities and solubility for each type of laminates at two temperatures were
characterized according to the experimental data, and these parameters were implemented
in a three-dimensional dynamic finite element model to predict the moisture diffusion
behavior. It was found that the moisture diffusion characteristics of both types of laminates
followed classical Fick’s law. For unidirectional carbon/BMI laminates, the flexural
strength decreased 27.3% and the ILSS decreased 19.9% after 3 months’ immersion at
50 °C. For cross-ply carbon/BMI laminates, the flexural strength decreased 19.9% and the
ILSS decreased 7.9% after 3 months’ immersion at 50 °C. The deterioration effects of
hygrothermal aging on the flexural strength and ILSS is more severe at 90 °C than that at
50 °C. Fiber/matrix interfacial cracks were observed by SEM on the cross section of
hygrothermally aged BMI laminates. These interfacial cracks can reduce the structural
capability of transmitting the load from the matrix to the fibers, resulting in the reduction
of both flexural strength and interlaminar shear strength for both types of laminates.

114
The fourth paper investigated the influence of salt water exposure on the
mechanical properties of polyurethane closed-cell foam, polyurethane laminates and
sandwich composites after the prolonged immersion in salt water. The degradation of
mechanical properties due to salt water exposure was evaluated by conducting compression
test of the foam core, three-point bending test of the laminates, and interfacial Mode-I
fracture test of sandwich panels. The results revealed that the effect of moisture absorption
on the compressive properties of foam core is negligible. The flexural modulus of
polyurethane laminates degraded 8.9% and flexural strength degraded 13.0% after 166
days in 50% salinity salt water and 34 °C conditioning. Significant reduction (~22.4 %) in
the interfacial fracture toughness of PU sandwich due to salt water exposure is found and
needs to be considered for the product design.

115
BIBLIOGRAPHY
1) Shen, C.H. and Springer, G.S., “Effects of Moisture and Temperature on the Tensile
Strength of Composite Materials,” Journal of Composite Materials, Vol.11, pp. 2-16,
1977.
2) Jiang, X., Kolstein, H., Bijlaard, F. and Qiang, X., “Effects of Hygrothermal Aging on
Glass-Fibre Reinforced Polymer Laminates and Adhesive of FRP Composite Bridge:
Moisture Diffusion Characteristics,” Composites Part A: Applied Science and
Manufacturing, Vol. 57, pp. 49-58, 2014.
3) Wan, Y.Z., Wang, Y.L., Huang, Y., Zhou, F.G., He, B.M., Chen, G.C. and Han, K.Y.,
“Moisture Sorption and Mechanical Degradation of VARTMed Three-Dimensional
Braided Carbon–Epoxy Composites,” Composites Science and Technology, Vol. 65,
pp. 1237-1243, 2005.
4) Selzer, R. and Friedrich, K., “Mechanical Properties and Failure Behaviour of Carbon
Fibre-reinforced Polymer Composites under the Influence of Moisture,” Composites
Part A: Applied Science and Manufacturing, Vol. 28, pp. 595-604, 1997.
5) Chu, W., Wu, L. and Karbhari, V.M., “Durability Evaluation of Moderate Temperature
Cured E-Glass/Vinylester Systems,” Composite Structures, Vol. 66, pp. 367-376, 2004.
6) Ray, B.C., “Temperature Effect During Humid Ageing on Interfaces of Glass and
Carbon Fibers Reinforced Epoxy Composites,” Journal of Colloid and Interface
Science, Vol. 298, pp. 111-117, 2006.
7) Gaur, U., Chou, C.T. and Miller, B., “Effect of Hydrothermal Ageing on Bond
Strength,” Composites, Vol. 25, pp. 609-612, 1994.
8) Eslami, S., Honarbakhsh-Raouf, A. and Eslami, S., “Effects of Moisture Absorption on
Degradation of E-Glass Fiber Reinforced Vinyl Ester Composite Pipes and Modelling
of Transient Moisture Diffusion using Finite Element Analysis,” Corrosion Science,
Vol. 90, pp. 168-175, 2015.
9) Tagliavia, G., Porfiri, M. and Gupta, N., “Influence of Moisture Absorption on Flexural
Properties of Syntactic Foams,” Composites Part B: Engineering, Vol. 43, pp. 115-
123, 2012.
10) Gupta, N. and Woldesenbet, E., “Hygrothermal Studies on Syntactic Foams and
Compressive Strength Determination,” Composite Structures, Vol. 61, pp. 311–320,
2003.
11) Sadler, R.L., Sharpe, M., Panduranga, R. and Shivakumar, K., “Water Immersion
Effect on Swelling and Compression Properties of Eco-Core, PVC Foam and Balsa
Wood,” Composite Structures, Vol. 90, pp. 330–336, 2009.

116
12) Veazie, D.R., Robinson, K.R. and Shivakumar, K., “Effects of the Marine Environment
on the Interfacial Fracture Toughness of PVC Core Sandwich Composites,”
Composites Part B: Engineering, Vol. 35, pp. 461-466, 2004.
13) Avilés, F. and Aguilar-Montero, M., “Mechanical Degradation of Foam-Cored
Sandwich Materials Exposed to High Moisture,” Composite Structures, Vol. 92, pp.
122-129, 2010.
14) Penumadu, D., Weitsman, Y.J. and Siriruk, A., “Effect of Sea Environment on
Interfacial Delamination Behavior of Sandwich Layups,” 16th International
Conference on Composite Materials, Kyoto, Japan, pp.1-5, July 8-13, 2007.
15) Li, X. and Weitsman, Y.J., “Sea-Water Effects on Foam-Cored Composite Sandwich
Lay-Ups,” Composites Part B: Engineering, Vol. 35, pp. 451-459, 2004.
16) Loos, A.C. and Springer, G.S. “Moisture Absorption of Graphite-Epoxy Composites
Immersed in Liquids and in Humid Air,” Journal of Composite Materials, Vol. 13, pp.
131-147, 1979.
17) Shen, C.H. and Springer, G.S. “Moisture Absorption and Desorption of Composite
Materials,” Journal of Composite Materials, Vol.10, pp. 2-20, 1976.
18) Loos, A.C. and Springer, G.S. “Moisture Absorption of Polyester-E Glass
Composites,” Journal of Composite Materials, Vol.14, pp.142-154, 1980.
19) Zhang, S., Huang, Z., Zhang, Y. and Zhou, H., “Experimental Investigation of Moisture
Diffusion in Short-Glass-Fiber-Reinforced Polyamide 6,6,” Journal of Applied
Polymer Science, Vol. 132, pp. 1-12, 2015.
20) Jiang, X., Kolstein, H. and Bijlaard, F.S.K., “Moisture Diffusion in Glass–Fiber-
Reinforced Polymer Composite Bridge under Hot/Wet Environment,” Composites Part
B: Engineering, Vol. 45, pp. 407-416, 2013.
21) Gopalan, R., Rao, R.M.V.G.K., Murthy, M.V.V., and Dattaguru, B. “Diffusion Studies
on Advanced Fibre Hybrid Composites,” Journal of Reinforced Plastics and
Composites, Vol. 5, pp. 51-61, 1986.
22) Gurtin, M.E. and Yatomi, C. “On a Model for Two Phase Diffusion in Composite
Materials,” Journal of Composite Materials, Vol.13, pp. 126-130, 1979.
23) Kumar, A. and Roy, S., “Modeling of Anomalous Moisture Diffusion in Nanographene
Reinforced Thermoset Polymers,” Composite Structures, Vol. 122, pp. 1-7, 2014.
24) Bao, L.R. and Yee, A.F. “Moisture Diffusion and Hygrothermal Aging in
Bismaleimide Matrix Carbon Fiber Composites: Part II-Woven and Hybrid
Composites,” Composites Science and Technology, Vol. 62, pp. 2111-2119, 2002.

117
25) Weitsman, Y. “Coupled Damage and Moisture-transport in Fiber-reinforced,
Polymeric Composites,” International Journal of Solids and Structures, Vol. 23, pp.
1003-1025, 1987.
26) Whitney, J.M. and Browning, C.E. “Some Anomalies Associated with Moisture
Diffusion in Epoxy Matrix Composite Materials,” Advanced Composite Materials-
Environmental Effects, ASTM STP 658, American Society for Testing and Materials,
pp. 43-60, 1978.
27) Gillat, O. and Broutman, L.J. “Effect of an External Stress on Moisture Diffusion and
Degradation in a Graphite-Reinforced Epoxy Laminate,” Advanced Composite
Materials-Environmental Effects, ASTM STP 658, Vinson, J. R., Ed., 1978, American
Society for Testing and Materials, pp. 61-83.
28) Wan, Y.Z., Wang, Y.L., Huang, Y., He, B.M., and Han, K.Y. “Hygrothermal Aging
Behaviour of VARTMed Three-dimensional Braided Carbon-epoxy Composites under
External Stresses.” Composite Part A: Applied Science and Manufacturing, Vol.36, pp.
1102-1109, 2005.
29) Crank, J. “A Theoretical Investigation of the Influence of Molecular Relaxation and
Internal Stress on Diffusion in Polymers,” Journal of Polymer Science, Vol. 11, pp.
151-168, 1953.
30) Meng, M., Rizvi, M.J., Le, H.R. and Grove, S.M., “Multi-Scale Modelling of Moisture
Diffusion Coupled With Stress Distribution in CFRP Laminated Composites,”
Composite Structures, Vol. 138, pp. 295-304, 2016.

118
VITA
Mr. Zhen Huo was born in Wuhan, Hubei, China. He was admitted to Huazhong
University of Science and Technology, China, in 2002 and received his Bachelor’s degree
and Master’s degree in Material Processing Engineering in 2006 and in 2008 respectively.
He worked at Beijing Renmin Electronics Company, China, as an information system
architect from August 2008 to July 2010.
Since August 2010, Mr. Zhen Huo has been enrolled in the Ph.D. program in
Mechanical Engineering at Missouri University of Science and Technology (formerly
University of Missouri-Rolla), Rolla, Missouri, USA. He had served both as Graduate
Research Assistant and Graduate Teaching Assistant between August 2010 and July 2016
in the Department of Mechanical and Aerospace Engineering. In July 2016, he received
his Ph.D. degree in Mechanical Engineering from Missouri University of Science and
Technology, Rolla, Missouri.