modeling and analysis of labour cost estimation for ship …
TRANSCRIPT

MODELING AND ANALYSIS OF LABOUR COST ESTIMATION FOR SHIP
REPAIRING: A CASE STUDY IN CHITTAGONG DRY DOCK LIMITED
by
Mohammad Sajedul Karim
A thesis submitted in partial fulfillment of the requirements for the degree of
Master of Science
in Industrial Engineering and Management
Khulna University of Engineering & Technology
Khulna 9203, Bangladesh
17 December 2019


IV
Acknowledgement
Truly speaking, it is a great opportunity for me to be a student of Master of Science in
Industrial Engineering and Management in IEM department of KUET. The course has
actually enlightened my thought process and once again it has appeared to me that there is no
end to learning. The course has changed my outlook towards everything. Especially matters
related to Industrial Engineering Management have inspired me a lot. I was being to myself
while going through the contents of all nine subjects/courses taken by me in this Masters
Programme. One of the requirements of this course is that the students need to understand
and analyze the different aspects of IEM, correlate and apply the same in various facets in
industrial sectors, if needed. Certainly it is a humbling experience to go through the process
of writing the project paper. Firstly, I wish to express my heartfelt gratitude to all teachers
and course coordinators involved in Masters Programme for sharing their vast experience
with us in this field and giving us an excellent insight of industrial engineering environment
analysis and its management policy. It stands to reason that I am very much privileged to get
Dr. Azizur Rahman, Associate Professor, Department of IEM, KUET as my Supervisor for
writing project paper. It’s a no denying fact that without his constructive suggestions and
guidelines, it would have been very difficult to complete the project paper in time. He has
spared his valuable time on different occasions, scrutinized my progress, guided on different
issues related to project paper and gave his valuable comments, views and opinions for
preparation of the same. From the deep of my heart, I express my gratefulness to him.
I categorically convey my special thanks to the Head of the Department of IEM for allowing
me to study in Masters Course in IEM department of KUET.
I also honestly appreciate the silent contribution of all my classmates of Masters Course, who
has kept the environment so vibrant and enjoyable that has inspired me all along to go
through the course wholeheartedly without hurdles.
Most importantly, I wholeheartedly express my sincere gratefulness to the all-powerful
Almighty Allah for enabling me to complete my thesis work in a humble way.
17 December 2019 The Author
V
Abstract
With the increase of international trade activities through sea and resulting exponential growth of
number of ships calling on coastal nations’ ports, ship repair is becoming an increasingly attractive
opportunity for littoral countries. Being a coastal nation, there were rapid growth of number of
local shipyards in Bangladesh for past couple of years. This factor put CDDL faced with
tremendous competition in ship repair arena in the national market. Besides, docking of ships and
ship repairing work, are, by nature labor intensive. Labour cost contributes significantly to total
repair cost. Besides acquiring market information, CDDL must estimate labor cost accurately to
give competitive quotations in order to obtain ship repair orders. Lower labour cost value allow
shipyards and ship owners to get higher productivity and lower final invoice respectively.
Forecasting estimated labor cost will allow CDDL to stay competitive among the ship repair
industries. In this project paper, attempt has been made to identify the number of those independent
variables that influence ship repairing labour (dependent variable) and their inter-relationship.
Since labor cost for ship repair can be expressed as a function of ship’s age, deadweight,
displacement, type of ship and various repair works, so a multiple linear regression model is
developed to construct a labor cost estimation model. From 2002 to 2019, ship repairing labour
(man-days) related information for 43 sets for fishing vessel, 30 sets for oil tanker, 51 sets for
multipurpose cargo ship, 40 sets for warship, 11 sets for dredger/barge and 15 sets for tugboat of
various ages, sizes and types were collected from data storage of CDDL to construct models for
each ship group. Regression coefficients are found out by applying “Method of Least Squares” in
regression analysis. CDDL can use this mathematical model as a guiding tool to forecast labour
cost estimates more realistically for ships to be under repair.

Contents
PAGE
Title Page I
Declaration II
Approval III
Acknowledgement IV
Abstract V
List of Content VI
Table of Content IX
List of Figure X
List of Appendix XI
CHAPTER I Prelude 1
1.1 Background 1
1.2 Requirements of Effective Labour Cost Estimation 2
1.3 Objectives of the Thesis 2
1.4 Statement of the Problem 2
1.5 Significance 3
CHAPTER II Literature Review 5
2.1 Dry Docking Operation for a Ship for Repair 5
2.2 Ship Repair Demand Outlook 5
2.2.1 Blue Economy 5
2.2.2 Blue Economy - Bangladesh Perspective and Ship
Repair Opportunity
6
2.2.3 Involvement of More Ships in Sea Borne Trade 6
2.2.4 Sea Borne Trade – Bangladesh Perspective and Ship
Repair Prospect
7

2.3 Ship Repair Time and Cost 7
2.3.1 Duration of Ship Repair 8
2.3.2 Ship’s Maintenance/Repair Cost 8
2.3.3 Cost Estimation 9
2.3.4 Estimated Labour Cost 10
2.4 Definitions 10
2.4.1 Displacement 11
2.4.2 Full Load Displacement 11
2.4.3 Lightweight Displacement 11
2.4.4 Deadweight Tonnage 11
CHAPTER III SWOT Analysis 12
3.1 Strength and Opportunity for CDDL 12
3.1.1 Strength 12
3.1.2 Weakness 12
3.1.3 Opportunity 13
3.1.4 Threat 14
3.2 Challenges for CDDL 14
3.3 Comparison of Labour Costs among Various Countries 15
CHAPTER IV Pertinent Definitions 17
4.1 Age 17
4.2 Size 17
4.3 Type 18
4.4 Scope of Repairing Works 18
CHAPTER V Hypothesis
5.1 Statistical Equations 20
5.2 Model Construction 21
5.3 Collection of Data and Methodology 22

5.3.1 Collection of Sample Data 22
5.3.2 Methodology 23
5.3.3 Multiple Linear Regression Analysis 24
CHAPTER VI Procedure/ Methodology 28
6.1 Number of Graphs (No. of Ships vs Independent
Variables) for Cargo Ship, Fishing Vessel, Oil Tanker,
Dredger and Barge
28
6.2 Number of Graphs (Man-day vs Independent
Variables) for Cargo Ship, Fishing vessel, Oil Tanker,
Dredger and Barge
34
6.3 Number of Graphs (No. of Ships vs Independent
Variables) for Warship
39
6.4 Number of Graphs (Man-day vs Independent
Variables) for Warship
44
6.5 Number of Graphs (No. of Ships vs Independent
Variables) for Tug boat & Other Ships
49
6.6 Number of Graphs (Man-day vs Independent
Variables) for Tug Boat & Other Ships
54
6.7 Number of Graphs (Man-day vs Type of Ship) for
“Cargo Ship, Fishing vessel, Oil Tanker, Dredger and
Barge”, ‘Warships’ and “Tug boat & Other Ships”
59
CHAPTER VII Analysis and Discussion
7.1 7.1 Correlation Coefficient (r) and Coefficient of
Multiple Determination (R2)
61
7.2 7.2 Regression Equations 66

7.3 7.2.1 Cargo Ships, Oil Tankers, Fishing Vessel and
Dredgers
66
7.4 7.2.2 Warships 69
7.5 7.2.3 Tugboat and Other Ships 72
7.6 7.2.4 Coefficient of Multiple Determination
Considering All Independent Variables
74
7.7 7.2.5 Regression Coefficients and Other Statistical
Parameters
76
CHAPTER VIII Validation and Deduction
8.1 Validation of the Model 80
8.2 Deduction 82
CHAPTER IX Conclusion and Recommendations 60
9.1 Conclusion 83
9.2 Recommendations 83
9.3 Limitations of the Study 84
IX
LIST OF TABLES
Table No Description Page
1.
Labour Costs of Various Countries
15
2. Correlation Coefficient - 1st Group - Cargo Ship + Oil Tanker +
Fishing Vessel + Dredger
61
3. Correlation Coefficient - 2nd Group - Warship 62
4. Correlation Coefficient - 3rd Group - Tug Boat & Other Ships 63
5. Analysis of Correlation Coefficient 65
6. Coefficient of Multiple Determination (R2) 74
7. Statistical Parameter 77
8. Statistical Parameter 78
9. Statistical Parameter 79
10 Results of Verification of Mathematical Model Derived from
Regression Analysis
81

X
LIST OF FIGURE
Figure No Description Page
1.
Number of Ship vs Deadweight Tonnage for Cargo Ship,Fishing Vessel,
Oil Tanker, Dredger and Barge
28
2. Number of Ship vs Light Weight Displacement (Ton) for Cargo Ship,
Fishing Vessel, Oil Tanker, Dredger and Barge
29
3. Number of Ship vs Full Load Displacement (Ton) for Cargo Ship, Fishing
Vessel, Oil Tanker, Dredger and Barge
29
4. Number of Ship vs Age for Cargo Ship, Fishing Vessel, Oil Tanker,
Dredger and Barge
30
5. Number of Ship vs General Services (Days) for Cargo Ship, Fishing
Vessel, Oil Tanker, Dredger and Barge
30
6. Number of Ship vs Plate Works (Ton) for Cargo Ship, Fishing Vessel, Oil
Tanker, Dredger and Barge
31
7. Number of Ship vs Hull Cleaning & Painting (Sqm) for Cargo Ship,
Fishing Vessel, Oil Tanker, Dredger and Barge
31
8. Number of Ship vs Piping (Rm) for Cargo Ship, Fishing Vessel, Oil
Tanker, Dredger and Barge
32
9. Number of Ship vs Under Water Fittings (Nos) for Cargo Ship, Fishing
Vessel, Oil Tanker, Dredger and Barge
32
10. Number of Ship vs Above water Fitting (Nos) for Cargo Ship, Fishing
Vessel, Oil Tanker, Dredger and Barge
33
11. Number of Ship vs Machinery & Equipment (KW) for Cargo Ship,
Fishing Vessel, Oil Tanker, Dredger and Barge
33
12. Man Dayvs Full Load Displacement (Ton)for Cargo Ship, Fishing vessel,
Oil Tanker, Dredger and Barge.
34
13. Man Dayvs Hull Cleaning & Painting Works (Sqm) for Cargo Ship,
Fishing vessel, Oil Tanker, Dredger and Barge
34
14. Man Day vs Light Weight Displacement (Ton) for Cargo Ship, Fishing
vessel, Oil Tanker, Dredger and Barge.
35
15. Man Day vs Deadweight Tonnage (Ton) for Cargo Ship, Fishing vessel,
Oil Tanker, Dredger and Barge.
35
16. Man Day vs Plate Works (Ton) for Cargo Ship, Fishing vessel, Oil
Tanker, Dredger and Barge.
36
17. Man Dayvs Under Water Fiffings (Nos) for Cargo Ship, Fishing vessel,
Oil Tanker, Dredger and Barge
36
18. Man Day vs Machinery & Equipment (KW) for Cargo Ship, Fishing
vessel, Oil Tanker, Dredger and Barge.
37
19. Man Day vs Machinery & Equipment (KW) for Cargo Ship, Fishing
vessel, Oil Tanker, Dredger and Barge.
37
20. Man Day vs Age of Ship at the Time of Docking for Cargo Ship, Fishing
vessel, Oil Tanker, Dredger and Barge.
38
21. Man Day vs General Services (Days) for Cargo Ship, Fishing vessel, Oil
Tanker, Dredger and Barge.
38
XI
22. Number of Ships vs Lightweight Displacement (Ton) for Warship 39
23. Number of Ship vs Full Load Displacement (Ton) for Warship 39
24. Number of Ship vs Age of Docking for Warship 40
25. Number of Ship vs Plate works Ton for Warship 40
26. Number of Ship vs Hull Cleaning & Painting (Sqm) for Warship 41
27. Number of Ship vs Piping (Rm) for Warship 41
28. Number of Ship vs Under Water Fittings (Nos) for Warship 42
29. Number of Ship vs General Services Days for Warship 42
30. Number of Ship vs Machinery & Equipment (KW) for Warship 43
31. Number of Ship vs Above Water Fitting (Nos)for Warship 43
32. Man Dayvs Full Load Displacement (Ton)for Warship 44
33. Man Day vs Lightweight Displacement (Ton)for Warship 44
34. Man Day vs Age of Docking for Warship 45
35. Man Day vs General Services (Days)for Warship 45
36. Man Day vs Plate works (Ton) for Warship 46
37. Man Day vs Hull Cleaning & Painting (Sqm) for Warship 46
38. Man Day vs Piping (Rm) for Warship 47
39. Man Day vs Under Water Fiffings (Nos) for Warship 47
40. Man Day vs Above Water Fittings (Nos) for Warship 48
41. Man Day vs Above Water Fittings (Nos) for Warship 48
42. Number of Ship vs Lightweight Displacement (Ton) for Tug boat &
Other Ships
49
43. Number of Ship vs Full Load Displacement (Ton)for Tug boat & Other
Ships
49
44. Number of Ship vs Age of Dockingfor Tug boat & Other Ships 50
45. Number of Ship vs General Services Daysfor Tug boat & Other Ships 50
46. Number of Ship vs Plate works Tonfor Tug boat & Other Ships 51
47. Number of Ship vs Hull Cleaning & Painting Works (Sqm)for Tug boat
& Other Ships
51
48. Number of Ship vs Piping (Rm) for Tug boat & Other Ships 52
49. Number of Ship vs Under Water Fittings (Nos)for Tug boat & Other
Ships
52
50. Number of Ship vs Above Water Fittings (Nos)for Tug boat & Other
Ships
53
51. Number of Ship vs Machinery & Equipment (KW)for Tug boat & Other
Ships
53
52. Man Day vs Full Load Displacement (Ton)for Tug boat & Other Ships 54
53. Man Day vs Lightweight Displacement (Ton)for Tug boat & Other Ships 54
54. Man Day vs Age of Ship at the Time of Docking (Year)for Tug boat &
Other Ships
55
55. Man Day vs General Services (Days)for Tug boat & Other Ships 55
56. Man Day vs Plate works (Ton)for Tug boat & Other Ships 56
57. Man Day vs Hull Cleaning & Painting Works (Sqm)for Tug boat & Other
Ships
56
58. Man Day vs Piping (Rm)for Tug boat & Other Ships 57
59. Man Day vs Under Water Fittings (Nos)for Tug boat & Other Ships 57
XII
60. Man Day vs Above Water Fittings (Nos)for Tug boat & Other Ships 58
61. Man Day vs Machinery & Equipment (KW)for Tug boat & Other Ships 58
62. Manday vs Type of Ship for “Cargo Ship, Fishing vessel, Oil Tanker,
Dredger and Barge”, “Tug boat & Other Ships” and ‘Warships’
59
63. Manday vs Type of Ship for “Cargo Ship, Fishing vessel, Oil Tanker,
Dredger and Barge”, “Tug boat & Other Ships” and ‘Warships’
60
64. Manday vs Type of Ship for “Cargo Ship, Fishing vessel, Oil Tanker,
Dredger and Barge”, “Tug boat & Other Ships” and ‘Warships’
60

LIST OF APPENDICES
Appendix No Description
Appendix A. Regression Analysis Equations & Statistical Parameters for Cargo Ship,
Fishing vessel, Oil Tanker, Dredger and Barge
Appendix B. Regression Analysis Equations & Statistical Parameters for Warships
Appendix C. Regression Analysis Equations & Statistical Parameters for Tug boat &
Other Ships
Appendix D. Values of Type of Ship
Page 1 of 88
CHAPTER I
Prelude
1.1 Background
Chittagong Dry Dock Limited (CDDL) was established on the bank of river Karnaphuli
on 48 acres of land as a complementary facility to Chittagong Port Authority (CPA) to
cater for regular and emergency repair needs of national flag carrier vessels as well as
vessels touching Chittagong Port. Design and construction project of CDDL were done
with the then Yugoslav technical assistance. CDDL commercially started its operation
from July 1985. CDDL is the only dry dock in Bangladesh. Its grave dock can dock
vessels up to 22,000 DWT. Length, breadth and depth of the graving dock are 183m,
27.2m and 13.1m respectively. Besides, CDDL can perform complete renovation and
conversion works of ships and carry out medium to heavy engineering works to support
local industries.
CDDL was an enterprise of BSEC. On 23rd December 2015, CDDL was placed under
the management of Bangladesh Navy (BN) as state owned Ltd company. CDDL, being
the only dry dock of Bangladesh, is able to undertake any kind of repair works of all
types of ships belonging to public and private owners of Bangladesh as well as foreign
ships except some Panamax size ships (able to enter Panama Canal). Availability of
repair facility for all types of the said ships near Chittagong Port is vital to ensure vibrant
operation of Chittagong Port and activities of blue economy. It is noteworthy that
location of CDDL near CPA and availability of enough depth of water of Karnafully
river adjacent to CDDL qualify this yard to be a place where various types and sizes of
ships can be docked for repair. Availability of workforce and cheap labour lead to growth
of more shipyards/ship repairers in Bangladesh. As such, huge competition dictates
CDDL to come up with accurate quotations to stay competitive in the national market
particularly in respect of labour cost, which creates variation in ship repair cost.
Page 2 of 88
1.2 Requirements of Effective Labour Cost Estimation
The purpose of the study is to investigate the prevailing factors for labor cost by empirical
analysis and a comprehensive analysis to construct labor cost estimation models for ship
repair at CDDL. According to an empirical analysis, the effects of factors, such as, ship’s
age, deadweight, displacement, type of ship and various repair works for ship repair have
been confirmed. Similar kind of empirical analysis for CDDL will be analyzed in case of
those factors like ship’s age, deadweight, displacement, type of ship and different types
of ship repair works, namely general services, steel plate renewal, hull cleaning and
painting, piping, underwater fittings, above water fittings, equipment and machinery. The
comparison between the actual and estimated values of man hours for the said factors
will be made. Application of these models is likely to provide forecasting of more
accurate labor cost estimation and allow decisions to be made more accurately, thus
enhancing competitiveness and profitability.
1.3 Objectives of the Thesis
The objectives of this thesis are as follows:
i) To investigate and identify the prevailing factors for labor cost of ship
repair by empirical analysis.
ii) To verify and explore various factors involved in labor cost estimation for
ship repair at Chittagong Dry Dock Ltd by statistical analysis.
iii) To develop and construct labor cost estimation models for ship repair at
Chittagong Dry Dock Ltd by regression analysis.
Page 3 of 88
1.4 Statement of the Problem
Providing ship-repair facilities is becoming an increasingly attractive opportunity for
coastal nations with the exponential growth of number of ships calling on their ports as
international trade activities through sea is increasing. Thousands of ships enter and leave
Chittagong Port annually. On the other hand, SDG 14 of Bangladesh will entail
involvement of special purpose ships/ platforms to have full access to marine resources
and small-scale artisanal fishers of blue economy of Bangladesh by 2030. Availability of
repair facility for all types of the said ships near Chittagong Port is vital to ensure vibrant
operation of Chittagong Port and activities of blue economy. From these perspectives,
CDDL needs to exploit such ship repair opportunities. But CDDL confronts serious
competition in the national market. CDDL must acquire market information and give
accurate quotations in order to obtain ship repair orders.
The estimation of labor cost for ship repair is very important during the quotation stage.
Because, the cost of ship repair includes direct material cost, direct labor cost, direct
expense and indirect expense. The direct material share of the total ship repair cost is
55% to 60%. However, most of the direct materials are imported from foreign countries
and fluctuation in foreign exchange rates is an uncontrollable factor. On the other hand,
direct labor cost and indirect expenses which can be estimated from direct labor cost,
account for 30% to 35% of the total ship repair cost. Therefore, direct labor cost plays a
significant role in the total cost of ship repair. Generally, labor cost equals man-hours
multiplied by wage rate. So, CDDL require to eye on controlling labour cost i.e. man
hour/man day with a view to quote reasonably competitive offer for ship repair in
comparison to other ship repairers. Without investigating the prevailing factors for labour
cost at CDDL and constructing viable labour cost estimation models for ship repair at
CDDL, forecasting cost estimation and giving competitive accurate quotations for ship
repair appear to be quite cumbersome. Besides, if there is limitation in these regards, then
it will create hindrance to CDDL to exploit foreseeable huge ship repair opportunities in
Bangladesh.

Page 4 of 88
1.5 Significance
This study will allow CDDL to identify and examine the prevailing factors for labor cost
of ship repair at CDDL by statistical analysis and construct labor cost estimation models
for ship repair at CDDL. Application of these models is likely to provide forecasting of
more accurate labor cost estimation and allow decisions for ship repair to be made by
CDDL management more accurately. This will enhance competitiveness and profitability
of CDDL in the field of ship repair in comparison to other shipyards.
Page 5 of 88
CHAPTER II
Literature Review
2.1 Dry Docking Operation for a Ship for Repair
Dry or graving docks are used to enable the ship’s bottom and underwater fittings to be
inspected and worked on [1]. They normally consist of a basin dug into the shore of a
body of water and provided with a watertight gate on the waterside, used for major repairs
and overhaul of vessels [2]. When a ship is to be docked, the dry dock is flooded, and the
gate opened. After the ship is brought in, positioned properly, the gate is closed and the
dock is pumped dry, bringing the ship gradually to rest on supporting keel and side blocks
anchored to the floor [3].
2.2 Ship Repair Demand Outlook
2.2.1 Blue Economy
Sylvia Alice Earle, an American marine biologist commented, “No water, no life. No
blue, no green”. Gunter Pauli’s book, “The Blue Economy: 10 years, 100 innovations,
100 million jobs” (2010) brought the Blue Economy concept into prominence. Blue
economy is all about resources and services of ocean and seas. These are food (fish and
other sea food), renewable blue energy production from wind, wave, tidal, thermal and
biomass sources, energy (oil and gas), transportation (shipping), mineral, water, leisure
(tourism) and health (pharmaceuticals and cosmetics). Concept of blue economy as
defined by the European Commission (2012) is all economic activities related to the
oceans, seas and coasts. It also covers the closest direct and indirect supporting activities
required for functioning of these economic sectors, which can be located anywhere,
including in landlocked countries.
Page 6 of 88
2.2.2 Blue Economy - Bangladesh Perspective and Ship Repair Opportunity
Rapid economic growth coupled with a rising population is putting immense pressure on
the environment, ecology and natural resources in Bangladesh. Blue economy has opened
a new horizon for economic development of the coastal countries through utilizing sea
and marine resources at national and international level [4]. Moreover, Bangladesh is
blessed due to geographically located by the Bay of Bengal and Blue Economy is very
much suitable for Bangladesh by considering the maritime area and its connection with
the people of Bangladesh as well as its economy [5]. Bangladesh will explore blue
economy to have balanced socio-economic development while maintaining the balance
in nature and ensuring sustainability for future generations. Bangladesh will take the
opportunity to solve its problems, like shortage of energy, unemployment issue etc and
increase its GDP by exploiting resources of blue economy. Bangladesh has sovereign
rights over the living and nonliving resources of the Bay of Bengal in the Exclusive
Economic Zone within 200 nm and in the continental shelf beyond 200nm. Bangladesh
has also sovereign rights on all the living and mineral resources of the Continental Shelf
extending up to 354 nautical miles. SDG 14 of Bangladesh puts use and conservation of
the ocean and its resources into the wider sustainable development context that will entail
involvement of special purpose ships/platforms to have full access to marine resources
and small-scale artisanal fishers of blue economy of Bangladesh by 2030 [6]. So huge
fleets of artisanal fishing boats, special purpose ships/ platforms and passenger ships will
be involved to exploit sea resources like other sea food, oil and gas, mineral, health
benefit products and tourism. These huge fleets of artisanal fishing boats, special purpose
ships/ platforms and passenger ships will need repair facilities.
2.2.3 Involvement of More Ships in Sea Borne Trade
Ocean contains 80% of earth’s life. It produces more than half of the oxygen we breathe
and provides a livelihood for an estimated three billion people who depend on marine
and coastal areas, including fishing, tourism, trade, transport and energy. Market value
of marine and coastal resources is 5% of world’s GDP. 350 million jobs worth of $3
trillion are linked to ocean. Two thirds of the world’s surface is sea water and quite
Page 7 of 88
simply 80% of the world’s trading goods are carried by ships of all designs [7]. Vessels
trading the high seas simply keep the world moving. Despite the global economic crisis,
world seaborne trade has grown to 8.7 billion tonnes contributing USD 435 billion per
year to global economy and provides 14 million jobs. The fastest maritime trade growth
is between the emerging economies of South Asia, Far East and economies of China,
Japan, Africa and America. Expected container traffic will be triple by 2030. So, more
ships will be involved to cater for more container traffic. Coastal countries will get more
repair opportunities as movement of more ships will be needed for more container traffic
to cater for this growing trade.
2.2.4 Sea Borne Trade – Bangladesh Perspective and Ship Repair Prospect
Export and import value (2013-14) Bangladesh was at about USD 67 billion and 2500
foreign ships visited our ports for carrying most of these goods. Importers, exporters and
buyers paid USD 95 billion as freight and related charges to shipping companies and air
lines to carry goods in and out of Bangladesh. Only 74 registered Bangladeshi merchant
ships existed in 2014 were significantly insufficient to carry such cargo. According to
an assessment carried in 2014, considering the average import growth rate of 15.79%
(last 10 years) and export growth rate of 15.43% (last 10 years), projected freight value
for next ten years would be around USD 435 billion [8]. In order to retain parts of the
USD 435 billion in the country, over the ten years, Bangladesh must facilitate local
shipping companies to add more ships to the existing fleet, freight operators to establish
freight services including container liner services to carry goods to/from Bangladesh
using our own as well as chartered ships and freighters. At present, around 600 ships
arrive in Bangladesh per year and anchor in the ports of Chittagong and Mongla. Arrival
of huge number of ships in the sea ports of Bangladesh is very much expected to meet
the requirements of growing trade coupled with new opening of blue economy.
Therefore, prospect of ship repair order is likely to rise. So, there will be huge
competition among ship repairers to avail such ship repair orders.
2.3 Ship Repair Time and Cost

Page 8 of 88
2.3.1 Duration of Ship Repair
Repairing works refer to the category and quantity of works carried out during the
repairing time. Labor cost will vary with time of completion of these works. Flag
legislation and classification society rules require the vessel to be in a shipyard/ dry
dock/floating dock/slipway for an intermediate or special survey with an interval of 24 -
30 months and for a major classification survey at every five years. Repairing time
consists of time inside the dock (docking time) and time at the quayside (quay time).
Bottom surveys and underwater jobs, which cannot be done in afloat conditions, are
carried out during docking time. All other jobs, except underwater one, are continued
during quay time. It is noted that inaccuracy in estimating the duration of the ship
maintenance in dry dock is still common. There are three dry docking works that can be
used to classify the dry docking duration, which are propeller (underwater fittings),
washing (hull cleaning) and plate works [9]. If the estimated duration of maintenance is
too long, then shipyard becomes uncompetitive. So, inaccuracy in estimating the duration
of completing these works will lead to wrong estimation of labour cost. This will result
in preparation of inaccurate quotation, which may affect the competitiveness with that of
other shipyards.
2.3.2 Ship’s Maintenance/Repair Cost
Ship maintenance can be carried out in the ship repair yard for major routine ship
maintenance, which requires a dry dock/shipyard to maintain the underwater part of the
vessel. In the shipyard, typically 75% of the work involves routine ship maintenance, and
the remaining 25% is for damage repair and ship conversion [10]. Since major economics
stagger to get back on their feet and emerging economies try hard to adapt, trading
environment for ship managers has been extremely difficult. So it is imperative for ship
managers to have all the necessary information about ship’s operating cost, which will
allow them better planning and monitoring to enhance their performance. Therefore
operating cost of a ship have taken on a greater significance in the pursuit of shipping
business survival, with the softer targets, such as repair and maintenance, personnel and
administration taking center stage [11].

Page 9 of 88
In general, a ship‘s operating costs vary according to type, size, and age of the vessel.
Ship maintenance and operation costs include all the costs related to equipment and
materials, personnel, replacement inspection, overhaul, and repair. Ship maintenance
cost can be classified as one part of the ship’s operating costs. A case study of data
presented on a six-year-old, 75,000-ton bulk carrier, maintenance costs account for the
largest proportion of operation costs (40%) based on the sample surveyed [12]. Ship
maintenance costs can be defined as those costs incurred in the organization execution,
and control of work undertaken for safe operation of the ship. In the marine industry,
ship maintenance and ship repair can be completed in two different ways. Firstly, they
can be undertaken in the ship repair yard when the ship is due for dry docking to survey
the underwater parts and when it is due for its classification survey. Secondly,
maintenance can be conducted during the ship‘s day-to-day operations. Dry docking
repair cost is a part of the ship’s maintenance costs. For the purpose of this paper, dry
docking repair will mean both repair works carried out in dry dock as well as in quay
immediately after undocking from dry dock.
2.3.3 Cost Estimation
In order to properly develop the bid, shipyard management needs to know the level of
accuracy of the cost estimate or level of uncertainty of the estimate. Uncertainty may be
quantified either through the application of margin or the provision of confidence levels.
Instead of margins, cost estimating approach uses confidence levels. Reason being,
confidence levels provide the ship repairer with quantified insight into the accuracy of
the estimate. Attention may be focused to increase confidence levels on certain parts of
the estimate having low confidence levels with a view to increase the accuracy of the
estimate. Generally, confidence levels are assigned to the engineering quantities (e.g.,
reflecting a 90% confidence that the weight of structure is correct as reported) and also
to the cost estimating relationships (e.g., reflecting 95% confidence in the estimated cost
per weight factor). The two confidence levels are multiplied to arrive at an overall
confidence level (e.g., 90% x 95% = 86%) [13]. Ability to estimate ship repair cost as
accurately as possible is necessary for the commercial success of a shipyard. Shipyard

Page 10 of 88
will be out of the competitive range if an estimate is too high. On the contrary, too low
an estimate will result in a financial loss.
2.3.4 Estimated Labour Cost
In order to best serve the shipyard needs, the cost estimating approach follows the above
mentioned convention by producing estimates for material and labor [14]. Ship’s repair
and maintenance cost takes center stage of the ship’s operating cost [15]. The cost of ship
repair includes direct material cost, direct labor cost, direct expense and indirect expense.
The direct material share of the total ship repair cost is 55% to 60%. However, most of
the direct materials are imported from foreign countries and fluctuation in foreign
exchange rates is an uncontrollable factor. On the other hand, direct labor cost and
indirect expenses which can be estimated from direct labor cost, account for 30% to 35%
of the total ship repair cost [16]. Therefore, direct labor cost plays a significant role in
the total cost of ship repair. Generally, labor cost equals man-hours multiplied by wage
rate. As the ship repair industry is largely labour-intensive, the most important challenge
is that of labour. Ship repair industry is guided by labour legislation and trends, such as
the basic conditions of employment, skills development, etc, that exist in the country.
These conditions needs to follow the conditions and skills levels of labour of competitive
ports like Singapore, as the input cost of labour is one of the most important factors
influencing the competitiveness of a country's ship repair facilities [17]. The estimation
of labor cost for ship repair is very important during the quotation stage. Labour man-
hours will vary for similar jobs carried out under different conditions, such as world
location, working conditions, environment, type of labour, availability of back-up labour,
etc. For example, the output of a worker for a particular work carried out in a hot and
humid country can fall to 50% than that of the same worker working in soothing climate
in a separate country [18]. However, there might be deviation between the actual labor
cost and the estimated labor cost.
2.4 Definitions

Page 11 of 88
2.4.1 Displacement
Displacement or displacement tonnage of a ship is its weight based on the amount of
water its hull displaces at varying loads. Loaded displacement is the weight of the ship
including cargo, passengers, fuel, water, stores, dunnage and such other items necessary
for use on a voyage [19]. These bring the ship down to its "load draft", colloquially
known as the ‘waterline’.
2.4.2 Full Load Displacement
Full load displacement and loaded displacement have almost identical definitions. Full
load displacement is defined as the displacement of a vessel when floating at its greatest
allowable draft (designated by its ‘waterline’). Warships have arbitrary full load
condition established.
2.4.3 Lightweight Displacement
Lightship or lightweight measures the actual weight of the ship with no fuel,
passengers, cargo, water, crew, provisions and the like on board.
2.4.4 Deadweight Tonnage
Deadweight tonnage (also known as deadweight or, DWT) is a measure of how
much weight a ship can carry and does not include the weight of the ship itself. DWT is
the sum of the weights of cargo, fuel, water, provisions, passengers and crew. DWT is
the displacement at any loaded condition minus the lightship weight [20].
Page 12 of 88
CHAPTER III
SWOT Analysis
3.1 Strength and Opportunity for CDDL
3.1.1 Strength
CDDL has strategic geographical location. It is located very near to Chittagong Port. It
is only 3nm from the sea and has direct access to sea. It is situated on the bank of
Karnafuly river where depth of water is 10m. Its connectivity (by sea land and air) with
other places of Bangladesh and other countries is smooth and trouble free. International
trade activities through sea is increasing. Providing ship-repair facilities is becoming an
increasingly attractive opportunity for coastal nations like Bangladesh with the
exponential growth of number of ships calling on their ports as international trade
activities through sea is increasing [21]. At present, thousands of ships enter and leave
Chittagong Port annually. Availability of repair facility for all types of the said ships near
Chittagong Port is vital to ensure vibrant operation of Chittagong Port and activities of
blue economy now and in near future. Unlike shipbuilding or shipping, ship repair yards
generally have continuous and consistent flow of business. Only CDDL has graving dock
with associated facilities in Bangladesh. Mentionable, graving dock is the only platform
where all kinds of repair of bigger sized ships can be carried out [22]. From this point of
view, CDDL can repair all types of ships.
3.1.2 Weakness
Since CDDL has only one graving dock, so it puts limitation on CDDL to carry out repair
and construction of ships at the same time as construction takes prolonged and more time
than that of repair. Scope of construction of ships at only one graving dock is very much
limited as ships are repaired almost continuously throughout the year. Besides, total
number of ships expected to be repaired to maintain yearly turnover counts less than that
is required. So, CDDL exploits other industrial opportunity and perform medium to
Page 13 of 88
heavy engineering works to support local industries with a view to increase turnover and
profit margin after meeting all the expenditures of man and material.
3.1.3 Opportunity
CDDL has plenty of space to strengthen its infrastructure. At present, Bangladesh Navy
looks after the management of CDDL. Large skill base is available for providing suitable
manpower for conventional shipbuilding as well as ship repair. Availability of engineers,
technicians and workers (welder, fitter, carpenter, foundry man etc.) are praiseworthy in
Bangladesh. Labour is also cheap. These factors will help CDDL in ship repair business.
Resources in land is not enough compared to increasing population in Bangladesh.
Economy will be affected if blue economy is not exploited in near future. At present,
there is no purpose oriented ships in Bangladesh to exploit blue economy. ‘Agreement
on Coastal Shipping 2015’, between India & Bangladesh will facilitate the use of vessels
of River Sea Vessel (RSV) category for Indo-Bangladesh coastal shipping [23]. These
two countries are also holding Shipping Secretary-level talks on issues relating to the
memorandum of understanding on passenger and cruise vessel movement. CDDL can
repair these above stated ships in future.
China and India that were doing ship repairs earlier have graduated to more lucrative
shipbuilding [24]. A trend of ship repair business shifting towards third world nations
has started to be visible on the horizon. From these perspectives, CDDL needs to exploit
such ship repair opportunities. Generally, the dock and its associated workshops play a
significant role in the employment of local shipwrights and tradesmen and provides a
thriving centre maintaining the local ship building industry [25]. Ship repairers of
Bangladesh, in particular CDDL, will be able to take advantage of its availability of local
workforce and cheap labour in Bangladesh.
Page 14 of 88
3.1.4 Threat
If ship repair/ shipbuilding industry is not recognized by government as an important
strategic industry and not benefitted subsequently from subsidy, tax concessions and tax
holidays, it is difficult for it to grow and compete with shipbuilding giants like China,
South Korea and the new entrant Vietnam.
China, South Korea, India and Vietnam may capture upcoming Indo-Bangladesh coastal
shipping market and purpose oriented ships to exploit blue economy of Bangladesh if
CDDL does not enhance its capacity.
Very less localization of most ship parts and unavailability of industrial base for
manufacture of machinery/ equipment of ships in Bangladesh will decrease profit margin
of CDDL in ship repair/ shipbuilding venture. Hence, the same may lead to loss in
competition with the shipyards of China, South Korea, India and Vietnam in capturing
ship repair/ shipbuilding projects.
3.2 Challenges for CDDL
For the last few years, there is rapid growth of number of local shipyards in Bangladesh.
According to Shipyard Statistics, 2012, out of 124 shipyards in Bangladesh registered
with the Department of Shipping, approximately 70% are located in and around Dhaka
and Narayangong alongside of the river bank of Buriganga, Shitalakha and Meghna, 20%
shipyards of Chittagong division are located alongside of Karnaphuli river, 6% are
located along the bank of Poshur river of Khulna division and remaining 4% are located
in Barishal division. Almost all inland/ coastal/ bay crossing ships are constructed and
repaired locally in these local shipyards. Most of these yards are not equipped with
standard facilities, equipment and machinery of a shipyard. As a matter of fact, there are
some ship repairers, who purchase some land adjacent to the bank of the river and build
slipway with rails to take ship on land beside river and then carry out repair. Private
entrepreneurs always take opportunity to repair their ships from these types of ship
repairers with much cheaper rates than that of a standard shipyard/dockyard. Besides,

Page 15 of 88
there are also some government owned as well as private shipyards in the country. Karl
Fredrik Skorge Hansen pointed out that now-a-days ship owners maintains software,
which stores previous cost and estimates data of various shipyards regarding ship repair
allowing them to verify the quotations given by the shipyards and compare with other
yards [26]. In fact, ship repair revenue generation is more predictable, but often prone to
pulls and pressures of market forces and cyclic change. As such, CDDL confronts serious
competition from the said ship owners/ ship repairers in the national market. CDDL must
acquire market information and give accurate quotations in order to obtain ship repair
orders.
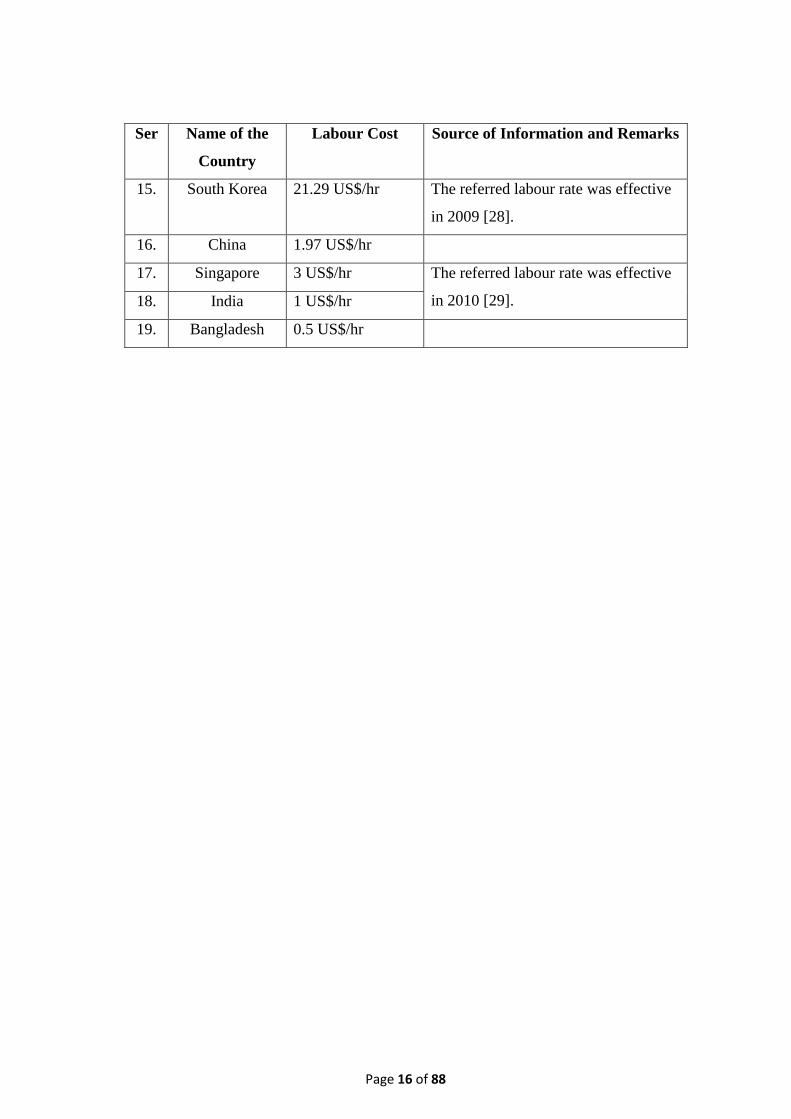
3.3 Comparison of Labour Costs among Various Countries
Table 1 - Labour Costs of Various Countries
Ser Name of the
Country
Labour Cost Source of Information and Remarks
1. USA 23 €/hr According to Drewry Shipping
Consultants Ltd, the referred labour
rate from serial No. 1 to 10 was
effective in 1996 and the same from
serial No. 11 to 14 was effective in
1999 [27].
2. Germany 32 €/hr
3. France 31 €/hr
4. Netherland More than 22 €/hr
5. Finland More than 22 €/hr
6. Italy 23 €/hr
7. Greece 14 €/hr
8. Croatia 12 €/hr
9. Japan More than 22 €/hr
10. Poland 6 €/hr
11. Slovenia ca. 9 €/hr
12. Hungary Over 4 €/hr
13. Czech Republic ca.5 €/hr
14. Estonia 2 €/hr
Page 16 of 88
Ser Name of the
Country
Labour Cost Source of Information and Remarks
15. South Korea 21.29 US$/hr The referred labour rate was effective
in 2009 [28].
16. China 1.97 US$/hr
17. Singapore 3 US$/hr The referred labour rate was effective
in 2010 [29]. 18. India 1 US$/hr
19. Bangladesh 0.5 US$/hr
Page 17 of 88
CHAPTER IV
Hypothesis
4.1 Age
Age of a ship is calculated from the date on which the ship is delivered by the building
shipyard to her owners. With the elapse of time, older ships experience higher wear than
newer ships. Moreover, flag and class have higher criteria for surveys of older ships. As
such, older ships demand more extensive repair and maintenance than younger ships.
Therefore, the first hypothesis is that the age of the ship is positively associated with the
extent of repair cost.
4.2 Size
A big size ship means greater dimensions with larger machinery and equipment. This
analogy can be translated into the fact that bigger ships need longer repairing time and
more man-days for repairing/maintenance works than that of smaller ones. The size of a
ship can be defined either by its dimensions (length, breadth and depth) or by its capacity
(gross tonnage, net tonnage, deadweight, full load displacement, lightweight etc). Thus,
the second hypothesis is that the size of a ship has a positive impact also on repairing
labour (and hence labour cost) independently and the relation is assumed to be linearly
dependent.
For simplicity, cargo ships, oil tankers, fishing trawlers and dredgers are classed in to
same group. Since all these vessels are carrying cargo of different sort, so it is reasonable
that their sizes be stated by deadweight tonnages as per the definition of the same. Strictly
speaking, their sizes may also either be stated by full load displacement or lightweight
displacement.
Warship doesn’t carry cargo. As such, stating size of the same by deadweight tonnage
may not be fitting. Logically, it will be appropriate to nominate size of warship either

Page 18 of 88
full load displacement or lightweight displacement. The same correlation is applicable to
tugs and other ships (pilot boat, anchor boat etc).
4.3 Type
The type of ship mainly refers basically to the category of ship defined by the purpose of
the ship or the duty it carries out. In this paper, there are different types of ships, such as,
cargo ship, oil tanker, fishing trawler, dredger, tug, anchor boat, pilot vessel and warship.
The configurations of ships vary widely including machinery and equipment according
to the type of ships. There are inherent differences among machinery and equipment,
piping arrangement, tank arrangement, geometrical configurations, cargo handling
facilities, etc amongst different types of ships. This factor leads to a logical thinking that
the different types of ships require different repairing time (days) and labour (man-days).
Therefore, the third hypothesis is ship repairing labour is a function of the type of a ship
and considered to be linearly associated.
Although, cargo ships, oil tankers, fishing trawlers and dredgers are classed in to same
group, yet these vessels will differ in type because of different kinds of cargo they carry.
On the other hand, there are also different types of warships, such as, frigate, corvette,
offshore patrol vessel, minesweeper, auxiliary ship etc.
4.4 Scope of Repairing Works
Repairing works refer to the category and volume of works carried out during the
repairing period. In this paper, mainly, seven areas (category) are considered such as,
general service works, plate works, hull cleaning & painting works, piping works, above
water fitting works, underwater fitting works and machinery & equipment works. It is
natural that higher volume of repairing works requires more repairing time and labour.
So, the fourth assumption is that the volume of repairing works has a positive impact on
the repairing labour (man-days) independently and the relation is assumed to be linearly
dependent.

Page 19 of 88
Since labor cost equals man hours (man-days) multiplied by wage rate (USD/man-day),
man-days will be used as a dependent variable instead of labor cost.
Page 20 of 88
CHAPTER V
Procedure/ Methodology
5.1 Statistical Equations
According to an empirical analysis, Arun Kr Dev and Makaraksha Saha opined that
theoretically ship repairing labour cost is a function of age, deadweight, type of ships and
ship repairing works [30]. It has been highlighted that ships’ age, deadweight, type and
scope/quantity of ship repairing works are directly, positively and linearly associated
with the corresponding labour (man-days). Similar kind of empirical analysis for CDDL
has been explored and verified in case of the factors (independent variable) like ship’s
age, deadweight, displacement, type of ship and different types of ship repair works,
namely general services works, steel plate renewal works, hull cleaning and painting
works, piping works, underwater fittings works, above water fittings works and
equipment & machinery works by statistical analysis through finding correlation
coefficients between dependent (labour cost) and each independent variable.
As such, ship repairing labour (dependent variable) is a linear function of the independent
variables, namely, age, deadweight/full load displacement/ lightweight displacement,
type and scope of repairing works (independent variables). Mathematically, the above
assumptions can be expressed in the form of equation, y = mx +c, which the form
equations 1-10 for ship repairing labour and the said independent variables as follows:
LC1 = y1 = f (x1) = f (D) = a1 + b1 * D ………………………………………. (1)
LC2 = y2 = f (x2) = f (A) = a2 + b2 * A ………………………………………. (2)
LC3 = y3 = f (x3) = f (T) = a3 + b3 * T …………………………………....…. (3)
LC4 = y4 = f (x4) = f (GS) = a4 + b4 * GS …………………………………....... (4)
LC5 = y5 = f (x5) = f (PL) = a5 + b5 * PL.……………………………..……… (5)
LC6 = y6 = f (x6) = f (HCP) = a6 + b6 * HCP …… …………………..……..... (6)
LC7 = y7 = f (x7) = f (P) = a7 + b7 * P…….…………………………………… (7)
LC8 = y8 = f (x8) = f (UWF) = a8 + b8 * UWF …… ……..………………….... (8)
Page 21 of 88
LC9 = y9 = f (x9) = f (AWF) = a9 + b9 * AWF ……… ………………..….…... (9)
LC10 = y10 = f (x10) = f (ME) = a10 + b10 * ME … …………………………… (10)
Where,
LC = y = Ship repairing labour cost (expressed in man-days as dependent variable)
D = x1 = Deadweight/ Full Load Displacement/ Lightweight Displacement of a ship
(tonnes)
A = x2 = Age of a ship (years)
T = x3 = Value for Type of ship
GS = x4 = General Service works
PL = x5 = Plate Works
HCP = x6 = Hull Cleaning & Painting works
P = x7 = Piping works
UWF = x8 = Underwater Fitting works
AWF = x9 = Above Water Fitting works
ME = x10 = Machinery & Equipment works
5.2 Model Construction
Purpose of forecasting is to calculate and offer the best available basis for the
management to predict future events or conditions and understand the implications for
alternative courses of action (Milne 1975). Forecasting estimated labor cost allow
shipyard to assess its competitive edge in the ship repair market. There are three types of
forecasting methods, namely, qualitative techniques, time series analysis and projection,
and casual models [31]. Qualitative techniques may or may not take the past into
consideration and use qualitative data (expert opinion, for example) and information
about special events. This deals principally with methods of forecasting the broad context
of the future, including societal alternatives and patterns of values on which normative
judgments rest [32]. Time series analysis and projection focuses exclusively on pattern
change and thus depends on fully on historical data. Casual models reflect past and use
highly refined and specific information about relations between systems elements.
Casual models are powerful enough to take special events formally into account. The
Page 22 of 88
process by which labor cost is estimated are indeed numerous, including operational
analysis, craft analysis, the use of cost returns, unit labor rates, and the empirical formula
method. Since labor cost for ship repair may be affected by the factors, like age,
deadweight and type of ship as well as repairing works of hull steel weight, piping,
coating, structural fittings, machinery and equipment as stated above, so labor cost can
be expressed as a function of these factors. As there is casual relationship between them
as explained above and hence multiple regressions can be used to construct a labor cost
estimation model. Regression coefficients can be found out by applying “Method of least
squares” in regression analysis, and IBM SPSS statistics software is adopted.
The model is constructed as follows. First, the independent variables that affect labor
cost for ship repair are selected. Then, the relevant data for the dependent and
independent variables are collected, finally, the multiple regression model is constructed
for each ship group and the parameters are estimated. The regression equation is
constructed for estimating the quantitative relations between labor cost and other
independent variables for each type of ship. If the model passes the test and meets the
practical considerations, CDDL may adopt it. Owing to the high variety and low volume
characteristics of the ship repair industry, the observation data for each type of ship are
quite different. From 2002 to 2019, there are 43 sets for fishing vessel, 30 sets for oil
tanker, 51 sets for multipurpose cargo ship, 40 sets for warship, 11 sets for dredger/barge
and 15 sets for tugboat selected to construct model for each ship group.
5.3 Collection of Data and Methodology
5.3.1 Collection of Sample Data
43 sets for fishing vessel, 30 sets for oil tanker, 51 sets for multipurpose cargo ship, 40
sets for warship, 11 sets for dredger/barge and 15 sets for tugboat docked and repaired at
CDDL during the period from 2002 to 2019 were selected. Data of their repairing labour,
age, deadweight, type of ship and repairing scopes were collected from CDDL, gathered
and used in order to develop the ship repairing labour cost function and verify the
assumptions.

Page 23 of 88
5.3.2 Methodology
Since individually the independent variables are linearly associated with the dependent
variable as per initial assumptions, the following function of the linear equation is used
to establish the relationship between the ship repairing labour (man-days) and its
independent variables:
LCrepair = f (D, A, T, GS, PL, HCP, P, AWF, UWF, ME)
Where,
LCrepair is expressed in Ship repairing labour (man-days). These are the total number of
men utilized for repairing a ship. It is calculated by adding the number of men engaged
each day for ship repair.
D is Deadweight/Full Load Displacement/ Lightweight Displacement of a ship (ton).
A is Age of a ship (years) at the time of docking. The age of a ship is calculated from the
date of delivery of the ship by the builder to its owner up to the time of docking.
T is Type of ships like the fishing vessel, cargo vessel, oil tanker, barge, frigate, corvette,
offshore patrol vessel, minesweeper, patrol craft, tug, pilot vessel etc.
GS is quantity of general service works include docking, undocking, berth preparation,
mooring and unmooring, fire watchman, security watchman, fire main line, fire line
connection & disconnection, electrical shore power connection & disconnection, crane
services, garbage disposal and temporary lighting. It is measured in Days.
PL is quantity of metal plate renewal works. It includes cutting old metal plates and fitting
& welding of new metal plates. It is measured in terms of weight (ton).
HCP is quantity of hull cleaning & painting works. It covers cleaning by light and hard
scrapping, hose down with fresh water, sand blasting, tank cleaning, painting, marking
Page 24 of 88
by painting (draft, plimsoll marks, ship & port name). It is measured in terms of area
(m2).
P is quantity of piping works. It consists of works of cargo pipeline, fire pipeline, fuel
pipeline, oil pipeline, fresh water pipeline, sea water pipeline and air pipeline. It is
measured in terms of running length (rm).
AWF is quantity of above water fitting works. It comprises works of hatch cover,
manhole cover, mooring eye, bollard, rubber fender, armaments, equipment & sensors
etc. Its quantity is measured in number.
UWF is quantity of above water fitting works. It encompasses works of zinc anode
renewal, sea chests opening & refitting, rope guard, propeller shaft, rudder unshipping &
refitting, drain plug and sea valve. Its quantity is measured in number.
ME is quantity of machinery and equipment works. It includes works of engine
repowering, overhauling of generators, motors, compressors etc. It is measured in kW.
5.3.3 Multiple Linear Regression Analysis
Regression analysis method is a mathematical procedure to establish mathematical
relationship between dependent and independent variables using the past data the
relationship. In simple linear regression analysis, the dependent variable is predicted
against a single independent variable, whereas multiple linear regression analysis
determines dependent variable against a set of independent variables (involving more
than one independent variable).
In this thesis, following multiple linear regression model is chosen to represent the
relationship expressed in equation (11).
LCrepair = b0 +b1*D + b2 *A +b3 *T +b4 *GS + b5
*PL+b6*HCP+b7*P+b8*UWF+b9*AWF+b10*ME ….. ……………………. (11)
Page 25 of 88
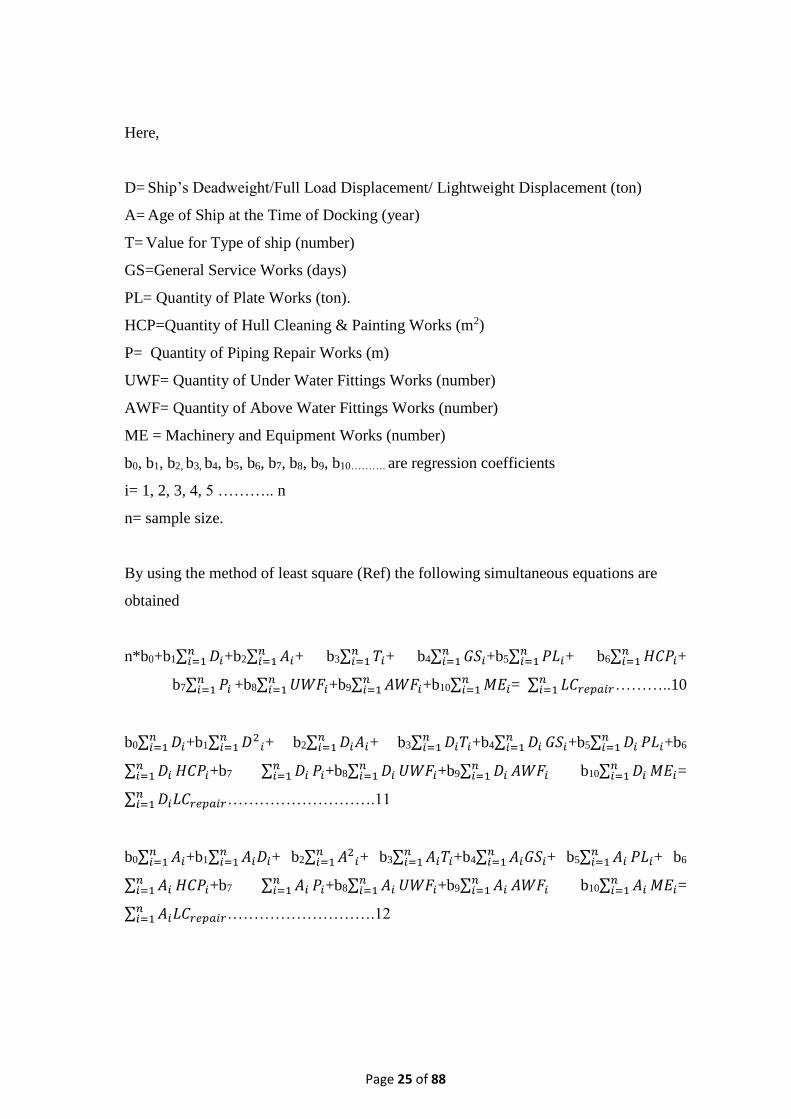
Here,
D= Ship’s Deadweight/Full Load Displacement/ Lightweight Displacement (ton)
A= Age of Ship at the Time of Docking (year)
T= Value for Type of ship (number)
GS=General Service Works (days)
PL= Quantity of Plate Works (ton).
HCP=Quantity of Hull Cleaning & Painting Works (m2)
P= Quantity of Piping Repair Works (m)
UWF= Quantity of Under Water Fittings Works (number)
AWF= Quantity of Above Water Fittings Works (number)
ME = Machinery and Equipment Works (number)
b0, b1, b2, b3, b4, b5, b6, b7, b8, b9, b10………. are regression coefficients
i= 1, 2, 3, 4, 5 ……….. n
n= sample size.
By using the method of least square (Ref) the following simultaneous equations are
obtained
n*b0+b1∑ 𝐷𝑖𝑛𝑖=1 +b2∑ 𝐴𝑖
𝑛𝑖=1 + b3∑ 𝑇𝑖
𝑛𝑖=1 + b4∑ 𝐺𝑆𝑖
𝑛𝑖=1 +b5∑ 𝑃𝐿𝑖
𝑛𝑖=1 + b6∑ 𝐻𝐶𝑃𝑖
𝑛𝑖=1 +
b7∑ 𝑃𝑖𝑛𝑖=1 +b8∑ 𝑈𝑊𝐹𝑖
𝑛𝑖=1 +b9∑ 𝐴𝑊𝐹𝑖
𝑛𝑖=1 +b10∑ 𝑀𝐸𝑖
𝑛𝑖=1 = ∑ 𝐿𝐶𝑟𝑒𝑝𝑎𝑖𝑟
𝑛𝑖=1 ………..10
b0∑ 𝐷𝑖𝑛𝑖=1 +b1∑ 𝐷2
𝑖𝑛𝑖=1 + b2∑ 𝐷𝑖𝐴𝑖
𝑛𝑖=1 + b3∑ 𝐷𝑖𝑇𝑖
𝑛𝑖=1 +b4∑ 𝐷𝑖 𝐺𝑆𝑖
𝑛𝑖=1 +b5∑ 𝐷𝑖
𝑛𝑖=1 𝑃𝐿𝑖+b6
∑ 𝐷𝑖𝑛𝑖=1 𝐻𝐶𝑃𝑖+b7 ∑ 𝐷𝑖
𝑛𝑖=1 𝑃𝑖+b8∑ 𝐷𝑖
𝑛𝑖=1 𝑈𝑊𝐹𝑖+b9∑ 𝐷𝑖
𝑛𝑖=1 𝐴𝑊𝐹𝑖 b10∑ 𝐷𝑖
𝑛𝑖=1 𝑀𝐸𝑖=
∑ 𝐷𝑖𝐿𝐶𝑟𝑒𝑝𝑎𝑖𝑟𝑛𝑖=1 ……………………….11
b0∑ 𝐴𝑖𝑛𝑖=1 +b1∑ 𝐴𝑖𝐷𝑖
𝑛𝑖=1 + b2∑ 𝐴2
𝑖𝑛𝑖=1 + b3∑ 𝐴𝑖𝑇𝑖
𝑛𝑖=1 +b4∑ 𝐴𝑖𝐺𝑆𝑖
𝑛𝑖=1 + b5∑ 𝐴𝑖
𝑛𝑖=1 𝑃𝐿𝑖+ b6
∑ 𝐴𝑖𝑛𝑖=1 𝐻𝐶𝑃𝑖+b7 ∑ 𝐴𝑖
𝑛𝑖=1 𝑃𝑖+b8∑ 𝐴𝑖
𝑛𝑖=1 𝑈𝑊𝐹𝑖+b9∑ 𝐴𝑖
𝑛𝑖=1 𝐴𝑊𝐹𝑖 b10∑ 𝐴𝑖
𝑛𝑖=1 𝑀𝐸𝑖=
∑ 𝐴𝑖𝐿𝐶𝑟𝑒𝑝𝑎𝑖𝑟𝑛𝑖=1 ……………………….12
Page 26 of 88
b0∑ 𝑇𝑖𝑛𝑖=1 +b1∑ 𝑇𝑖𝐷𝑖
𝑛𝑖=1 + b2∑ 𝑇𝑖𝐴𝑖
𝑛𝑖=1 + b3∑ 𝑇2
𝑖𝑛𝑖=1 +b4∑ 𝑇𝑖𝐺𝑆𝑖
𝑛𝑖=1 + b5∑ 𝑇𝑖
𝑛𝑖=1 𝑃𝐿𝑖+ b6
∑ 𝑇𝑖𝑛𝑖=1 𝐻𝐶𝑃𝑖+b7 ∑ 𝑇𝑖
𝑛𝑖=1 𝑃𝑖+b8∑ 𝑇𝑖
𝑛𝑖=1 𝑈𝑊𝐹𝑖+b9∑ 𝑇𝑖
𝑛𝑖=1 𝐴𝑊𝐹𝑖 b10∑ 𝑇𝑖
𝑛𝑖=1 𝑀𝐸𝑖=
∑ 𝑇𝑖𝐿𝐶𝑟𝑒𝑝𝑎𝑖𝑟𝑛𝑖=1 ………………………….13
b0∑ 𝐺𝑆𝑖𝑛𝑖=1 +b1∑ 𝐺𝑆𝑖𝐷𝑖
𝑛𝑖=1 + b2∑ 𝐺𝑆𝑖𝐴𝑖
𝑛𝑖=1 + b3∑ 𝐺𝑆𝑖𝑇𝑖
𝑛𝑖=1 +b4∑ 𝐺𝑆2
𝑖𝑛𝑖=1 + b5∑ 𝐺𝑆𝑖
𝑛𝑖=1 𝑃𝑊𝑖+
b6 ∑ 𝐺𝑆𝑖𝑛𝑖=1 𝐻𝐶𝑃𝑖+b7 ∑ 𝐺𝑆𝑖
𝑛𝑖=1 𝑃𝑖+b8∑ 𝐺𝑆𝑖
𝑛𝑖=1 𝑈𝑊𝐹𝑖+b9∑ 𝐺𝑆𝑖
𝑛𝑖=1 𝐴𝑊𝐹𝑖 b10∑ 𝐺𝑆𝑖
𝑛𝑖=1 𝑀𝐸𝑖=
∑ 𝐺𝑆𝑖𝐿𝐶𝑟𝑒𝑝𝑎𝑖𝑟𝑛𝑖=1 ……………………………….14
b0∑ 𝑃𝐿𝑖𝑛𝑖=1 +b1∑ 𝑃𝐿𝑖𝐷𝑖
𝑛𝑖=1 + b2∑ 𝑃𝐿𝑖𝐴𝑖
𝑛𝑖=1 + b3∑ 𝑃𝐿𝑖𝑇𝑖
𝑛𝑖=1 +b4∑ 𝑃𝐿𝑖𝐺𝑆𝑖
𝑛𝑖=1 + b5∑ 𝑃𝐿2
𝑖𝑛𝑖=1 +
b6 ∑ 𝑃𝐿𝑖𝑛𝑖=1 𝐻𝐶𝑃𝑖+b7 ∑ 𝑃𝐿𝑖
𝑛𝑖=1 𝑃𝑖+b8∑ 𝑃𝐿𝑖
𝑛𝑖=1 𝑈𝑊𝐹𝑖+b9∑ 𝑃𝐿𝑖
𝑛𝑖=1 𝐴𝑊𝐹𝑖
b10∑ 𝑃𝐿𝑖𝑛𝑖=1 𝑀𝐸𝑖= ∑ 𝑃𝐿𝑖𝐿𝐶𝑟𝑒𝑝𝑎𝑖𝑟
𝑛𝑖=1 ……………………………….15
b0∑ 𝐻𝐶𝑃𝑖𝑛𝑖=1 +b1∑ 𝐻𝐶𝑃𝑖𝐷𝑖
𝑛𝑖=1 + b2∑ 𝐻𝐶𝑃𝑖𝐴𝑖
𝑛𝑖=1 + b3∑ 𝐻𝐶𝑃𝑖𝑇𝑖
𝑛𝑖=1 +b4∑ 𝐻𝐶𝑃𝑖𝐺𝑆𝑖
𝑛𝑖=1 +
b5∑ 𝐻𝐶𝑃𝑖𝑃𝐿𝑖𝑛𝑖=1 + b6 ∑ 𝐻𝐶𝑃2
𝑖𝑛𝑖=1 +b7
∑ 𝐻𝐶𝑃𝑖𝑛𝑖=1 𝑃𝑖+b8∑ 𝐻𝐶𝑃𝑖
𝑛𝑖=1 𝑈𝑊𝐹𝑖+b9∑ 𝐻𝐶𝑃𝑖
𝑛𝑖=1 𝐴𝑊𝐹𝑖 b10∑ 𝐻𝐶𝑃𝑖
𝑛𝑖=1 𝑀𝐸𝑖=
∑ 𝐻𝐶𝑃𝑖𝐿𝐶𝑟𝑒𝑝𝑎𝑖𝑟𝑛𝑖=1 ……………………………….16
b0∑ 𝑃𝑖𝑛𝑖=1 +b1∑ 𝑃𝑖𝐷𝑖
𝑛𝑖=1 + b2∑ 𝑃𝑖𝐴𝑖
𝑛𝑖=1 + b3∑ 𝑃𝑖𝑇𝑖
𝑛𝑖=1 +b4∑ 𝑃𝑖𝐺𝑆𝑖
𝑛𝑖=1 + b5∑ 𝑃𝑖𝑃𝐿𝑖
𝑛𝑖=1 + b6
∑ 𝑃𝑖𝐻𝐶𝑃𝑖𝑛𝑖=1 +b7 ∑ 𝑃2
𝑖𝑛𝑖=1 +b8∑ 𝑃𝑖
𝑛𝑖=1 𝑈𝑊𝐹𝑖+b9∑ 𝑃𝑖
𝑛𝑖=1 𝐴𝑊𝐹𝑖 b10∑ 𝑃𝑖
𝑛𝑖=1 𝑀𝐸𝑖=
∑ 𝑃𝑖𝐿𝐶𝑟𝑒𝑝𝑎𝑖𝑟𝑛𝑖=1 ……………………………….17
b0∑ 𝑈𝑊𝐹𝑖𝑛𝑖=1 +b1∑ 𝑈𝑊𝐹𝑖𝐷𝑖
𝑛𝑖=1 + b2∑ 𝑈𝑊𝐹𝑖𝐴𝑖
𝑛𝑖=1 + b3∑ 𝑈𝑊𝐹𝑖𝑇𝑖
𝑛𝑖=1 +b4∑ 𝑈𝑊𝐹𝑖𝐺𝑆𝑖
𝑛𝑖=1 +
b5∑ 𝑈𝑊𝐹𝑖𝑃𝐿𝑖𝑛𝑖=1 + b6 ∑ 𝑈𝑊𝐹𝑖𝐻𝐶𝑃𝑖
𝑛𝑖=1 +b7
∑ 𝑈𝑊𝐹𝑖𝑃𝑖𝑛𝑖=1 +b8∑ 𝑈𝑊𝐹2
𝑖𝑛𝑖=1 +b9∑ 𝑈𝑊𝐹𝑖
𝑛𝑖=1 𝐴𝑊𝐹𝑖 b10∑ 𝑈𝑊𝐹𝑖
𝑛𝑖=1 𝑀𝐸𝑖=
∑ 𝑈𝑊𝐹𝑖𝐿𝐶𝑟𝑒𝑝𝑎𝑖𝑟𝑛𝑖=1 ……………………………….18
b0∑ 𝐴𝑊𝐹𝑖𝑛𝑖=1 +b1∑ 𝐴𝑊𝐹𝑖𝐷𝑖
𝑛𝑖=1 + b2∑ 𝐴𝑊𝐹𝑖𝐴𝑖
𝑛𝑖=1 + b3∑ 𝐴𝑊𝐹𝑖𝑇𝑡𝑖
𝑛𝑖=1 +b4∑ 𝐴𝑊𝐹𝑖𝐺𝑆𝑖
𝑛𝑖=1 +
b5∑ 𝐴𝑊𝐹𝑖𝑃𝐿𝑖𝑛𝑖=1 + b6 ∑ 𝐴𝑊𝐹𝑖𝐻𝐶𝑃𝑖
𝑛𝑖=1 +b7
∑ 𝐴𝑊𝐹𝑖𝑃𝑖𝑛𝑖=1 +b8∑ 𝐴𝑊𝐹𝑖𝑈𝑊𝐹𝑖
𝑛𝑖=1 +b9∑ 𝐴𝑊𝐹2
𝑖𝑛𝑖=1 b10∑ 𝐴𝑊𝐹𝑖
𝑛𝑖=1 𝑀𝐸𝑖=
∑ 𝐴𝑊𝐹𝑖𝐿𝐶𝑟𝑒𝑝𝑎𝑖𝑟𝑛𝑖=1 ……………………………….19
Page 27 of 88
b0∑ 𝑀𝐸𝑖𝑛𝑖=1 +b1∑ 𝑀𝐸𝑖𝐷𝑖
𝑛𝑖=1 + b2∑ 𝑀𝐸𝑖𝐴𝑖
𝑛𝑖=1 + b3∑ 𝑀𝐸𝑖𝑇𝑖
𝑛𝑖=1 +b4∑ 𝑀𝐸𝑖𝐺𝑆𝑖
𝑛𝑖=1 +
b5∑ 𝑀𝐸𝑖𝑃𝐿𝑖𝑛𝑖=1 + b6 ∑ 𝑀𝐸𝑖𝐻𝐶𝑃𝑖
𝑛𝑖=1 +b7 ∑ 𝑀𝐸𝑖𝑃𝑖
𝑛𝑖=1 +b8∑ 𝑀𝐸𝑖𝑈𝑊𝐹𝑖
𝑛𝑖=1 +b9∑ 𝑀𝐸𝑖𝐴𝑊𝐹𝑖
𝑛𝑖=1
b10∑ 𝑀𝐸2𝑖
𝑛𝑖=1 = ∑ 𝑀𝐸𝑖𝐿𝐶𝑟𝑒𝑝𝑎𝑖𝑟
𝑛𝑖=1 ……………………………….20
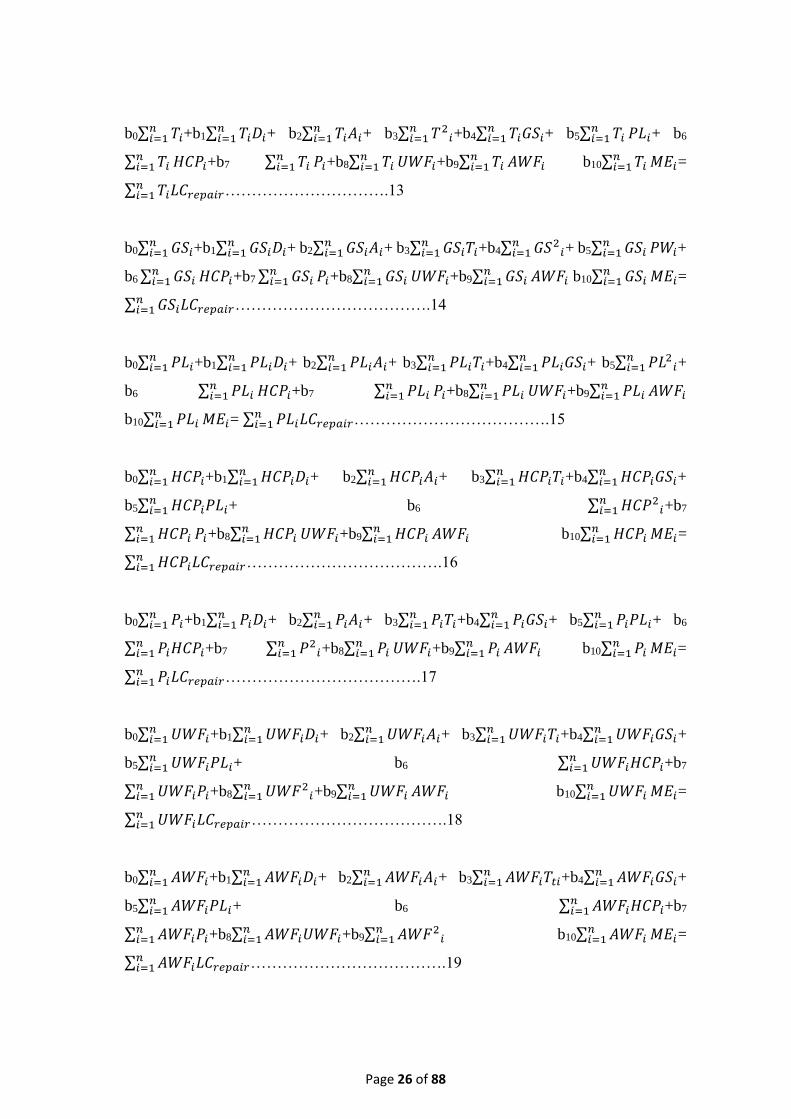
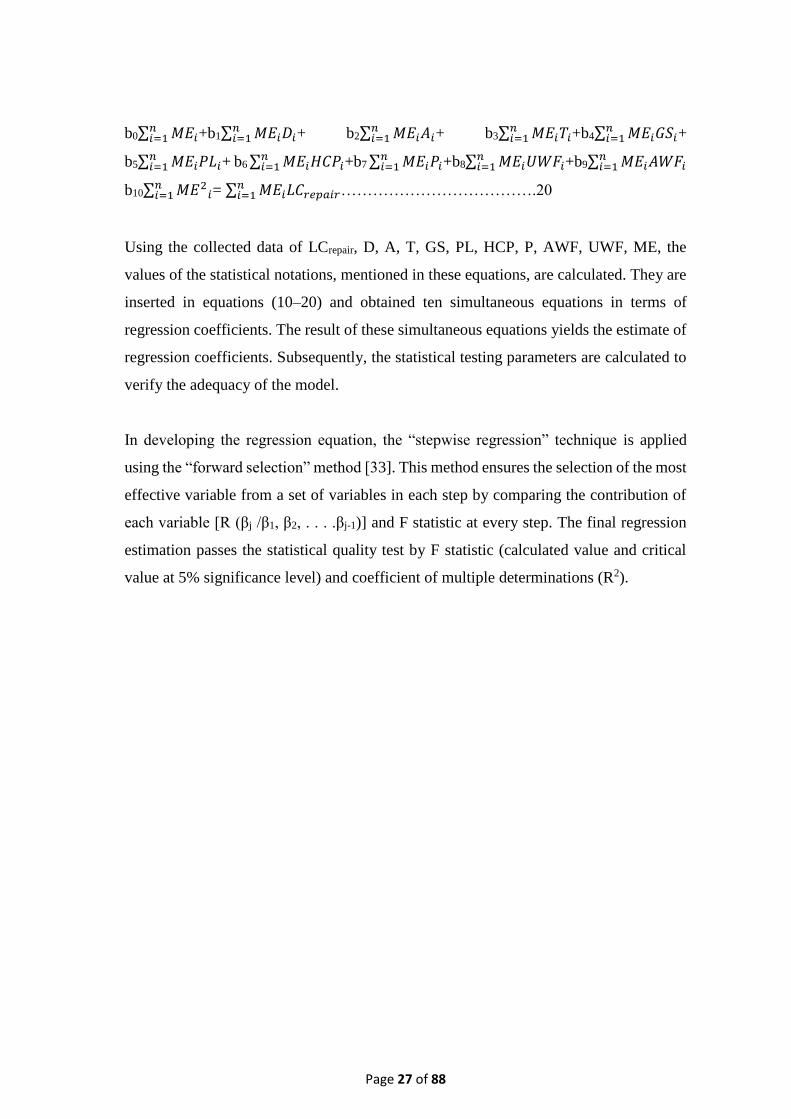
Using the collected data of LCrepair, D, A, T, GS, PL, HCP, P, AWF, UWF, ME, the
values of the statistical notations, mentioned in these equations, are calculated. They are
inserted in equations (10–20) and obtained ten simultaneous equations in terms of
regression coefficients. The result of these simultaneous equations yields the estimate of
regression coefficients. Subsequently, the statistical testing parameters are calculated to
verify the adequacy of the model.
In developing the regression equation, the “stepwise regression” technique is applied
using the “forward selection” method [33]. This method ensures the selection of the most
effective variable from a set of variables in each step by comparing the contribution of
each variable [R (βj /β1, β2, . . . .βj-1)] and F statistic at every step. The final regression
estimation passes the statistical quality test by F statistic (calculated value and critical
value at 5% significance level) and coefficient of multiple determinations (R2).
Page 28 of 88
CHAPTER VI
Analysis and Discussion of Data Samples
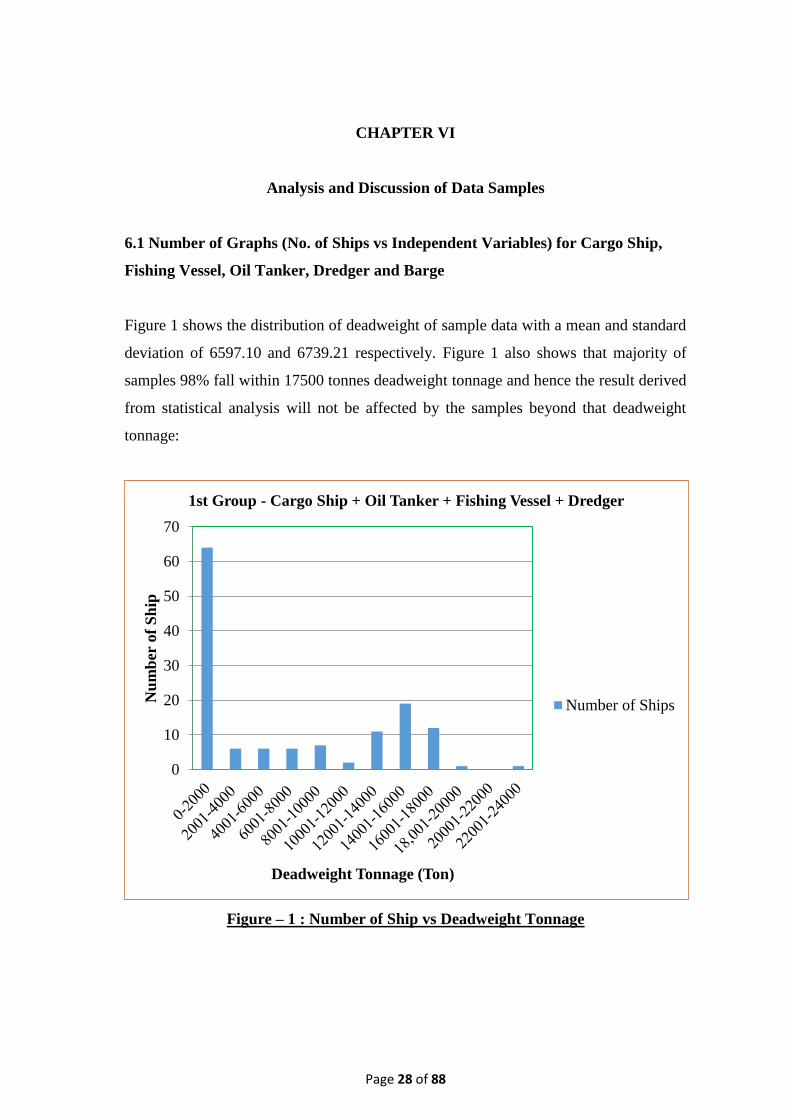
6.1 Number of Graphs (No. of Ships vs Independent Variables) for Cargo Ship,
Fishing Vessel, Oil Tanker, Dredger and Barge
Figure 1 shows the distribution of deadweight of sample data with a mean and standard
deviation of 6597.10 and 6739.21 respectively. Figure 1 also shows that majority of
samples 98% fall within 17500 tonnes deadweight tonnage and hence the result derived
from statistical analysis will not be affected by the samples beyond that deadweight
tonnage:
Figure – 1 : Number of Ship vs Deadweight Tonnage
0
10
20
30
40
50
60
70
Nu
mb
er o
f S
hip
Deadweight Tonnage (Ton)
1st Group - Cargo Ship + Oil Tanker + Fishing Vessel + Dredger
Number of Ships
Page 29 of 88
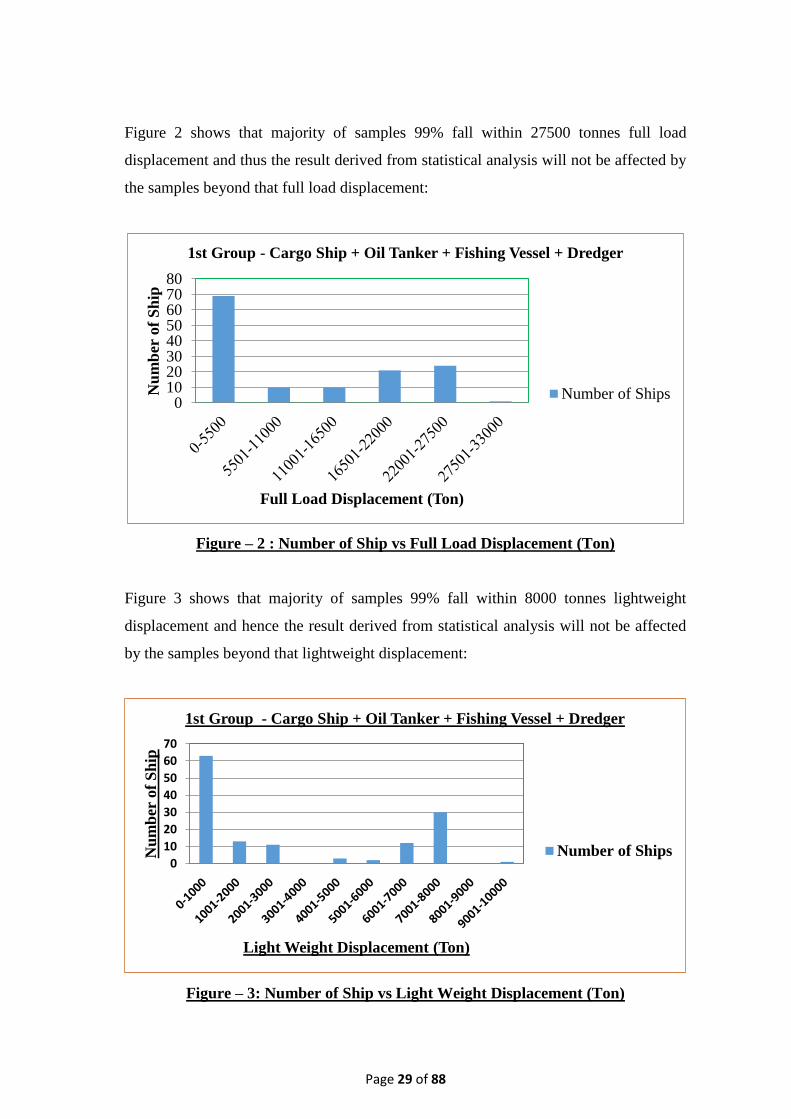
Figure 2 shows that majority of samples 99% fall within 27500 tonnes full load
displacement and thus the result derived from statistical analysis will not be affected by
the samples beyond that full load displacement:
Figure – 2 : Number of Ship vs Full Load Displacement (Ton)
Figure 3 shows that majority of samples 99% fall within 8000 tonnes lightweight
displacement and hence the result derived from statistical analysis will not be affected
by the samples beyond that lightweight displacement:
Figure – 3: Number of Ship vs Light Weight Displacement (Ton)
01020304050607080
Nu
mb
er o
f S
hip
Full Load Displacement (Ton)
1st Group - Cargo Ship + Oil Tanker + Fishing Vessel + Dredger
Number of Ships
0
10
20
30
40
50
60
70
Nu
mb
er o
f S
hip
Light Weight Displacement (Ton)
1st Group - Cargo Ship + Oil Tanker + Fishing Vessel + Dredger
Number of Ships
Page 30 of 88
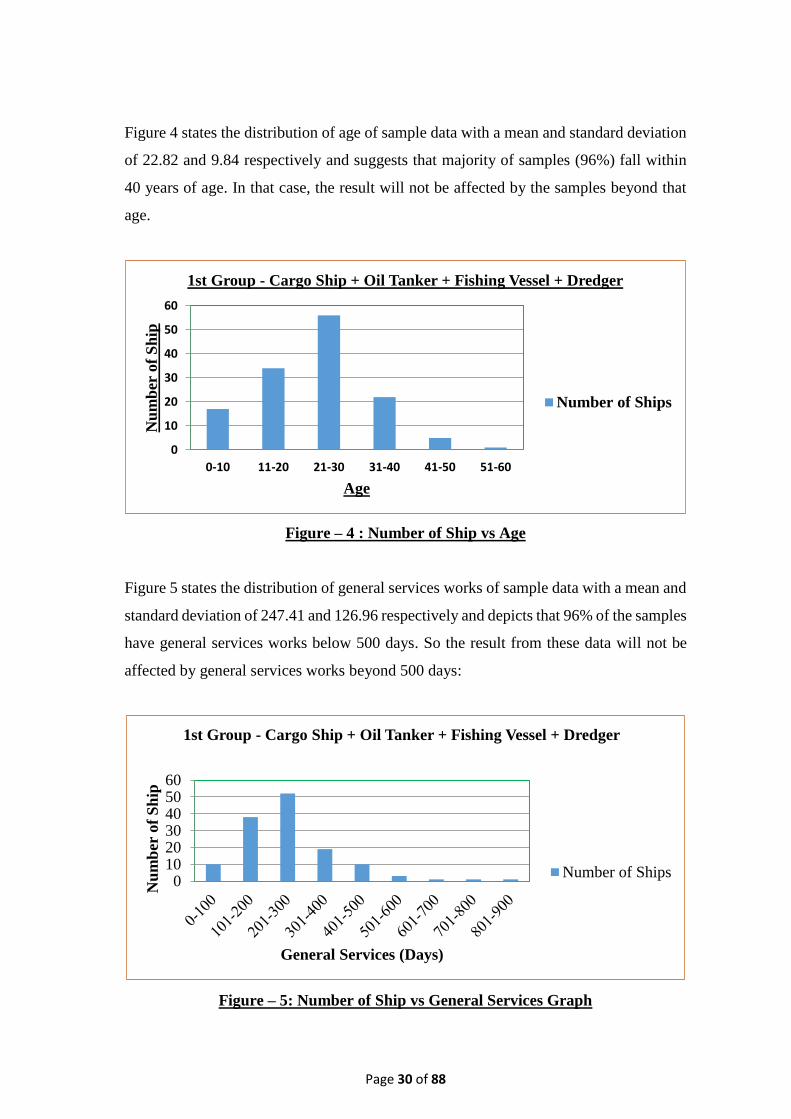
Figure 4 states the distribution of age of sample data with a mean and standard deviation
of 22.82 and 9.84 respectively and suggests that majority of samples (96%) fall within
40 years of age. In that case, the result will not be affected by the samples beyond that
age.
Figure – 4 : Number of Ship vs Age
Figure 5 states the distribution of general services works of sample data with a mean and
standard deviation of 247.41 and 126.96 respectively and depicts that 96% of the samples
have general services works below 500 days. So the result from these data will not be
affected by general services works beyond 500 days:
Figure – 5: Number of Ship vs General Services Graph
0
10
20
30
40
50
60
0-10 11-20 21-30 31-40 41-50 51-60
Nu
mb
er o
f S
hip
Age
1st Group - Cargo Ship + Oil Tanker + Fishing Vessel + Dredger
Number of Ships
0102030405060
Nu
mb
er o
f S
hip
General Services (Days)
1st Group - Cargo Ship + Oil Tanker + Fishing Vessel + Dredger
Number of Ships

Page 31 of 88
Figure 6 states the distribution of plate works of sample data with a mean and standard
deviation of 10.56 and 28.52 respectively and points out that 96% of the samples have
plate works below 50 tons. So the result from these data will not be affected by plate
works beyond 50 tons:
Figure – 6 : Number of Ship vs Plate Works (Ton)
Figure 7 states the distribution of hull cleaning & painting works of sample data with a
mean and standard deviation of 7426.92 and 7369.59 respectively and indicates that 96%
of the samples have hull cleaning & painting works below 20,000 sqm. Therefore, the
result from these data will not be affected by hull cleaning & painting works beyond
20,000 sqm:
Figure – 7: Number of Ship vs Hull Cleaning & Painting (Sqm)
0
50
100
150
Nu
mb
er o
f S
hip
Plate Works (Ton)
1st Group - Cargo Ship + Oil Tanker + Fishing Vessel + Dredger
Number of Ships
0
20
40
60
80
Nu
mb
er o
f S
hip
Hull Cleaning & Painting (Sqm)
1st Group - Cargo Ship + Oil Tanker + Fishing Vessel + Dredger
Number of Ships

Page 32 of 88
Figure 8 states the distribution of piping works of sample data with a mean and standard
deviation of 28.89 and 128.56 respectively and explains that 88.89% of the samples have
piping works within 20 rm. Thus, the result from these data will not be affected by piping
works beyond 20 rm:
Figure – 8: Number of Ship vs Piping (Rm)
Figure 9 states the distribution of underwater fittings works of sample data with a mean
and standard deviation of 129.92 and 102.07 respectively and explains that 99% of the
samples contain underwater fittings works within 400 nos. Thus, the result from these
data will not be affected by underwater fittings works beyond 400 nos:
Figure – 9: Number of Ship vs Under Water Fittings (Nos)
020406080
100120140
0-2
0
61
-80
121-1
40
181-2
00
241-2
60
301-3
20
361-3
80
421-4
40
481-5
00
541-5
60
601-6
20
661-6
80
721-7
40
781-8
00
841-8
60
901-9
20
961-9
80
10
21
-104
0
1081
-11
00N
um
ber
of
Sh
ip
Piping (Rm)
1st Group - Cargo Ship + Oil Tanker + Fishing Vessel + Dredger
Number of Ships
0
10
20
30
40
50
Nu
mb
er o
f S
hip
Under Water Fittings (Nos)
1st Group - Cargo Ship + Oil Tanker + Fishing Vessel +
Dredger
Number of Ships
Page 33 of 88
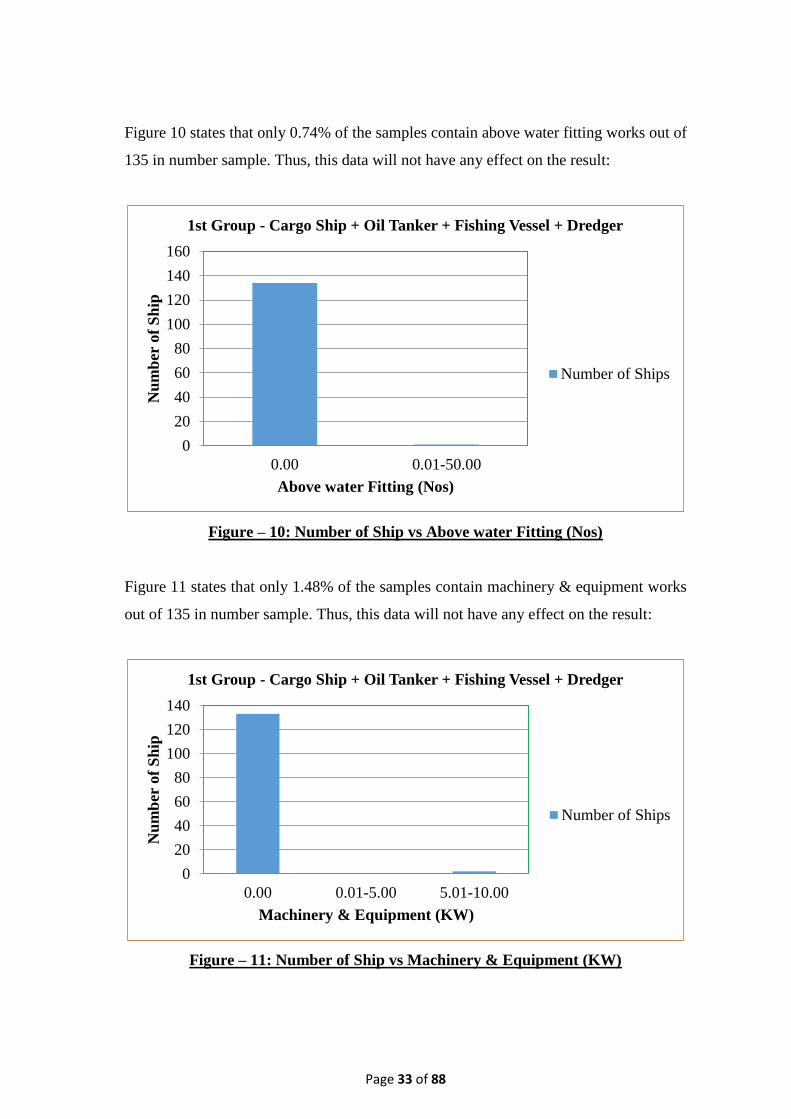
Figure 10 states that only 0.74% of the samples contain above water fitting works out of
135 in number sample. Thus, this data will not have any effect on the result:
Figure – 10: Number of Ship vs Above water Fitting (Nos)
Figure 11 states that only 1.48% of the samples contain machinery & equipment works
out of 135 in number sample. Thus, this data will not have any effect on the result:
Figure – 11: Number of Ship vs Machinery & Equipment (KW)
0
20
40
60
80
100
120
140
160
0.00 0.01-50.00
Nu
mb
er o
f S
hip
Above water Fitting (Nos)
1st Group - Cargo Ship + Oil Tanker + Fishing Vessel + Dredger
Number of Ships
0
20
40
60
80
100
120
140
0.00 0.01-5.00 5.01-10.00
Nu
mb
er o
f S
hip
Machinery & Equipment (KW)
1st Group - Cargo Ship + Oil Tanker + Fishing Vessel + Dredger
Number of Ships
Page 34 of 88
6.2 Number of Graphs (Man-day vs Independent Variables) for Cargo Ship,
Fishing vessel, Oil Tanker, Dredger and Barge
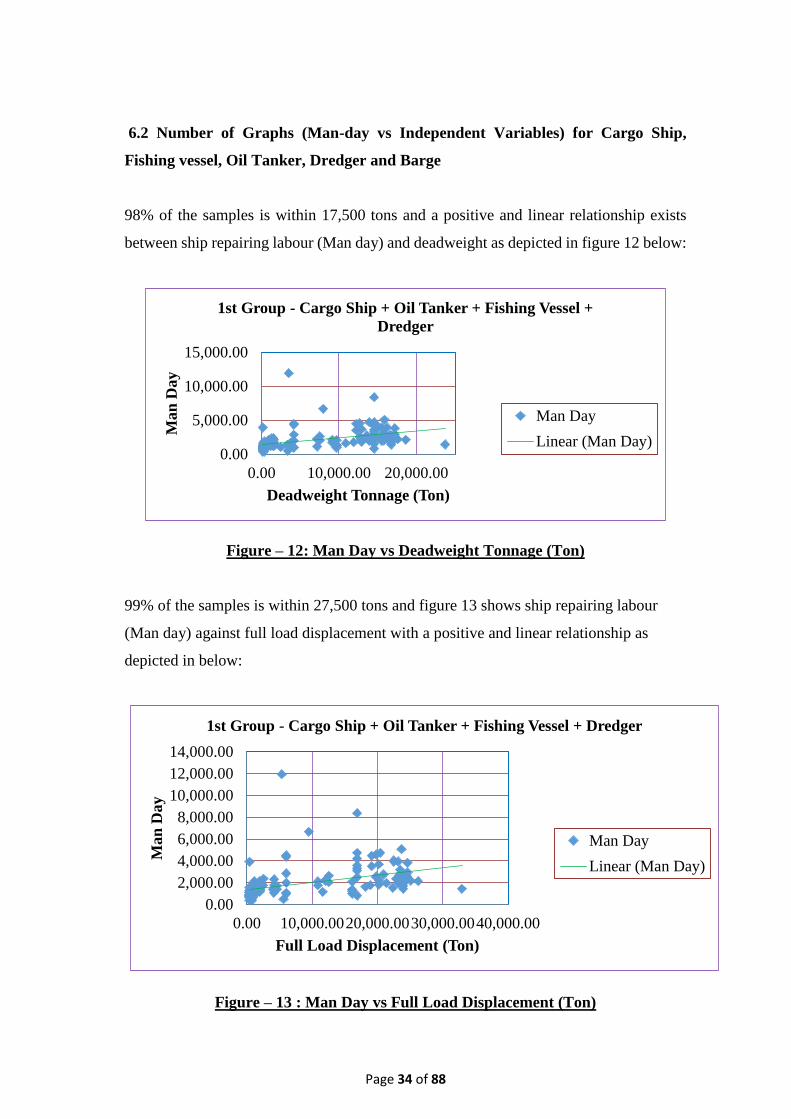
98% of the samples is within 17,500 tons and a positive and linear relationship exists
between ship repairing labour (Man day) and deadweight as depicted in figure 12 below:
Figure – 12: Man Day vs Deadweight Tonnage (Ton)
99% of the samples is within 27,500 tons and figure 13 shows ship repairing labour
(Man day) against full load displacement with a positive and linear relationship as
depicted in below:
Figure – 13 : Man Day vs Full Load Displacement (Ton)
0.00
5,000.00
10,000.00
15,000.00
0.00 10,000.00 20,000.00
Man
Day
Deadweight Tonnage (Ton)
1st Group - Cargo Ship + Oil Tanker + Fishing Vessel +
Dredger
Man Day
Linear (Man Day)
0.00
2,000.00
4,000.00
6,000.00
8,000.00
10,000.00
12,000.00
14,000.00
0.00 10,000.0020,000.0030,000.0040,000.00
Man
Day
Full Load Displacement (Ton)
1st Group - Cargo Ship + Oil Tanker + Fishing Vessel + Dredger
Man Day
Linear (Man Day)
Page 35 of 88
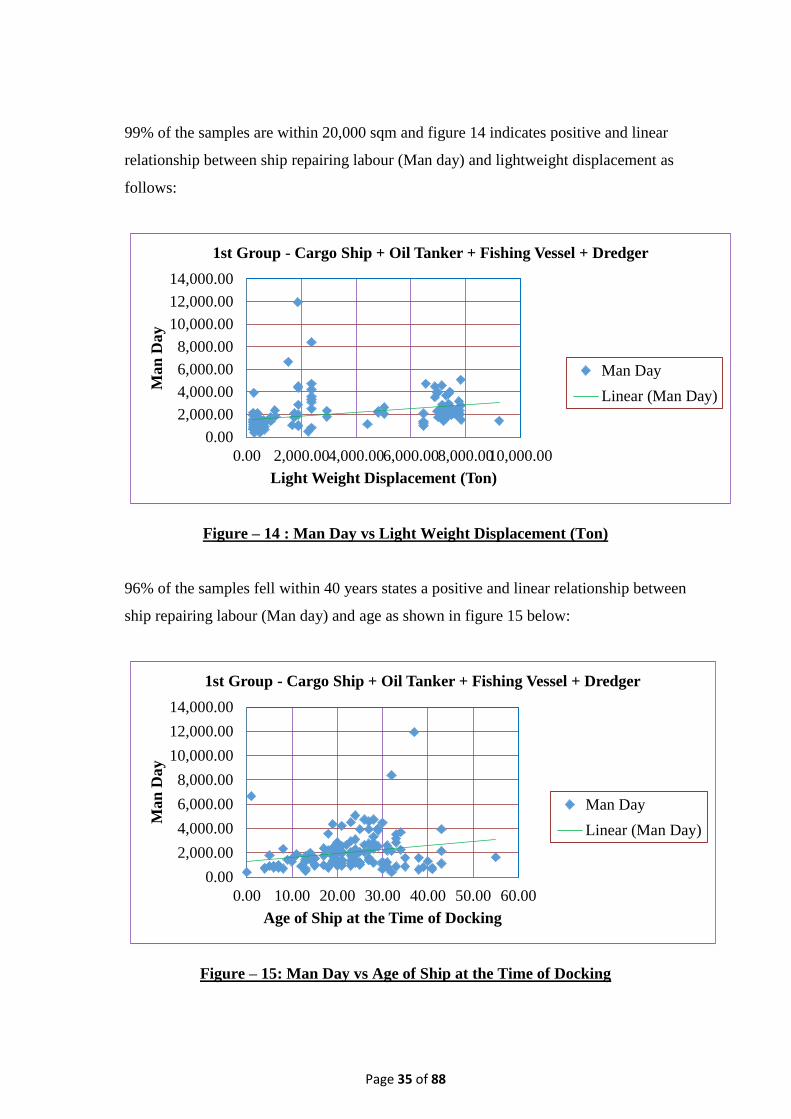
99% of the samples are within 20,000 sqm and figure 14 indicates positive and linear
relationship between ship repairing labour (Man day) and lightweight displacement as
follows:
Figure – 14 : Man Day vs Light Weight Displacement (Ton)
96% of the samples fell within 40 years states a positive and linear relationship between
ship repairing labour (Man day) and age as shown in figure 15 below:
Figure – 15: Man Day vs Age of Ship at the Time of Docking
0.00
2,000.00
4,000.00
6,000.00
8,000.00
10,000.00
12,000.00
14,000.00
0.00 2,000.004,000.006,000.008,000.0010,000.00
Ma
n D
ay
Light Weight Displacement (Ton)
1st Group - Cargo Ship + Oil Tanker + Fishing Vessel + Dredger
Man Day
Linear (Man Day)
0.00
2,000.00
4,000.00
6,000.00
8,000.00
10,000.00
12,000.00
14,000.00
0.00 10.00 20.00 30.00 40.00 50.00 60.00
Man
Day
Age of Ship at the Time of Docking
1st Group - Cargo Ship + Oil Tanker + Fishing Vessel + Dredger
Man Day
Linear (Man Day)
Page 36 of 88
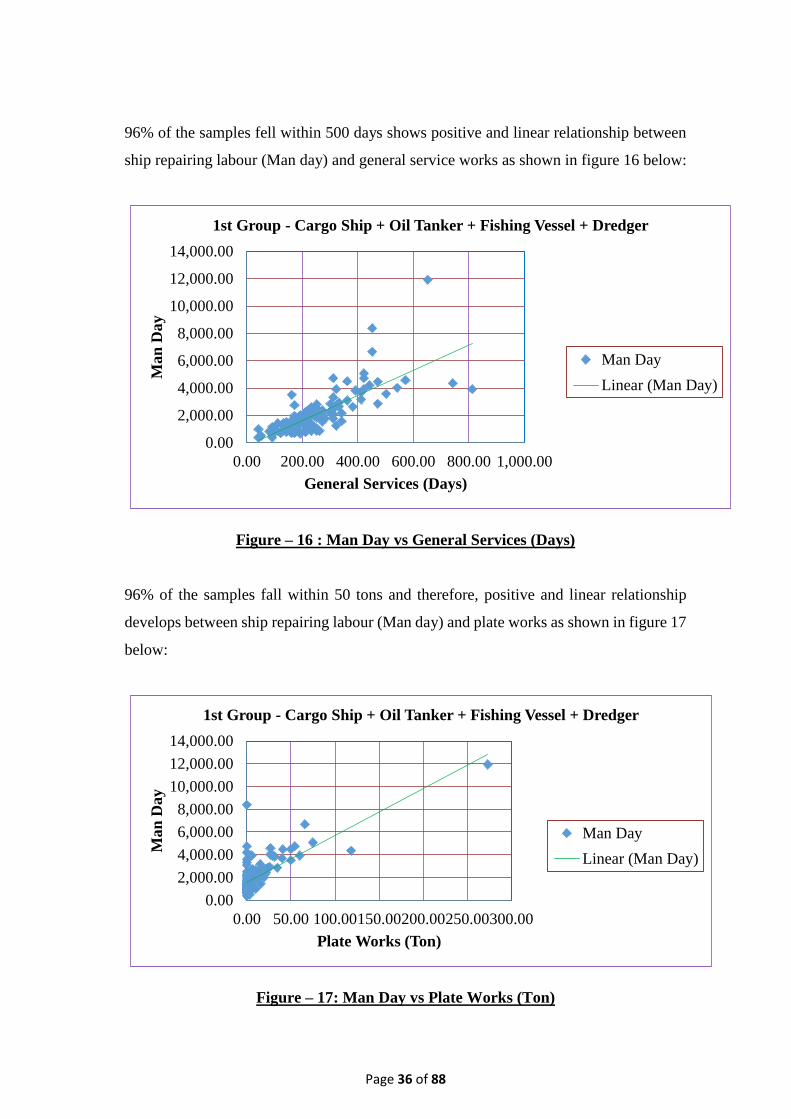
96% of the samples fell within 500 days shows positive and linear relationship between
ship repairing labour (Man day) and general service works as shown in figure 16 below:
Figure – 16 : Man Day vs General Services (Days)
96% of the samples fall within 50 tons and therefore, positive and linear relationship
develops between ship repairing labour (Man day) and plate works as shown in figure 17
below:
Figure – 17: Man Day vs Plate Works (Ton)
0.00
2,000.00
4,000.00
6,000.00
8,000.00
10,000.00
12,000.00
14,000.00
0.00 200.00 400.00 600.00 800.00 1,000.00
Ma
n D
ay
General Services (Days)
1st Group - Cargo Ship + Oil Tanker + Fishing Vessel + Dredger
Man Day
Linear (Man Day)
0.00
2,000.00
4,000.00
6,000.00
8,000.00
10,000.00
12,000.00
14,000.00
0.00 50.00 100.00150.00200.00250.00300.00
Man
Day
Plate Works (Ton)
1st Group - Cargo Ship + Oil Tanker + Fishing Vessel + Dredger
Man Day
Linear (Man Day)
Page 37 of 88
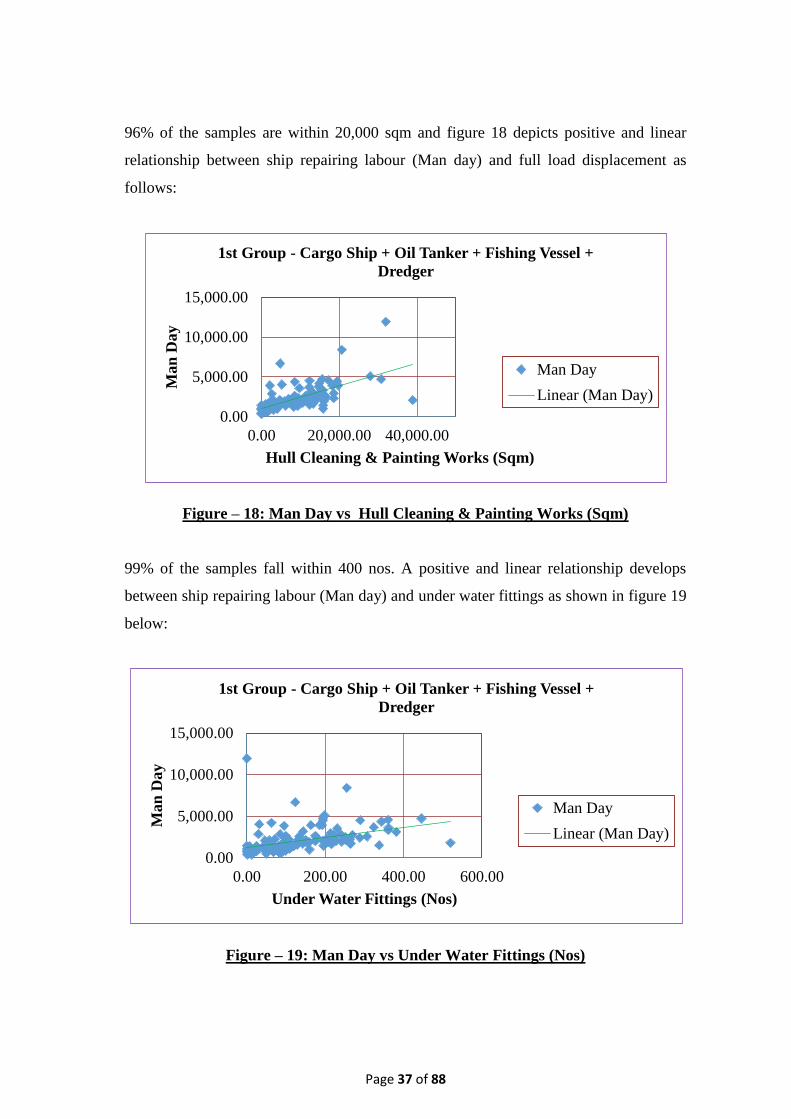
96% of the samples are within 20,000 sqm and figure 18 depicts positive and linear
relationship between ship repairing labour (Man day) and full load displacement as
follows:
Figure – 18: Man Day vs Hull Cleaning & Painting Works (Sqm)
99% of the samples fall within 400 nos. A positive and linear relationship develops
between ship repairing labour (Man day) and under water fittings as shown in figure 19
below:
Figure – 19: Man Day vs Under Water Fittings (Nos)
0.00
5,000.00
10,000.00
15,000.00
0.00 20,000.00 40,000.00
Man
Day
Hull Cleaning & Painting Works (Sqm)
1st Group - Cargo Ship + Oil Tanker + Fishing Vessel +
Dredger
Man Day
Linear (Man Day)
0.00
5,000.00
10,000.00
15,000.00
0.00 200.00 400.00 600.00
Man
Day
Under Water Fittings (Nos)
1st Group - Cargo Ship + Oil Tanker + Fishing Vessel +
Dredger
Man Day
Linear (Man Day)
Page 38 of 88
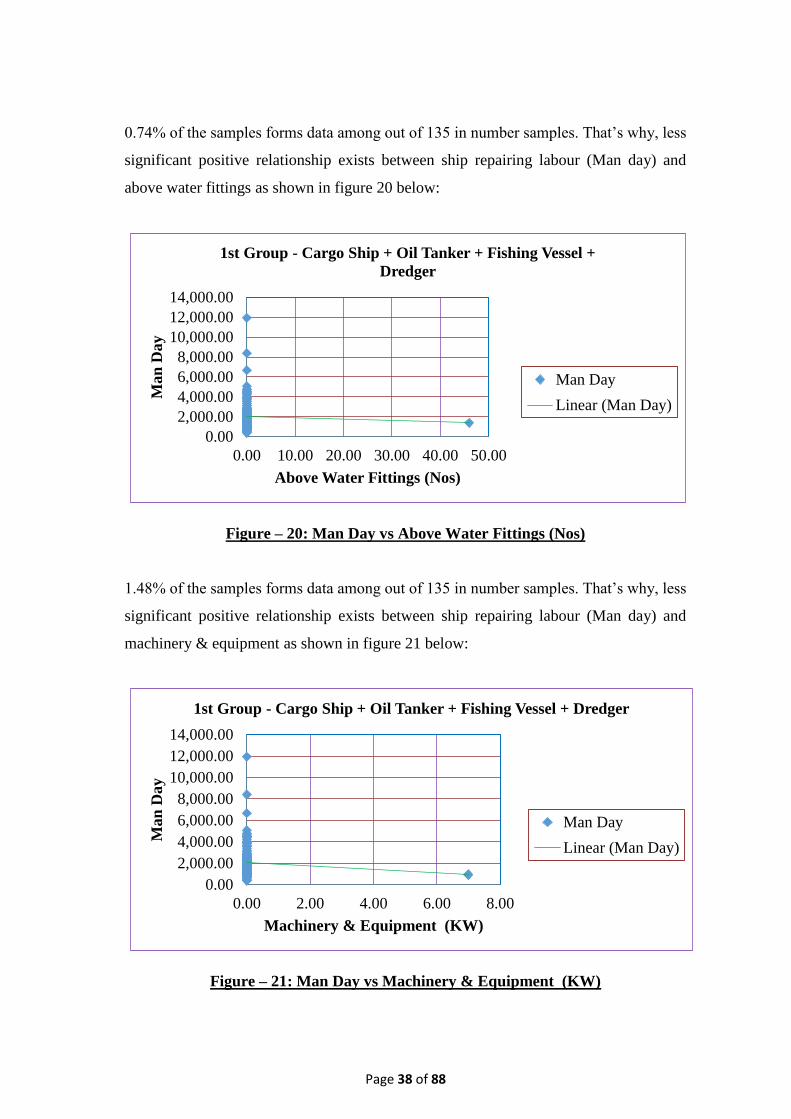
0.74% of the samples forms data among out of 135 in number samples. That’s why, less
significant positive relationship exists between ship repairing labour (Man day) and
above water fittings as shown in figure 20 below:
Figure – 20: Man Day vs Above Water Fittings (Nos)
1.48% of the samples forms data among out of 135 in number samples. That’s why, less
significant positive relationship exists between ship repairing labour (Man day) and
machinery & equipment as shown in figure 21 below:
Figure – 21: Man Day vs Machinery & Equipment (KW)
0.00
2,000.00
4,000.00
6,000.00
8,000.00
10,000.00
12,000.00
14,000.00
0.00 10.00 20.00 30.00 40.00 50.00
Ma
n D
ay
Above Water Fittings (Nos)
1st Group - Cargo Ship + Oil Tanker + Fishing Vessel +
Dredger
Man Day
Linear (Man Day)
0.00
2,000.00
4,000.00
6,000.00
8,000.00
10,000.00
12,000.00
14,000.00
0.00 2.00 4.00 6.00 8.00
Man
Day
Machinery & Equipment (KW)
1st Group - Cargo Ship + Oil Tanker + Fishing Vessel + Dredger
Man Day
Linear (Man Day)

Page 39 of 88
6.3 Number of Graphs (No. of Ships vs Independent Variables) for Warship
Figure 22 states the distribution of full load displacement of sample data with a mean and
standard deviation of 851.4 and 896.74 respectively and shows that majority of samples
92.5% fall within 2100 tonnes full load displacement and hence the result derived from
statistical analysis will not be affected by the samples beyond that full load displacement:
Figure – 22: Number of Ship vs Full Load Displacement (Ton)
Figure 23 shows that majority of samples 92.5% fall within 1785 tonnes lightweight
tonnage and hence the result derived from statistical analysis will not be affected by the
samples beyond that lightweight displacement:
Figure – 23: Number of Ships vs Lightweight Displacement (Ton)
0
5
10
15
20
25
Nu
mb
er o
f S
hip
Full Load Displacement (Ton)
2nd Group – Warship
(Number of Ship)
05
101520
Nu
mb
er o
f S
hip
s
Lightweight Displacement (Ton)
2nd Group – Warship
(Number of Ships)
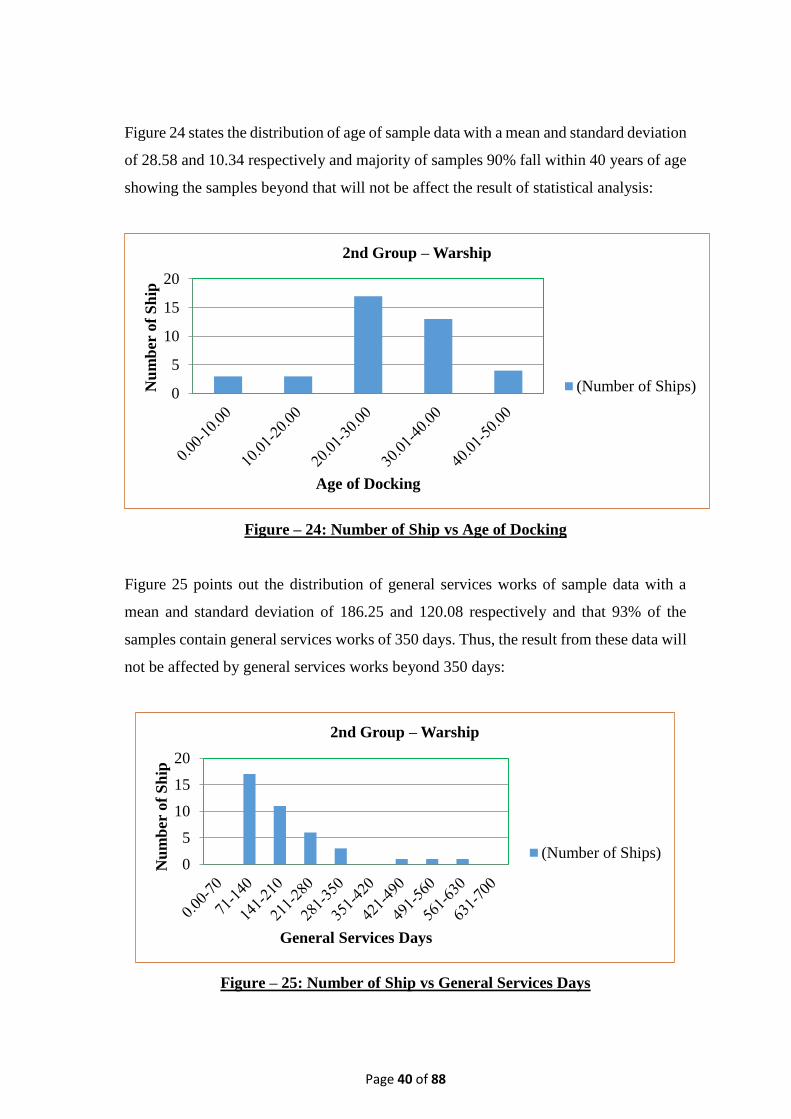
Page 40 of 88
Figure 24 states the distribution of age of sample data with a mean and standard deviation
of 28.58 and 10.34 respectively and majority of samples 90% fall within 40 years of age
showing the samples beyond that will not be affect the result of statistical analysis:
Figure – 24: Number of Ship vs Age of Docking
Figure 25 points out the distribution of general services works of sample data with a
mean and standard deviation of 186.25 and 120.08 respectively and that 93% of the
samples contain general services works of 350 days. Thus, the result from these data will
not be affected by general services works beyond 350 days:
Figure – 25: Number of Ship vs General Services Days
0
5
10
15
20
Nu
mb
er o
f S
hip
Age of Docking
2nd Group – Warship
(Number of Ships)
0
5
10
15
20
Nu
mb
er o
f S
hip
General Services Days
2nd Group – Warship
(Number of Ships)

Page 41 of 88
Figure 26 states the distribution of plate works of sample data with a mean and standard
deviation of 0.39 and 1.38 respectively and figures out that 98% of the samples contain
plate works below 3.6 tons. Thus, the result from these data will not be affected by
plate works beyond 3.6 tons:
Figure – 26: Number of Ship vs Plate works Ton
Figure 27 states the distribution of hull cleaning & painting works of sample data with a
mean and standard deviation of 697.21 and 1051.10 respectively and states that 90% of
the samples contain hull cleaning & painting works beyond 2050 sqm. Thus, the result
from these data will not be affected by hull cleaning & painting works beyond 2050 sqm:
Figure – 27: Number of Ship vs Hull Cleaning & Painting (Sqm)
05
101520253035
Nu
mb
er o
f S
hip
Plate works Ton
2nd Group – Warship
(Number of Ships)
0
5
10
15
20
Nu
mb
er o
f S
hip
Hull Cleaning & Painting (Sqm)
2nd Group – Warship
(Number of Ships)
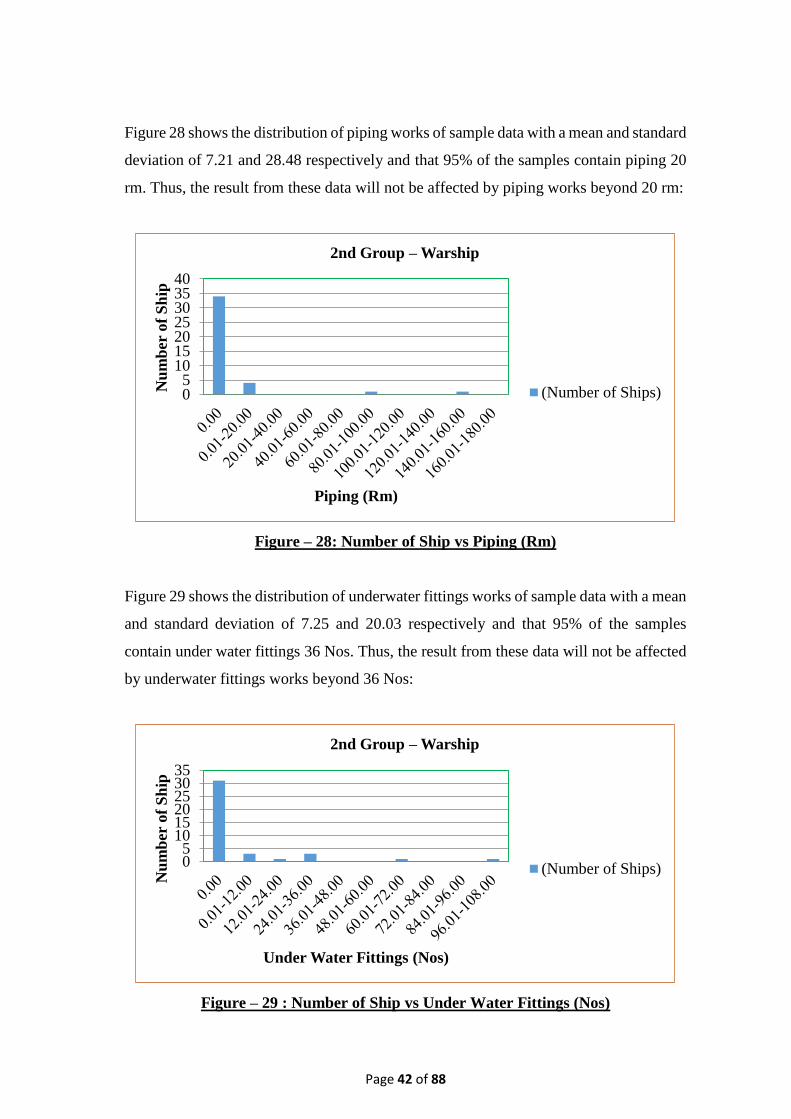
Page 42 of 88
Figure 28 shows the distribution of piping works of sample data with a mean and standard
deviation of 7.21 and 28.48 respectively and that 95% of the samples contain piping 20
rm. Thus, the result from these data will not be affected by piping works beyond 20 rm:
Figure – 28: Number of Ship vs Piping (Rm)
Figure 29 shows the distribution of underwater fittings works of sample data with a mean
and standard deviation of 7.25 and 20.03 respectively and that 95% of the samples
contain under water fittings 36 Nos. Thus, the result from these data will not be affected
by underwater fittings works beyond 36 Nos:
Figure – 29 : Number of Ship vs Under Water Fittings (Nos)
05
10152025303540
Nu
mb
er o
f S
hip
Piping (Rm)
2nd Group – Warship
(Number of Ships)
05
101520253035
Nu
mb
er o
f S
hip
Under Water Fittings (Nos)
2nd Group – Warship
(Number of Ships)
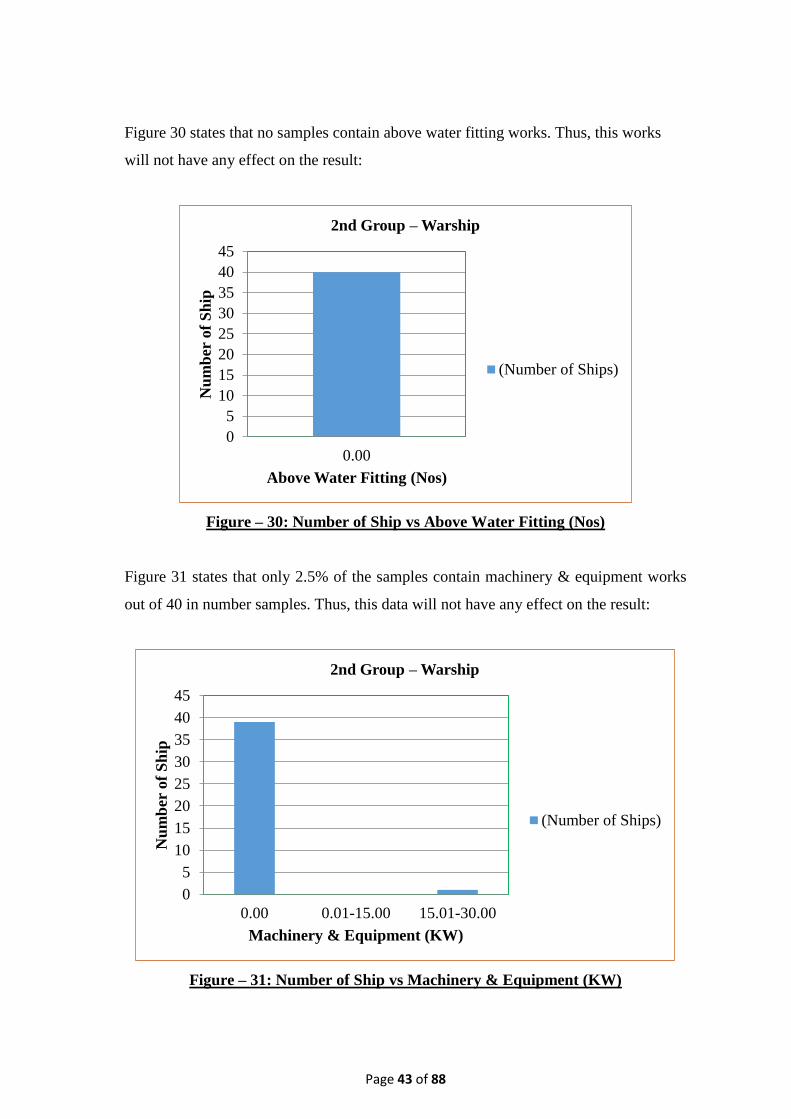
Page 43 of 88
Figure 30 states that no samples contain above water fitting works. Thus, this works
will not have any effect on the result:
Figure – 30: Number of Ship vs Above Water Fitting (Nos)
Figure 31 states that only 2.5% of the samples contain machinery & equipment works
out of 40 in number samples. Thus, this data will not have any effect on the result:
Figure – 31: Number of Ship vs Machinery & Equipment (KW)
0
5
10
15
20
25
30
35
40
45
0.00
Nu
mb
er o
f S
hip
Above Water Fitting (Nos)
2nd Group – Warship
(Number of Ships)
0
5
10
15
20
25
30
35
40
45
0.00 0.01-15.00 15.01-30.00
Nu
mb
er o
f S
hip
Machinery & Equipment (KW)
2nd Group – Warship
(Number of Ships)

Page 44 of 88
6.4 Number of Graphs (Man-day vs Independent Variables) for Warship
92.5% of the samples is within 2100 tons and figure 32 shows ship repairing labour (Man
day) against full load displacement with a positive and linear relationship as depicted in
below:
Figure – 32: Man Day vs Full Load Displacement (Ton)
92.5% of the samples is within 1785 tons and figure 33 shows ship repairing labour (Man
day) against full load displacement with a positive and linear relationship as depicted in
below:
Figure – 33 : Man Day vs Lightweight Displacement (Ton)
0
500
1000
1500
2000
2500
3000
0.00 1,000.00 2,000.00 3,000.00 4,000.00
Man
Day
Full Load Displacement (Ton)
2nd Group – Warship
Man Day
Linear (Man Day)
0
500
1000
1500
2000
2500
3000
0.00 1,000.00 2,000.00 3,000.00
Man
Day
Lightweight Displacement (Ton)
2nd Group – Warship
Man Day
Linear (Man Day)
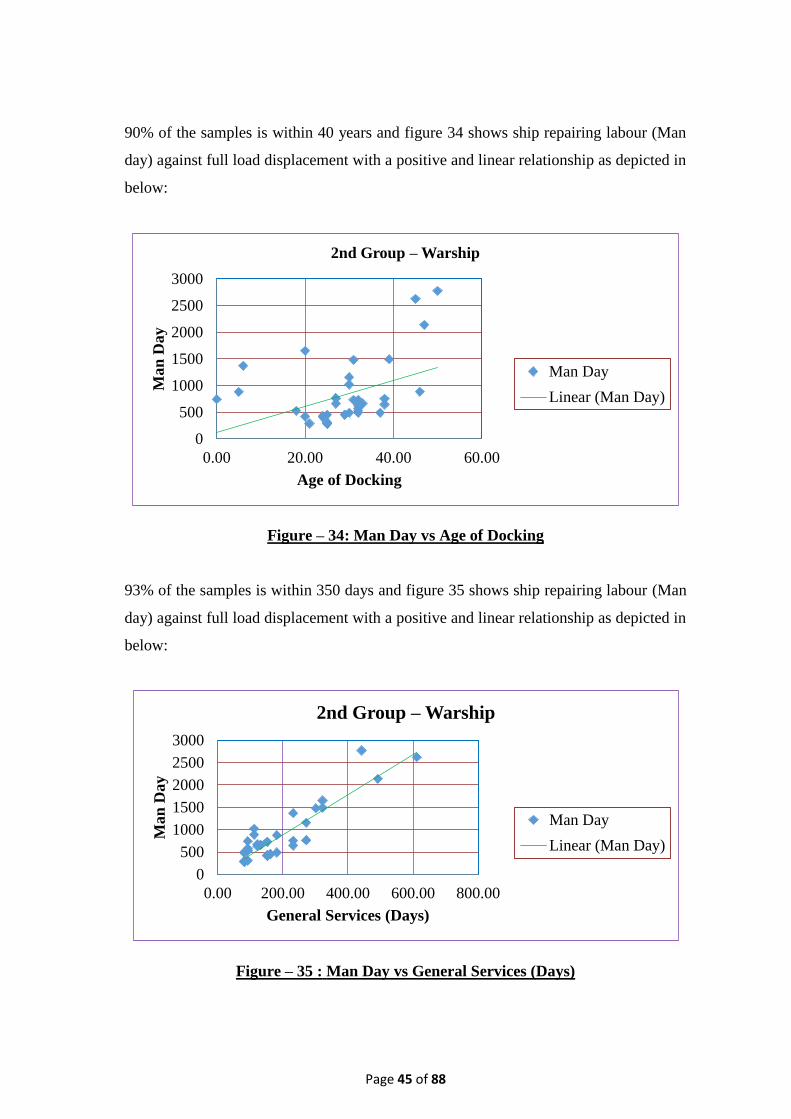
Page 45 of 88
90% of the samples is within 40 years and figure 34 shows ship repairing labour (Man
day) against full load displacement with a positive and linear relationship as depicted in
below:
Figure – 34: Man Day vs Age of Docking
93% of the samples is within 350 days and figure 35 shows ship repairing labour (Man
day) against full load displacement with a positive and linear relationship as depicted in
below:
Figure – 35 : Man Day vs General Services (Days)
0
500
1000
1500
2000
2500
3000
0.00 20.00 40.00 60.00
Man
Day
Age of Docking
2nd Group – Warship
Man Day
Linear (Man Day)
0
500
1000
1500
2000
2500
3000
0.00 200.00 400.00 600.00 800.00
Man
Day
General Services (Days)
2nd Group – Warship
Man Day
Linear (Man Day)
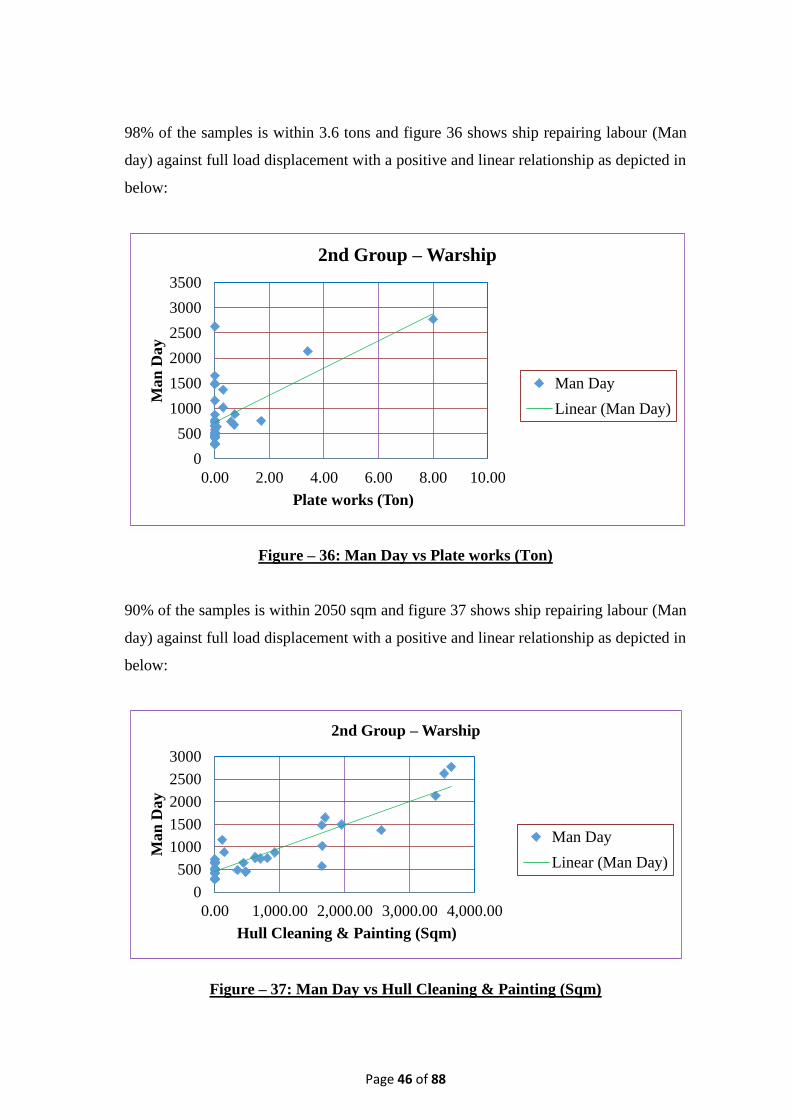
Page 46 of 88
98% of the samples is within 3.6 tons and figure 36 shows ship repairing labour (Man
day) against full load displacement with a positive and linear relationship as depicted in
below:
Figure – 36: Man Day vs Plate works (Ton)
90% of the samples is within 2050 sqm and figure 37 shows ship repairing labour (Man
day) against full load displacement with a positive and linear relationship as depicted in
below:
Figure – 37: Man Day vs Hull Cleaning & Painting (Sqm)
0
500
1000
1500
2000
2500
3000
3500
0.00 2.00 4.00 6.00 8.00 10.00
Ma
n D
ay
Plate works (Ton)
2nd Group – Warship
Man Day
Linear (Man Day)
0
500
1000
1500
2000
2500
3000
0.00 1,000.00 2,000.00 3,000.00 4,000.00
Man
Day
Hull Cleaning & Painting (Sqm)
2nd Group – Warship
Man Day
Linear (Man Day)

Page 47 of 88
95% of the samples is within 20 rm and figure 38 shows ship repairing labour (Man day)
against full load displacement with a positive and linear relationship as depicted in below:
Figure – 38: Man Day vs Piping (Rm)
95% of the samples is within 36 nos and figure 39 shows ship repairing labour (Man day)
against full load displacement with a positive and linear relationship as depicted in below:
Figure – 39 : Man Day vs Under Water Fittings (Nos)
0
500
1000
1500
2000
2500
3000
0.00 50.00 100.00 150.00 200.00
Ma
n D
ay
Piping (Rm)
2nd Group – Warship
Man Day
Linear (Man Day)
0
500
1000
1500
2000
2500
3000
0.00 20.00 40.00 60.00 80.00 100.00 120.00
Ma
n D
ay
Under Water Fittings (Nos)
2nd Group – Warship
Man Day
Linear (Man Day)
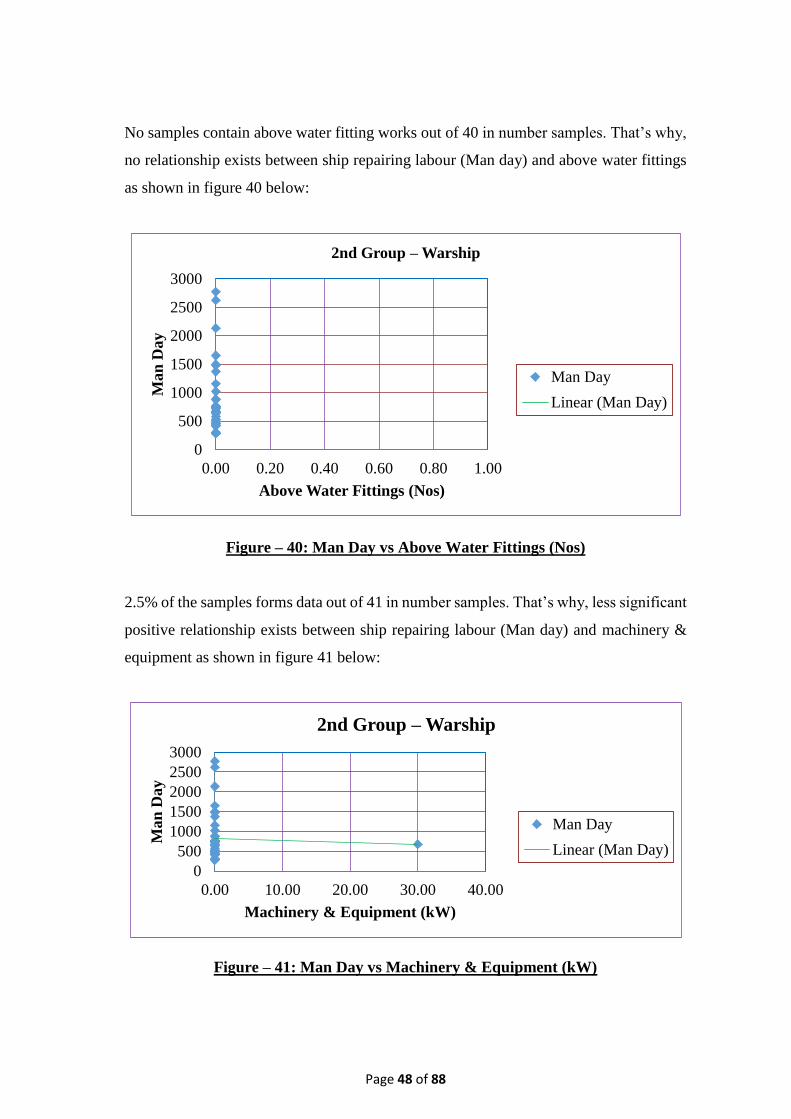
Page 48 of 88
No samples contain above water fitting works out of 40 in number samples. That’s why,
no relationship exists between ship repairing labour (Man day) and above water fittings
as shown in figure 40 below:
Figure – 40: Man Day vs Above Water Fittings (Nos)
2.5% of the samples forms data out of 41 in number samples. That’s why, less significant
positive relationship exists between ship repairing labour (Man day) and machinery &
equipment as shown in figure 41 below:
Figure – 41: Man Day vs Machinery & Equipment (kW)
0
500
1000
1500
2000
2500
3000
0.00 0.20 0.40 0.60 0.80 1.00
Ma
n D
ay
Above Water Fittings (Nos)
2nd Group – Warship
Man Day
Linear (Man Day)
0
500
1000
1500
2000
2500
3000
0.00 10.00 20.00 30.00 40.00
Man
Day
Machinery & Equipment (kW)
2nd Group – Warship
Man Day
Linear (Man Day)
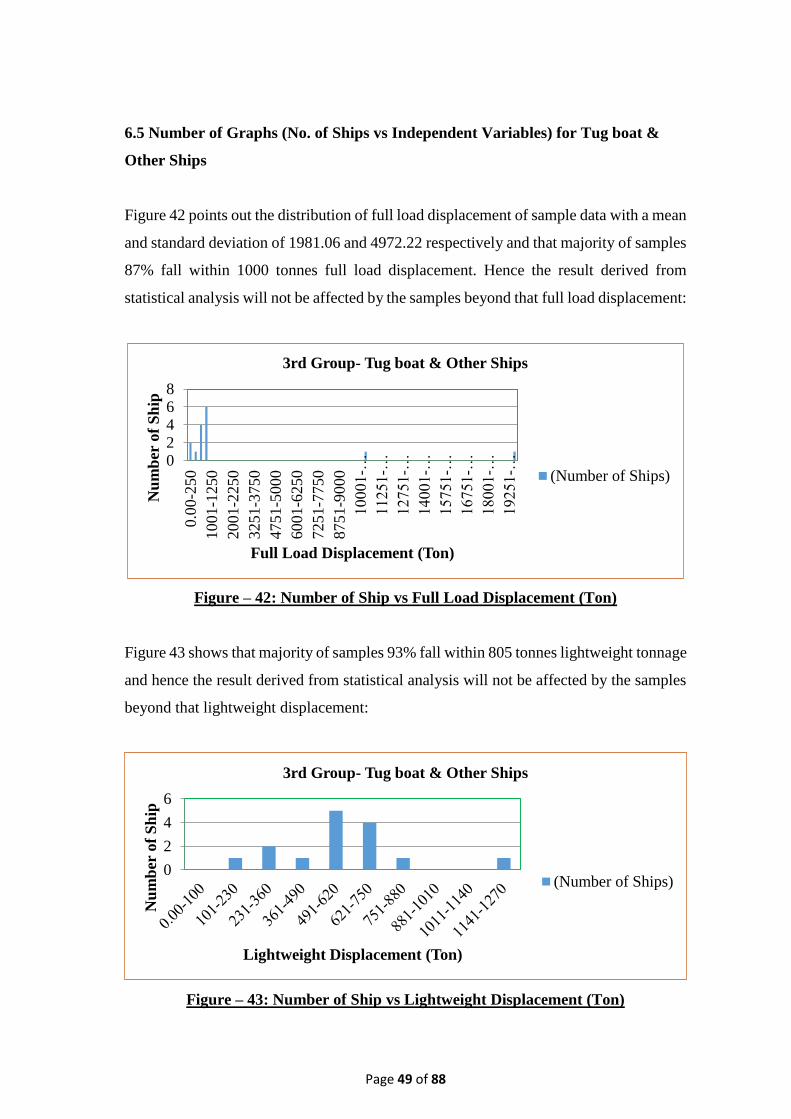
Page 49 of 88
6.5 Number of Graphs (No. of Ships vs Independent Variables) for Tug boat &
Other Ships
Figure 42 points out the distribution of full load displacement of sample data with a mean
and standard deviation of 1981.06 and 4972.22 respectively and that majority of samples
87% fall within 1000 tonnes full load displacement. Hence the result derived from
statistical analysis will not be affected by the samples beyond that full load displacement:
Figure – 42: Number of Ship vs Full Load Displacement (Ton)
Figure 43 shows that majority of samples 93% fall within 805 tonnes lightweight tonnage
and hence the result derived from statistical analysis will not be affected by the samples
beyond that lightweight displacement:
Figure – 43: Number of Ship vs Lightweight Displacement (Ton)
02468
0.0
0-2
50
1001-1
250
2001-2
250
3251-3
750
4751-5
000
6001-6
250
7251-7
750
8751-9
000
10001-…
11251-…
12751-…
14001-…
15751-…
16751-…
18001-…
19251-…
Nu
mb
er o
f S
hip
Full Load Displacement (Ton)
3rd Group- Tug boat & Other Ships
(Number of Ships)
0
2
4
6
Nu
mb
er o
f S
hip
Lightweight Displacement (Ton)
3rd Group- Tug boat & Other Ships
(Number of Ships)
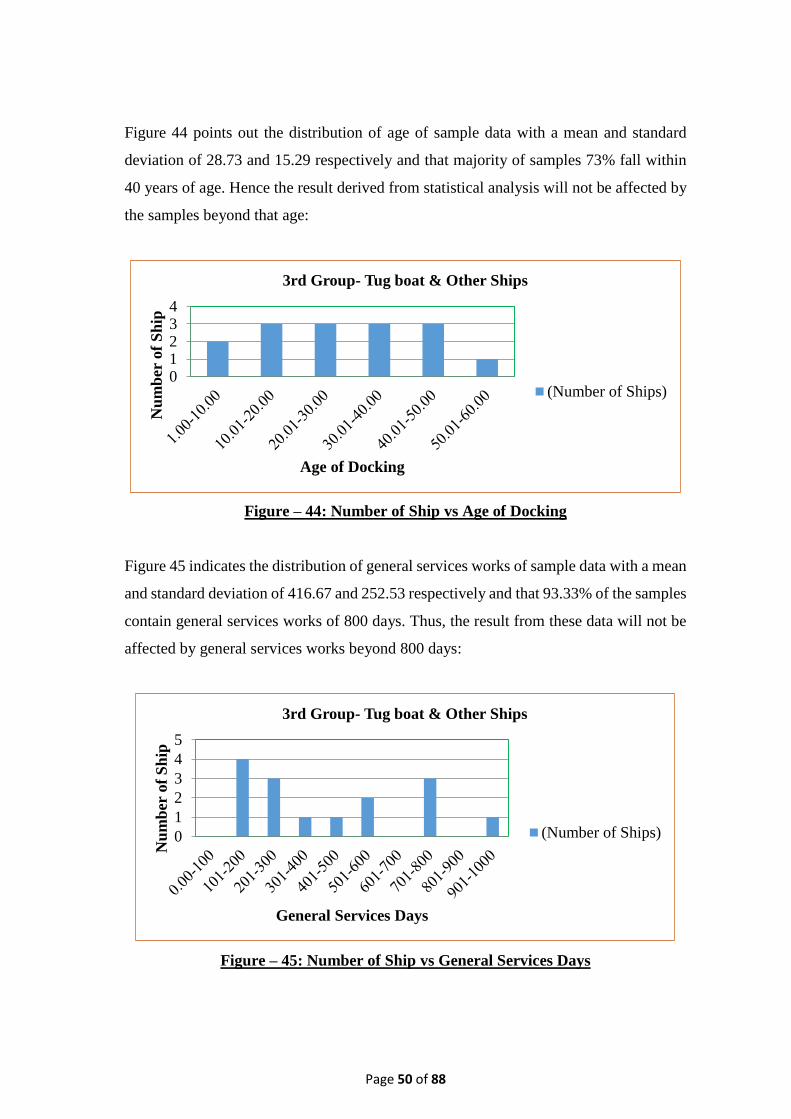
Page 50 of 88
Figure 44 points out the distribution of age of sample data with a mean and standard
deviation of 28.73 and 15.29 respectively and that majority of samples 73% fall within
40 years of age. Hence the result derived from statistical analysis will not be affected by
the samples beyond that age:
Figure – 44: Number of Ship vs Age of Docking
Figure 45 indicates the distribution of general services works of sample data with a mean
and standard deviation of 416.67 and 252.53 respectively and that 93.33% of the samples
contain general services works of 800 days. Thus, the result from these data will not be
affected by general services works beyond 800 days:
Figure – 45: Number of Ship vs General Services Days
01234
Nu
mb
er o
f S
hip
Age of Docking
3rd Group- Tug boat & Other Ships
(Number of Ships)
0
1
2
3
4
5
Nu
mb
er o
f S
hip
General Services Days
3rd Group- Tug boat & Other Ships
(Number of Ships)
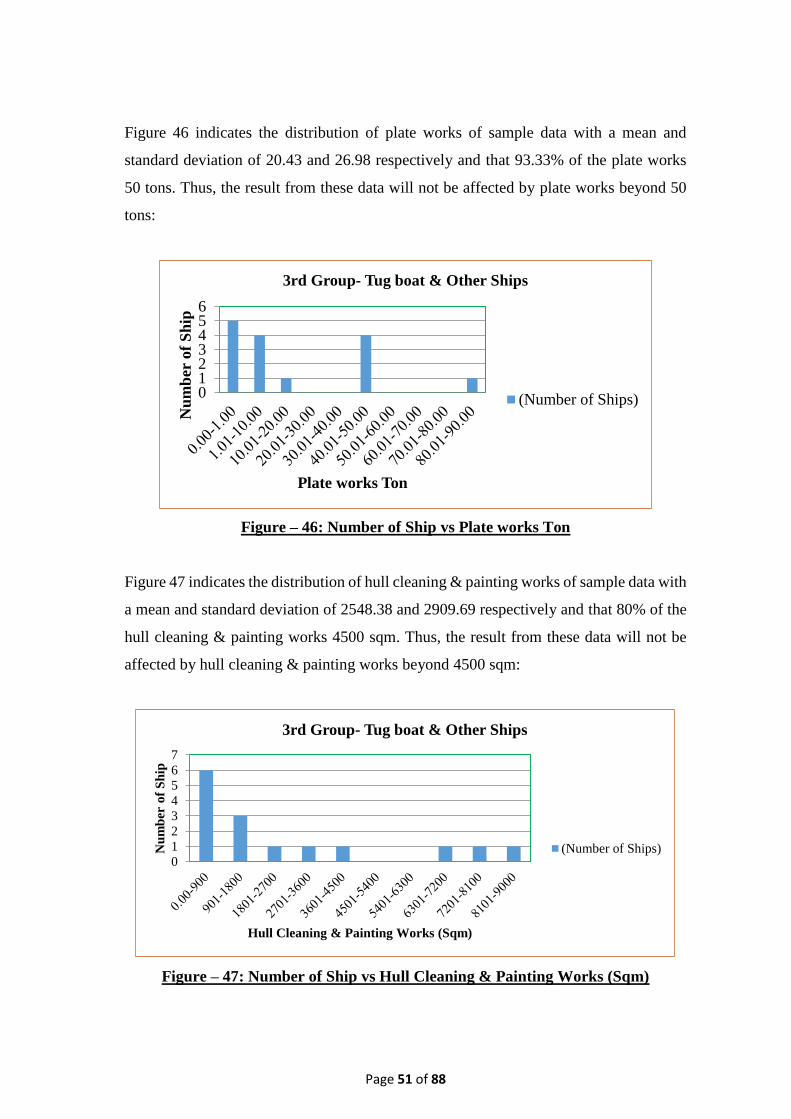
Page 51 of 88
Figure 46 indicates the distribution of plate works of sample data with a mean and
standard deviation of 20.43 and 26.98 respectively and that 93.33% of the plate works
50 tons. Thus, the result from these data will not be affected by plate works beyond 50
tons:
Figure – 46: Number of Ship vs Plate works Ton
Figure 47 indicates the distribution of hull cleaning & painting works of sample data with
a mean and standard deviation of 2548.38 and 2909.69 respectively and that 80% of the
hull cleaning & painting works 4500 sqm. Thus, the result from these data will not be
affected by hull cleaning & painting works beyond 4500 sqm:
Figure – 47: Number of Ship vs Hull Cleaning & Painting Works (Sqm)
0123456
Nu
mb
er o
f S
hip
Plate works Ton
3rd Group- Tug boat & Other Ships
(Number of Ships)
0
1
2
3
4
5
6
7
Nu
mb
er o
f S
hip
Hull Cleaning & Painting Works (Sqm)
3rd Group- Tug boat & Other Ships
(Number of Ships)

Page 52 of 88
Figure 48 indicates the distribution of piping works of sample data with a mean and
standard deviation of 103.30 and 132.25 respectively and that 86.67% of the piping
works 270 rm. Thus, the result from these data will not be affected by piping works
beyond 270 rm:
Figure – 48: Number of Ship vs Piping (Rm)
Figure 49 indicates the distribution of underwater fittings works of sample data with a
mean and standard deviation of 48.67 and 33.92 respectively and states that 86.67% of
the underwater fittings works 77 nos. Thus, the result from these data will not be affected
by underwater fittings works beyond 77 nos:
Figure – 49: Number of Ship vs Under Water Fittings (Nos)
02468
Nu
mb
er o
f S
hip
Piping (Rm)
3rd Group- Tug boat & Other Ships
(Number of Ships)
0
1
2
3
4
5
Nu
mb
er o
f S
hip
Under Water Fittings (Nos)
3rd Group- Tug boat & Other Ships
(Number of Ships)
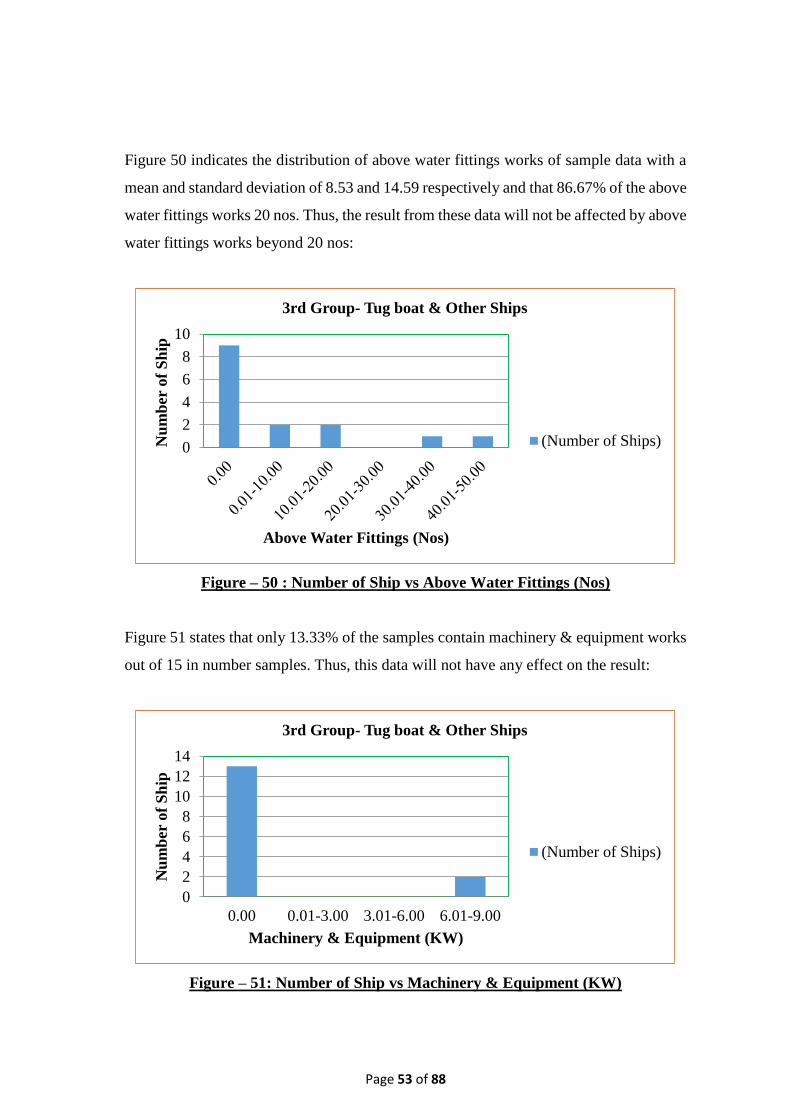
Page 53 of 88
Figure 50 indicates the distribution of above water fittings works of sample data with a
mean and standard deviation of 8.53 and 14.59 respectively and that 86.67% of the above
water fittings works 20 nos. Thus, the result from these data will not be affected by above
water fittings works beyond 20 nos:
Figure – 50 : Number of Ship vs Above Water Fittings (Nos)
Figure 51 states that only 13.33% of the samples contain machinery & equipment works
out of 15 in number samples. Thus, this data will not have any effect on the result:
Figure – 51: Number of Ship vs Machinery & Equipment (KW)
0
2
4
6
8
10
Nu
mb
er o
f S
hip
Above Water Fittings (Nos)
3rd Group- Tug boat & Other Ships
(Number of Ships)
0
2
4
6
8
10
12
14
0.00 0.01-3.00 3.01-6.00 6.01-9.00
Nu
mb
er o
f S
hip
Machinery & Equipment (KW)
3rd Group- Tug boat & Other Ships
(Number of Ships)
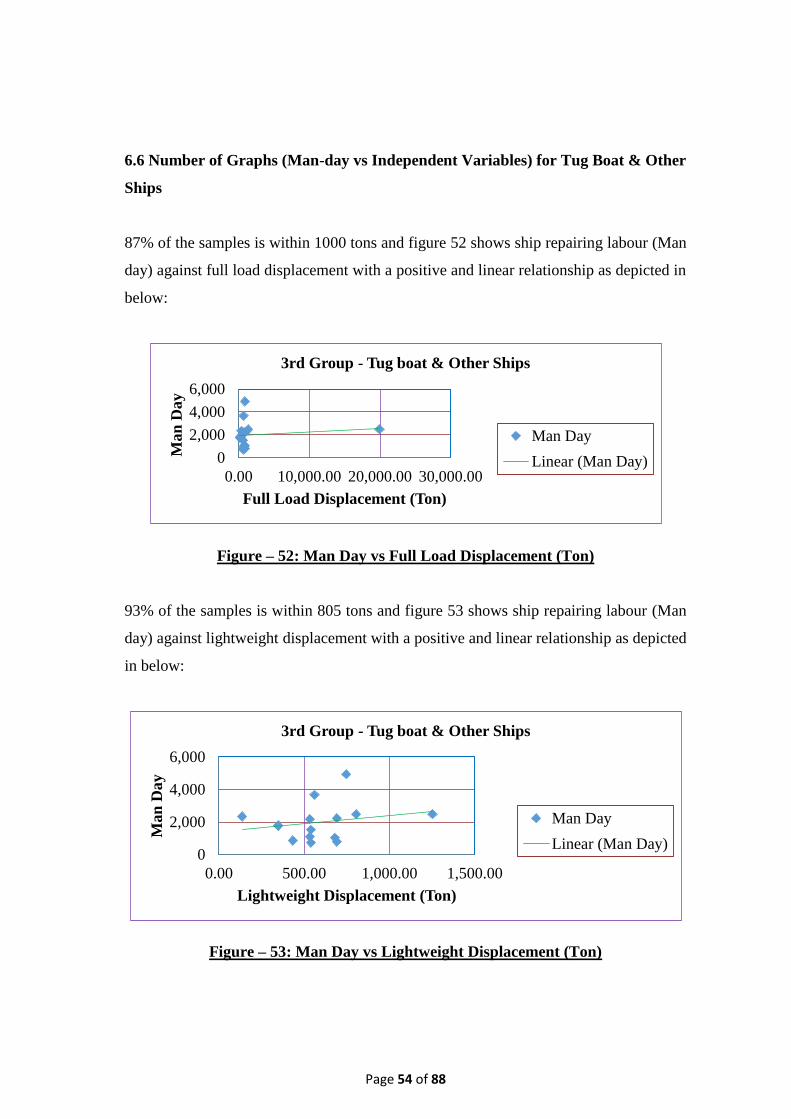
Page 54 of 88
6.6 Number of Graphs (Man-day vs Independent Variables) for Tug Boat & Other
Ships
87% of the samples is within 1000 tons and figure 52 shows ship repairing labour (Man
day) against full load displacement with a positive and linear relationship as depicted in
below:
Figure – 52: Man Day vs Full Load Displacement (Ton)
93% of the samples is within 805 tons and figure 53 shows ship repairing labour (Man
day) against lightweight displacement with a positive and linear relationship as depicted
in below:
Figure – 53: Man Day vs Lightweight Displacement (Ton)
0
2,000
4,000
6,000
0.00 10,000.00 20,000.00 30,000.00
Man
Day
Full Load Displacement (Ton)
3rd Group - Tug boat & Other Ships
Man Day
Linear (Man Day)
0
2,000
4,000
6,000
0.00 500.00 1,000.00 1,500.00
Man
Day
Lightweight Displacement (Ton)
3rd Group - Tug boat & Other Ships
Man Day
Linear (Man Day)
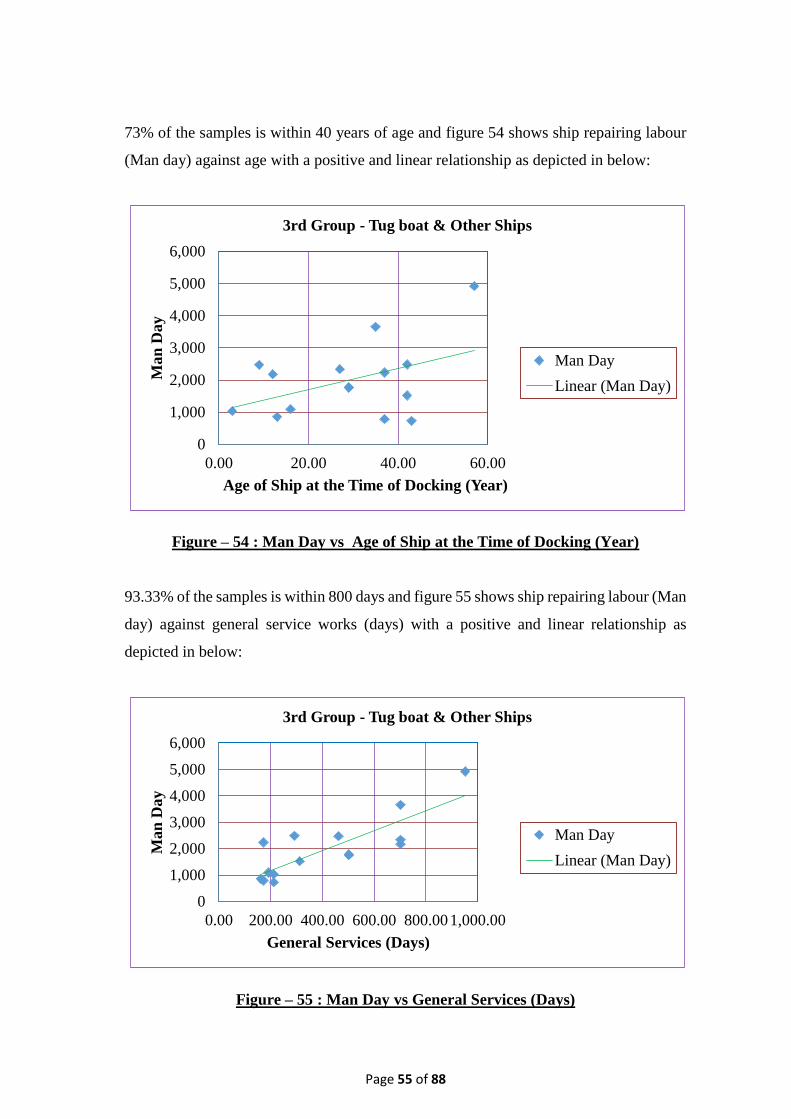
Page 55 of 88
73% of the samples is within 40 years of age and figure 54 shows ship repairing labour
(Man day) against age with a positive and linear relationship as depicted in below:
Figure – 54 : Man Day vs Age of Ship at the Time of Docking (Year)
93.33% of the samples is within 800 days and figure 55 shows ship repairing labour (Man
day) against general service works (days) with a positive and linear relationship as
depicted in below:
Figure – 55 : Man Day vs General Services (Days)
0
1,000
2,000
3,000
4,000
5,000
6,000
0.00 20.00 40.00 60.00
Ma
n D
ay
Age of Ship at the Time of Docking (Year)
3rd Group - Tug boat & Other Ships
Man Day
Linear (Man Day)
0
1,000
2,000
3,000
4,000
5,000
6,000
0.00 200.00 400.00 600.00 800.001,000.00
Man
Day
General Services (Days)
3rd Group - Tug boat & Other Ships
Man Day
Linear (Man Day)
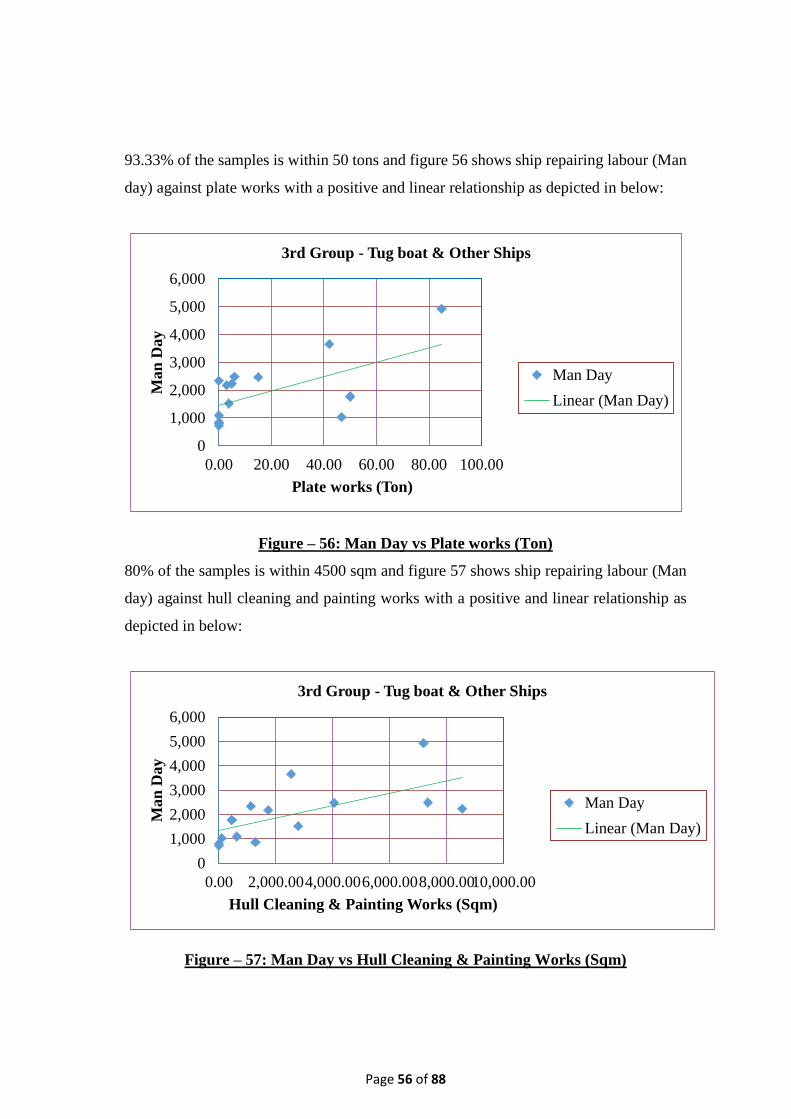
Page 56 of 88
93.33% of the samples is within 50 tons and figure 56 shows ship repairing labour (Man
day) against plate works with a positive and linear relationship as depicted in below:
Figure – 56: Man Day vs Plate works (Ton)
80% of the samples is within 4500 sqm and figure 57 shows ship repairing labour (Man
day) against hull cleaning and painting works with a positive and linear relationship as
depicted in below:
Figure – 57: Man Day vs Hull Cleaning & Painting Works (Sqm)
0
1,000
2,000
3,000
4,000
5,000
6,000
0.00 20.00 40.00 60.00 80.00 100.00
Ma
n D
ay
Plate works (Ton)
3rd Group - Tug boat & Other Ships
Man Day
Linear (Man Day)
0
1,000
2,000
3,000
4,000
5,000
6,000
0.00 2,000.004,000.006,000.008,000.0010,000.00
Man
Day
Hull Cleaning & Painting Works (Sqm)
3rd Group - Tug boat & Other Ships
Man Day
Linear (Man Day)

Page 57 of 88
86.67% of the samples is within 270 rm and figure 58 shows ship repairing labour (Man
day) against piping works with a positive and linear relationship as depicted in below:
Figure – 58: Man Day vs Piping (Rm)
86.67% of the samples is within 77 nos and figure 59 shows ship repairing labour (Man
day) against underwater fitting works with a positive and linear relationship as depicted
in below:
Figure – 59: Man Day vs Under Water Fittings (Nos)
0
1,000
2,000
3,000
4,000
5,000
6,000
0.00 100.00 200.00 300.00 400.00 500.00
Ma
n D
ay
Piping (Rm)
3rd Group - Tug boat & Other Ships
Man Day
Linear (Man Day)
0
1,000
2,000
3,000
4,000
5,000
6,000
0.00 50.00 100.00 150.00
Man
Day
Under Water Fittings (Nos)
3rd Group - Tug boat & Other Ships
Man Day
Linear (Man Day)

Page 58 of 88
86.67% of the samples is within 20 nos and figure 60 shows ship repairing labour (Man
day) against above water fitting works with a positive and linear relationship as depicted
in below:
Figure – 60: Man Day vs Above Water Fittings (Nos)
13.33% of the samples forms data among out of 15 in number samples. That’s why, less
significant positive relationship exists between ship repairing labour (Man day) and
machinery & equipment as shown in figure 61 below:
Figure – 61: Man Day vs Machinery & Equipment (KW)
0
1,000
2,000
3,000
4,000
5,000
6,000
0.00 10.00 20.00 30.00 40.00 50.00
Ma
n D
ay
Above Water Fittings (Nos)
3rd Group - Tug boat & Other Ships
Man Day
Linear (Man Day)
0
1,000
2,000
3,000
4,000
5,000
6,000
0.00 2.00 4.00 6.00 8.00
Ma
n D
ay
Machinery & Equipment (KW)
3rd Group - Tug boat & Other Ships
Man Day
Linear (Man Day)
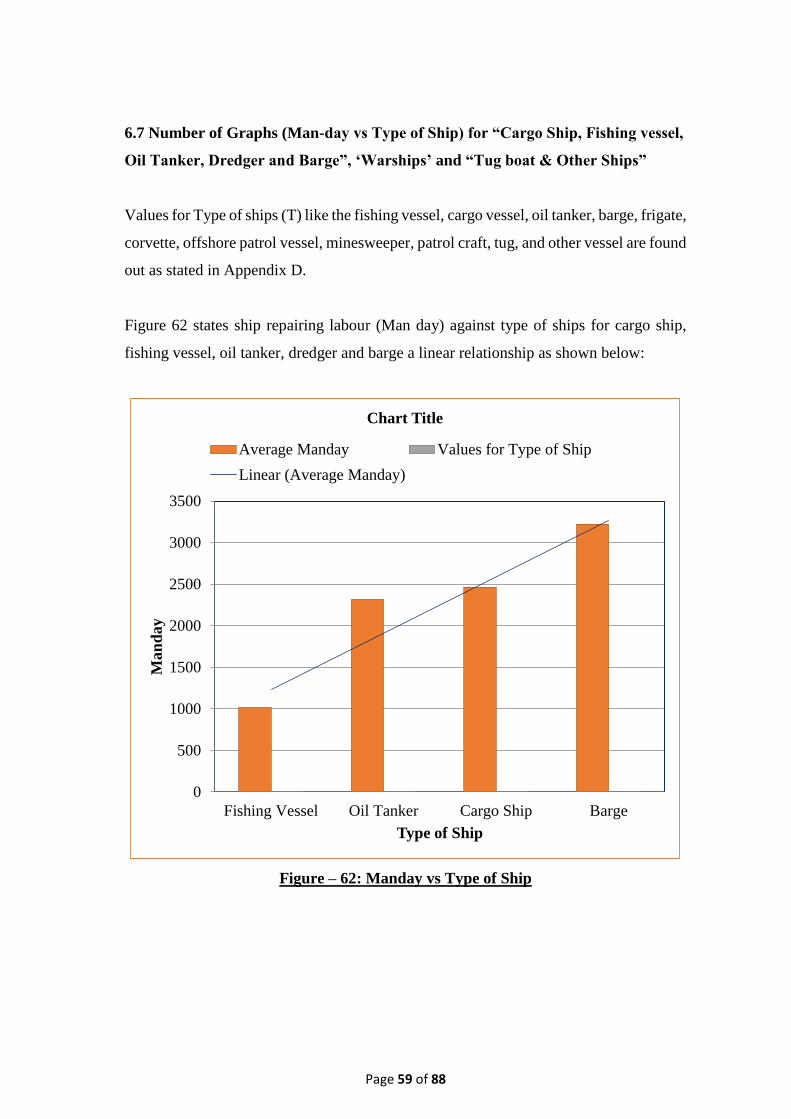
Page 59 of 88
6.7 Number of Graphs (Man-day vs Type of Ship) for “Cargo Ship, Fishing vessel,
Oil Tanker, Dredger and Barge”, ‘Warships’ and “Tug boat & Other Ships”
Values for Type of ships (T) like the fishing vessel, cargo vessel, oil tanker, barge, frigate,
corvette, offshore patrol vessel, minesweeper, patrol craft, tug, and other vessel are found
out as stated in Appendix D.
Figure 62 states ship repairing labour (Man day) against type of ships for cargo ship,
fishing vessel, oil tanker, dredger and barge a linear relationship as shown below:
Figure – 62: Manday vs Type of Ship
0
500
1000
1500
2000
2500
3000
3500
Fishing Vessel Oil Tanker Cargo Ship Barge
Man
day
Type of Ship
Chart Title
Average Manday Values for Type of Ship
Linear (Average Manday)

Page 60 of 88
Figure 63 indicates ship repairing labour (Man day) against type of ships for warships a
linear relationship as shown below:
Figure – 63: Manday vs Type of Ship
Figure 64 shows ship repairing labour (Man day) against type of ships for tug boat &
other ships a linear relationship as follows:
Figure – 64: Man day vs Type of Ship
0
200
400
600
800
1000
1200
1400
Patrol Craft Offshore Partol Vessel Frigate/ Corvate
Man
day
Type of Ship
Chart Title
Average Manday Values for Type of Ship
Linear (Average Manday)
0
500
1000
1500
2000
2500
Tug Other
Man
day
Type of Ship
Chart Title
Average Manday Values for Type of Ship
Linear (Average Manday)

Page 61 of 88
CHAPTER VII
Analysis, Results and Discussion
7.1 Correlation Coefficient (r) and Coefficient of Multiple Determination (R2)
Mathematically, correlation coefficient (r) and coefficient of multiple determination (R2)
are the ratios of the explained variation to the total variation in dependent variable
accounted for the change in independent variables. Each one’s value lie between -1 to
+1. Plus sign and minus sign indicate the nature of the linear co-relationship in the form
of positive slope and negative slope respectively. Values 0 and 1 indicate no linear
relationship and perfect linear/ straight-line relationship respectively. Value other than 0
and 1 measures the degree of relationship of variables of the derived model. Values of
the correlation coefficient for “Cargo ships, oil tankers, fishing vessel and dredgers”,
‘Warships’, and “Tugboat and other ships” are enumerated in the following tables:
Table 2 – Correlation Coefficient - 1st Group - Cargo Ship + Oil Tanker +
Fishing Vessel + Dredger
Ser Variables Correlation
Coefficient
(r)
Relationship
1. Man day vs Full Load
Displacement
0.424123641 Uphill (positive) linear
relationship exists
2. Man day vs Lightweight
Displacement
0.339735537 Uphill (positive) linear
relationship exists
3. Man day vs Deadweight
Tonnage
0.449541112 Uphill (positive) linear
relationship exists
4. Man day vs Age of
Docking
0.202820912 Uphill (positive) linear
relationship exists
5. Man day vs General
Services
0.756638038 Uphill (positive) linear
relationship exists
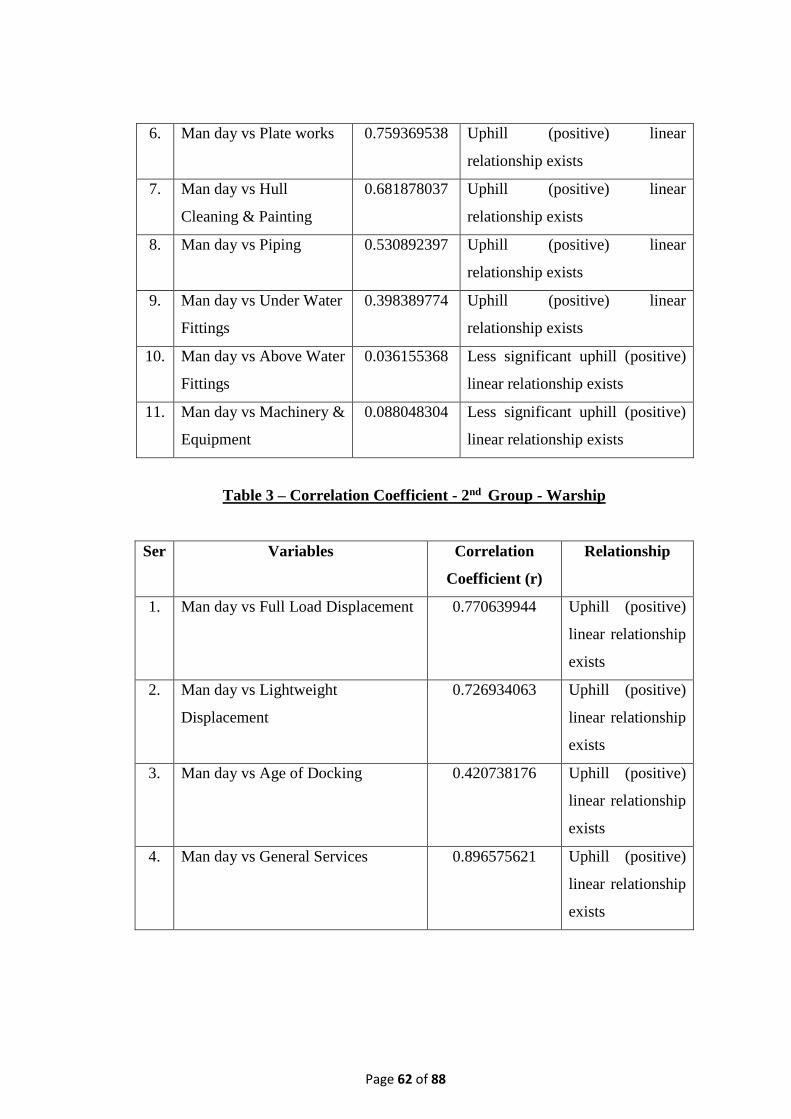
Page 62 of 88
6. Man day vs Plate works 0.759369538 Uphill (positive) linear
relationship exists
7. Man day vs Hull
Cleaning & Painting
0.681878037 Uphill (positive) linear
relationship exists
8. Man day vs Piping 0.530892397 Uphill (positive) linear
relationship exists
9. Man day vs Under Water
Fittings
0.398389774 Uphill (positive) linear
relationship exists
10. Man day vs Above Water
Fittings
0.036155368 Less significant uphill (positive)
linear relationship exists
11. Man day vs Machinery &
Equipment
0.088048304 Less significant uphill (positive)
linear relationship exists
Table 3 – Correlation Coefficient - 2nd Group - Warship
Ser Variables Correlation
Coefficient (r)
Relationship
1. Man day vs Full Load Displacement 0.770639944 Uphill (positive)
linear relationship
exists
2. Man day vs Lightweight
Displacement
0.726934063 Uphill (positive)
linear relationship
exists
3. Man day vs Age of Docking 0.420738176 Uphill (positive)
linear relationship
exists
4. Man day vs General Services 0.896575621 Uphill (positive)
linear relationship
exists
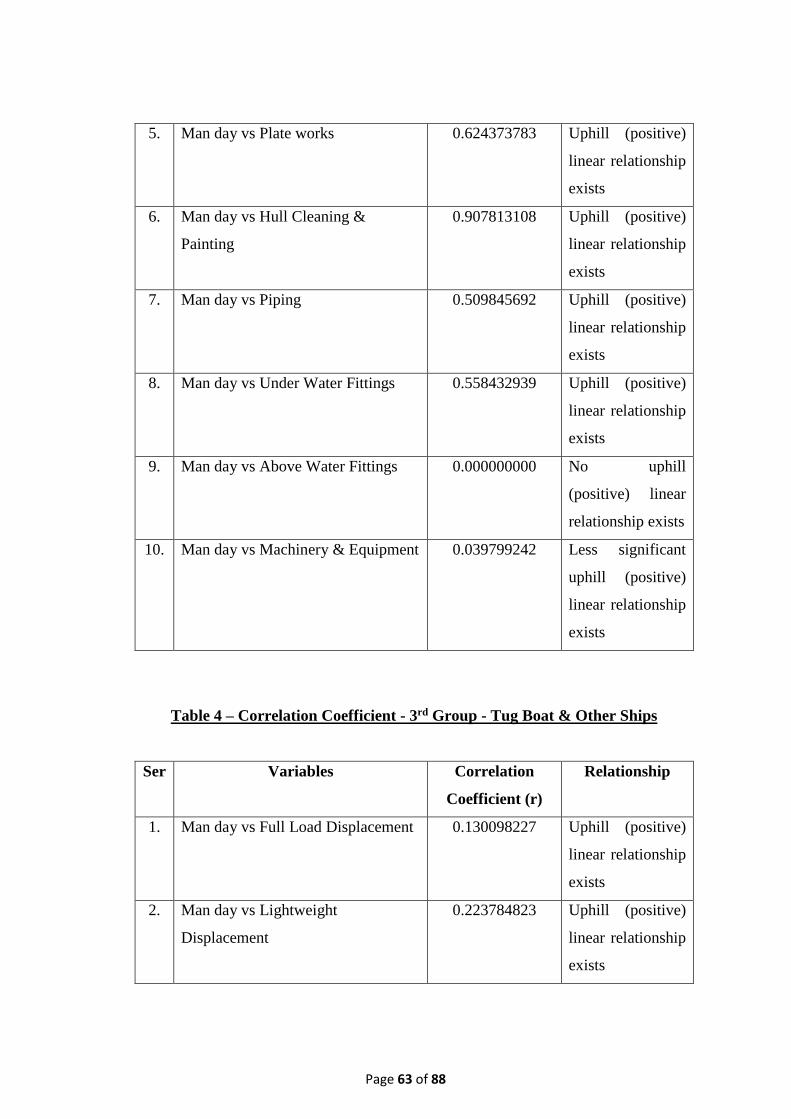
Page 63 of 88
5. Man day vs Plate works 0.624373783 Uphill (positive)
linear relationship
exists
6. Man day vs Hull Cleaning &
Painting
0.907813108 Uphill (positive)
linear relationship
exists
7. Man day vs Piping 0.509845692 Uphill (positive)
linear relationship
exists
8. Man day vs Under Water Fittings 0.558432939 Uphill (positive)
linear relationship
exists
9. Man day vs Above Water Fittings 0.000000000 No uphill
(positive) linear
relationship exists
10. Man day vs Machinery & Equipment 0.039799242 Less significant
uphill (positive)
linear relationship
exists
Table 4 – Correlation Coefficient - 3rd Group - Tug Boat & Other Ships
Ser Variables Correlation
Coefficient (r)
Relationship
1. Man day vs Full Load Displacement 0.130098227 Uphill (positive)
linear relationship
exists
2. Man day vs Lightweight
Displacement
0.223784823 Uphill (positive)
linear relationship
exists
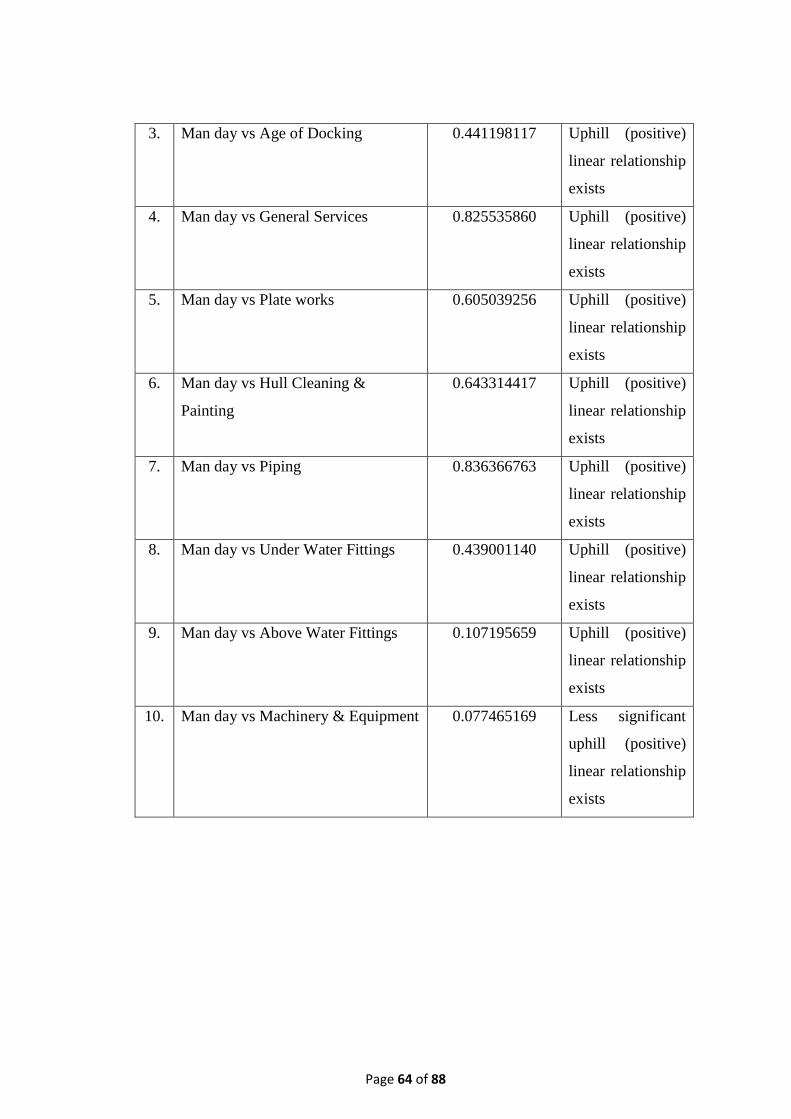
Page 64 of 88
3. Man day vs Age of Docking 0.441198117 Uphill (positive)
linear relationship
exists
4. Man day vs General Services 0.825535860 Uphill (positive)
linear relationship
exists
5. Man day vs Plate works 0.605039256 Uphill (positive)
linear relationship
exists
6. Man day vs Hull Cleaning &
Painting
0.643314417 Uphill (positive)
linear relationship
exists
7. Man day vs Piping 0.836366763 Uphill (positive)
linear relationship
exists
8. Man day vs Under Water Fittings 0.439001140 Uphill (positive)
linear relationship
exists
9. Man day vs Above Water Fittings 0.107195659 Uphill (positive)
linear relationship
exists
10. Man day vs Machinery & Equipment 0.077465169 Less significant
uphill (positive)
linear relationship
exists
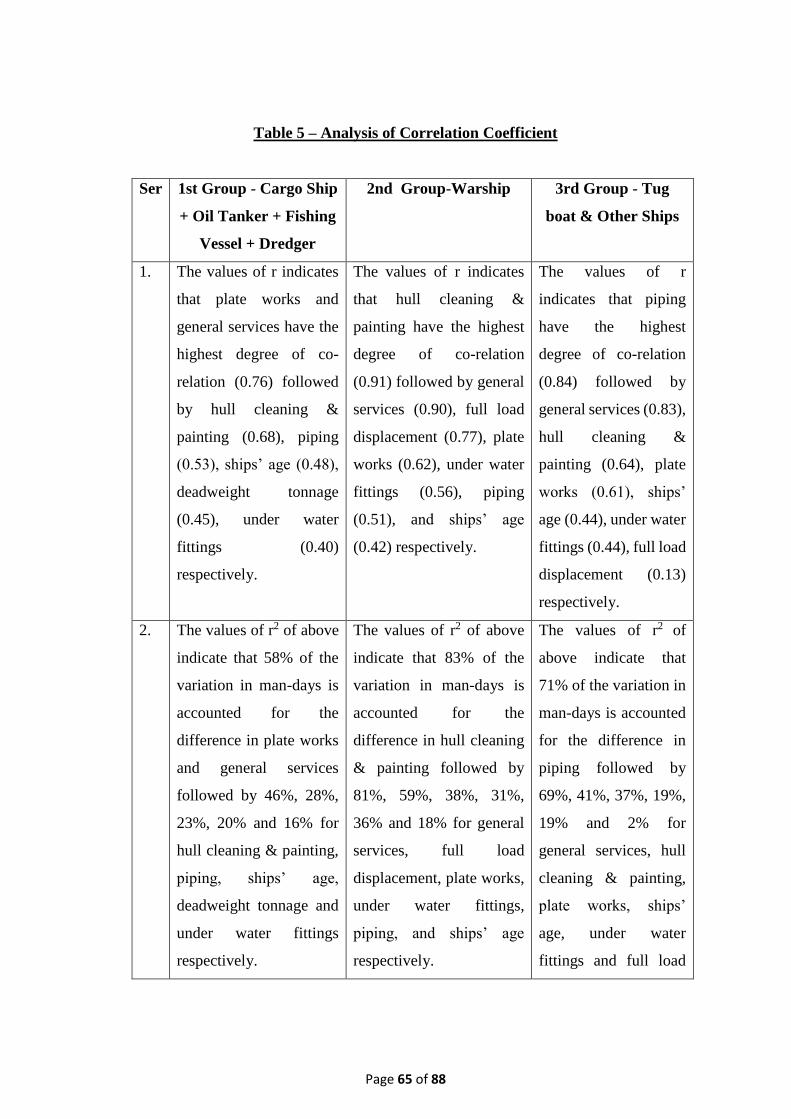
Page 65 of 88
Table 5 – Analysis of Correlation Coefficient
Ser 1st Group - Cargo Ship
+ Oil Tanker + Fishing
Vessel + Dredger
2nd Group-Warship 3rd Group - Tug
boat & Other Ships
1. The values of r indicates
that plate works and
general services have the
highest degree of co-
relation (0.76) followed
by hull cleaning &
painting (0.68), piping
(0.53), ships’ age (0.48),
deadweight tonnage
(0.45), under water
fittings (0.40)
respectively.
The values of r indicates
that hull cleaning &
painting have the highest
degree of co-relation
(0.91) followed by general
services (0.90), full load
displacement (0.77), plate
works (0.62), under water
fittings (0.56), piping
(0.51), and ships’ age
(0.42) respectively.
The values of r
indicates that piping
have the highest
degree of co-relation
(0.84) followed by
general services (0.83),
hull cleaning &
painting (0.64), plate
works (0.61), ships’
age (0.44), under water
fittings (0.44), full load
displacement (0.13)
respectively.
2. The values of r2 of above
indicate that 58% of the
variation in man-days is
accounted for the
difference in plate works
and general services
followed by 46%, 28%,
23%, 20% and 16% for
hull cleaning & painting,
piping, ships’ age,
deadweight tonnage and
under water fittings
respectively.
The values of r2 of above
indicate that 83% of the
variation in man-days is
accounted for the
difference in hull cleaning
& painting followed by
81%, 59%, 38%, 31%,
36% and 18% for general
services, full load
displacement, plate works,
under water fittings,
piping, and ships’ age
respectively.
The values of r2 of
above indicate that
71% of the variation in
man-days is accounted
for the difference in
piping followed by
69%, 41%, 37%, 19%,
19% and 2% for
general services, hull
cleaning & painting,
plate works, ships’
age, under water
fittings and full load

Page 66 of 88
Ser 1st Group - Cargo Ship
+ Oil Tanker + Fishing
Vessel + Dredger
2nd Group-Warship 3rd Group - Tug
boat & Other Ships
displacement
respectively.
7.2 Regression Equations
7.2.1 Cargo Ships, Oil Tankers, Fishing Vessel and Dredgers
Symbolizing deadweight as SD in regression multiple regression, final regression
equation for the ship repairing labour (man-days) for cargo ships, oil tankers, fishing
vessel and dredgers is as follows:
Y=(-256.99)+(-0.0008)*SD+7.27*A+120.55*T+4.25*GS+16.14*PL+0.07*HCP+2.46*P
+0.83*UWF+ 8.00*AWF+4.43*ME
In the regression equation, all the variables have the similar sign as assumed except the
deadweight (SD). Ships’ age, type of ship, general service works, plate works, hull
cleaning & painting works, piping works, above water fitting works, underwater fitting
works and machinery & equipment works) have the positive and significant impact on
the ship repairing labour (man-days). Positive values of the respective partial regression
coefficients of these independent variables show that the bigger these parameters, the
more the labour cost needed for these repair works. Expected change in labor cost is high
for a small unit change in above water fitting works and machinery & equipment works.
This is very likely, since above water fittings (for example, fishing gears, cranes,
bollards, anchors and chain cables etc) and machinery & equipment of cargo ships, oil
tankers, fishing vessel and dredgers are maintained on a daily basis by crews because of
cargo handling/fishing. That is why above water fittings and machinery & equipment do
not normally need repair in dry dock other than major repair of the same. And when
major repair is done, it involves comparatively more labour cost than other type of repair
works.

Page 67 of 88
Co-efficient of deadweight tonnage becomes negative. This goes against the hypothesis.
It appears that deadweight tonnage does not have positive impact on labour cost. Some
reasons for the same are as follows, which is mainly incomprehensive inclusion of repair
works reflecting disproportional/ unexpected volume of repair works vis-à-vis different
deadweight tonnages:
i ) Repair cost at CDDL is the highest compared to that of other shipyards
in Bangladesh. This is so, because foreign vessels are repaired here for which
repair bills are paid in foreign currency. Such condition dictate CDDL to set the
“Tariff Chart” for repair of ships in line with the “Tariff Chart” of the foreign
shipyards (Singapore, Malaysia etc). But strictly speaking, labour is very cheap
in Bangladesh in comparison with that of other countries. Now most of the cargo
ships, oil tankers, fishing vessels (except ships of Bangladesh Shipping
Corporation) coming for repair at CDDL belong to private owners. Irrespective
of high tariff for repair, still these private owners come to CDDL for ship repair
because of the quality of works. With a view to keep the repair budget minimum,
they try to carry out minimum repair works that is unavoidable due to
Classification Society’s mandatory requirements. Generally, these private
owners limit their repair works only to underwater parts of their ships. So, repair
works needed after certain period of time arising from the perspective of
deadweight tonnage do not surface up accurately. As such, the data of the
repaired ships do not reflect the real effect of deadweight tonnage. During repair
of ships, private owners ensure repair of those parts of ship that will hamper
watertight integrity if not repaired.
ii) Another factor is that the same ships are docked both at CDDL and at
other shipyards at different times. That means, either consecutive or every repair
of all these ships may not carried out at CDDL. Sometimes private owners carry
out repair of their ships in other shipyards as suited to their available time and
requirements of their business ventures at cheaper rates than that of CDDL.
Repair data of the ships (docked at CDDL) are taken in our study, but the repair
data of the same ships also docked at different times at other shipyards are

Page 68 of 88
missing in our analysis. This is another factor which is likely to contribute to the
negative influence of deadweight tonnage on labour cost.
iii) Another thing, sometimes private owners even don’t want to carry out
repair of something to the full extent. For example, in a portion of MS plate, some
pitting have developed. Rather than changing that portion of MS plate, they want
that those pitting holes to filled up by welding with welding rods. In such case,
less labour is involved them than of which would otherwise require to change the
whole portion of the plate. This has negative impact on labour cost.
The above reasoning appears to be realistic. Because when regression analysis is carried
out with only dependent variable (labour man-day) and independent variables
(deadweight, age, type of ship), then deadweight doesn’t become negative. When some
repair works (independent variables like general service works, plate works and hull
cleaning & painting works) are added in regression analysis, deadweight still remained
positive. But then starts appearing from negative when other independent variables like
piping, above water fittings, underwater fitting and machinery & equipment works are
added. These are reflected in the chronological regression equations of cargo ships, oil
tankers, fishing vessel and dredgers:
Y=1350.56+0.10*SD
Y=845.02+0.09*SD+23.38*A
Y= (-324.08) +0.05*SD+24.88*A+707.56*T
Y=(-1255.98)+0.03*SD+12.03*A+409.19*T+7.87*GS
Y=(-280.93)+0.05*SD+5.42*A+200.16*T+4.75*GS+25.27*PL
Y=(-188.72)+0.006*SD+3.22*A+136.5*T+4.56*GS+20.9*PL+0.07*HCP
Y=(-266.62)+(-0.0003)*SD+7.29*A+144.98*T+4.42*GS+15.42*PL+0.07*HCP
+2.38*P
Y=(-256.84)+(-0.0015)*SD+7.46*A+125.17*T+4.22*GS+16.12*PL+0.07*HCP
+2.46*P+0.83*UWF
Y=(-254.13)+(-0.0009)*SD+7.26*A+119.66*T+4.25*GS+16.14*PL+0.07*HCP
+2.46*P+0.83* UWF+8*AWF
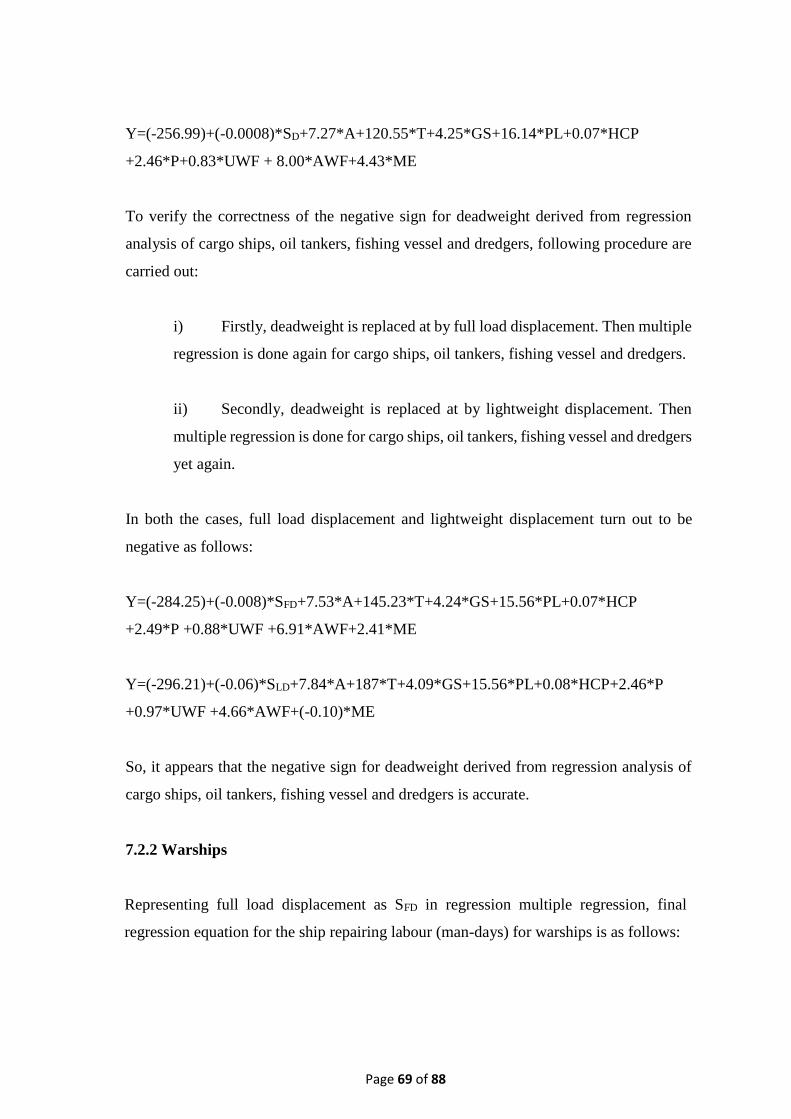
Page 69 of 88
Y=(-256.99)+(-0.0008)*SD+7.27*A+120.55*T+4.25*GS+16.14*PL+0.07*HCP
+2.46*P+0.83*UWF + 8.00*AWF+4.43*ME
To verify the correctness of the negative sign for deadweight derived from regression
analysis of cargo ships, oil tankers, fishing vessel and dredgers, following procedure are
carried out:
i) Firstly, deadweight is replaced at by full load displacement. Then multiple
regression is done again for cargo ships, oil tankers, fishing vessel and dredgers.
ii) Secondly, deadweight is replaced at by lightweight displacement. Then
multiple regression is done for cargo ships, oil tankers, fishing vessel and dredgers
yet again.
In both the cases, full load displacement and lightweight displacement turn out to be
negative as follows:
Y=(-284.25)+(-0.008)*SFD+7.53*A+145.23*T+4.24*GS+15.56*PL+0.07*HCP
+2.49*P +0.88*UWF +6.91*AWF+2.41*ME
Y=(-296.21)+(-0.06)*SLD+7.84*A+187*T+4.09*GS+15.56*PL+0.08*HCP+2.46*P
+0.97*UWF +4.66*AWF+(-0.10)*ME
So, it appears that the negative sign for deadweight derived from regression analysis of
cargo ships, oil tankers, fishing vessel and dredgers is accurate.
7.2.2 Warships
Representing full load displacement as SFD in regression multiple regression, final
regression equation for the ship repairing labour (man-days) for warships is as follows:

Page 70 of 88
Y= (-116.09) +0.05*SFD+ (-0.48)*A+ 172.73*T+ 2.65*GS+ 22.54*PL+ 0.12*HCP+
1.88*P + 3.12*UWF+ 0.00*AWF+ (-1.66)*ME
In the regression equation, all the variables have the positive sign as hypothesized except
age (A) and machinery & equipment (ME). Co-efficients of age (A) and machinery &
equipment (ME) become negative, which is contrary to the hypothesis.
Warship has different connotation than other types of ships. Above water fittings of
warships mostly consist of weapons and armaments beside anchor and chain cables.
Above water fittings of a warship are maintained on a daily basis at the highest order of
excellence by naval crews as per standard norms and practices of defence service. This
is evident in collected data of above water fittings of warships while under repair in dry
dock, which is nil. As such, it does not contribute anything to labour cost.
The probable reason for the negative sign for machinery & equipment could be the less
quantity of works. Because out of all machinery & equipment, most of the equipment are
related to weapons and armaments system. As these equipment are maintained on a daily
basis like weapons and armaments as stated above and hence don’t need major repair at
dock. Other maximum machinery & equipment are repaired with extreme care at
dockyard of Bangladesh Navy. This is clearly visible in collected data of machinery &
equipment for repair at CDDL.
Bangladesh Navy has its own floating dock and dockyard. Bangladesh Navy maintains
“Refit and Docking Plan” for all of its warships and carries out docking and repair of the
warships as per that plan in its own floating dock. When number of warships awaiting
refit and docking at any point of time become more than that of which can be scheduled
and accommodated at its own floating dock, then Bangladesh Navy plans to dock those
extra unscheduled warships at Chittagong Dry Dock Ltd, Khulna Shipyard Ltd and
Dockyard Engineering Works Ltd, Narayanganj. As a consequence of this factor, the
data for some warships at CDDL taken in this study does reflect the chronological and
comprehensive repair data of the particular warship. Moreover, most importantly,
warships are expensive as most of the warships are purchased from foreign country. So,
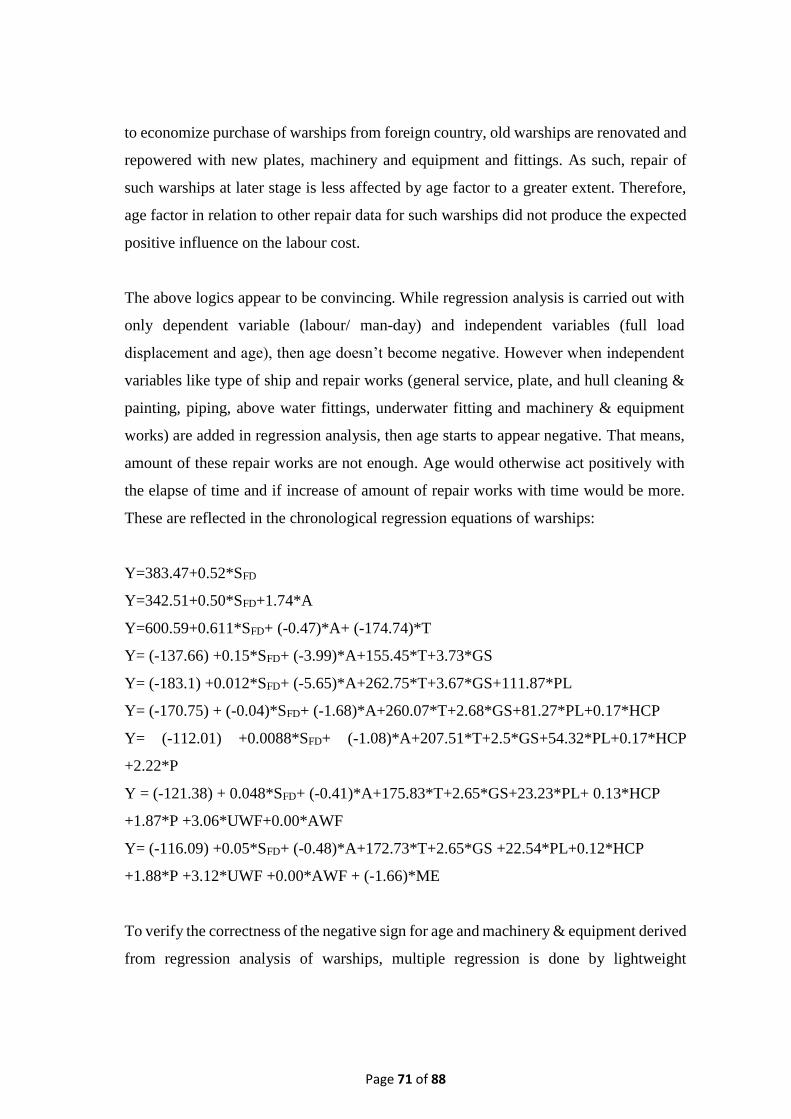
Page 71 of 88
to economize purchase of warships from foreign country, old warships are renovated and
repowered with new plates, machinery and equipment and fittings. As such, repair of
such warships at later stage is less affected by age factor to a greater extent. Therefore,
age factor in relation to other repair data for such warships did not produce the expected
positive influence on the labour cost.
The above logics appear to be convincing. While regression analysis is carried out with
only dependent variable (labour/ man-day) and independent variables (full load
displacement and age), then age doesn’t become negative. However when independent
variables like type of ship and repair works (general service, plate, and hull cleaning &
painting, piping, above water fittings, underwater fitting and machinery & equipment
works) are added in regression analysis, then age starts to appear negative. That means,
amount of these repair works are not enough. Age would otherwise act positively with
the elapse of time and if increase of amount of repair works with time would be more.
These are reflected in the chronological regression equations of warships:
Y=383.47+0.52*SFD
Y=342.51+0.50*SFD+1.74*A
Y=600.59+0.611*SFD+ (-0.47)*A+ (-174.74)*T
Y= (-137.66) +0.15*SFD+ (-3.99)*A+155.45*T+3.73*GS
Y= (-183.1) +0.012*SFD+ (-5.65)*A+262.75*T+3.67*GS+111.87*PL
Y= (-170.75) + (-0.04)*SFD+ (-1.68)*A+260.07*T+2.68*GS+81.27*PL+0.17*HCP
Y= (-112.01) +0.0088*SFD+ (-1.08)*A+207.51*T+2.5*GS+54.32*PL+0.17*HCP
+2.22*P
Y = (-121.38) + 0.048*SFD+ (-0.41)*A+175.83*T+2.65*GS+23.23*PL+ 0.13*HCP
+1.87*P +3.06*UWF+0.00*AWF
Y= (-116.09) +0.05*SFD+ (-0.48)*A+172.73*T+2.65*GS +22.54*PL+0.12*HCP
+1.88*P +3.12*UWF +0.00*AWF + (-1.66)*ME
To verify the correctness of the negative sign for age and machinery & equipment derived
from regression analysis of warships, multiple regression is done by lightweight
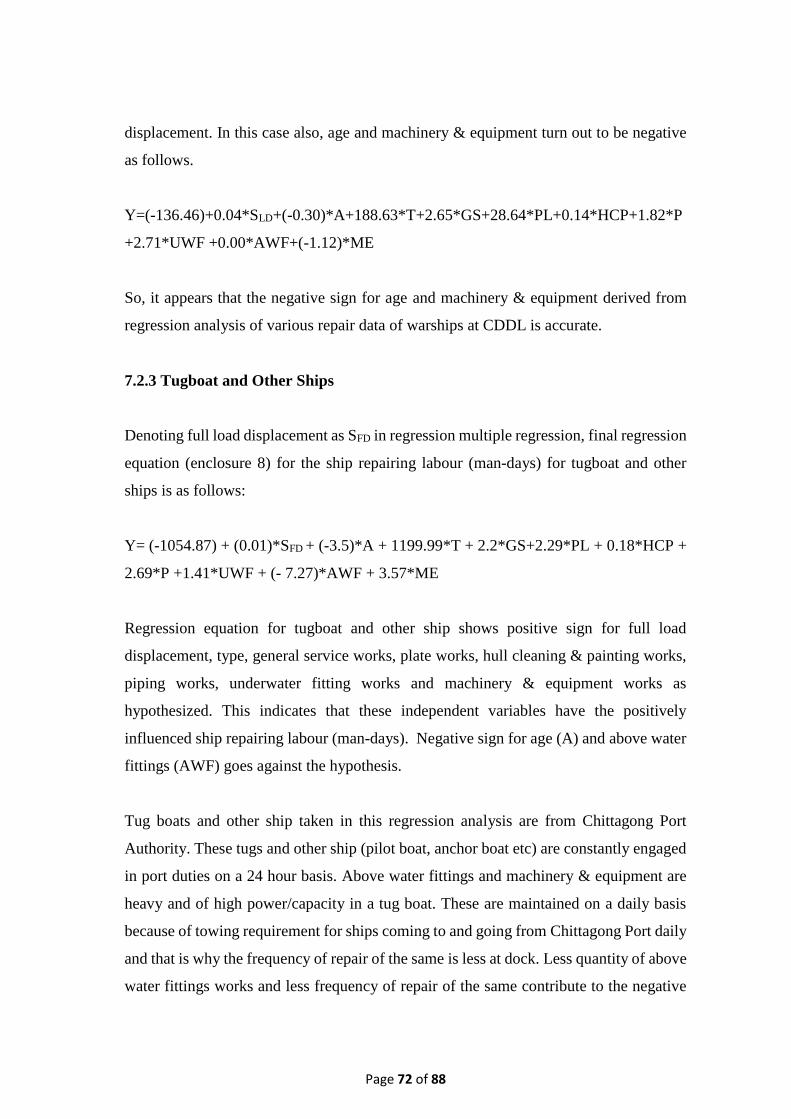
Page 72 of 88
displacement. In this case also, age and machinery & equipment turn out to be negative
as follows.
Y=(-136.46)+0.04*SLD+(-0.30)*A+188.63*T+2.65*GS+28.64*PL+0.14*HCP+1.82*P
+2.71*UWF +0.00*AWF+(-1.12)*ME
So, it appears that the negative sign for age and machinery & equipment derived from
regression analysis of various repair data of warships at CDDL is accurate.
7.2.3 Tugboat and Other Ships
Denoting full load displacement as SFD in regression multiple regression, final regression
equation (enclosure 8) for the ship repairing labour (man-days) for tugboat and other
ships is as follows:
Y= (-1054.87) + (0.01)*SFD + (-3.5)*A + 1199.99*T + 2.2*GS+2.29*PL + 0.18*HCP +
2.69*P +1.41*UWF + (- 7.27)*AWF + 3.57*ME
Regression equation for tugboat and other ship shows positive sign for full load
displacement, type, general service works, plate works, hull cleaning & painting works,
piping works, underwater fitting works and machinery & equipment works as
hypothesized. This indicates that these independent variables have the positively
influenced ship repairing labour (man-days). Negative sign for age (A) and above water
fittings (AWF) goes against the hypothesis.
Tug boats and other ship taken in this regression analysis are from Chittagong Port
Authority. These tugs and other ship (pilot boat, anchor boat etc) are constantly engaged
in port duties on a 24 hour basis. Above water fittings and machinery & equipment are
heavy and of high power/capacity in a tug boat. These are maintained on a daily basis
because of towing requirement for ships coming to and going from Chittagong Port daily
and that is why the frequency of repair of the same is less at dock. Less quantity of above
water fittings works and less frequency of repair of the same contribute to the negative

Page 73 of 88
sign for above water fittings in the regression equation. Besides, in most cases, the tugs,
pilot and anchor boats are repowered by total replacement of propulsion machinery.
Renovation is also done at same time. This is economic and contributes to life
enhancement of the old tugs, pilot and anchor boats and leads to less frequency of repair.
This factor leads to two outcome. Firstly, age factor doesn’t appear much effective in
influencing positively on labour cost. Secondly, expected change in labor cost is high for
a small unit change in machinery & equipment works.
The aforesaid explanation appears to be sensible. Because when regression analysis is
carried out with only dependent variable (labour man-day) and independent variables
(full load displacement, type of ship, general service works, plate works, hull cleaning
& painting works), then age doesn’t become negative. The same is logical since these
are jobs carried out at dock. But age starts affecting negatively on labour cost with elapse
of time when plate works reduce after renovation, but piping and underwater fitting
works added in less amount. Age continues to influence negatively on labour cost along
with negative impact of above water fittings works, while other independent variables
like piping and underwater fitting and machinery & equipment works in less amount are
added. Age would otherwise act positively with the elapse of time and if increase of
amount of repair works with time would be more. These are replicated in the
chronological regression equations of tugboat and other ships:
Y=1932.49+0.03*SFD
Y=1041.63+0.0071*SFD+32.58*A
Y=2.73+0.0034*SFD+31.69*A+905.91*T
Y=(-2477.24)+0.04*SFD+12.54*A+2069.59*T+3.8*GS
Y=(-2500.87)+0.044*SFD+10.57*A+2152.75*T+3.31*GS+8.61*PL
Y=(-992.52)+0.002*SFD+1.73*A+923.32*T+2.96*GS+7.27*PL+0.18*HCP
Y=(-827.77)+(-0.0002)*SFD+(-3.72)*A+1077.58*T+1.9*GS+3.05*PL+0.181*HCP
+3.27*P
Y=(-938.73)+(-0.0013)*SFD+(-2.77)*A+1129.16*T+1.92*GS+3.63*PL+0.17*HCP
+3.1*P +0.86*UWF

Page 74 of 88
Y=(-990.07)+(0.01)*SFD+(-3.44)*A+1148.59*T+2.19*GS+2.49*PL+0.18*HCP
+2.69*P+1.33*UWF+(-7.07)*AWF
Y=(-1054.87)+(0.01)*SFD+(-3.5)*A+1199.99*T+2.2*GS+2.29*PL+0.18*HCP+2.69*P
+1.41*UWF+(-7.27)*AWF+3.57*ME
7.2.4 Coefficient of Multiple Determination Considering All Independent Variables
Taking in to account all the independent variables, finishing regression equations for all
groups of ships pass the F-statistic test. For “Cargo ships, oil tankers, fishing vessel and
dredgers”, ‘Warships’, and “Tugboat and other ships”, the value of the coefficient of
multiple correlations (shown in the table below) are 0.86490138, 0.962035515 and
0.995611654 respectively, which can be considered amply safe:
Table 6 - Coefficient of Multiple Determination (R2)
Ser 1st Group - Cargo Ship
+ Oil Tanker + Fishing
Vessel + Dredger
2nd Group-Warship 3rd Group - Tug boat &
Other Ships
1. The value R =
0.930000742
(R2 = 0.86490138),
indicates the degree of the
relationship between the
independent variables like
ships’ age, deadweight,
type, general service
works, plate works, hull
cleaning & painting
works, piping works,
above water fitting works,
underwater fitting works
and machinery &
The value R =
0.980834092
(R2 = 0.962035515),
indicates the degree of
the relationship
between the
independent variables
like ships’ age, full load
displacement, type,
general service works,
plate works, hull
cleaning & painting
works, piping works,
above water fitting
The value R =
0.997803414
(R2 = 0.995611654),
indicates the degree of the
relationship between the
independent variables like
ships’ age, deadweight,
type, general service
works, plate works, hull
cleaning & painting works,
piping works, above water
fitting works, underwater
fitting works and
machinery & equipment

Page 75 of 88
Ser 1st Group - Cargo Ship
+ Oil Tanker + Fishing
Vessel + Dredger
2nd Group-Warship 3rd Group - Tug boat &
Other Ships
equipment works and the
dependent variable, man-
days in the multiple linear
regression models
assumed. On the other
hand, R2 = 0.86490138
indicates that about 86%
of the variation in man-
days is accounted for the
changes in ships’ age,
deadweight, type, general
service works, plate
works, hull cleaning &
painting works, piping
works, above water fitting
works, underwater fitting
works and machinery &
equipment works.
Remaining 14% is the
error of estimation.
works, underwater
fitting works and
machinery & equipment
works and the
dependent variable,
man-days in the
multiple linear
regression models
assumed. On the other
hand, R2 = 0.962035515
indicates that about
96% of the variation in
man-days is accounted
for the changes in ships’
age, full load
displacement, type,
general service works,
plate works, hull
cleaning & painting
works, piping works,
above water fitting
works, underwater
fitting works and
machinery & equipment
works. Remaining 4%
is the error of
estimation.
works and the dependent
variable, man-days in the
multiple linear regression
models assumed. On the
other hand, R2 =
0.995611654indicates that
about 99.56% of the
variation in man-days is
accounted for the changes
in ships’ age, deadweight,
type, general service
works, plate works, hull
cleaning & painting works,
piping works, above water
fitting works, underwater
fitting works and
machinery & equipment
works. Remaining 0.44%
is the error of estimation.

Page 76 of 88
Ser 1st Group - Cargo Ship
+ Oil Tanker + Fishing
Vessel + Dredger
2nd Group-Warship 3rd Group - Tug boat &
Other Ships
Note: Unexplained errors occurred for many reasons. One of them is the absence of one
or more independent variables that have a strong relationship with the dependent
variable.
It clarifies that for “Cargo ships, oil tankers, fishing vessel and dredgers”, ‘Warships’,
and “Tugboat and other ships”, 86%, 96% and 99.56% of the explained variation in the
dependent variable respectively are contributed to the change in the independent
variables and remaining 14%, 4% and 0.44% respectively are called the error of
estimation. Error of estimation is referred to statistically as error of the sum of squares
(SSE) or unexplained variation, which also reflects the variation about the regression
line. The variation behaves randomly or unpredictably (Murray, R.S. 1992). This error
of estimation occurs owing to the absence of one or more important independent
variables responsible for the change in the dependent variable. The coefficient of multiple
determination and the error of estimation are inter-related. For the lower value of the
coefficient of multiple determination, the error of estimation is more and vice versa.
7.2.5 Regression Coefficients and Other Statistical Parameters
The estimates of regression coefficients and other statistical parameters of the regression
equation during the process of adding new variables are shown in the following three
tables below. The primary measurement of the adequacy of the model is higher R2 value.
It can be seen from the tables that the successive inclusion of variables of the scope of
works in the model contributed higher R2 value.

Page 77 of 88
Table 7 - Statistical Parameter
Cargo, Fishing, Tanker & Barge with Deadweight
Mathematical Models Regression Coefficients Statistical Parameter
b0 b1 b2 b3 b4 b5 b6 b7 b8 b9 b10 Multiple
R R2
Adjusted
R2 F
Significanc
e
F
Y=f(SD) 1350.56 0.10 NA NA NA NA NA NA NA NA NA 0.4495 0.2021 0.1961 33.6849 4.51x10⁻⁸
Y=f(SD,A) 845.02 0.09 23.38 NA NA NA NA NA NA NA NA 0.4732 0.2239 0.2121 19.0380 5.44x10⁻⁸
Y=f(SD,A,T) -324.08 0.05 24.88 707.56 NA NA NA NA NA NA NA 0.5469 0.2991 0.2831 18.6343 3.97x10⁻¹⁰
Y=f(SD,A,T,GS) -1255.98 0.03 12.03 409.19 7.87 NA NA NA NA NA NA 0.8175 0.6682 0.6580 65.4650 3.17x10⁻³⁰
Y=f(SD,A,T,GS,PL) -280.93 0.05 5.42 200.16 4.75 25.27 NA NA NA NA NA 0.8960 0.8029 0.7952 105.0838 9.40x10-44
Y=f(SD,A,T,GS,PL,HCP) -188.72 0.006 3.22 136.5 4.56 20.9 0.07 NA NA NA NA 0.9133 0.8342 0.8264 107.3245 1.71x10-47
Y=f(SD,A,T,GS,PL,HCP,P) -266.62 -0.0003 7.29 144.98 4.42 15.42 0.07 2.38 NA NA NA 0.9289 0.8628 0.8552 114.0602 1.22x10-51
Y=f(SD,A,T,GS,PL,HCP,P,UWF) -256.84 -0.0015 7.46 125.17 4.22 16.12 0.07 2.46 0.83 NA NA 0.9298 0.8645 0.8559 100.4749 6.15x10-51
Y=f(SD,A,T,GS,PL,HCP,P,UWF,A
WF) -254.13 -0.0009 7.26 119.66 4.25 16.14 0.07 2.46 0.83 8.00 NA 0.9300 0.8649 0.8552 88.9123 5.29x10-50
Y=f(SD,A,T,GS,PL,HCP,P,UWF,A
WF,ME) -256.99 -0.0008 7.27 120.55 4.25 16.14 0.07 2.46 0.83 8.00 4.43 0.9300 0.8649 0.8540 79.3848 5.13x10-49
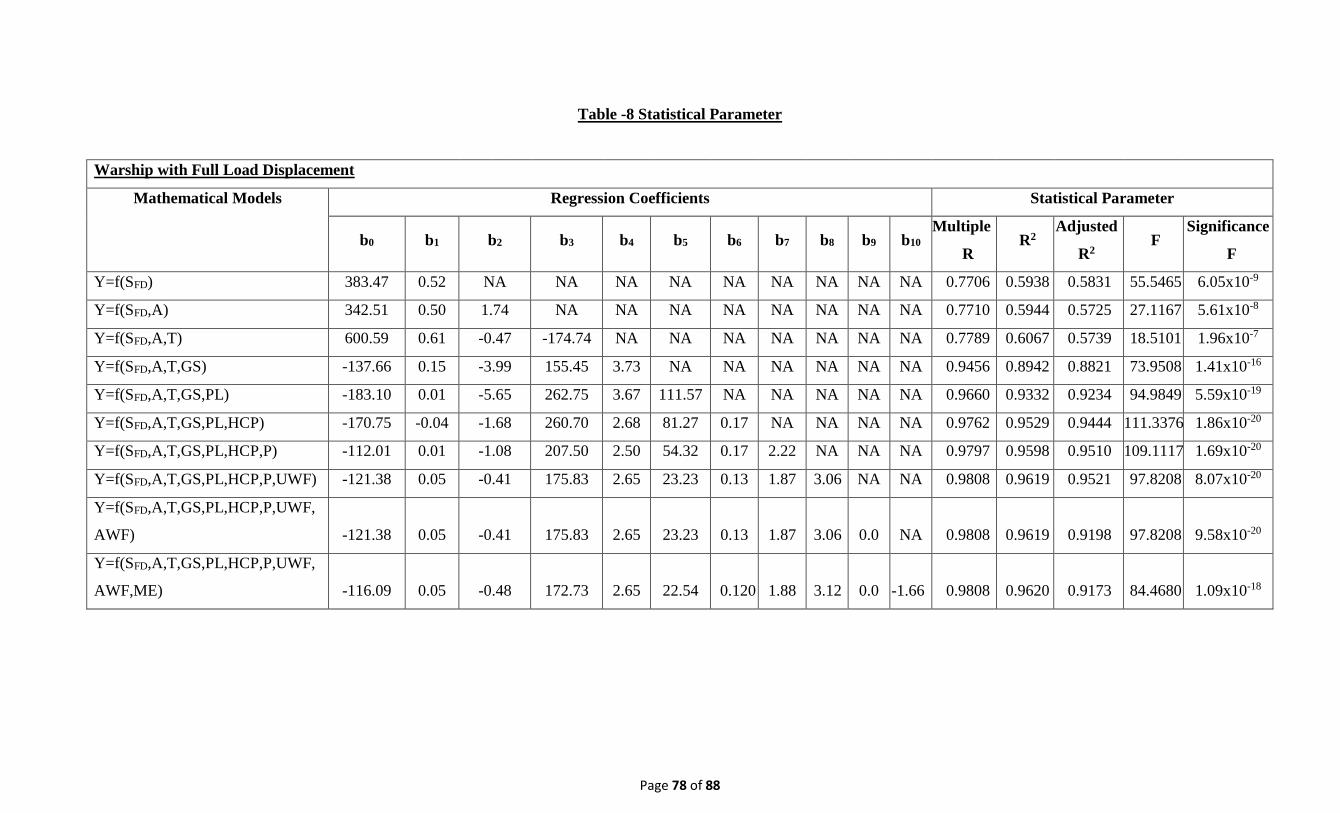
Page 78 of 88
Table -8 Statistical Parameter
Warship with Full Load Displacement
Mathematical Models Regression Coefficients Statistical Parameter
b0 b1 b2 b3 b4 b5 b6 b7 b8 b9 b10 Multiple
R R2
Adjusted
R2 F
Significance
F
Y=f(SFD) 383.47 0.52 NA NA NA NA NA NA NA NA NA 0.7706 0.5938 0.5831 55.5465 6.05x10⁻⁹
Y=f(SFD,A) 342.51 0.50 1.74 NA NA NA NA NA NA NA NA 0.7710 0.5944 0.5725 27.1167 5.61x10⁻⁸
Y=f(SFD,A,T) 600.59 0.61 -0.47 -174.74 NA NA NA NA NA NA NA 0.7789 0.6067 0.5739 18.5101 1.96x10⁻⁷
Y=f(SFD,A,T,GS) -137.66 0.15 -3.99 155.45 3.73 NA NA NA NA NA NA 0.9456 0.8942 0.8821 73.9508 1.41x10⁻¹⁶
Y=f(SFD,A,T,GS,PL) -183.10 0.01 -5.65 262.75 3.67 111.57 NA NA NA NA NA 0.9660 0.9332 0.9234 94.9849 5.59x10⁻¹⁹
Y=f(SFD,A,T,GS,PL,HCP) -170.75 -0.04 -1.68 260.70 2.68 81.27 0.17 NA NA NA NA 0.9762 0.9529 0.9444 111.3376 1.86x10⁻²⁰
Y=f(SFD,A,T,GS,PL,HCP,P) -112.01 0.01 -1.08 207.50 2.50 54.32 0.17 2.22 NA NA NA 0.9797 0.9598 0.9510 109.1117 1.69x10⁻²⁰
Y=f(SFD,A,T,GS,PL,HCP,P,UWF) -121.38 0.05 -0.41 175.83 2.65 23.23 0.13 1.87 3.06 NA NA 0.9808 0.9619 0.9521 97.8208 8.07x10⁻²⁰
Y=f(SFD,A,T,GS,PL,HCP,P,UWF,
AWF) -121.38 0.05 -0.41 175.83 2.65 23.23 0.13 1.87 3.06 0.0 NA 0.9808 0.9619 0.9198 97.8208 9.58x10⁻²⁰
Y=f(SFD,A,T,GS,PL,HCP,P,UWF,
AWF,ME) -116.09 0.05 -0.48 172.73 2.65 22.54 0.120 1.88 3.12 0.0 -1.66 0.9808 0.9620 0.9173 84.4680 1.09x10⁻¹⁸

Page 79 of 88
Table 9 - Statistical Parameter
Tug Boat & Other Ship with Full Load Displacement
Mathematical Models Regression Coefficients Statistical Parameter
b0 b1 b2 b3 b4 b5 b6 b7 b8 b9 b10 Multiple
R R2
Adjusted
R2 F
Significance
F
Y=f(SFD) 1932.49 0.03 NA NA NA NA NA NA NA NA NA 0.1301 0.0169 -0.0587 0.2238 6.44x10⁻¹
Y=f(SFD,A) 1041.63 0.0071 32.58 NA NA NA NA NA NA NA NA 0.4423 0.1956 0.0615 1.4590 2.71x10⁻¹
Y=f(SFD,A,T) 2.73 0.0034 31.69 905.91 NA NA NA NA NA NA NA 0.4509 0.2033 -0.0140 0.9355 4.56x10⁻¹
Y=f(SFD,A,T,GS) -2477.24 0.04 12.54 2069.59 3.8 NA NA NA NA NA NA 0.9055 0.8199 0.7478 11.3779 9.67x10⁻⁴
Y=f(SFD,A,T,GS,PL) -2500.87 0.044 10.57 2152.75 3.31 8.61 NA NA NA NA NA 0.9198 0.8461 0.7606 9.8954 1.86x10⁻³
Y=f(SFD,A,T,GS,PL,HCP) -992.52 0.002 1.73 923.32 2.96 7.27 0.18 NA NA NA NA 0.9797 0.9598 0.9296 31.8081 3.68x10⁻⁵
Y=f(SFD,A,T,GS,PL,HCP,P) -827.77 -0.0002 -3.72 1077.58 1.9 3.05 0.181 3.27 NA NA NA 0.9969 0.9939 0.9877 162.2517 3.31x10⁻⁷
Y=f(SFD,A,T,GS,PL,HCP,P,U
WF) -938.73 -0.0013 -2.77 1129.16 1.92 3.63 0.17 3.1 0.86 NA NA 0.9970 0.9940 0.9860 124.2897 4.26x10⁻⁶
Y=f(SFD,A,T,GS,PL,HCP,P,U
WF,AWF) -990.07 -0.01 -3.44 1148.59 2.19 2.49 0.18 2.69 1.33 -7.07 NA 0.9978 0.9956 0.9877 125.5782 2.37x10⁻⁵
Y=f(SFD,A,T,GS,PL,HCP,P,U
WF,AWF,ME) -1054.87 0.01 -3.5 1199.99 2.2 2.29 0.18 2.69 1.41 -7.27 3.57 0.9978 0.9956 0.9846 90.7505 2.86x10⁻⁴
Page 80 of 88
CHAPTER VIII
Validation and Deduction
8.1 Validation of the Model
With a view to verify the adequacy of fitness of the model to the system, validation of
the mathematical model is carried out. Validation tests are performed on six ships
repaired, whose data were not included to form the regression model equation. Table 9
below shows the estimated value and actual value of man-day for repairing these six
ships and the error between those two values. It is seen that there is reasonably acceptable
difference between the estimated and actual ship repair labour value for repairing these
six ships indicating the prospective usefulness of the models.
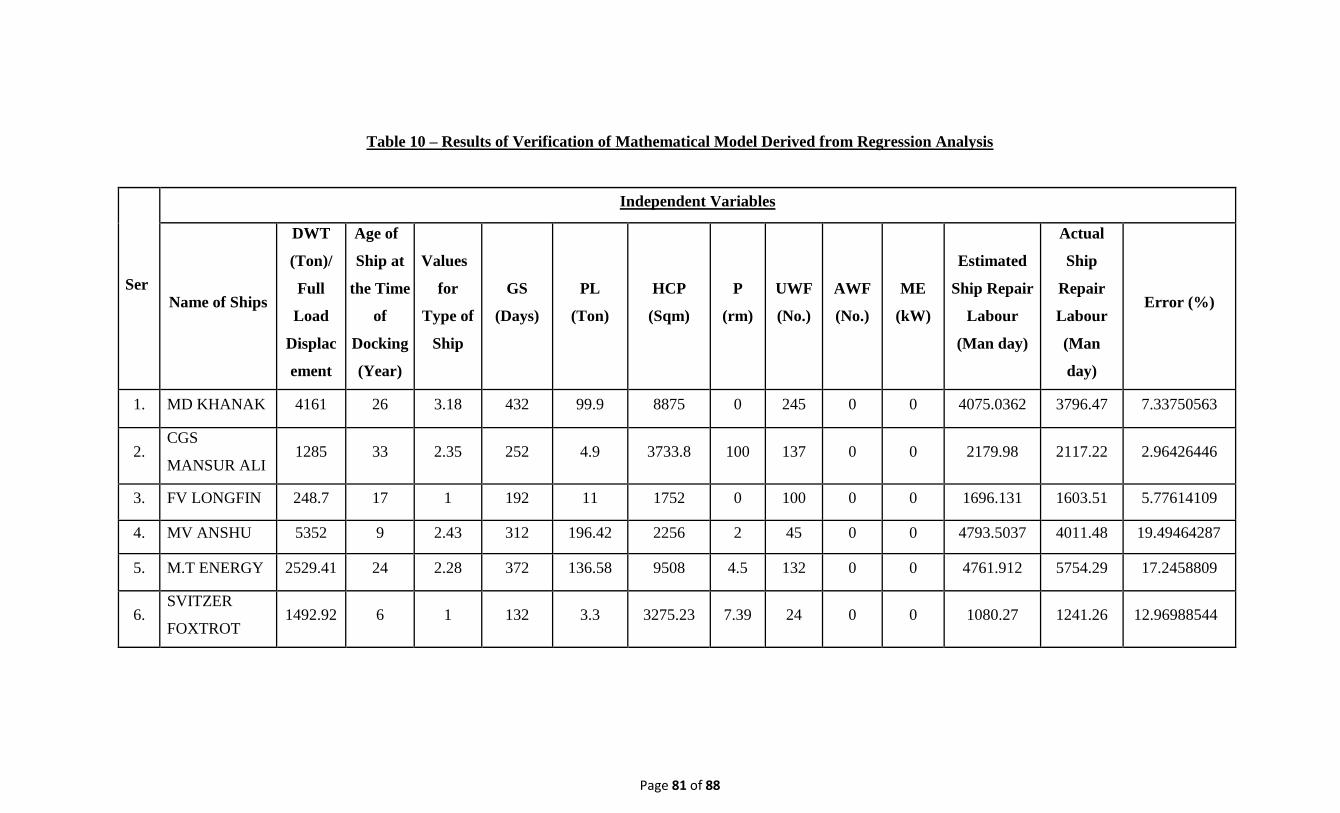
Page 81 of 88
Table 10 – Results of Verification of Mathematical Model Derived from Regression Analysis
Ser
Independent Variables
Name of Ships
DWT
(Ton)/
Full
Load
Displac
ement
Age of
Ship at
the Time
of
Docking
(Year)
Values
for
Type of
Ship
GS
(Days)
PL
(Ton)
HCP
(Sqm)
P
(rm)
UWF
(No.)
AWF
(No.)
ME
(kW)
Estimated
Ship Repair
Labour
(Man day)
Actual
Ship
Repair
Labour
(Man
day)
Error (%)
1. MD KHANAK 4161 26 3.18 432 99.9 8875 0 245 0 0 4075.0362 3796.47 7.33750563
2. CGS
MANSUR ALI 1285 33 2.35 252 4.9 3733.8 100 137 0 0 2179.98 2117.22 2.96426446
3. FV LONGFIN 248.7 17 1 192 11 1752 0 100 0 0 1696.131 1603.51 5.77614109
4. MV ANSHU 5352 9 2.43 312 196.42 2256 2 45 0 0 4793.5037 4011.48 19.49464287
5. M.T ENERGY 2529.41 24 2.28 372 136.58 9508 4.5 132 0 0 4761.912 5754.29 17.2458809
6. SVITZER
FOXTROT 1492.92 6 1 132 3.3 3275.23 7.39 24 0 0 1080.27 1241.26 12.96988544
Page 82 of 88
8.2. Deduction
In repairing different group of ships, this article establishes a possible strong relationship
between dependent (ship repair labour) and independent variables (deadweight/ full load
displacement, age, type of ship and repair works namely general service, plate, hull
cleaning & painting, piping, underwater fitting, above water fitting, machinery &
equipment works etc) by verifying correlation coefficients and in the form of
mathematical equations by using the multiple linear regression. Theses equations are also
verified with statistical testing parameters to demonstrate the adequacy of the models for
the system. Therefore, it is summarized that there is a considerable amount of variation
in their response (the dependent variable) as a result of the differences in independent
variables in the proposed model. Despite the limitations mentioned above in the
discussion, the mathematical model can be useful to CDDL. The comparison between
the actual and estimated value for man-hours of construction shows that the model has
viable accuracy. This model can act as a guide for CDDL with a view to estimate the
expected ship repairing labour (man day) against an expected scope of repairing works
of a ship. Before docking of a vessel, CDDL can forecast estimated labour (in man day)
from this mathematical model based on identified variables (deadweight, age, scope of
repair works). The result of the estimated value of man-day for repairing a ship multiplied
by wage rate will be the estimated labor cost for repair during the quotation stage.

Page 83 of 88
CHAPTER IX
Conclusion and Recommendations
9.1. Conclusion
Docking of ships for repair and maintenance are highly technical task. Dry docking of
ships are part of manufacturing and production processes incorporating hull inspection
and cleaning, sandblasting, “plate cutting, fitting and welding”, under and above water
fitting works, painting, tank cleaning and machinery & equipment works etc. This also
includes berth preparation for a ship coming for repair and essentially demands planning
of manufacturing and production of various ship components with lead time. Ship repair
work is labor intensive with strict time constraints. Labour cost significantly affects total
repair cost. Both Labour hour and repair time determines labour cost. Proper estimation
of labor cost will guide CDDL to stay competitive in not only mass ship repair market of
Bangladesh but also in international arena. A flaw in estimation and planning not only
cause financial losses to CDDL but also affect the ship owner as well in the same manner.
This paper therefore, focuses on the estimation of the labour costs for different group of
ships so that both parties benefit financially. This research paper also identifies and
analyzes some important independent variables (deadweight/ full load displacement, age,
repair works etc) that affect the outcome of labour (man-days). Forecast on ship repairing
labour (man-days) by CDDL from the derived regression model herein can be translated
into total number of workers, days and hence labour cost with a view control of labour
cost and for budgetary purpose.
9.2 Recommendations
i) Shipyard management may verify the effect of delay in delivery of repair
equipment/materials on derived labour cost estimation model of CDDL.

Page 84 of 88
ii) Shipyard management may examine effect of introduction of the state of the art
production machinery/equipment on labour hour and thus on derived labour cost
estimation model of CDDL.
iii) Future study may relate skill of labour to various factors affecting labour cost as
considered in derived labour cost estimation model of CDDL.
iv) Further study may cater for using larger sample data size in statistical analysis to
address the reasons for the difference between actual value and model value of ship
repairing labour.
v) Further investigation may be carried out taking in to account the influence of the
ambient conditions (environmental factors) on labour hour and how the same affect
derived labour cost estimation model of CDDL.
9.3 Limitations of the Study
i) Research has been based on available limited data.
ii) All the data have been collected and entire information have not been gathered
due to confidentiality.
References:
1. Denis Njumo Atehnjia (2018), Overview of the Safety Operations in a Floating –
Graving Dry Docking System, Department of Marine Engineering, Regional Maritime
University, Ghana.
2. Atehnjia Denis Njumo (2015), Application of Formal Safety Assessment for Dry
Docking Evolution, Liverpool John Moores University.
Page 85 of 88
3. Chen Chen, Chua Kim Huat (2013), Optimal Dock Block Arrangement
Considering Subsequent Ships Solved by Genetic Algorithm, Department of Civil and
Environmental Engineering, National University of Singapore.
4. Shahneaz M.A, Salma Umma (2015), Prospects and Challenges of Blue
Economy in Bangladesh”, Daily Observer on 28 January 2015.
5. Hossain, Saif, Jafrin. (2016), Blue Economy in Bangladesh: Proposed Model and
Policy Recommendations, Journal of Economics and Sustainable Development. Vol.7,
No.21.
6. Stefanie Schmidt, Barbara Neumann, Yvonne Waweru, Carole Durussel,
Sebastian Unger, Martin Visbeck, SDG14, Conserve and Sustainably Use the Oceans,
Seas and Marine Resources for Sustainable Development, pp 177.
7. Comprehensive Guide to Marine Maintenance and Repair, July 2018,
International Chemco Protective Coatings.
8. Alam M. Khurshed. (2015), Ocean/Blue Economy for Bangladesh,
mofl.portal.gov.bd, Working Paper.
9. Isti Surjandari and Riara Novita (2013), Estimation Model of Dry Docking
Duration Using Data Mining, World Academy of Science, Engineering and Technology
International Journal of Industrial and Manufacturing Engineering Vol:7, No:7, 2013.
10. Vi Hong Nguyen (2008), optimal ship maintenance scheduling under restricted
Conditions and constrained resources, Hanoi University of Mining and Geology, Viet
Nam
11. Agamemnon Apostolidis, John Kokarakis and Andreas Merikas (2012),
Modeling the Dry-Docking Cost – The Case of Tankers, Journal of Ship Production and
Design, Vol.28, No.3, August 2012, pp 134 – 143.

Page 86 of 88
12. Yousef Alhouli (2011), Development of Ship Maintenance Performance
Measurement Framework to Assess the Decision Making Process to Optimize in Ship
Maintenance Planning, Faculty of Engineering and Physical Sciences, University of
Manchester.
13. Jonathan M. Ross, A Practical Approach for Ship Construction Cost Estimating,
Proteus Engineering, Anteon Corporation, U.S.A.
14. Danuja Wijayanto, Taufik Fajar Nugroho, and Agoes Achmad Masroeri (2017),
Estimating Mina Jaya Niaga 11 Ship Repair (In Man-hour) using Work Breakdown
Structure, Department of Marine Engineering, Faculty of Marine Technology, Institut
Teknologi Sepuluh Nopember (ITS) – Hochschule Wismar.
15. Agamemnon Apostolidis, John Kokarakis and Andreas Merikas (2012),
Modeling the Dry Docking Cost – The Case of Tankers, Journal of Ship Production and
Design, Vol.28, No.3, August 2012, pp 134 – 143.
16. Chia-Chan Chou and Pao-Long Chang. Modeling and Analysis of Labour Cost
Estimation for Shipbuilding: The Case of China Shipbuilding Corporation, National
Chiao University, Taipei, Taiwan.
17. George Brian Jonkers. (2003), An evaluation and assessment of ship repair
opportunities for South Africa using the Port of Durban as a case study in an attempt to
develop a Framework Plan for the Ship Repair Industry in the Port of Durban, Graduate
School of Business, University of Natal, Durban.
18. Don Butler (2003), A Guide to Ship Repair Estimates (In man-hours), British
Library Cataloguing in Publication Data.
19. Messrs. Read, Chatfield, Creuze (1842), The Chatham Committee of Naval
Architects, Reports on Naval Construction (1842-44), The New York Public Library.

Page 87 of 88
20. Captain Ben Dinsmore, A Guide to Understanding Ship Weight and Tonnage
Measurements, The Maritime Site, Retrieved from https://www.themaritimesite.com/a-
guide-to-understanding-ship-weight-and-tonnage-measurements/
21. Linda. (2017), Indian Shipbuilding Industry, Essay UK, Retrieved 26 July 2017
from
http: //www.essay.uk.com/free-essays/economics/indian-shipbuilding-industry.php
22. Robert Castrillon Dussan (2007), Ship repair Competition: Drivers and
Opportunities, World Maritime University, Malmö, Sweden.
23. Agreement on Coastal Sipping between the Government of the Republic of India
and the Government of the People's Republic of Bangladesh dated 06 June 2015,
Retrieved from https://www.mea.gov.in/Portal/LegalTreatiesDoc/BG15B2420.pdf
24. Working Group for Shipbuilding and Ship Repair Industry for the Eleventh Five
Year Plan (2007-2012), Government of India, Ministry of Shipping, Road Transport &
Highways.
25. Britt Burton (2010), An Impressive Construction: A Historical and
Archaeological Analysis of the Randell Dry Dock, Department of Archaeology, Flinders
University of South Australia.
26. Karl Fredrik Skorge Hansen, Analysis of estimations, quotations and actual costs
related to dry-docking, Vestfold University College, Faculty of Technology and
Maritime Science.
27. The Shipbuilding and Ship Repair Sectors in the Candidate Countries - Poland,
Estonia, the Czech Republic, Hungary and Slovenia, NOBE Independent Center for
Economic Studies, Poland, www.nobe.pl
Page 88 of 88
28. Raquel Varela, Hugh Murphy, Marcel van der Linden (2017), Shipbuilding and
Ship Repair Workers around the World – Case Studies 1950 – 2010, International
Institute of Social History.
29. Wahidul Sheikh Shemon (2010), Problems & Prospects of Bangladesh Shipping
Industry: A Comparative Overview, Department of Business Management,
Bangabandhu Sheikh Mujibur Rahman Maritime University, Bangladesh.
30. Arun Kr Dev, Makaraksha Saha, Modeling and Analysis of Ship Repairing
Labour, Journal of Ship Production and Design, Vol 32, Number 4, Nov 2016, pp 258-
271.
31. Ahnold Mitchell, Burnham H. Dodge, Pamela G Khuzic, David C. Miller, Peter
Schwartz, Benjamin E. Suta (1975), Handbook of Forecasting Techniques, Center for
the Study of Social Policy Stanford research institute.
32. Wesley D. Margeson (2003), A Forecasting and Inventory Model for Short
Lifecycle Products with Seasonal Demand Patterns, Massachusetts Institute of
Technology.
33. Ronald E. Walpole, Raymond H. Myers (1978), Probability and Statistics for
Engineers and Scientists, Edition, Macmillan Publishing Co, Inc, New York.
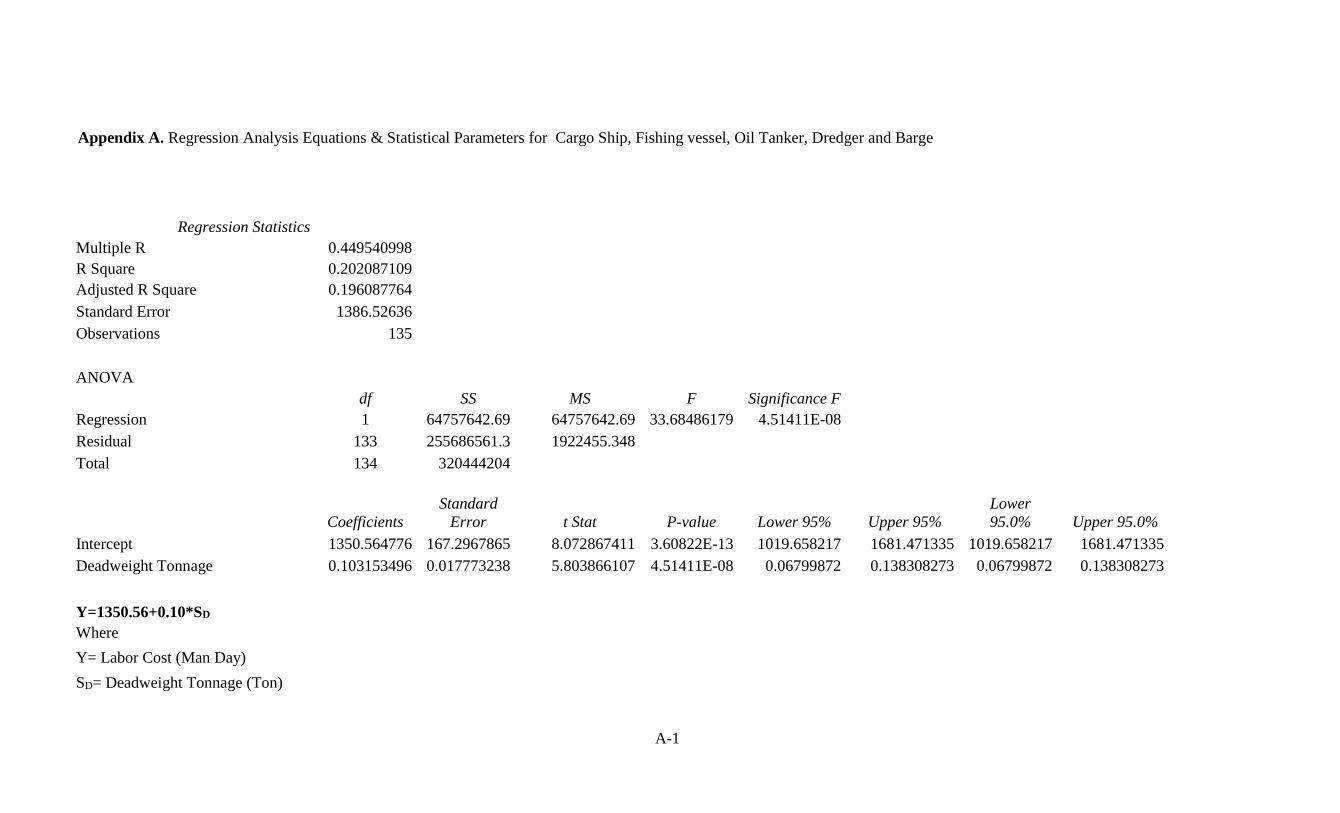
A-1
Regression Statistics
Multiple R 0.449540998
R Square 0.202087109
Adjusted R Square 0.196087764
Standard Error 1386.52636
Observations 135
ANOVA
df SS MS F Significance F
Regression 1 64757642.69 64757642.69 33.68486179 4.51411E-08
Residual 133 255686561.3 1922455.348
Total 134 320444204
Coefficients
Standard
Error t Stat P-value Lower 95% Upper 95%
Lower
95.0% Upper 95.0%
Intercept 1350.564776 167.2967865 8.072867411 3.60822E-13 1019.658217 1681.471335 1019.658217 1681.471335
Deadweight Tonnage 0.103153496 0.017773238 5.803866107 4.51411E-08 0.06799872 0.138308273 0.06799872 0.138308273
Y=1350.56+0.10*SD
Where
Y= Labor Cost (Man Day)
SD= Deadweight Tonnage (Ton)
Appendix A. Regression Analysis Equations & Statistical Parameters for Cargo Ship, Fishing vessel, Oil Tanker, Dredger and Barge

A-2
SUMMARY OUTPUT
Regression Statistics
Multiple R 0.473156164
R Square 0.223876756
Adjusted R Square 0.212117312
Standard Error 1372.633488
Observations 135
ANOVA
df SS MS F Significance F
Regression 2 71740008.71 35870004.35 19.03804063 5.43783E-08
Residual 132 248704195.2 1884122.691
Total 134 320444204
Coefficients
Standard
Error t Stat P-value Lower 95% Upper 95%
Lower
95.0% Upper 95.0%
Intercept 845.0209186 310.474527 2.721707725 0.007371347 230.871625 1459.170212 230.871625 1459.170212
Deadweight Tonnage 0.09887212 0.017735151 5.574923925 1.34102E-07 0.063790238 0.133954002 0.063790238 0.133954002
Age of Ship at the Time of
Docking 23.38897262 12.14966854 1.92507084 0.056371568 -0.644272308 47.42221754 -0.64427231 47.42221754
Y=845.02+0.09*SD+23.38*A
Where
Y= Labor Cost (Man Day)
SD= Deadweight Tonnage (Ton)
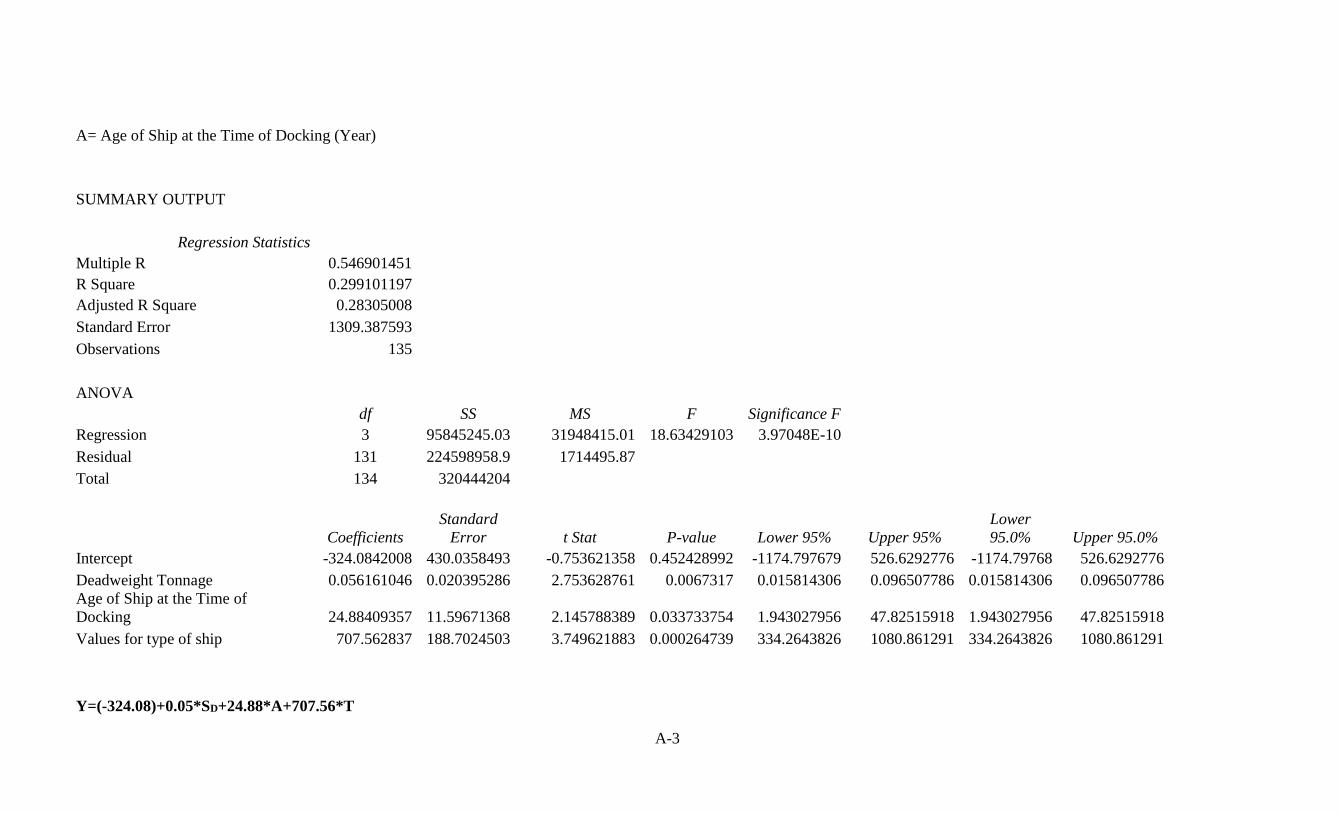
A-3
A= Age of Ship at the Time of Docking (Year)
SUMMARY OUTPUT
Regression Statistics
Multiple R 0.546901451
R Square 0.299101197
Adjusted R Square 0.28305008
Standard Error 1309.387593
Observations 135
ANOVA
df SS MS F Significance F
Regression 3 95845245.03 31948415.01 18.63429103 3.97048E-10
Residual 131 224598958.9 1714495.87
Total 134 320444204
Coefficients
Standard
Error t Stat P-value Lower 95% Upper 95%
Lower
95.0% Upper 95.0%
Intercept -324.0842008 430.0358493 -0.753621358 0.452428992 -1174.797679 526.6292776 -1174.79768 526.6292776
Deadweight Tonnage 0.056161046 0.020395286 2.753628761 0.0067317 0.015814306 0.096507786 0.015814306 0.096507786
Age of Ship at the Time of
Docking 24.88409357 11.59671368 2.145788389 0.033733754 1.943027956 47.82515918 1.943027956 47.82515918
Values for type of ship 707.562837 188.7024503 3.749621883 0.000264739 334.2643826 1080.861291 334.2643826 1080.861291
Y=(-324.08)+0.05*SD+24.88*A+707.56*T
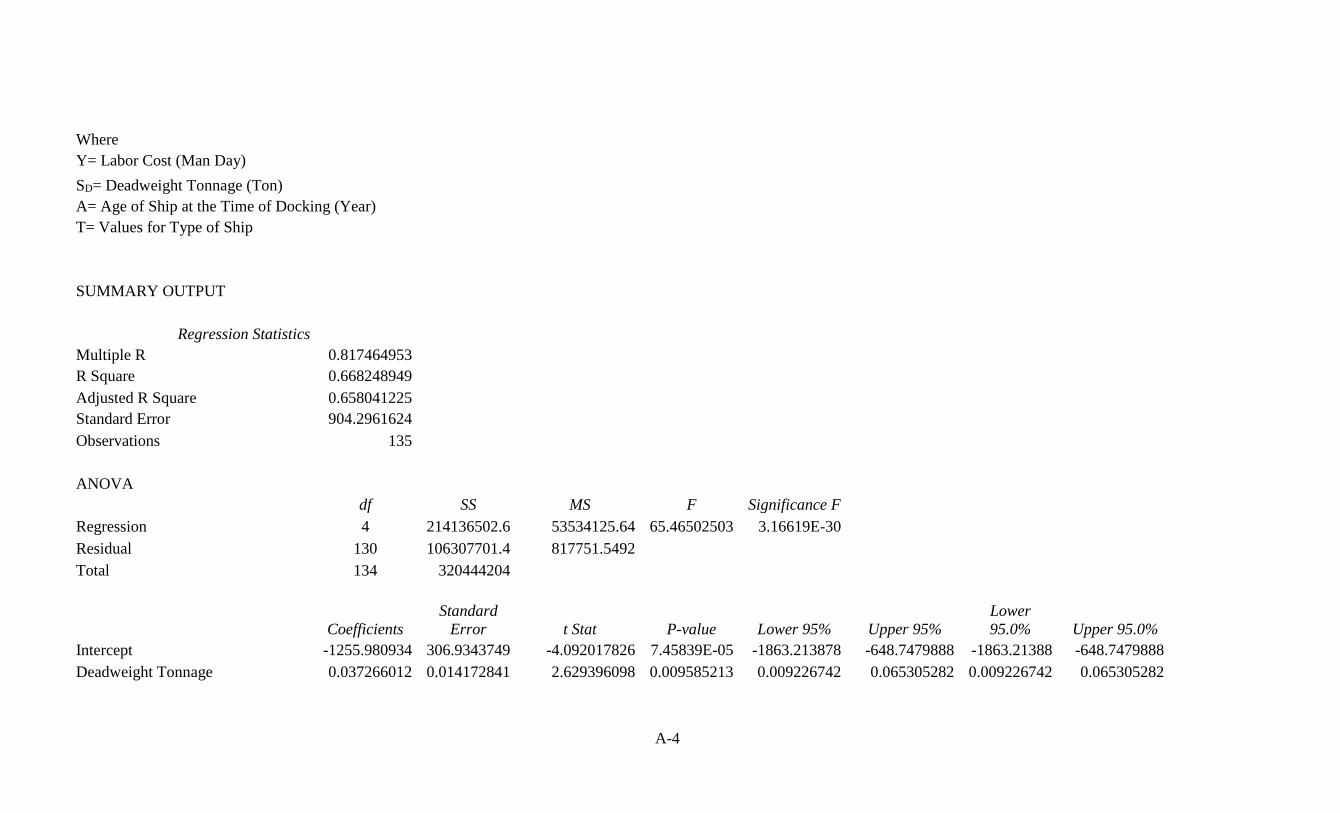
A-4
Where
Y= Labor Cost (Man Day)
SD= Deadweight Tonnage (Ton)
A= Age of Ship at the Time of Docking (Year)
T= Values for Type of Ship
SUMMARY OUTPUT
Regression Statistics
Multiple R 0.817464953
R Square 0.668248949
Adjusted R Square 0.658041225
Standard Error 904.2961624
Observations 135
ANOVA
df SS MS F Significance F
Regression 4 214136502.6 53534125.64 65.46502503 3.16619E-30
Residual 130 106307701.4 817751.5492
Total 134 320444204
Coefficients
Standard
Error t Stat P-value Lower 95% Upper 95%
Lower
95.0% Upper 95.0%
Intercept -1255.980934 306.9343749 -4.092017826 7.45839E-05 -1863.213878 -648.7479888 -1863.21388 -648.7479888
Deadweight Tonnage 0.037266012 0.014172841 2.629396098 0.009585213 0.009226742 0.065305282 0.009226742 0.065305282
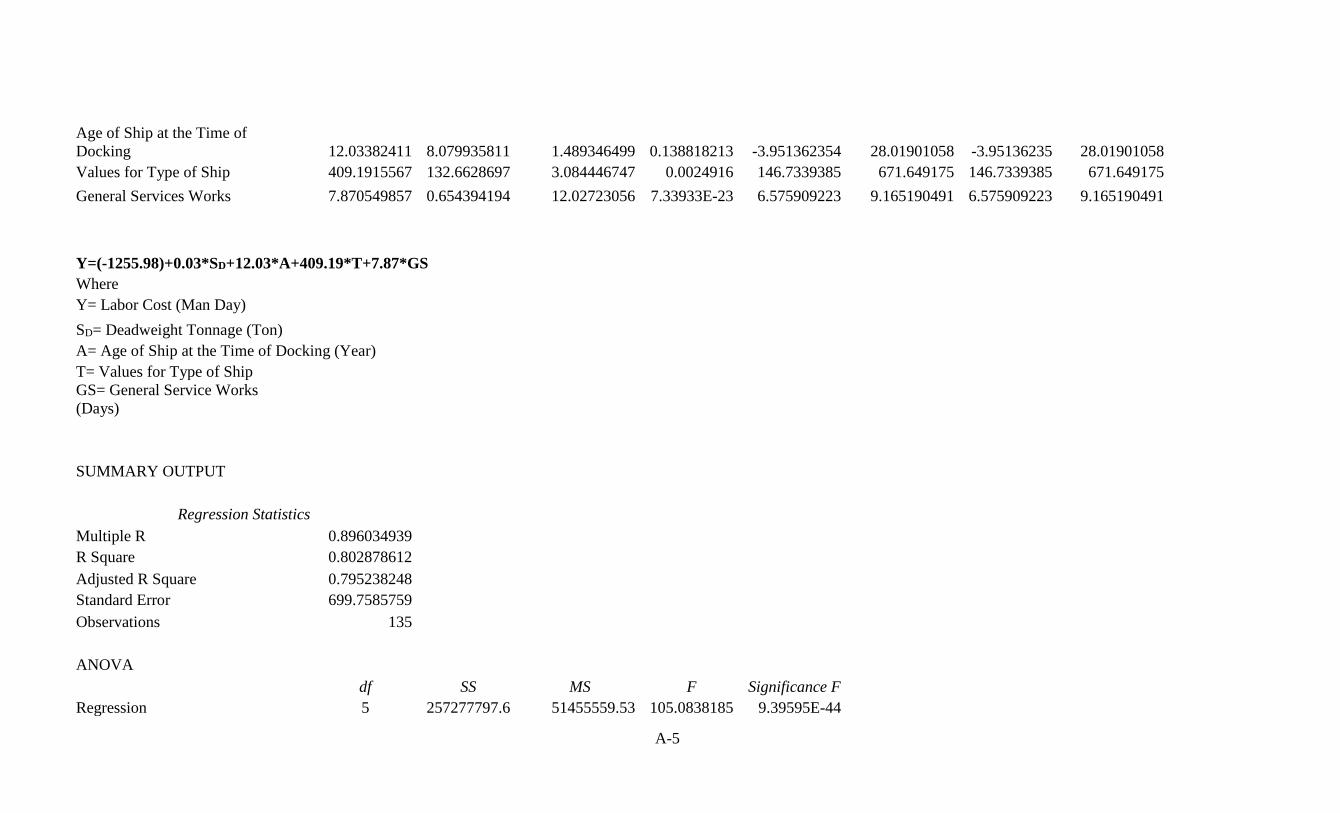
A-5
Age of Ship at the Time of
Docking 12.03382411 8.079935811 1.489346499 0.138818213 -3.951362354 28.01901058 -3.95136235 28.01901058
Values for Type of Ship 409.1915567 132.6628697 3.084446747 0.0024916 146.7339385 671.649175 146.7339385 671.649175
General Services Works 7.870549857 0.654394194 12.02723056 7.33933E-23 6.575909223 9.165190491 6.575909223 9.165190491
Y=(-1255.98)+0.03*SD+12.03*A+409.19*T+7.87*GS
Where
Y= Labor Cost (Man Day)
SD= Deadweight Tonnage (Ton)
A= Age of Ship at the Time of Docking (Year)
T= Values for Type of Ship
GS= General Service Works
(Days)
SUMMARY OUTPUT
Regression Statistics
Multiple R 0.896034939
R Square 0.802878612
Adjusted R Square 0.795238248
Standard Error 699.7585759
Observations 135
ANOVA
df SS MS F Significance F
Regression 5 257277797.6 51455559.53 105.0838185 9.39595E-44
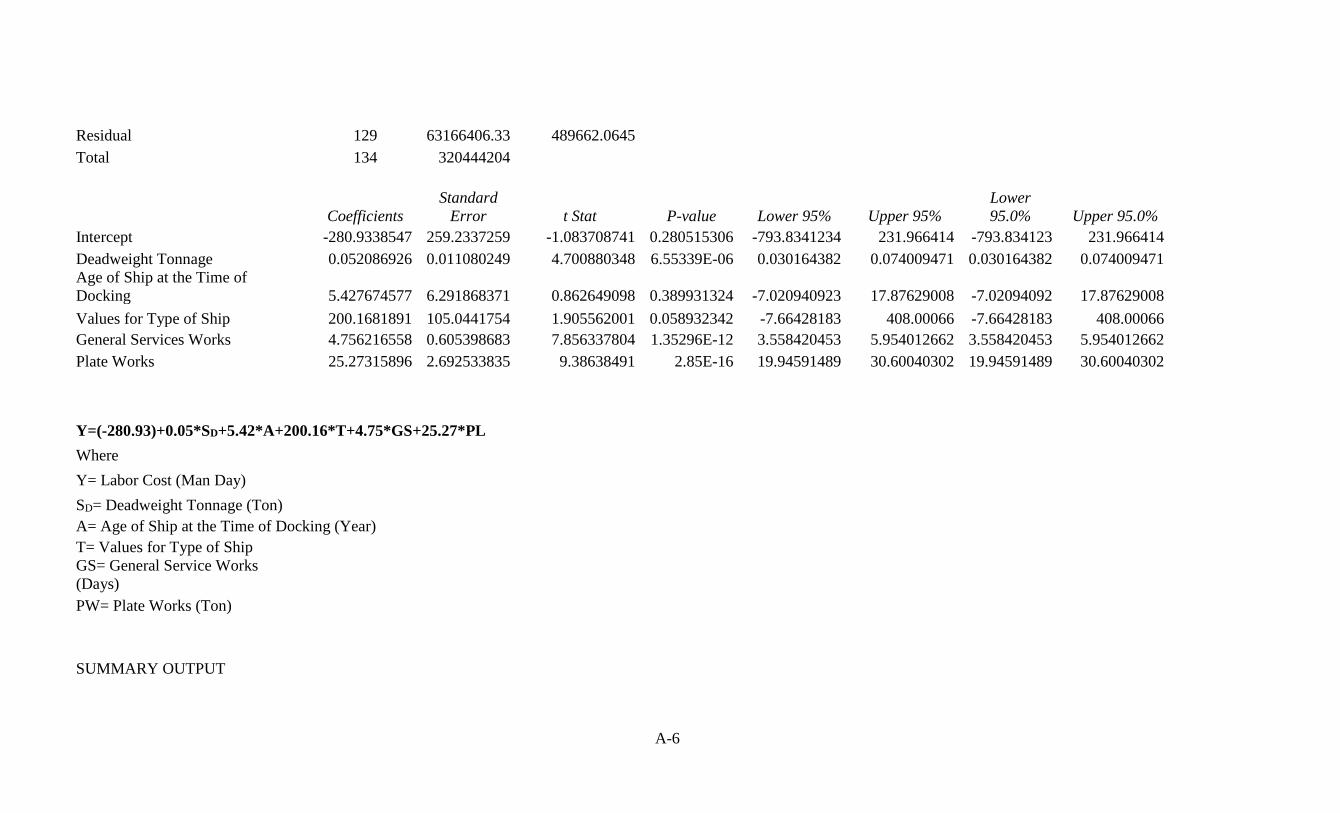
A-6
Residual 129 63166406.33 489662.0645
Total 134 320444204
Coefficients
Standard
Error t Stat P-value Lower 95% Upper 95%
Lower
95.0% Upper 95.0%
Intercept -280.9338547 259.2337259 -1.083708741 0.280515306 -793.8341234 231.966414 -793.834123 231.966414
Deadweight Tonnage 0.052086926 0.011080249 4.700880348 6.55339E-06 0.030164382 0.074009471 0.030164382 0.074009471
Age of Ship at the Time of
Docking 5.427674577 6.291868371 0.862649098 0.389931324 -7.020940923 17.87629008 -7.02094092 17.87629008
Values for Type of Ship 200.1681891 105.0441754 1.905562001 0.058932342 -7.66428183 408.00066 -7.66428183 408.00066
General Services Works 4.756216558 0.605398683 7.856337804 1.35296E-12 3.558420453 5.954012662 3.558420453 5.954012662
Plate Works 25.27315896 2.692533835 9.38638491 2.85E-16 19.94591489 30.60040302 19.94591489 30.60040302
Y=(-280.93)+0.05*SD+5.42*A+200.16*T+4.75*GS+25.27*PL
Where
Y= Labor Cost (Man Day)
SD= Deadweight Tonnage (Ton)
A= Age of Ship at the Time of Docking (Year)
T= Values for Type of Ship
GS= General Service Works
(Days)
PW= Plate Works (Ton)
SUMMARY OUTPUT
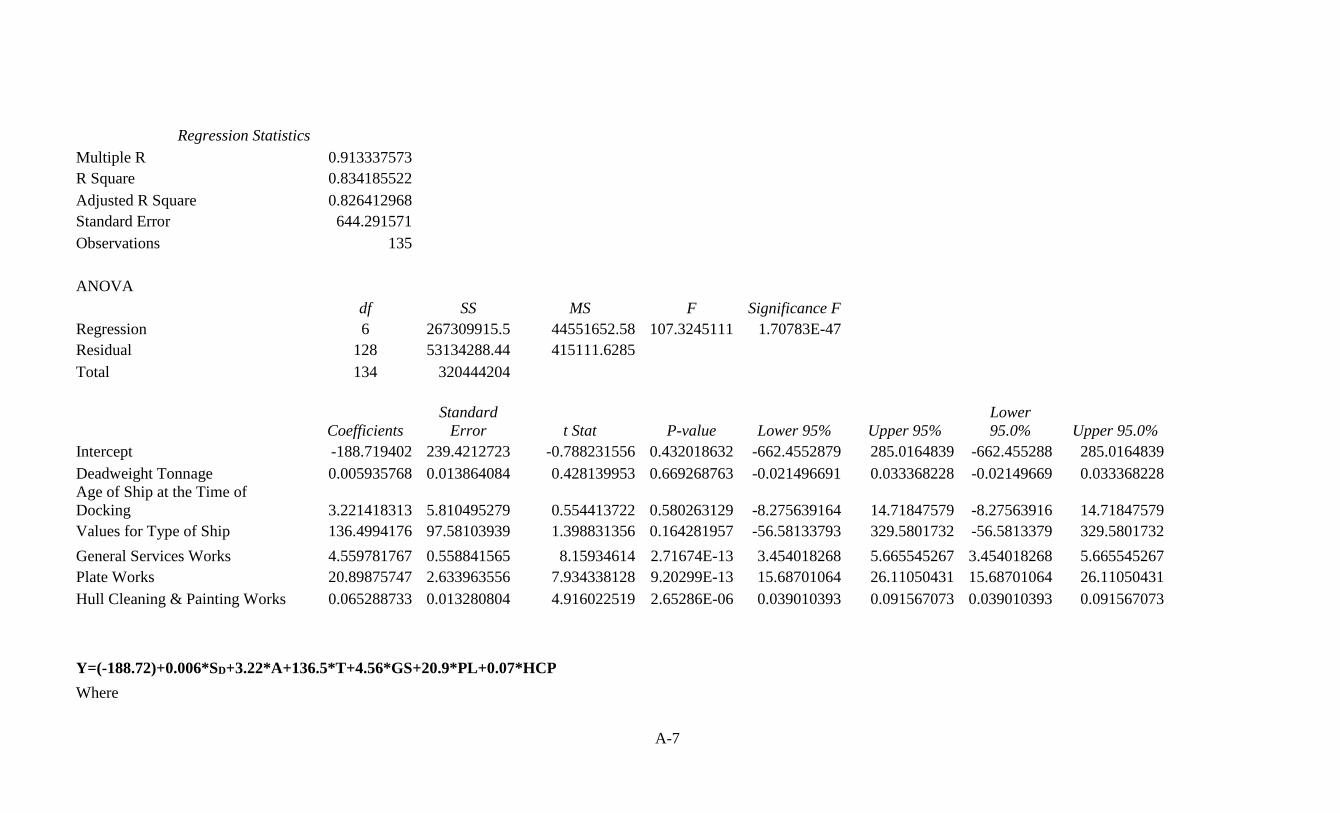
A-7
Regression Statistics
Multiple R 0.913337573
R Square 0.834185522
Adjusted R Square 0.826412968
Standard Error 644.291571
Observations 135
ANOVA
df SS MS F Significance F
Regression 6 267309915.5 44551652.58 107.3245111 1.70783E-47
Residual 128 53134288.44 415111.6285
Total 134 320444204
Coefficients
Standard
Error t Stat P-value Lower 95% Upper 95%
Lower
95.0% Upper 95.0%
Intercept -188.719402 239.4212723 -0.788231556 0.432018632 -662.4552879 285.0164839 -662.455288 285.0164839
Deadweight Tonnage 0.005935768 0.013864084 0.428139953 0.669268763 -0.021496691 0.033368228 -0.02149669 0.033368228
Age of Ship at the Time of
Docking 3.221418313 5.810495279 0.554413722 0.580263129 -8.275639164 14.71847579 -8.27563916 14.71847579
Values for Type of Ship 136.4994176 97.58103939 1.398831356 0.164281957 -56.58133793 329.5801732 -56.5813379 329.5801732
General Services Works 4.559781767 0.558841565 8.15934614 2.71674E-13 3.454018268 5.665545267 3.454018268 5.665545267
Plate Works 20.89875747 2.633963556 7.934338128 9.20299E-13 15.68701064 26.11050431 15.68701064 26.11050431
Hull Cleaning & Painting Works 0.065288733 0.013280804 4.916022519 2.65286E-06 0.039010393 0.091567073 0.039010393 0.091567073
Y=(-188.72)+0.006*SD+3.22*A+136.5*T+4.56*GS+20.9*PL+0.07*HCP
Where

A-8
Y= Labor Cost (Man Day)
SD= Deadweight Tonnage (Ton)
A= Age of Ship at the Time of Docking (Year)
T= Values for Type of Ship
GS= General Service Works
(Days)
PW= Plate Works (Ton)
HCP= Hull Cleaning & Painting Works (Sqm)
SUMMARY OUTPUT
Regression Statistics
Multiple R 0.928851583
R Square 0.862765263
Adjusted R Square 0.855201144
Standard Error 588.4456773
Observations 135
ANOVA
df SS MS F Significance F
Regression 7 276468127.9 39495446.85 114.0602392 1.21954E-51
Residual 127 43976076.02 346268.3151
Total 134 320444204
Coefficients
Standard
Error t Stat P-value Lower 95% Upper 95%
Lower
95.0% Upper 95.0%
Intercept -266.6163169 219.1926887 -1.216355885 0.226105227 -700.3590854 167.1264516 -700.359085 167.1264516
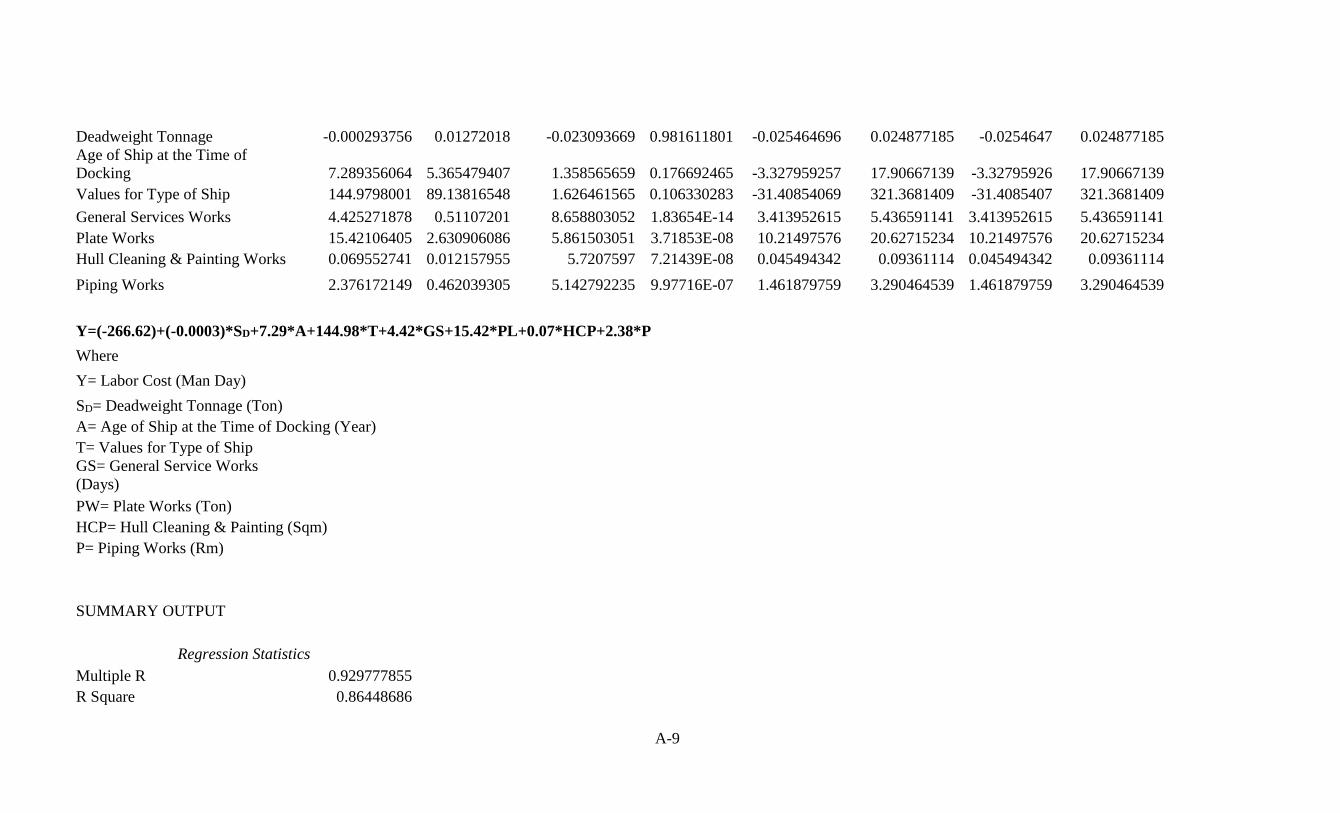
A-9
Deadweight Tonnage -0.000293756 0.01272018 -0.023093669 0.981611801 -0.025464696 0.024877185 -0.0254647 0.024877185
Age of Ship at the Time of
Docking 7.289356064 5.365479407 1.358565659 0.176692465 -3.327959257 17.90667139 -3.32795926 17.90667139
Values for Type of Ship 144.9798001 89.13816548 1.626461565 0.106330283 -31.40854069 321.3681409 -31.4085407 321.3681409
General Services Works 4.425271878 0.51107201 8.658803052 1.83654E-14 3.413952615 5.436591141 3.413952615 5.436591141
Plate Works 15.42106405 2.630906086 5.861503051 3.71853E-08 10.21497576 20.62715234 10.21497576 20.62715234
Hull Cleaning & Painting Works 0.069552741 0.012157955 5.7207597 7.21439E-08 0.045494342 0.09361114 0.045494342 0.09361114
Piping Works 2.376172149 0.462039305 5.142792235 9.97716E-07 1.461879759 3.290464539 1.461879759 3.290464539
Y=(-266.62)+(-0.0003)*SD+7.29*A+144.98*T+4.42*GS+15.42*PL+0.07*HCP+2.38*P
Where
Y= Labor Cost (Man Day)
SD= Deadweight Tonnage (Ton)
A= Age of Ship at the Time of Docking (Year)
T= Values for Type of Ship
GS= General Service Works
(Days)
PW= Plate Works (Ton)
HCP= Hull Cleaning & Painting (Sqm)
P= Piping Works (Rm)
SUMMARY OUTPUT
Regression Statistics
Multiple R 0.929777855
R Square 0.86448686
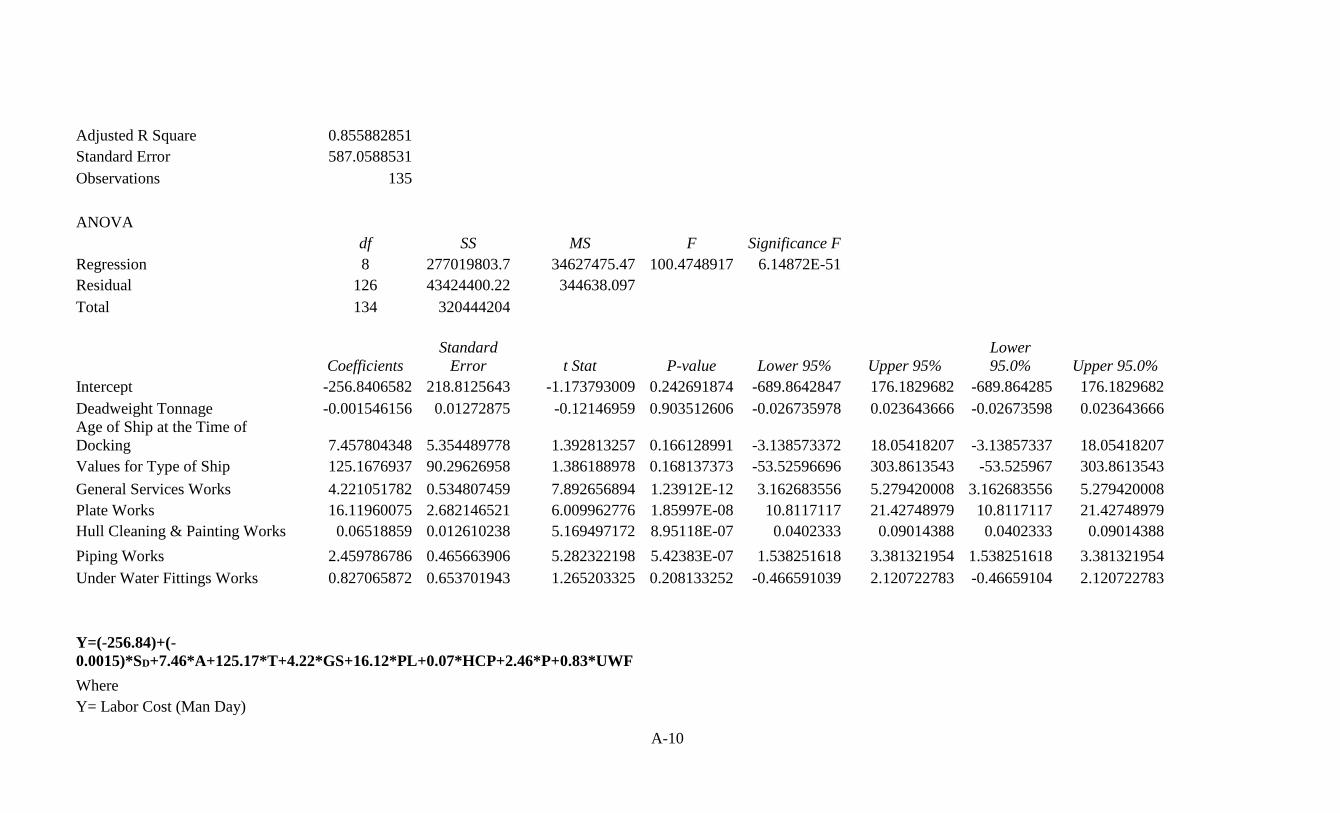
A-10
Adjusted R Square 0.855882851
Standard Error 587.0588531
Observations 135
ANOVA
df SS MS F Significance F
Regression 8 277019803.7 34627475.47 100.4748917 6.14872E-51
Residual 126 43424400.22 344638.097
Total 134 320444204
Coefficients
Standard
Error t Stat P-value Lower 95% Upper 95%
Lower
95.0% Upper 95.0%
Intercept -256.8406582 218.8125643 -1.173793009 0.242691874 -689.8642847 176.1829682 -689.864285 176.1829682
Deadweight Tonnage -0.001546156 0.01272875 -0.12146959 0.903512606 -0.026735978 0.023643666 -0.02673598 0.023643666
Age of Ship at the Time of
Docking 7.457804348 5.354489778 1.392813257 0.166128991 -3.138573372 18.05418207 -3.13857337 18.05418207
Values for Type of Ship 125.1676937 90.29626958 1.386188978 0.168137373 -53.52596696 303.8613543 -53.525967 303.8613543
General Services Works 4.221051782 0.534807459 7.892656894 1.23912E-12 3.162683556 5.279420008 3.162683556 5.279420008
Plate Works 16.11960075 2.682146521 6.009962776 1.85997E-08 10.8117117 21.42748979 10.8117117 21.42748979
Hull Cleaning & Painting Works 0.06518859 0.012610238 5.169497172 8.95118E-07 0.0402333 0.09014388 0.0402333 0.09014388
Piping Works 2.459786786 0.465663906 5.282322198 5.42383E-07 1.538251618 3.381321954 1.538251618 3.381321954
Under Water Fittings Works 0.827065872 0.653701943 1.265203325 0.208133252 -0.466591039 2.120722783 -0.46659104 2.120722783
Y=(-256.84)+(-
0.0015)*SD+7.46*A+125.17*T+4.22*GS+16.12*PL+0.07*HCP+2.46*P+0.83*UWF
Where
Y= Labor Cost (Man Day)

A-11
SD= Deadweight Tonnage (Ton)
A= Age of Ship at the Time of Docking (Year)
T= Values for Type of Ship
GS= General Service Works
(Days)
PW= Plate Works (Ton)
HCP= Hull Cleaning & Painting Works (Sqm)
P= Piping Works (Rm)
UWF= Under Water Fittings Works (Nos)
SUMMARY OUTPUT
Regression Statistics
Multiple R 0.929997674
R Square 0.864895674
Adjusted R Square 0.855168163
Standard Error 588.5126884
Observations 135
ANOVA
df SS MS F Significance F
Regression 9 277150805.9 30794533.99 88.91232665 5.2902E-50
Residual 125 43293398.04 346347.1844
Total 134 320444204
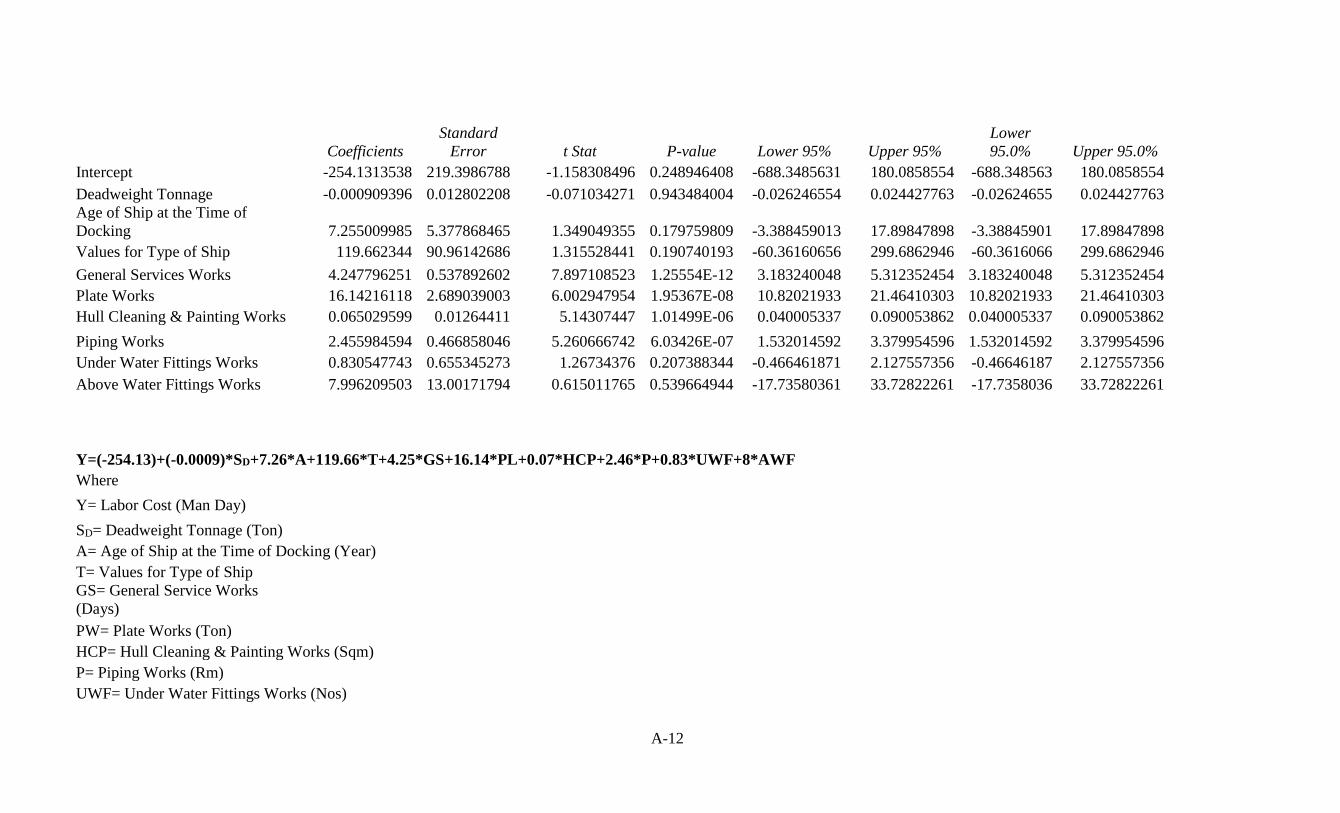
A-12
Coefficients
Standard
Error t Stat P-value Lower 95% Upper 95%
Lower
95.0% Upper 95.0%
Intercept -254.1313538 219.3986788 -1.158308496 0.248946408 -688.3485631 180.0858554 -688.348563 180.0858554
Deadweight Tonnage -0.000909396 0.012802208 -0.071034271 0.943484004 -0.026246554 0.024427763 -0.02624655 0.024427763
Age of Ship at the Time of
Docking 7.255009985 5.377868465 1.349049355 0.179759809 -3.388459013 17.89847898 -3.38845901 17.89847898
Values for Type of Ship 119.662344 90.96142686 1.315528441 0.190740193 -60.36160656 299.6862946 -60.3616066 299.6862946
General Services Works 4.247796251 0.537892602 7.897108523 1.25554E-12 3.183240048 5.312352454 3.183240048 5.312352454
Plate Works 16.14216118 2.689039003 6.002947954 1.95367E-08 10.82021933 21.46410303 10.82021933 21.46410303
Hull Cleaning & Painting Works 0.065029599 0.01264411 5.14307447 1.01499E-06 0.040005337 0.090053862 0.040005337 0.090053862
Piping Works 2.455984594 0.466858046 5.260666742 6.03426E-07 1.532014592 3.379954596 1.532014592 3.379954596
Under Water Fittings Works 0.830547743 0.655345273 1.26734376 0.207388344 -0.466461871 2.127557356 -0.46646187 2.127557356
Above Water Fittings Works 7.996209503 13.00171794 0.615011765 0.539664944 -17.73580361 33.72822261 -17.7358036 33.72822261
Y=(-254.13)+(-0.0009)*SD+7.26*A+119.66*T+4.25*GS+16.14*PL+0.07*HCP+2.46*P+0.83*UWF+8*AWF
Where
Y= Labor Cost (Man Day)
SD= Deadweight Tonnage (Ton)
A= Age of Ship at the Time of Docking (Year)
T= Values for Type of Ship
GS= General Service Works
(Days)
PW= Plate Works (Ton)
HCP= Hull Cleaning & Painting Works (Sqm)
P= Piping Works (Rm)
UWF= Under Water Fittings Works (Nos)
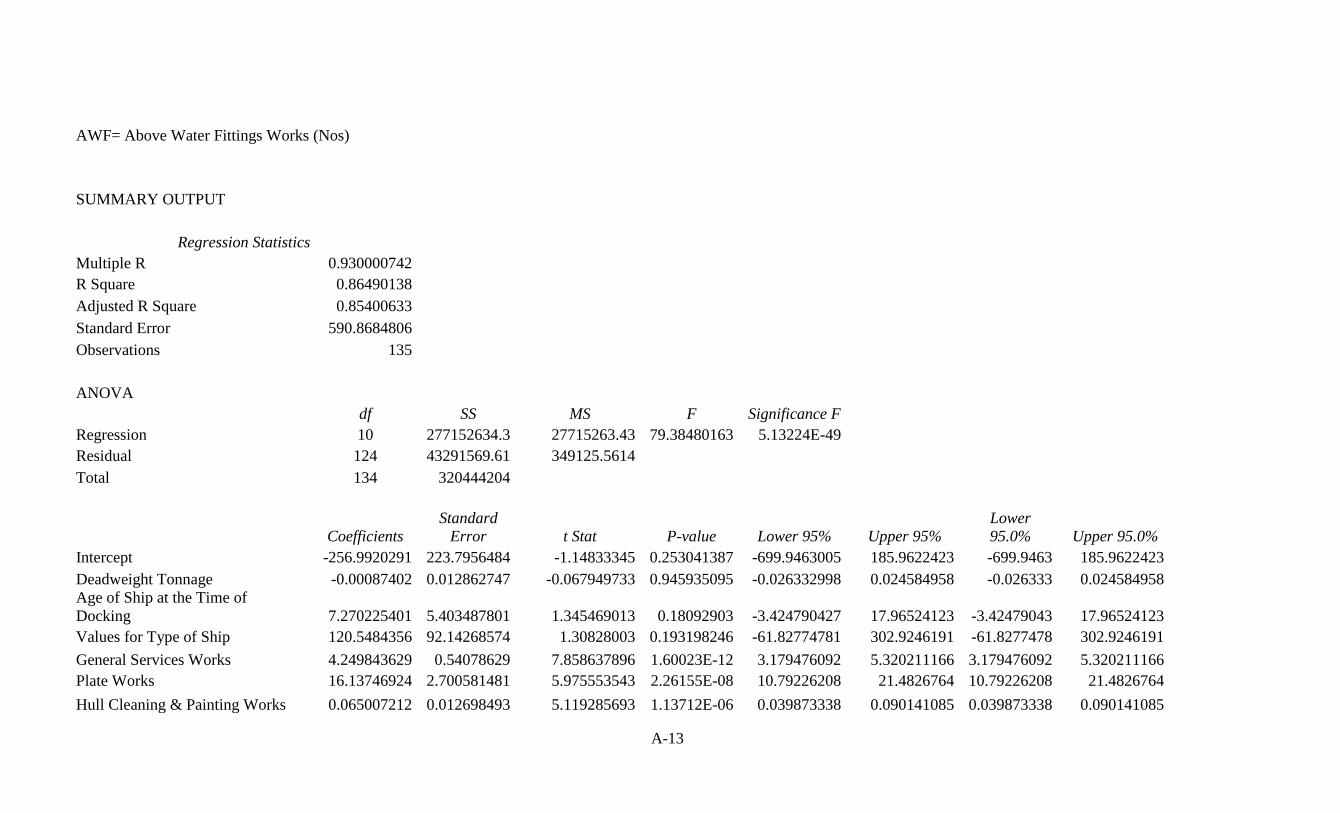
A-13
AWF= Above Water Fittings Works (Nos)
SUMMARY OUTPUT
Regression Statistics
Multiple R 0.930000742
R Square 0.86490138
Adjusted R Square 0.85400633
Standard Error 590.8684806
Observations 135
ANOVA
df SS MS F Significance F
Regression 10 277152634.3 27715263.43 79.38480163 5.13224E-49
Residual 124 43291569.61 349125.5614
Total 134 320444204
Coefficients
Standard
Error t Stat P-value Lower 95% Upper 95%
Lower
95.0% Upper 95.0%
Intercept -256.9920291 223.7956484 -1.14833345 0.253041387 -699.9463005 185.9622423 -699.9463 185.9622423
Deadweight Tonnage -0.00087402 0.012862747 -0.067949733 0.945935095 -0.026332998 0.024584958 -0.026333 0.024584958
Age of Ship at the Time of
Docking 7.270225401 5.403487801 1.345469013 0.18092903 -3.424790427 17.96524123 -3.42479043 17.96524123
Values for Type of Ship 120.5484356 92.14268574 1.30828003 0.193198246 -61.82774781 302.9246191 -61.8277478 302.9246191
General Services Works 4.249843629 0.54078629 7.858637896 1.60023E-12 3.179476092 5.320211166 3.179476092 5.320211166
Plate Works 16.13746924 2.700581481 5.975553543 2.26155E-08 10.79226208 21.4826764 10.79226208 21.4826764
Hull Cleaning & Painting Works 0.065007212 0.012698493 5.119285693 1.13712E-06 0.039873338 0.090141085 0.039873338 0.090141085
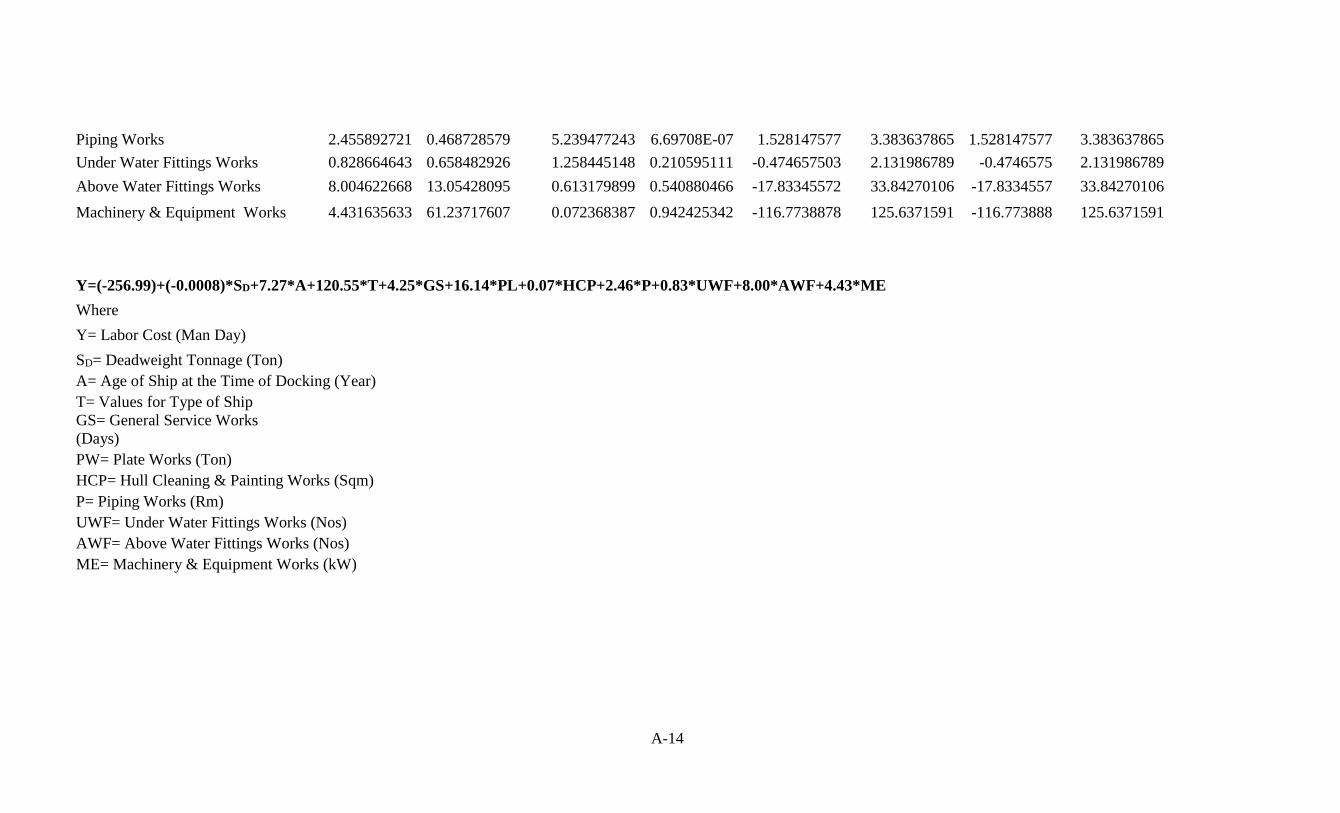
A-14
Piping Works 2.455892721 0.468728579 5.239477243 6.69708E-07 1.528147577 3.383637865 1.528147577 3.383637865
Under Water Fittings Works 0.828664643 0.658482926 1.258445148 0.210595111 -0.474657503 2.131986789 -0.4746575 2.131986789
Above Water Fittings Works 8.004622668 13.05428095 0.613179899 0.540880466 -17.83345572 33.84270106 -17.8334557 33.84270106
Machinery & Equipment Works 4.431635633 61.23717607 0.072368387 0.942425342 -116.7738878 125.6371591 -116.773888 125.6371591
Y=(-256.99)+(-0.0008)*SD+7.27*A+120.55*T+4.25*GS+16.14*PL+0.07*HCP+2.46*P+0.83*UWF+8.00*AWF+4.43*ME
Where
Y= Labor Cost (Man Day)
SD= Deadweight Tonnage (Ton)
A= Age of Ship at the Time of Docking (Year)
T= Values for Type of Ship
GS= General Service Works
(Days)
PW= Plate Works (Ton)
HCP= Hull Cleaning & Painting Works (Sqm)
P= Piping Works (Rm)
UWF= Under Water Fittings Works (Nos)
AWF= Above Water Fittings Works (Nos)
ME= Machinery & Equipment Works (kW)

B - 1
Regression Statistics
Multiple R 0.770574497
R Square 0.593785055
Adjusted R Square 0.583095188
Standard Error 387.1401853
Observations 40
ANOVA
df SS MS F Significance F
Regression 1 8325176.883 8325176.883 55.54653368 6.0477E-09
Residual 38 5695345.876 149877.5231
Total 39 14020522.76
Coefficients
Standard
Error t Stat P-value Lower 95% Upper 95% Lower 95.0% Upper 95.0%
Intercept 383.4721829 84.91908246 4.515736296 5.94922E-05 211.5624894 555.3818764 211.5624894 555.3818764
Full Load Displacement (Ton) 0.515225073 0.069130311 7.452954695 6.0477E-09 0.375278077 0.655172069 0.375278077 0.655172069
Y=383.47+0.52*SFD
Where
Y= Labor Cost (Man Day)
SFD= Full Load Displacement (Ton)
Appendix B. Regression Analysis Equations & Statistical Parameters for Warships
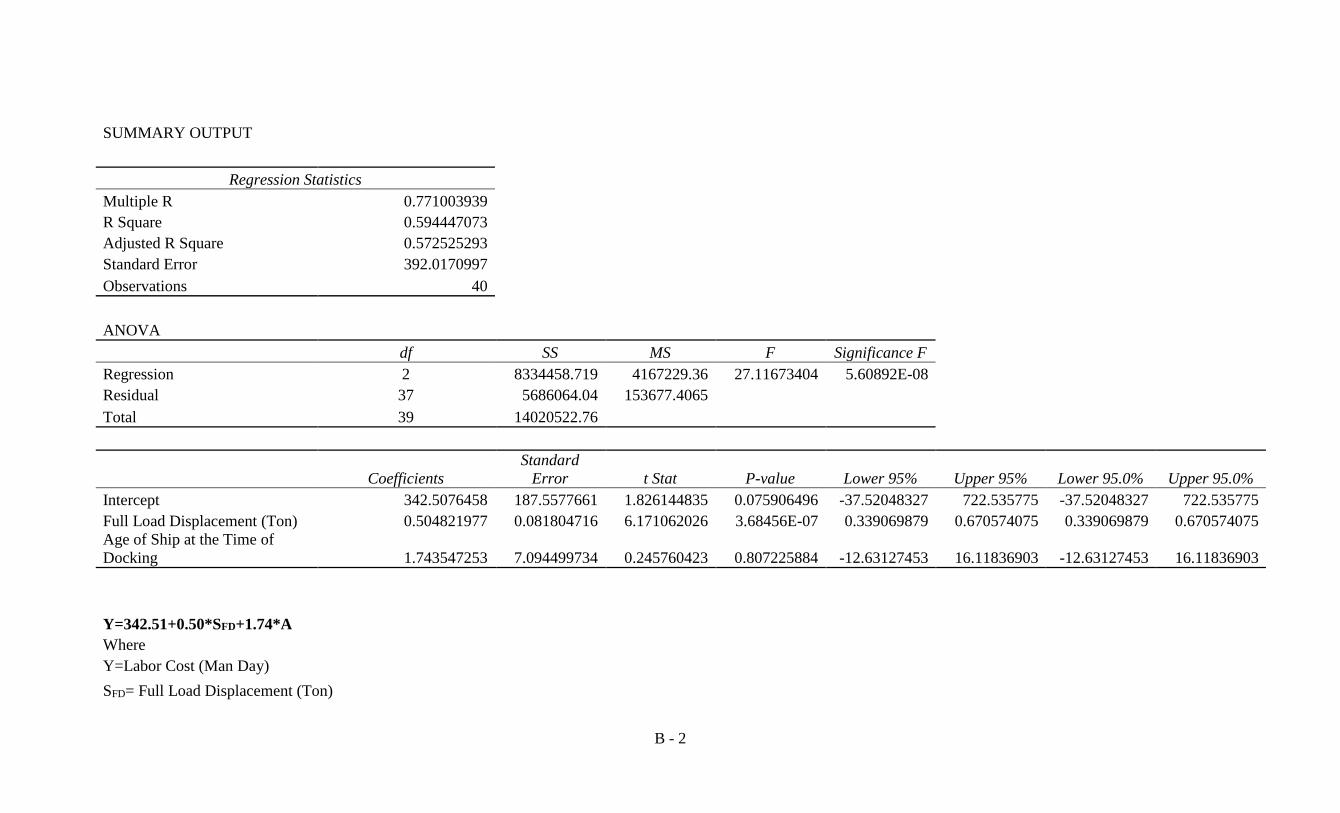
B - 2
SUMMARY OUTPUT
Regression Statistics
Multiple R 0.771003939
R Square 0.594447073
Adjusted R Square 0.572525293
Standard Error 392.0170997
Observations 40
ANOVA
df SS MS F Significance F
Regression 2 8334458.719 4167229.36 27.11673404 5.60892E-08
Residual 37 5686064.04 153677.4065
Total 39 14020522.76
Coefficients
Standard
Error t Stat P-value Lower 95% Upper 95% Lower 95.0% Upper 95.0%
Intercept 342.5076458 187.5577661 1.826144835 0.075906496 -37.52048327 722.535775 -37.52048327 722.535775
Full Load Displacement (Ton) 0.504821977 0.081804716 6.171062026 3.68456E-07 0.339069879 0.670574075 0.339069879 0.670574075
Age of Ship at the Time of
Docking 1.743547253 7.094499734 0.245760423 0.807225884 -12.63127453 16.11836903 -12.63127453 16.11836903
Y=342.51+0.50*SFD+1.74*A
Where
Y=Labor Cost (Man Day)
SFD= Full Load Displacement (Ton)

B - 3
A= Age of Ship at the Time of Docking (Year)
SUMMARY OUTPUT
Regression Statistics
Multiple R 0.77890174
R Square 0.60668792
Adjusted R Square 0.573911914
Standard Error 391.3807809
Observations 40
ANOVA
df SS MS F Significance F
Regression 3 8506081.796 2835360.599 18.51012319 1.96319E-07
Residual 36 5514440.962 153178.9156
Total 39 14020522.76
Coefficients
Standard
Error t Stat P-value Lower 95% Upper 95% Lower 95.0% Upper 95.0%
Intercept 600.5882242 307.4269932 1.95359626 0.058553865 -22.90261214 1224.079061 -22.90261214 1224.079061
Full Load Displacement (Ton) 0.610649954 0.129097868 4.730131988 3.41705E-05 0.348827345 0.872472564 0.348827345 0.872472564
Age of Docking Ship at the
Time of Docking -0.466023609 7.384184464 -0.063111046 0.950027201 -15.44184372 14.5097965 -15.44184372 14.5097965
Values for Type of Ship -174.7404467 165.0840423 -1.05849387 0.296881292 -509.5464003 160.0655068 -509.5464003 160.0655068
Y=600.59+0.611*SFD+(-0.47)*A+(-174.74)*T

B - 4
Where
Y= Labor Cost (Man Day)
SFD= Full Load Displacement (Ton)
A= Age of Ship at the Time of Docking
T= Values for Type of Ship
SUMMARY OUTPUT
Regression Statistics
Multiple R 0.945619877
R Square 0.894196951
Adjusted R Square 0.882105174
Standard Error 205.8719472
Observations 40
ANOVA
df SS MS F Significance F
Regression 4 12537108.71 3134277.177 73.95083054 1.41284E-16
Residual 35 1483414.052 42383.25863
Total 39 14020522.76
Coefficients
Standard
Error t Stat P-value Lower 95% Upper 95% Lower 95.0% Upper 95.0%
Intercept -137.6593047 178.5520394 -0.770975819 0.445895025 -500.1392132 224.8206038 -500.1392132 224.8206038
Full Load Displacement (Ton) 0.147860674 0.08284496 1.78478781 0.08296592 -0.020323534 0.316044882 -0.020323534 0.316044882
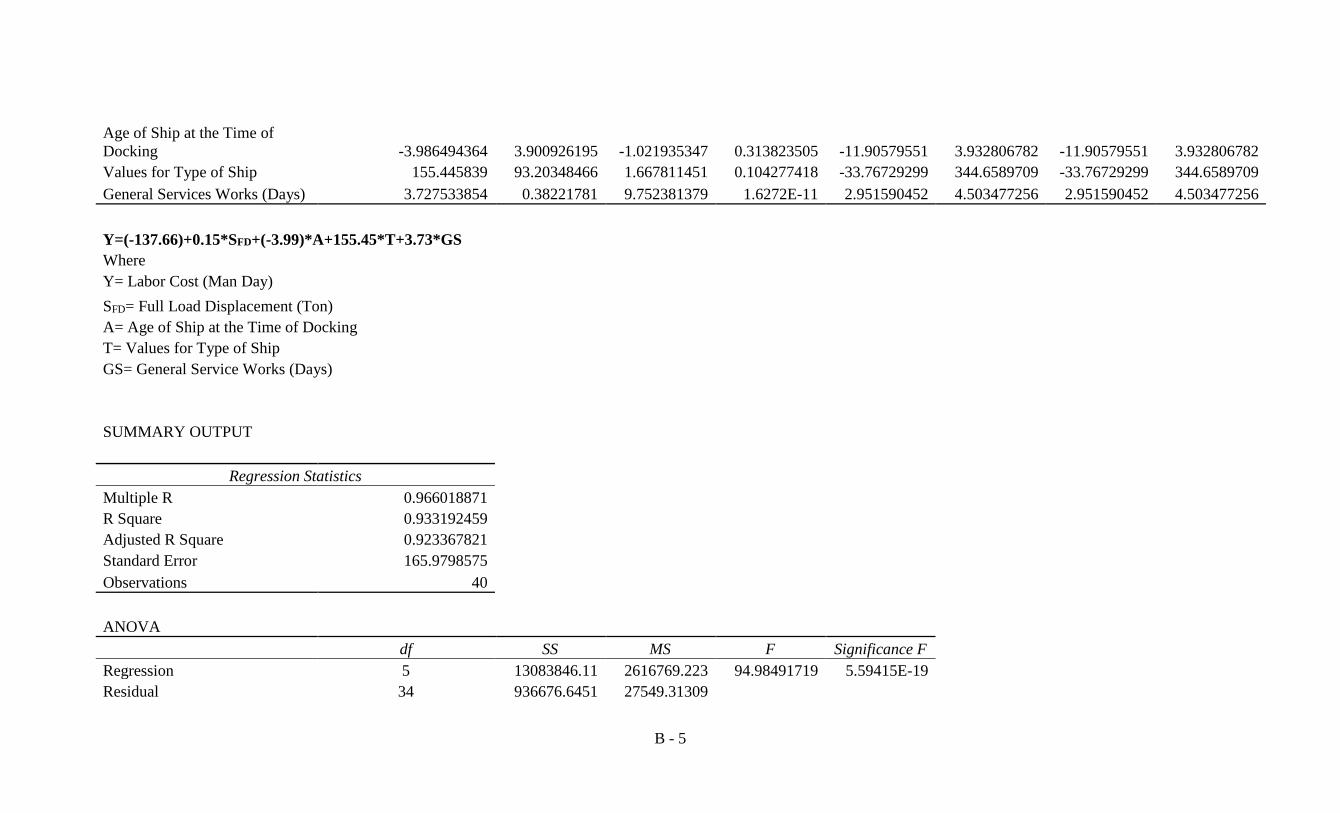
B - 5
Age of Ship at the Time of
Docking -3.986494364 3.900926195 -1.021935347 0.313823505 -11.90579551 3.932806782 -11.90579551 3.932806782
Values for Type of Ship 155.445839 93.20348466 1.667811451 0.104277418 -33.76729299 344.6589709 -33.76729299 344.6589709
General Services Works (Days) 3.727533854 0.38221781 9.752381379 1.6272E-11 2.951590452 4.503477256 2.951590452 4.503477256
Y=(-137.66)+0.15*SFD+(-3.99)*A+155.45*T+3.73*GS
Where
Y= Labor Cost (Man Day)
SFD= Full Load Displacement (Ton)
A= Age of Ship at the Time of Docking
T= Values for Type of Ship
GS= General Service Works (Days)
SUMMARY OUTPUT
Regression Statistics
Multiple R 0.966018871
R Square 0.933192459
Adjusted R Square 0.923367821
Standard Error 165.9798575
Observations 40
ANOVA
df SS MS F Significance F
Regression 5 13083846.11 2616769.223 94.98491719 5.59415E-19
Residual 34 936676.6451 27549.31309
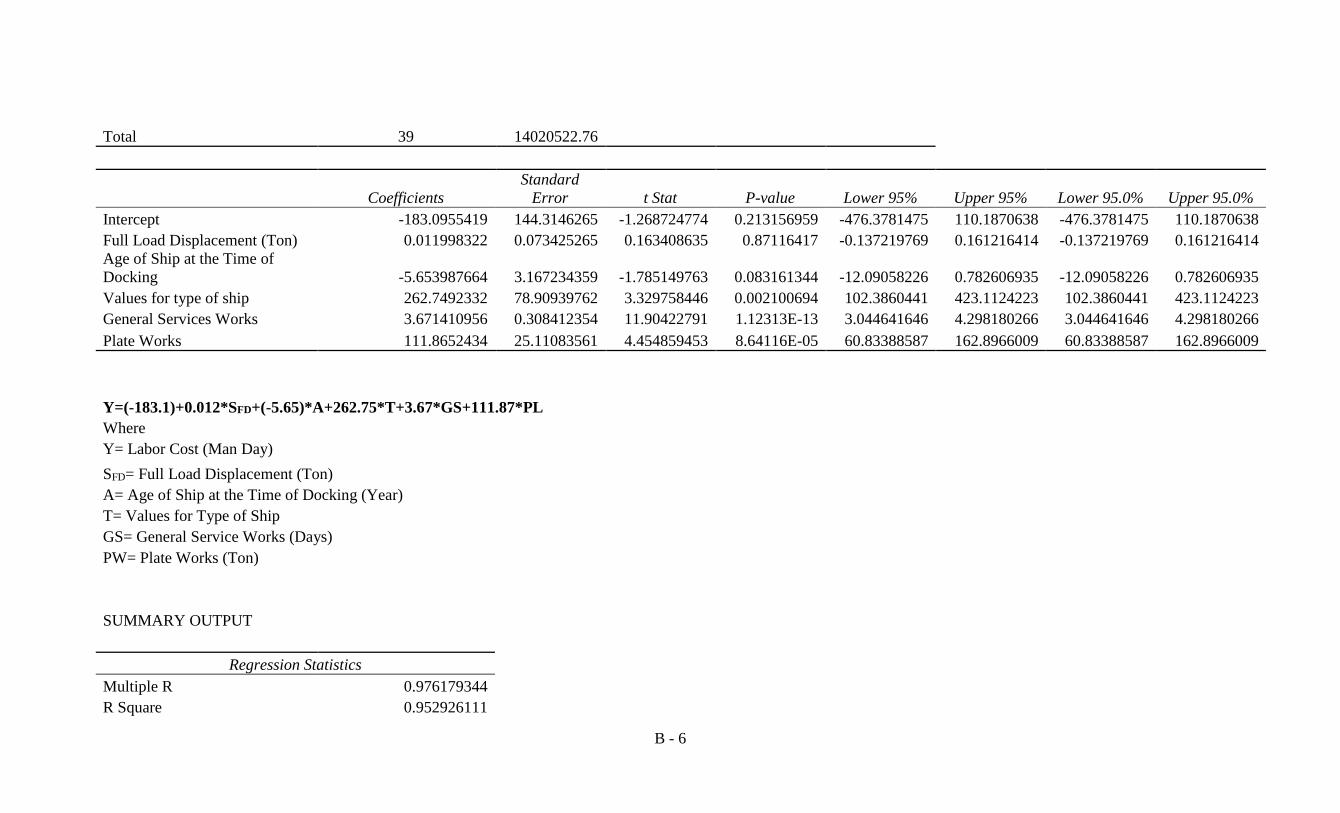
B - 6
Total 39 14020522.76
Coefficients
Standard
Error t Stat P-value Lower 95% Upper 95% Lower 95.0% Upper 95.0%
Intercept -183.0955419 144.3146265 -1.268724774 0.213156959 -476.3781475 110.1870638 -476.3781475 110.1870638
Full Load Displacement (Ton) 0.011998322 0.073425265 0.163408635 0.87116417 -0.137219769 0.161216414 -0.137219769 0.161216414
Age of Ship at the Time of
Docking -5.653987664 3.167234359 -1.785149763 0.083161344 -12.09058226 0.782606935 -12.09058226 0.782606935
Values for type of ship 262.7492332 78.90939762 3.329758446 0.002100694 102.3860441 423.1124223 102.3860441 423.1124223
General Services Works 3.671410956 0.308412354 11.90422791 1.12313E-13 3.044641646 4.298180266 3.044641646 4.298180266
Plate Works 111.8652434 25.11083561 4.454859453 8.64116E-05 60.83388587 162.8966009 60.83388587 162.8966009
Y=(-183.1)+0.012*SFD+(-5.65)*A+262.75*T+3.67*GS+111.87*PL
Where
Y= Labor Cost (Man Day)
SFD= Full Load Displacement (Ton)
A= Age of Ship at the Time of Docking (Year)
T= Values for Type of Ship
GS= General Service Works (Days)
PW= Plate Works (Ton)
SUMMARY OUTPUT
Regression Statistics
Multiple R 0.976179344
R Square 0.952926111
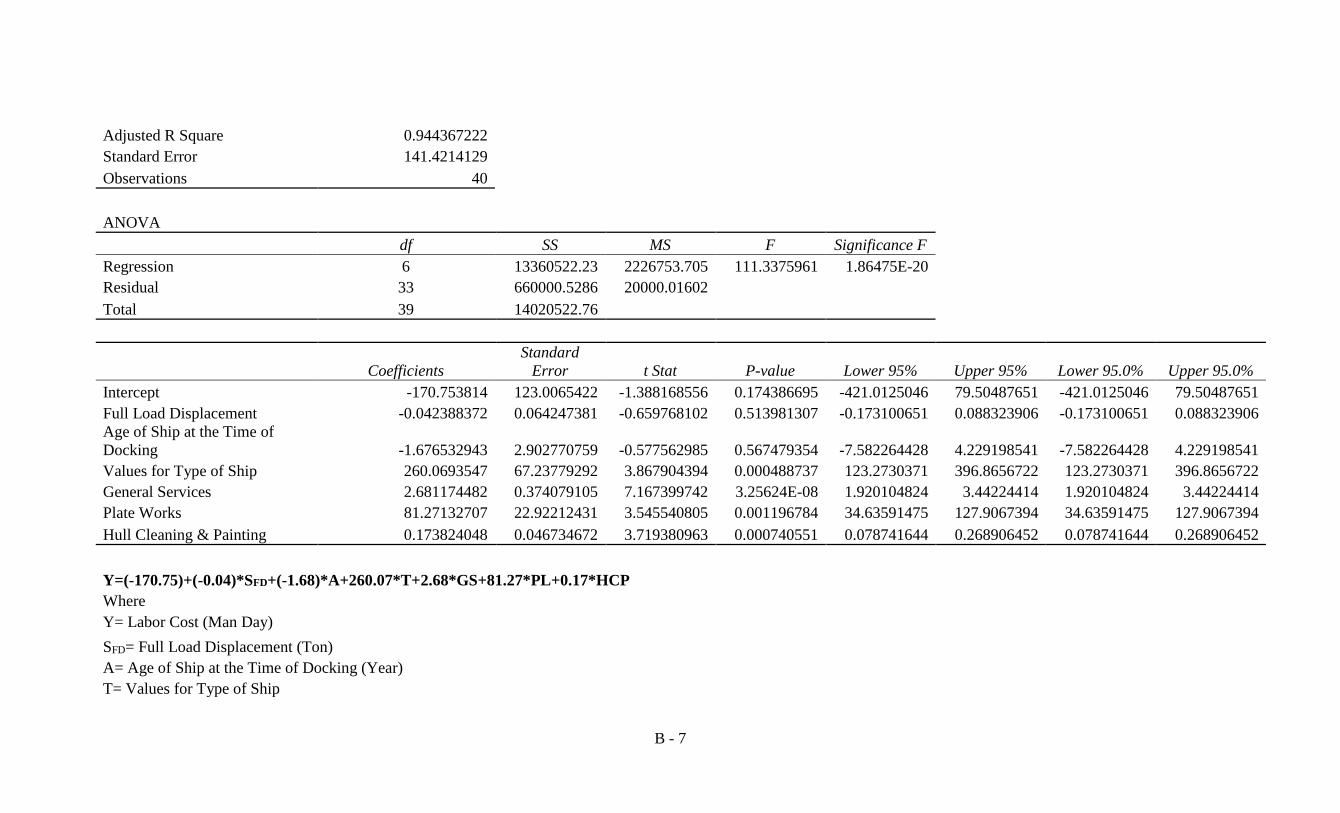
B - 7
Adjusted R Square 0.944367222
Standard Error 141.4214129
Observations 40
ANOVA
df SS MS F Significance F
Regression 6 13360522.23 2226753.705 111.3375961 1.86475E-20
Residual 33 660000.5286 20000.01602
Total 39 14020522.76
Coefficients
Standard
Error t Stat P-value Lower 95% Upper 95% Lower 95.0% Upper 95.0%
Intercept -170.753814 123.0065422 -1.388168556 0.174386695 -421.0125046 79.50487651 -421.0125046 79.50487651
Full Load Displacement -0.042388372 0.064247381 -0.659768102 0.513981307 -0.173100651 0.088323906 -0.173100651 0.088323906
Age of Ship at the Time of
Docking -1.676532943 2.902770759 -0.577562985 0.567479354 -7.582264428 4.229198541 -7.582264428 4.229198541
Values for Type of Ship 260.0693547 67.23779292 3.867904394 0.000488737 123.2730371 396.8656722 123.2730371 396.8656722
General Services 2.681174482 0.374079105 7.167399742 3.25624E-08 1.920104824 3.44224414 1.920104824 3.44224414
Plate Works 81.27132707 22.92212431 3.545540805 0.001196784 34.63591475 127.9067394 34.63591475 127.9067394
Hull Cleaning & Painting 0.173824048 0.046734672 3.719380963 0.000740551 0.078741644 0.268906452 0.078741644 0.268906452
Y=(-170.75)+(-0.04)*SFD+(-1.68)*A+260.07*T+2.68*GS+81.27*PL+0.17*HCP
Where
Y= Labor Cost (Man Day)
SFD= Full Load Displacement (Ton)
A= Age of Ship at the Time of Docking (Year)
T= Values for Type of Ship
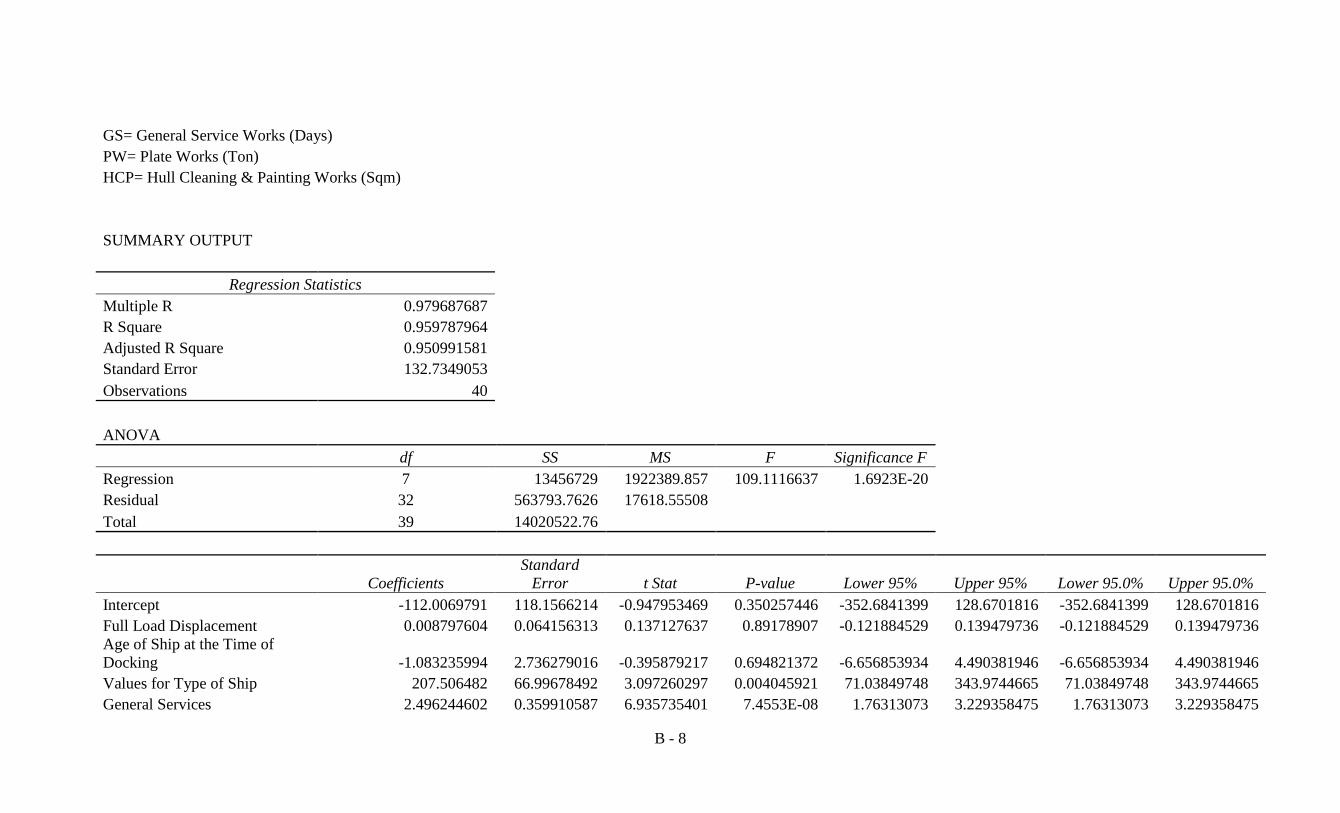
B - 8
GS= General Service Works (Days)
PW= Plate Works (Ton)
HCP= Hull Cleaning & Painting Works (Sqm)
SUMMARY OUTPUT
Regression Statistics
Multiple R 0.979687687
R Square 0.959787964
Adjusted R Square 0.950991581
Standard Error 132.7349053
Observations 40
ANOVA
df SS MS F Significance F
Regression 7 13456729 1922389.857 109.1116637 1.6923E-20
Residual 32 563793.7626 17618.55508
Total 39 14020522.76
Coefficients
Standard
Error t Stat P-value Lower 95% Upper 95% Lower 95.0% Upper 95.0%
Intercept -112.0069791 118.1566214 -0.947953469 0.350257446 -352.6841399 128.6701816 -352.6841399 128.6701816
Full Load Displacement 0.008797604 0.064156313 0.137127637 0.89178907 -0.121884529 0.139479736 -0.121884529 0.139479736
Age of Ship at the Time of
Docking -1.083235994 2.736279016 -0.395879217 0.694821372 -6.656853934 4.490381946 -6.656853934 4.490381946
Values for Type of Ship 207.506482 66.99678492 3.097260297 0.004045921 71.03849748 343.9744665 71.03849748 343.9744665
General Services 2.496244602 0.359910587 6.935735401 7.4553E-08 1.76313073 3.229358475 1.76313073 3.229358475

B - 9
Plate Works 54.31997089 24.41071019 2.225251559 0.033236476 4.596981596 104.0429602 4.596981596 104.0429602
Hull Cleaning & Painting
Works 0.167458374 0.043948602 3.810323113 0.000594877 0.077938002 0.256978747 0.077938002 0.256978747
Piping Works 2.216517358 0.948535246 2.336779121 0.025872047 0.284414297 4.14862042 0.284414297 4.14862042
Y=(-112.01)+0.0088*SFD+(-1.08)*A+207.51*T+2.5*GS+54.32*PL+0.17*HCP+2.22*P
Where
Y=Labor Cost (Man Day)
SFD= Full Load Displacement (Ton)
A= Age of Ship at the Time of Docking (Year)
T= Values for Type of Ship
GS= General Service Works (Days)
PW= Plate Works (Ton)
HCP= Hull Cleaning & Painting (Sqm)
P= Piping Works (Rm)
SUMMARY OUTPUT
Regression Statistics
Multiple R 0.980763048
R Square 0.961896156
Adjusted R Square 0.952062905
Standard Error 131.2760965
Observations 40
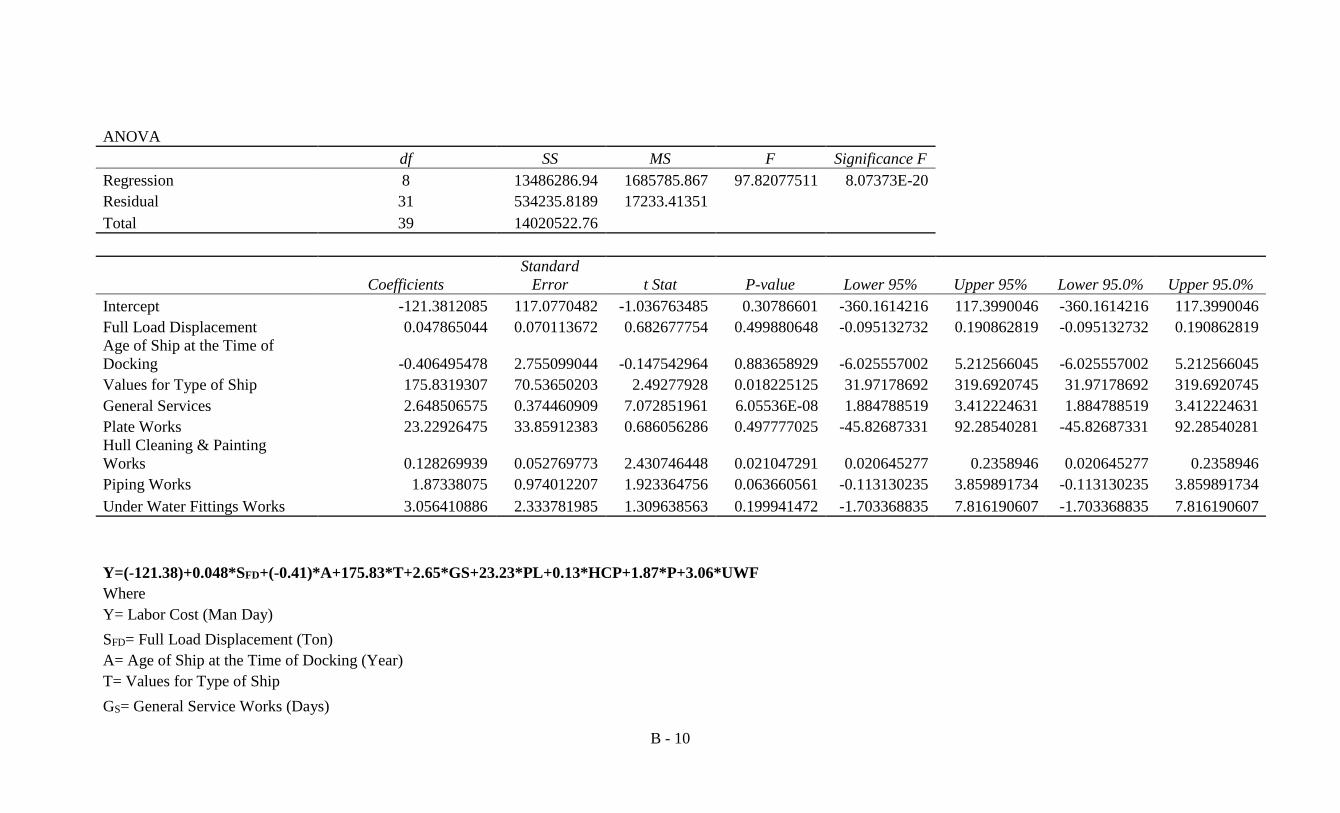
B - 10
ANOVA
df SS MS F Significance F
Regression 8 13486286.94 1685785.867 97.82077511 8.07373E-20
Residual 31 534235.8189 17233.41351
Total 39 14020522.76
Coefficients
Standard
Error t Stat P-value Lower 95% Upper 95% Lower 95.0% Upper 95.0%
Intercept -121.3812085 117.0770482 -1.036763485 0.30786601 -360.1614216 117.3990046 -360.1614216 117.3990046
Full Load Displacement 0.047865044 0.070113672 0.682677754 0.499880648 -0.095132732 0.190862819 -0.095132732 0.190862819
Age of Ship at the Time of
Docking -0.406495478 2.755099044 -0.147542964 0.883658929 -6.025557002 5.212566045 -6.025557002 5.212566045
Values for Type of Ship 175.8319307 70.53650203 2.49277928 0.018225125 31.97178692 319.6920745 31.97178692 319.6920745
General Services 2.648506575 0.374460909 7.072851961 6.05536E-08 1.884788519 3.412224631 1.884788519 3.412224631
Plate Works 23.22926475 33.85912383 0.686056286 0.497777025 -45.82687331 92.28540281 -45.82687331 92.28540281
Hull Cleaning & Painting
Works 0.128269939 0.052769773 2.430746448 0.021047291 0.020645277 0.2358946 0.020645277 0.2358946
Piping Works 1.87338075 0.974012207 1.923364756 0.063660561 -0.113130235 3.859891734 -0.113130235 3.859891734
Under Water Fittings Works 3.056410886 2.333781985 1.309638563 0.199941472 -1.703368835 7.816190607 -1.703368835 7.816190607
Y=(-121.38)+0.048*SFD+(-0.41)*A+175.83*T+2.65*GS+23.23*PL+0.13*HCP+1.87*P+3.06*UWF
Where
Y= Labor Cost (Man Day)
SFD= Full Load Displacement (Ton)
A= Age of Ship at the Time of Docking (Year)
T= Values for Type of Ship
GS= General Service Works (Days)
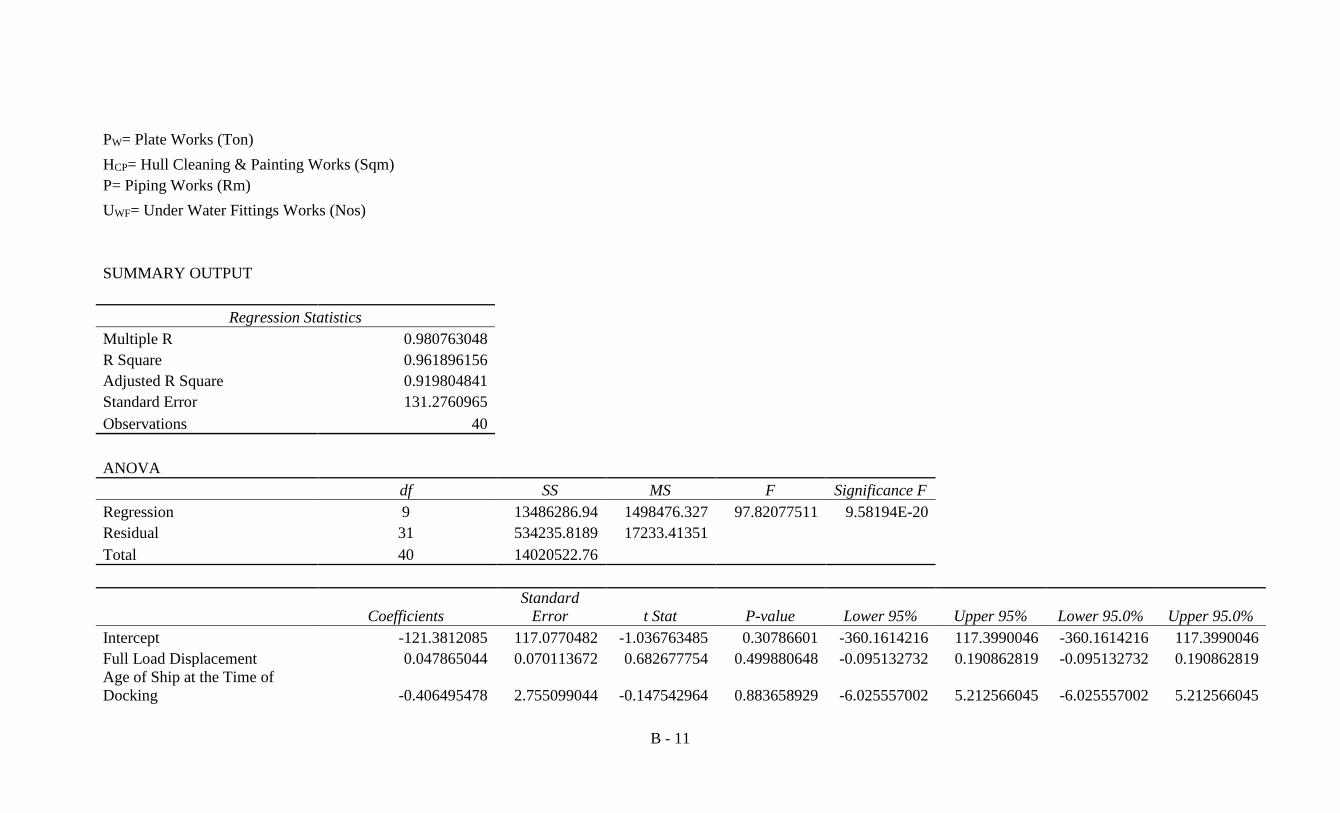
B - 11
PW= Plate Works (Ton)
HCP= Hull Cleaning & Painting Works (Sqm)
P= Piping Works (Rm)
UWF= Under Water Fittings Works (Nos)
SUMMARY OUTPUT
Regression Statistics
Multiple R 0.980763048
R Square 0.961896156
Adjusted R Square 0.919804841
Standard Error 131.2760965
Observations 40
ANOVA
df SS MS F Significance F
Regression 9 13486286.94 1498476.327 97.82077511 9.58194E-20
Residual 31 534235.8189 17233.41351
Total 40 14020522.76
Coefficients
Standard
Error t Stat P-value Lower 95% Upper 95% Lower 95.0% Upper 95.0%
Intercept -121.3812085 117.0770482 -1.036763485 0.30786601 -360.1614216 117.3990046 -360.1614216 117.3990046
Full Load Displacement 0.047865044 0.070113672 0.682677754 0.499880648 -0.095132732 0.190862819 -0.095132732 0.190862819
Age of Ship at the Time of
Docking -0.406495478 2.755099044 -0.147542964 0.883658929 -6.025557002 5.212566045 -6.025557002 5.212566045
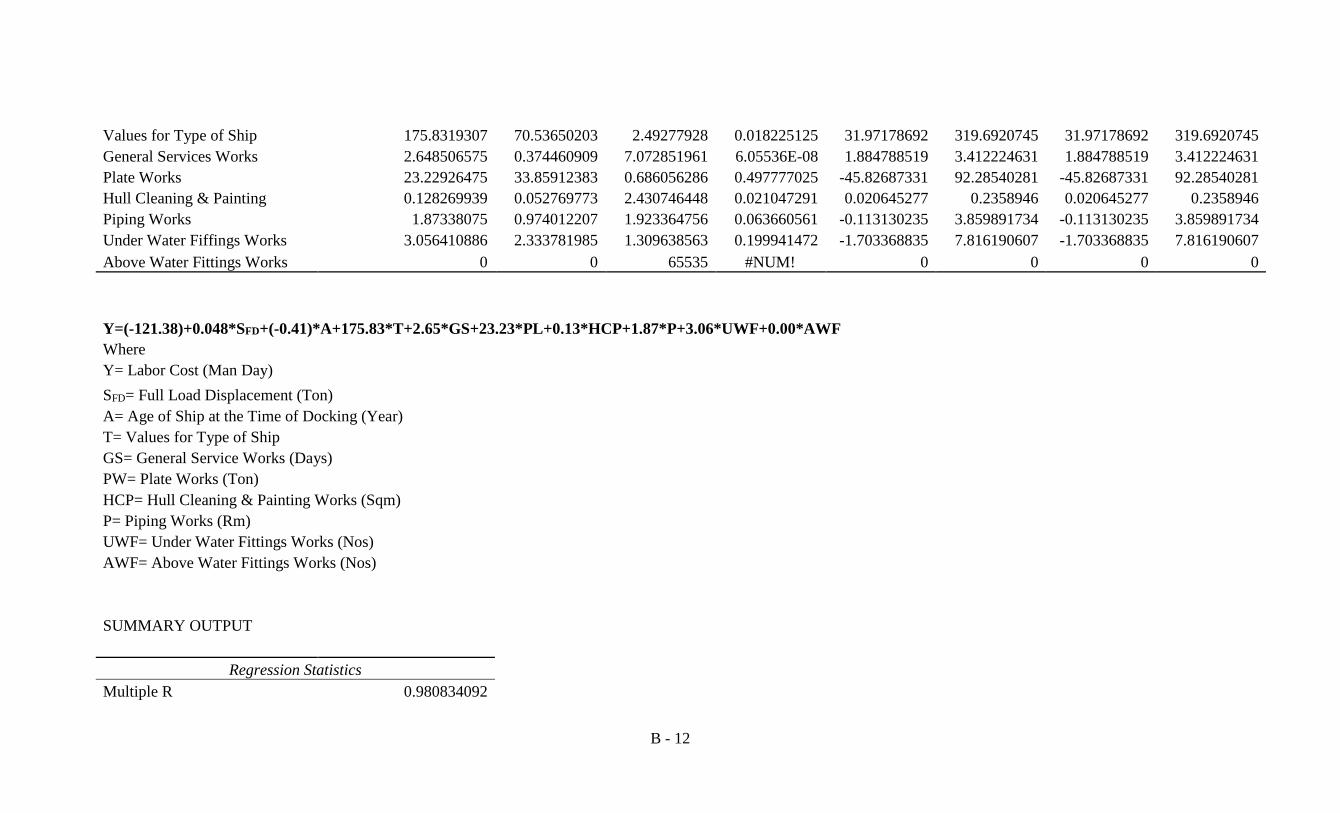
B - 12
Values for Type of Ship 175.8319307 70.53650203 2.49277928 0.018225125 31.97178692 319.6920745 31.97178692 319.6920745
General Services Works 2.648506575 0.374460909 7.072851961 6.05536E-08 1.884788519 3.412224631 1.884788519 3.412224631
Plate Works 23.22926475 33.85912383 0.686056286 0.497777025 -45.82687331 92.28540281 -45.82687331 92.28540281
Hull Cleaning & Painting 0.128269939 0.052769773 2.430746448 0.021047291 0.020645277 0.2358946 0.020645277 0.2358946
Piping Works 1.87338075 0.974012207 1.923364756 0.063660561 -0.113130235 3.859891734 -0.113130235 3.859891734
Under Water Fiffings Works 3.056410886 2.333781985 1.309638563 0.199941472 -1.703368835 7.816190607 -1.703368835 7.816190607
Above Water Fittings Works 0 0 65535 #NUM! 0 0 0 0
Y=(-121.38)+0.048*SFD+(-0.41)*A+175.83*T+2.65*GS+23.23*PL+0.13*HCP+1.87*P+3.06*UWF+0.00*AWF
Where
Y= Labor Cost (Man Day)
SFD= Full Load Displacement (Ton)
A= Age of Ship at the Time of Docking (Year)
T= Values for Type of Ship
GS= General Service Works (Days)
PW= Plate Works (Ton)
HCP= Hull Cleaning & Painting Works (Sqm)
P= Piping Works (Rm)
UWF= Under Water Fittings Works (Nos)
AWF= Above Water Fittings Works (Nos)
SUMMARY OUTPUT
Regression Statistics
Multiple R 0.980834092
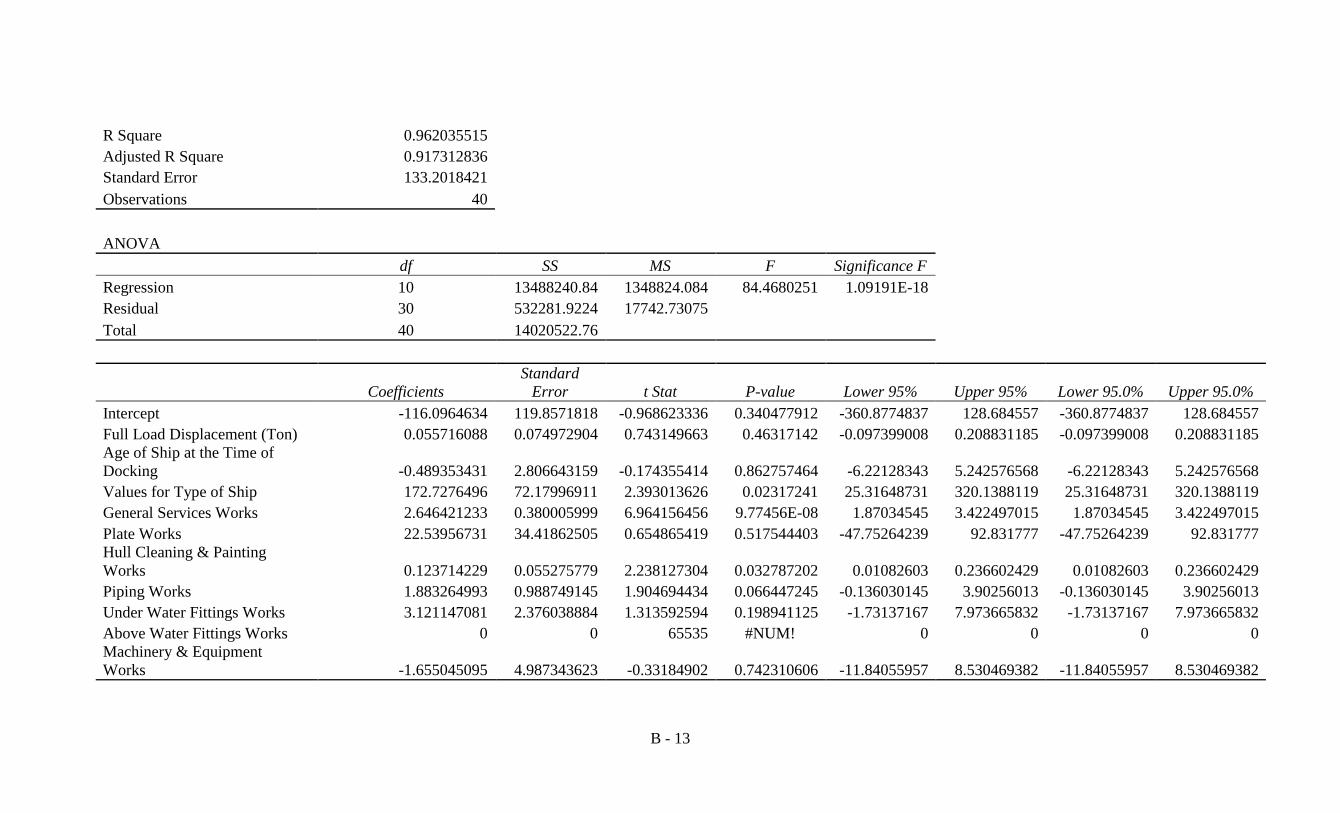
B - 13
R Square 0.962035515
Adjusted R Square 0.917312836
Standard Error 133.2018421
Observations 40
ANOVA
df SS MS F Significance F
Regression 10 13488240.84 1348824.084 84.4680251 1.09191E-18
Residual 30 532281.9224 17742.73075
Total 40 14020522.76
Coefficients
Standard
Error t Stat P-value Lower 95% Upper 95% Lower 95.0% Upper 95.0%
Intercept -116.0964634 119.8571818 -0.968623336 0.340477912 -360.8774837 128.684557 -360.8774837 128.684557
Full Load Displacement (Ton) 0.055716088 0.074972904 0.743149663 0.46317142 -0.097399008 0.208831185 -0.097399008 0.208831185
Age of Ship at the Time of
Docking -0.489353431 2.806643159 -0.174355414 0.862757464 -6.22128343 5.242576568 -6.22128343 5.242576568
Values for Type of Ship 172.7276496 72.17996911 2.393013626 0.02317241 25.31648731 320.1388119 25.31648731 320.1388119
General Services Works 2.646421233 0.380005999 6.964156456 9.77456E-08 1.87034545 3.422497015 1.87034545 3.422497015
Plate Works 22.53956731 34.41862505 0.654865419 0.517544403 -47.75264239 92.831777 -47.75264239 92.831777
Hull Cleaning & Painting
Works 0.123714229 0.055275779 2.238127304 0.032787202 0.01082603 0.236602429 0.01082603 0.236602429
Piping Works 1.883264993 0.988749145 1.904694434 0.066447245 -0.136030145 3.90256013 -0.136030145 3.90256013
Under Water Fittings Works 3.121147081 2.376038884 1.313592594 0.198941125 -1.73137167 7.973665832 -1.73137167 7.973665832
Above Water Fittings Works 0 0 65535 #NUM! 0 0 0 0
Machinery & Equipment
Works -1.655045095 4.987343623 -0.33184902 0.742310606 -11.84055957 8.530469382 -11.84055957 8.530469382
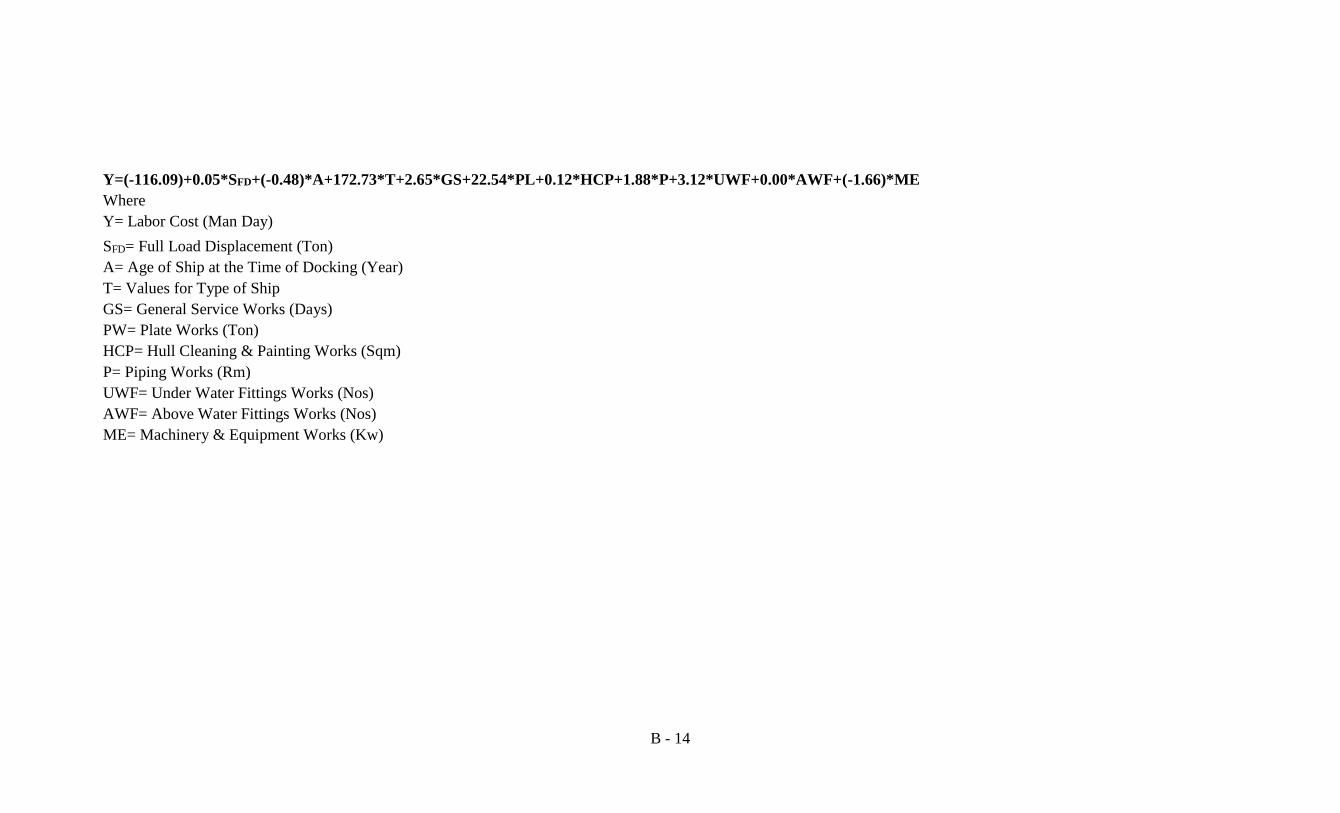
B - 14
Y=(-116.09)+0.05*SFD+(-0.48)*A+172.73*T+2.65*GS+22.54*PL+0.12*HCP+1.88*P+3.12*UWF+0.00*AWF+(-1.66)*ME
Where
Y= Labor Cost (Man Day)
SFD= Full Load Displacement (Ton)
A= Age of Ship at the Time of Docking (Year)
T= Values for Type of Ship
GS= General Service Works (Days)
PW= Plate Works (Ton)
HCP= Hull Cleaning & Painting Works (Sqm)
P= Piping Works (Rm)
UWF= Under Water Fittings Works (Nos)
AWF= Above Water Fittings Works (Nos)
ME= Machinery & Equipment Works (Kw)

C - 1
Regression Statistics
Multiple R 0.13010538
R Square 0.01692741
Adjusted R Square -0.05869356
Standard Error 1180.97918
Observations 15
ANOVA
df SS MS F Significance F
Regression 1 312199.9101 312199.9101 0.22384546 0.643970992
Residual 13 18131253.69 1394711.822
Total 14 18443453.6
Coefficients
Standard
Error t Stat P-value Lower 95% Upper 95% Lower 95.0%
Upper
95.0%
Intercept 1932.48635 329.8410802 5.858840712 5.60304E-05 1219.908018 2645.06468 1219.908018 2645.06468
Full Load Displacement 0.03003324 0.06347871 0.473123092 0.643970992 -0.107104171 0.167170658 -0.107104171 0.167170658
Y=1932.49+0.03*SFD
Where
Y=Labor Cost (Man Day)
SFD= Full Load Displacement
(Ton)
SUMMARY OUTPUT
Regression Statistics
Appendix C. Regression Analysis Equations & Statistical Parameters for Tug boat & Other Ships

C - 2
Multiple R 0.44226822
R Square 0.19560118
Adjusted R Square 0.0615347
Standard Error 1111.90124
Observations 15
ANOVA
df SS MS F Significance F
Regression 2 3607561.201 1803780.601 1.458986533 0.270912201
Residual 12 14835892.4 1236324.367
Total 14 18443453.6
Coefficients
Standard
Error t Stat P-value Lower 95% Upper 95% Lower 95.0%
Upper
95.0%
Intercept 1041.6319 627.8407226 1.6590703 0.122989394 -326.3155257 2409.579317 -326.3155257 2409.579317
Full Load Displacement 0.00714458 0.061388016 0.116383883 0.909273376 -0.126608422 0.140897574 -0.126608422 0.140897574
Age of Ship at the Time of
Docking 32.5823065 19.95705806 1.632620719 0.128494501 -10.90038767 76.06500061 -10.90038767 76.06500061
Y=1041.63+0.0071*SFD+32.58*A
Where
Y=Labor Cost (Man Day)
SFD= Full Load Displacement
(Ton)
A= Age of Ship at the Time of Docking (Year)
SUMMARY OUTPUT
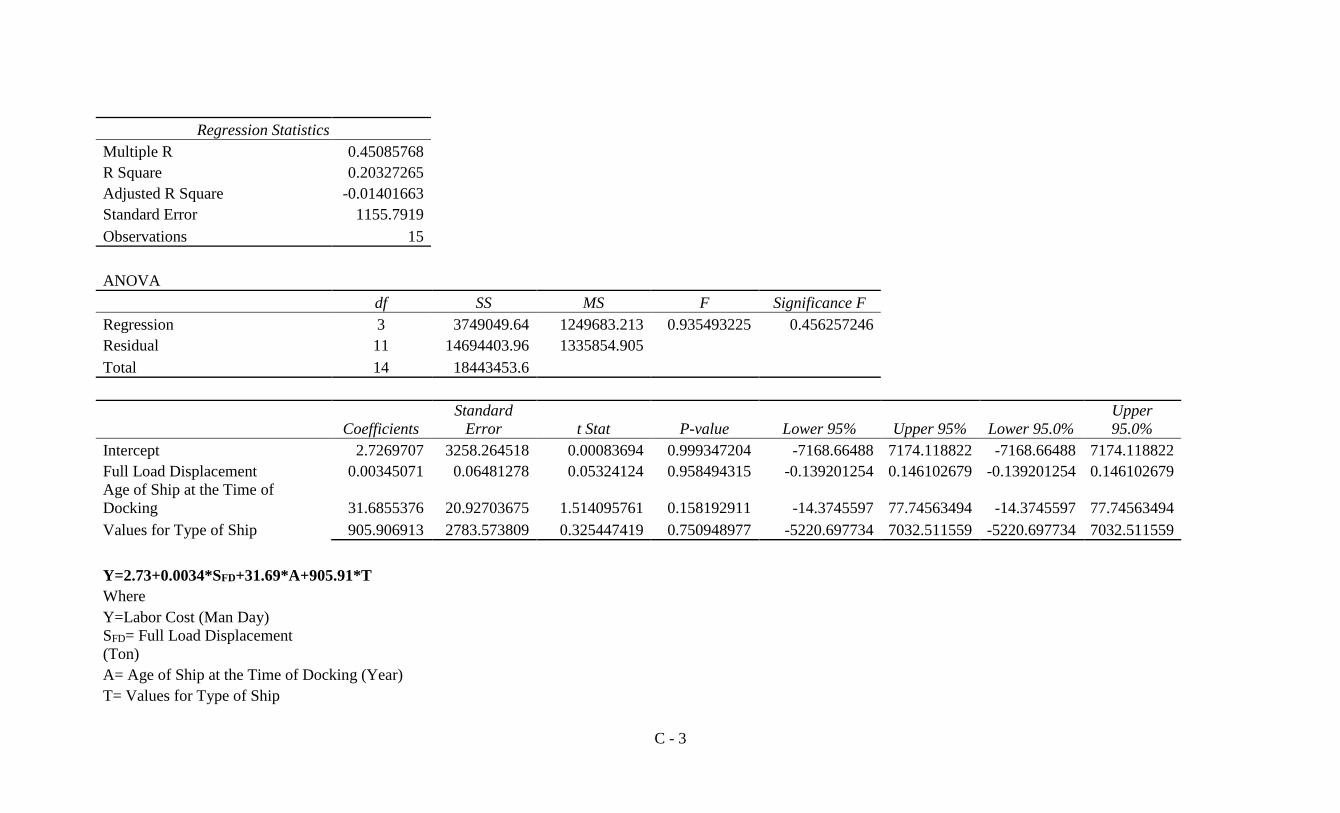
C - 3
Regression Statistics
Multiple R 0.45085768
R Square 0.20327265
Adjusted R Square -0.01401663
Standard Error 1155.7919
Observations 15
ANOVA
df SS MS F Significance F
Regression 3 3749049.64 1249683.213 0.935493225 0.456257246
Residual 11 14694403.96 1335854.905
Total 14 18443453.6
Coefficients
Standard
Error t Stat P-value Lower 95% Upper 95% Lower 95.0%
Upper
95.0%
Intercept 2.7269707 3258.264518 0.00083694 0.999347204 -7168.66488 7174.118822 -7168.66488 7174.118822
Full Load Displacement 0.00345071 0.06481278 0.05324124 0.958494315 -0.139201254 0.146102679 -0.139201254 0.146102679
Age of Ship at the Time of
Docking 31.6855376 20.92703675 1.514095761 0.158192911 -14.3745597 77.74563494 -14.3745597 77.74563494
Values for Type of Ship 905.906913 2783.573809 0.325447419 0.750948977 -5220.697734 7032.511559 -5220.697734 7032.511559
Y=2.73+0.0034*SFD+31.69*A+905.91*T
Where
Y=Labor Cost (Man Day)
SFD= Full Load Displacement
(Ton)
A= Age of Ship at the Time of Docking (Year)
T= Values for Type of Ship
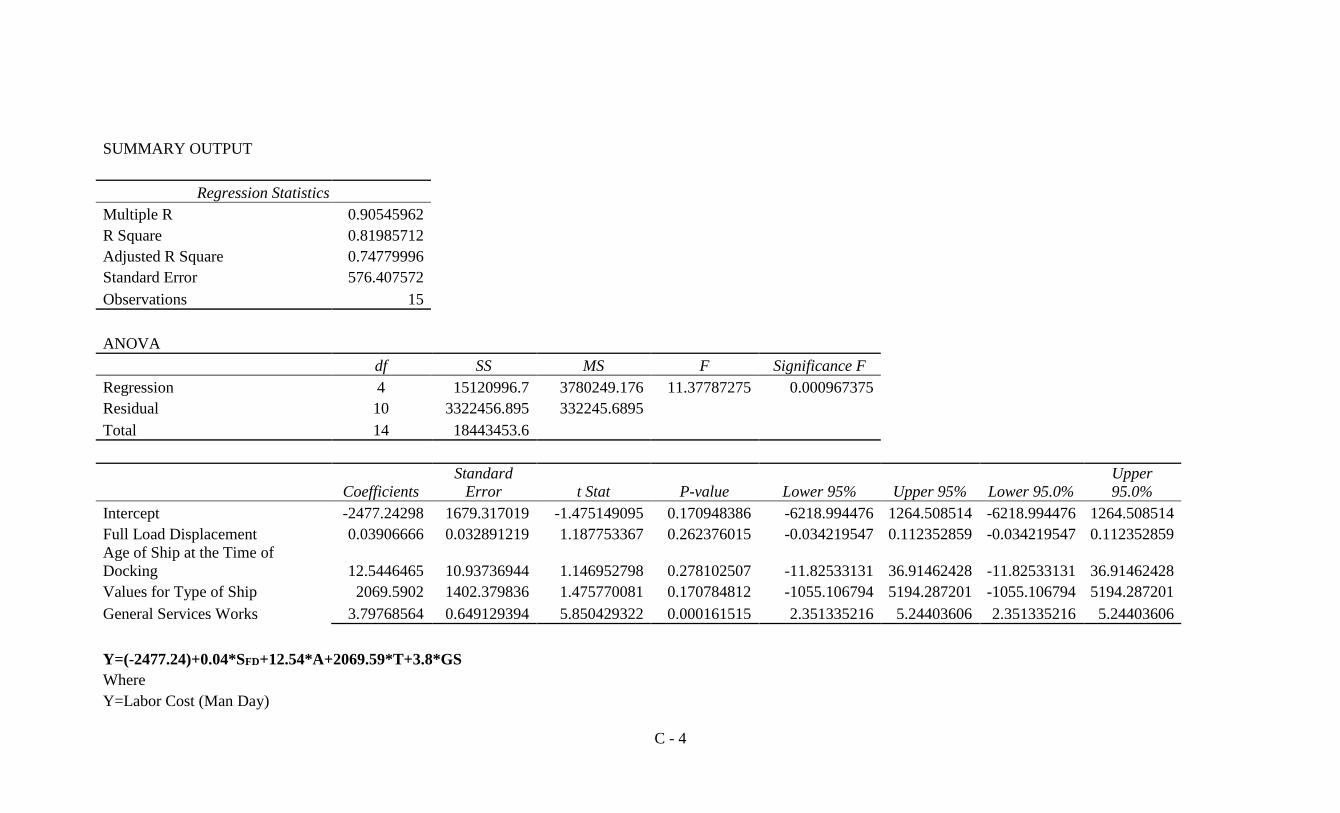
C - 4
SUMMARY OUTPUT
Regression Statistics
Multiple R 0.90545962
R Square 0.81985712
Adjusted R Square 0.74779996
Standard Error 576.407572
Observations 15
ANOVA
df SS MS F Significance F
Regression 4 15120996.7 3780249.176 11.37787275 0.000967375
Residual 10 3322456.895 332245.6895
Total 14 18443453.6
Coefficients
Standard
Error t Stat P-value Lower 95% Upper 95% Lower 95.0%
Upper
95.0%
Intercept -2477.24298 1679.317019 -1.475149095 0.170948386 -6218.994476 1264.508514 -6218.994476 1264.508514
Full Load Displacement 0.03906666 0.032891219 1.187753367 0.262376015 -0.034219547 0.112352859 -0.034219547 0.112352859
Age of Ship at the Time of
Docking 12.5446465 10.93736944 1.146952798 0.278102507 -11.82533131 36.91462428 -11.82533131 36.91462428
Values for Type of Ship 2069.5902 1402.379836 1.475770081 0.170784812 -1055.106794 5194.287201 -1055.106794 5194.287201
General Services Works 3.79768564 0.649129394 5.850429322 0.000161515 2.351335216 5.24403606 2.351335216 5.24403606
Y=(-2477.24)+0.04*SFD+12.54*A+2069.59*T+3.8*GS
Where
Y=Labor Cost (Man Day)

C - 5
SFD= Full Load Displacement
(Ton)
A= Age of Ship at the Time of Docking (Year)
T= Values for Type of Ship
GS= General Service Works
(Days)
SUMMARY OUTPUT
Regression Statistics
Multiple R 0.91983298
R Square 0.84609271
Adjusted R Square 0.76058867
Standard Error 561.603053
Observations 15
ANOVA
df SS MS F Significance F
Regression 5 15604871.7 3120974.34 9.895352691 0.001861849
Residual 9 2838581.902 315397.9891
Total 14 18443453.6
Coefficients
Standard
Error t Stat P-value Lower 95% Upper 95% Lower 95.0%
Upper
95.0%
Intercept -2500.873 1636.296463 -1.528374021 0.160770354 -6202.432767 1200.68676 -6202.432767 1200.68676
Full Load Displacement 0.04391773 0.032284877 1.360319017 0.206821701 -0.029115734 0.116951199 -0.029115734 0.116951199
Age of Ship at the Time of
Docking 10.5674633 10.77534703 0.980707467 0.352362808 -13.80806517 34.94299178 -13.80806517 34.94299178
Values for Type of Ship 2152.74781 1368.009385 1.573635262 0.150023138 -941.904422 5247.400036 -941.904422 5247.400036
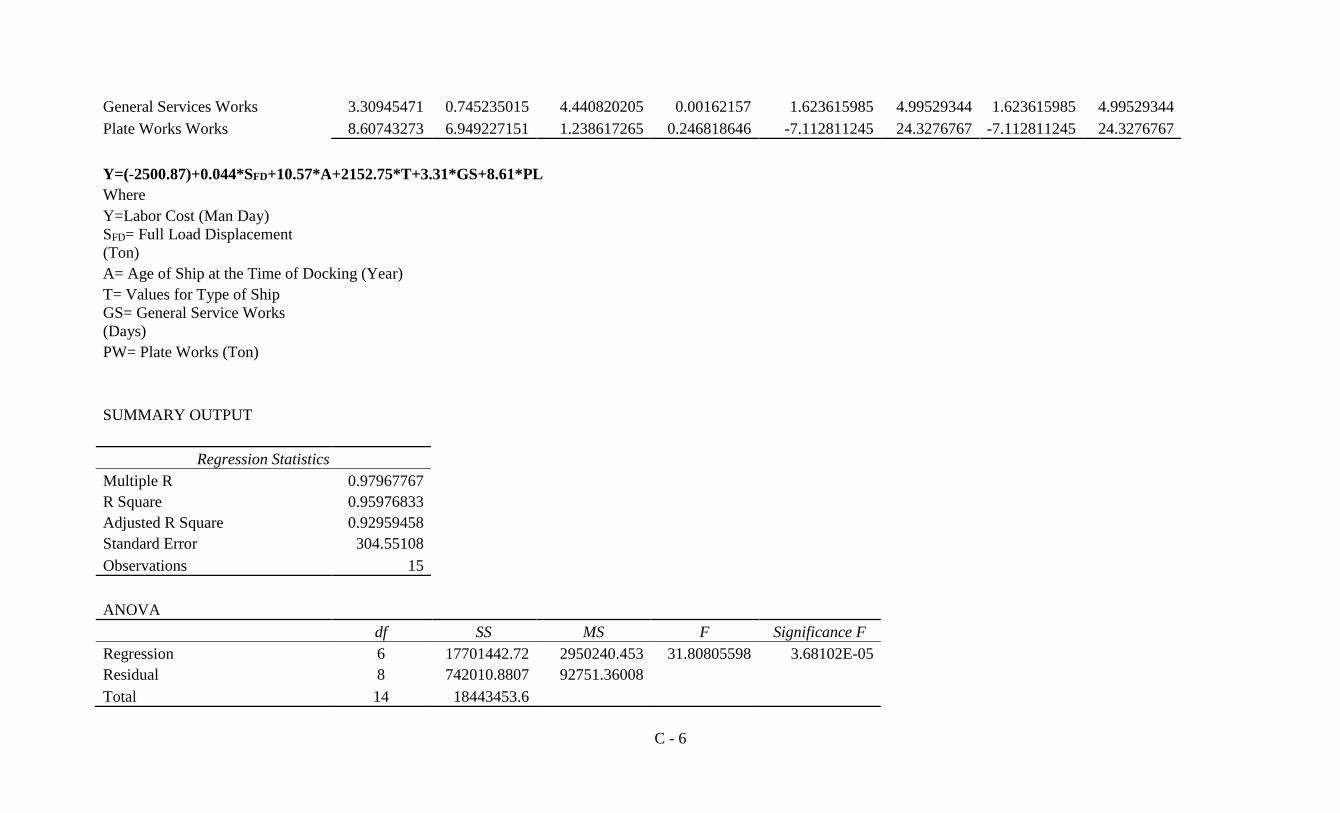
C - 6
General Services Works 3.30945471 0.745235015 4.440820205 0.00162157 1.623615985 4.99529344 1.623615985 4.99529344
Plate Works Works 8.60743273 6.949227151 1.238617265 0.246818646 -7.112811245 24.3276767 -7.112811245 24.3276767
Y=(-2500.87)+0.044*SFD+10.57*A+2152.75*T+3.31*GS+8.61*PL
Where
Y=Labor Cost (Man Day)
SFD= Full Load Displacement
(Ton)
A= Age of Ship at the Time of Docking (Year)
T= Values for Type of Ship
GS= General Service Works
(Days)
PW= Plate Works (Ton)
SUMMARY OUTPUT
Regression Statistics
Multiple R 0.97967767
R Square 0.95976833
Adjusted R Square 0.92959458
Standard Error 304.55108
Observations 15
ANOVA
df SS MS F Significance F
Regression 6 17701442.72 2950240.453 31.80805598 3.68102E-05
Residual 8 742010.8807 92751.36008
Total 14 18443453.6
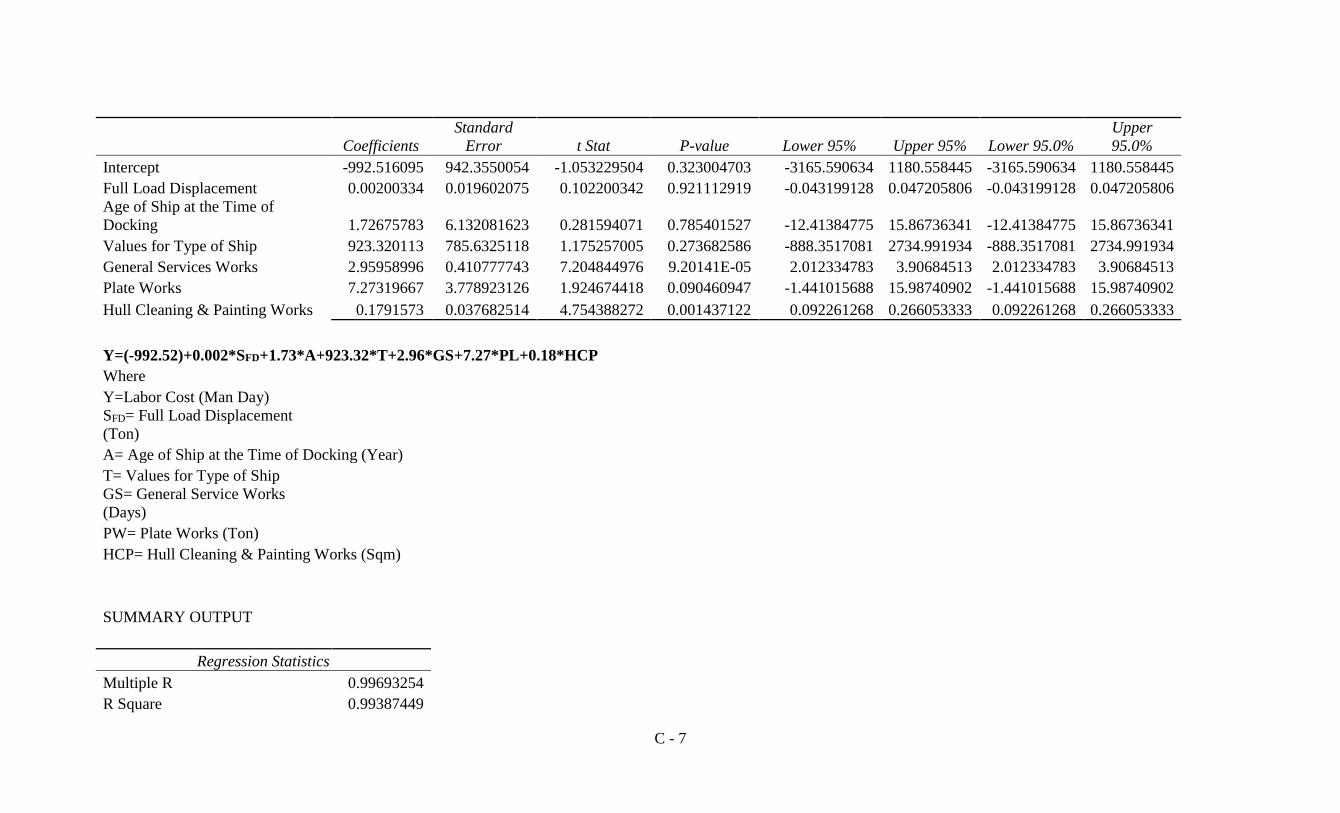
C - 7
Coefficients
Standard
Error t Stat P-value Lower 95% Upper 95% Lower 95.0%
Upper
95.0%
Intercept -992.516095 942.3550054 -1.053229504 0.323004703 -3165.590634 1180.558445 -3165.590634 1180.558445
Full Load Displacement 0.00200334 0.019602075 0.102200342 0.921112919 -0.043199128 0.047205806 -0.043199128 0.047205806
Age of Ship at the Time of
Docking 1.72675783 6.132081623 0.281594071 0.785401527 -12.41384775 15.86736341 -12.41384775 15.86736341
Values for Type of Ship 923.320113 785.6325118 1.175257005 0.273682586 -888.3517081 2734.991934 -888.3517081 2734.991934
General Services Works 2.95958996 0.410777743 7.204844976 9.20141E-05 2.012334783 3.90684513 2.012334783 3.90684513
Plate Works 7.27319667 3.778923126 1.924674418 0.090460947 -1.441015688 15.98740902 -1.441015688 15.98740902
Hull Cleaning & Painting Works 0.1791573 0.037682514 4.754388272 0.001437122 0.092261268 0.266053333 0.092261268 0.266053333
Y=(-992.52)+0.002*SFD+1.73*A+923.32*T+2.96*GS+7.27*PL+0.18*HCP
Where
Y=Labor Cost (Man Day)
SFD= Full Load Displacement
(Ton)
A= Age of Ship at the Time of Docking (Year)
T= Values for Type of Ship
GS= General Service Works
(Days)
PW= Plate Works (Ton)
HCP= Hull Cleaning & Painting Works (Sqm)
SUMMARY OUTPUT
Regression Statistics
Multiple R 0.99693254
R Square 0.99387449

C - 8
Adjusted R Square 0.98774898
Standard Error 127.040816
Observations 15
ANOVA
df SS MS F Significance F
Regression 7 18330478.02 2618639.717 162.251679 3.31075E-07
Residual 7 112975.583 16139.36899
Total 14 18443453.6
Coefficients
Standard
Error t Stat P-value Lower 95% Upper 95% Lower 95.0%
Upper
95.0%
Intercept -827.747951 393.9801363 -2.100989046 0.073763393 -1759.362936 103.8670342 -1759.362936 103.8670342
Full Load Displacement -0.00020113 0.008184455 -0.024574184 0.981080475 -0.019554287 0.019152034 -0.019554287 0.019152034
Age of Ship at the Time of
Docking -3.71612652 2.702439008 -1.375100977 0.211495018 -10.10637934 2.674126295 -10.10637934 2.674126295
Values for Type of Ship 1077.58337 328.6499485 3.278818015 0.01350905 300.4497331 1854.71701 300.4497331 1854.71701
General Services Works 1.89924721 0.241265106 7.872034381 0.00010102 1.328745888 2.469748528 1.328745888 2.469748528
Plate Works 3.05166158 1.715258333 1.779126513 0.118446083 -1.004279875 7.107603031 -1.004279875 7.107603031
Hull Cleaning & Painting Works 0.18071739 0.015720917 11.49534699 8.47894E-06 0.143543333 0.217891455 0.143543333 0.217891455
Piping Works 3.26742857 0.523373669 6.243012904 0.000427032 2.029846498 4.505010638 2.029846498 4.505010638
Y=(-827.77)+(-0.0002)*SFD+(-3.72)*A+1077.58*T+1.9*GS+3.05*PL+0.181*HCP+3.27*P
Where
Y=Labor Cost (Man Day)
SFD= Full Load Displacement
(Ton)
A= Age of Ship at the Time of Docking (Year)
T= Values for Type of Ship

C - 9
GS= General Service Works
(Days)
PW= Plate Works (Ton)
HCP= Hull Cleaning & Painting Works (Sqm)
P= Piping Works (Rm)
SUMMARY OUTPUT
Regression Statistics
Multiple R 0.99699644
R Square 0.9940019
Adjusted R Square 0.98600444
Standard Error 135.785125
Observations 15
ANOVA
df SS MS F Significance F
Regression 8 18332828 2291603.5 124.2896837 4.25792E-06
Residual 6 110625.6014 18437.60023
Total 14 18443453.6
Coefficients
Standard
Error t Stat P-value Lower 95% Upper 95% Lower 95.0%
Upper
95.0%
Intercept -938.727772 523.4091518 -1.793487501 0.123057212 -2219.463828 342.0082849 -2219.463828 342.0082849
Full Load Displacement -0.00134494 0.009316048 -0.144368086 0.889936966 -0.024140488 0.021450608 -0.024140488 0.021450608

C - 10
Age of Ship at the Time of
Docking -2.76557026 3.928398571 -0.703994315 0.50782393 -12.37801528 6.846874757 -12.37801528 6.846874757
Values for Type of Ship 1129.16441 379.8238037 2.972863743 0.024865168 199.7690481 2058.559781 199.7690481 2058.559781
General Services Works 1.91872049 0.263577225 7.27953827 0.000342164 1.273770259 2.563670729 1.273770259 2.563670729
Plate Works 3.62915372 2.444919936 1.484365059 0.188246106 -2.353349842 9.611657291 -2.353349842 9.611657291
Hull Cleaning & Painting Works 0.17309796 0.027163166 6.372525139 0.000701554 0.106632086 0.239563833 0.106632086 0.239563833
Piping Works 3.10035936 0.72932862 4.25097723 0.005374352 1.315756513 4.8849622 1.315756513 4.8849622
Under Water Fittings Works 0.85600069 2.397695784 0.357009714 0.733305093 -5.010949542 6.722950915 -5.010949542 6.722950915
Y=(-938.73)+(-0.0013)*SFD+(-2.77)*A+1129.16*T+1.92*GS+3.63*PL+0.17*HCP+3.1*P+0.86*UWF
Where
Y=Labor Cost (Man Day)
SFD= Full Load Displacement
(Ton)
A= Age of Ship at the Time of Docking (Year)
T= Values for Type of Ship
GS= General Service Works
(Days)
PW= Plate Works (Ton)
HCP= Hull Cleaning & Painting Works (Sqm)
P= Piping Works (Rm)
UWF= Under Water Fittings Works (Nos)
SUMMARY OUTPUT
Regression Statistics
Multiple R 0.99779532
R Square 0.99559551
Adjusted R Square 0.98766742

C - 11
Standard Error 127.463007
Observations 15
ANOVA
df SS MS F Significance F
Regression 9 18362219.51 2040246.612 125.5782264 2.37172E-05
Residual 5 81234.09092 16246.81818
Total 14 18443453.6
Coefficients
Standard
Error t Stat P-value Lower 95% Upper 95% Lower 95.0%
Upper
95.0%
Intercept -990.068267 492.8104952 -2.009024315 0.100771729 -2256.877975 276.74144 -2256.877975 276.74144
Full Load Displacement 0.01111384 0.012738853 0.872436361 0.422879957 -0.021632425 0.043860102 -0.021632425 0.043860102
Age of Ship at the Time of
Docking -3.44197771 3.72176489 -0.924824059 0.39749753 -13.00907893 6.125123512 -13.00907893 6.125123512
Values for Type of Ship 1148.59063 356.8372444 3.218808161 0.023496828 231.3112958 2065.869973 231.3112958 2065.869973
General Services Works 2.1909964 0.31968329 6.853646936 0.0010102 1.369224341 3.012768455 1.369224341 3.012768455
Plate Works 2.49147815 2.445980194 1.018601113 0.355120739 -3.796114109 8.779070407 -3.796114109 8.779070407
Hull Cleaning & Painting Works 0.1782363 0.025782965 6.912948181 0.000971036 0.11195908 0.244513523 0.11195908 0.244513523
Piping Works 2.68624692 0.750673813 3.578447619 0.015900938 0.75657845 4.615915387 0.75657845 4.615915387
Under Water Fittings Works 1.32735721 2.277863145 0.582720352 0.58537094 -4.528076413 7.182790838 -4.528076413 7.182790838
Above Water Fittings Works -7.07265995 5.258428653 -1.345013962 0.236403251 -20.58988113 6.444561225 -20.58988113 6.444561225
Y=(-990.07)+(0.01)*SFD+(-3.44)*A+1148.59*T+2.19*GS+2.49*PL+0.18*HCP+2.69*P+1.33*UWF+(-7.07)*AWF
Where
Y=Labor Cost (Man Day)
SFD= Full Load Displacement
(Ton)
A= Age of Ship at the Time of Docking (Year)
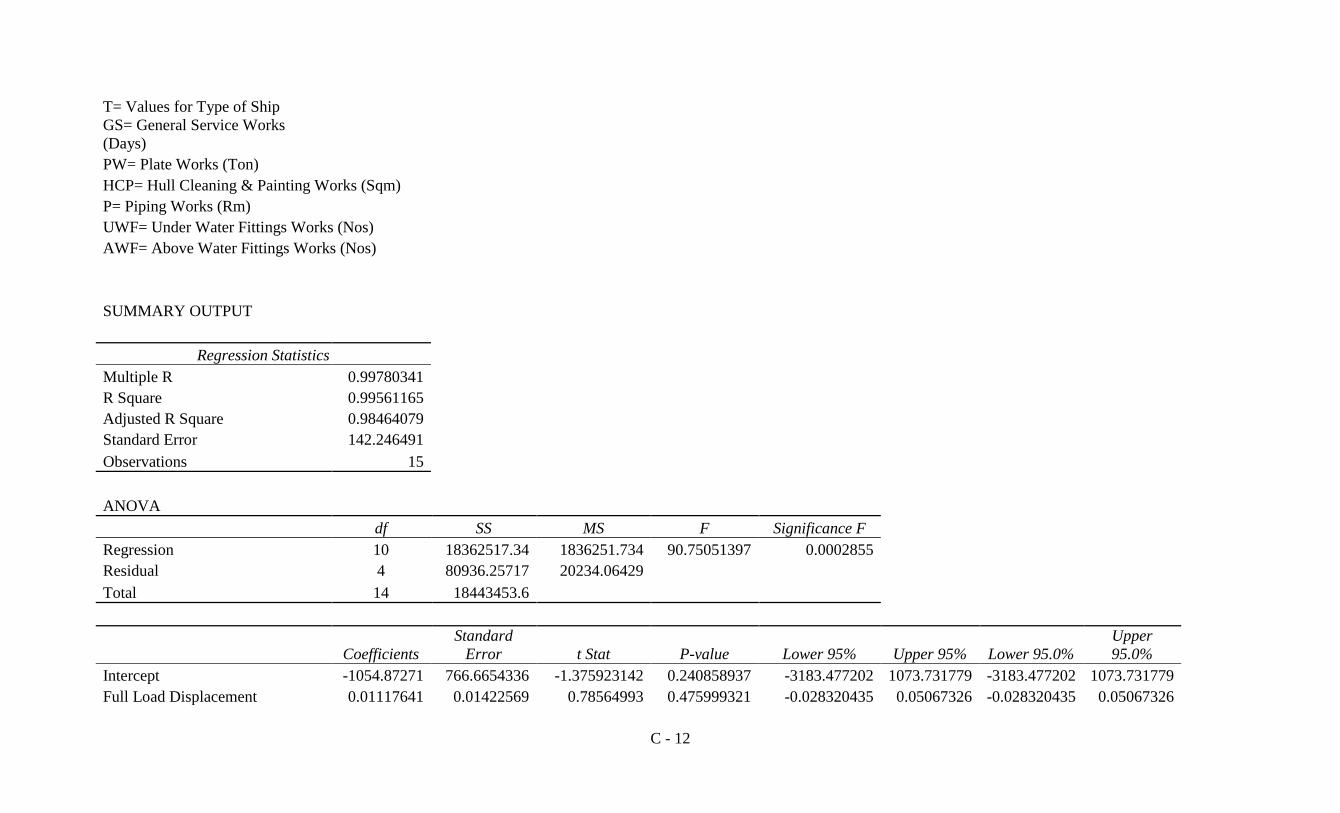
C - 12
T= Values for Type of Ship
GS= General Service Works
(Days)
PW= Plate Works (Ton)
HCP= Hull Cleaning & Painting Works (Sqm)
P= Piping Works (Rm)
UWF= Under Water Fittings Works (Nos)
AWF= Above Water Fittings Works (Nos)
SUMMARY OUTPUT
Regression Statistics
Multiple R 0.99780341
R Square 0.99561165
Adjusted R Square 0.98464079
Standard Error 142.246491
Observations 15
ANOVA
df SS MS F Significance F
Regression 10 18362517.34 1836251.734 90.75051397 0.0002855
Residual 4 80936.25717 20234.06429
Total 14 18443453.6
Coefficients
Standard
Error t Stat P-value Lower 95% Upper 95% Lower 95.0%
Upper
95.0%
Intercept -1054.87271 766.6654336 -1.375923142 0.240858937 -3183.477202 1073.731779 -3183.477202 1073.731779
Full Load Displacement 0.01117641 0.01422569 0.78564993 0.475999321 -0.028320435 0.05067326 -0.028320435 0.05067326

C - 13
Age of Ship at the Time of
Docking -3.49891589 4.179854859 -0.837090284 0.449639589 -15.10405345 8.106221674 -15.10405345 8.106221674
Values for Type of Ship 1199.99434 581.4605316 2.063758887 0.107991268 -414.3989075 2814.387586 -414.3989075 2814.387586
General Services Works 2.19753831 0.360812809 6.090521878 0.003674944 1.195761351 3.199315269 1.195761351 3.199315269
Plate Works 2.29440038 3.176440023 0.722318182 0.510070746 -6.524810973 11.11361174 -6.524810973 11.11361174
Hull Cleaning & Painting Works 0.17837653 0.028796544 6.194372791 0.003453311 0.098424505 0.258328553 0.098424505 0.258328553
Piping Works 2.6925473 0.839346879 3.20790768 0.03265389 0.362146765 5.022947832 0.362146765 5.022947832
Under Water Fittings Works 1.41278355 2.637769985 0.535597703 0.620629866 -5.910840019 8.736407109 -5.910840019 8.736407109
Above Water Fittings Works -7.27297846 6.096168992 -1.193040821 0.298780453 -24.19865702 9.652700098 -24.19865702 9.652700098
Machinery & Equipment Works 3.57132485 29.4363502 0.12132363 0.909285237 -78.15708559 85.29973529 -78.15708559 85.29973529
Y=(-1054.87)+(0.01)*SFD+(-3.5)*A+1199.99*T+2.2*GS+2.29*PL+0.18*HCP+2.69*P+1.41*UWF+(-7.27)*AWF+3.57*ME
Where
Y=Labor Cost (Man Day)
SFD= Full Load Displacement
(Ton)
A= Age of Ship at the Time of Docking (Year)
T= Values for Type of Ship
GS= General Service Works
(Days)
PL= Plate Works (Ton)
HCP= Hull Cleaning & Painting Works (Sqm)
P= Piping Works (Rm)
UWF= Under Water Fittings Works (Nos)
AWF= Above Water Fittings Works (Nos)
ME= Machinery & Equipment Works (kW)
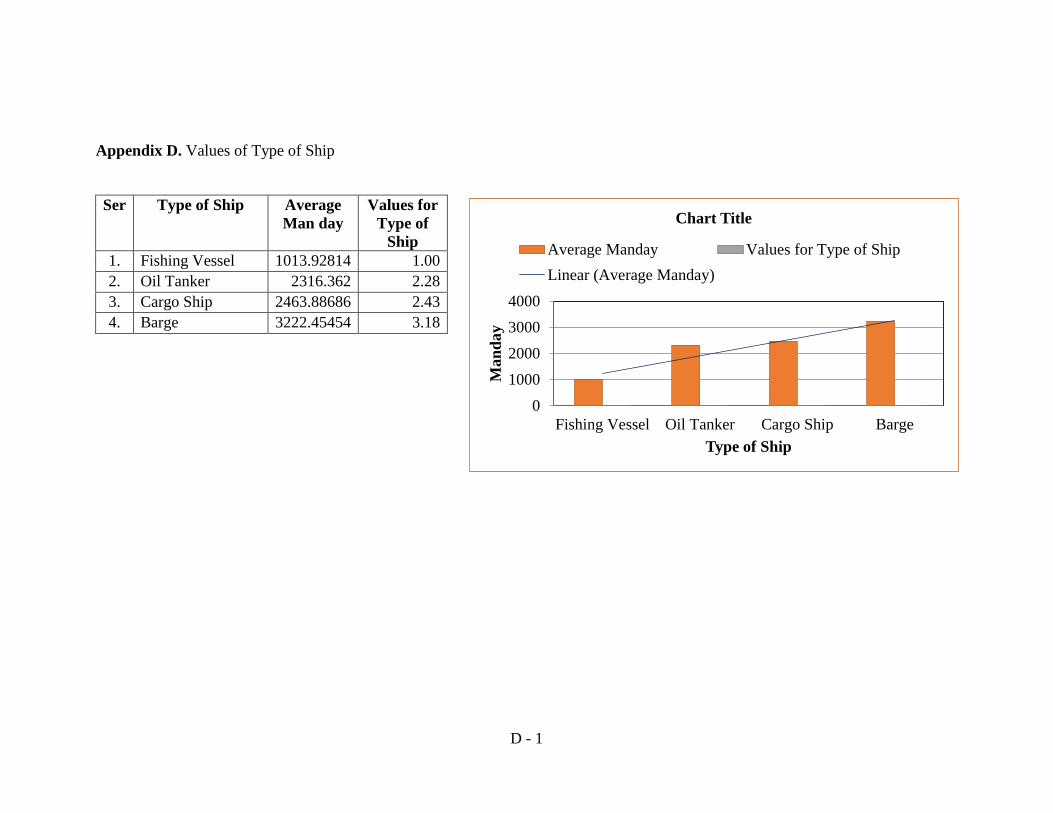
D - 1
Ser Type of Ship Average
Man day
Values for
Type of
Ship
1. Fishing Vessel 1013.92814 1.00
2. Oil Tanker 2316.362 2.28
3. Cargo Ship 2463.88686 2.43
4. Barge 3222.45454 3.18
Appendix D. Values of Type of Ship
0
1000
2000
3000
4000
Fishing Vessel Oil Tanker Cargo Ship Barge
Man
day
Type of Ship
Chart Title
Average Manday Values for Type of Ship
Linear (Average Manday)

D - 2
Ser Type of Ship Average
Man day
Values for
Type of
Ship
1 Patrol Craft 503.95 1.00
2 Offshore Partol Vessel 1029.98 2.04
3 Frigate/ Corvate 1182.81 2.35
0
200
400
600
800
1000
1200
1400
Patrol Craft Offshore Partol
Vessel
Frigate/ Corvate
Man
day
Type of Ship
Chart Title
Average Manday Values for Type of Ship
Linear (Average Manday)

D - 3
Ser Type of Ship Average
Man day
Values for
Type of
Ship
1. Tug 1686.065 1.00
2. Other 2103.22727 1.25
0
500
1000
1500
2000
2500
Tug Other
Man
day
Type of Ship
Chart Title
Average Manday
Values for Type of Ship
Linear (Average Manday)