modeling analysis to support agitation dredging in...
TRANSCRIPT

B-4
1
Attachment B-4
Modeling Analysis to Support Agitation Dredging in Conowingo Reservoir

B-4
2
Modeling Analysis to Support Agitation Dredging in Conowingo
Reservoir
By
Steve Scott
Engineering Research and Development Center
Coastal and Hydraulics Laboratory
May 30, 2013
BACKGROUND
The feasibility of agitation dredging in Conowingo Reservoir is currently being evaluated. The agitation dredging process involves re-suspending reservoir bed sediments into the water column using either high pressure water jets or mechanical agitation methods. The re-suspended sediment is then transported through to the dam by the currents in the reservoir.
This report presents a two dimensional (2D) model study of the flow veloc- ity and bed shear stress generated by a number of inflows into Conowingo Reservoir. Model output data were used to evaluate the potential for sys- tem hydrodynamics to adequately transport re-suspended sediments through the dam.
The potential for sediment to transport in suspension is directly related to sediment particle size, density, and the degree of turbulence in the flow. Sediment can transport as bed load, suspended load, or mixed load. Bed load transport can occur in relatively low energy (low velocity) systems for finer sediments (fine sands), or in higher energy systems with larger sedi- ments such as gravels. Bed load is sediment transported near the bed or in
B-4
3
contact with the bed. Suspended load is transported in suspension with minimal contact with the bed. Mixed load transport implies sediment transport in both bed load and suspended load regimes. As flow through the reservoir increases, turbulence increases, thereby increasing the poten- tial for the transport of suspended load. For fine sediments such as silts and clays, the turbulence requirements are lower than for coarse sedi- ments because the particle sizes and resulting fall velocities are smaller. For larger particles such as sands, higher flows are required to keep the sediment in suspension.
An analysis of historical deposition in Conowingo Reservoir revealed that the reservoir is almost full to capacity for sediment, with the remaining sediment storage capacity located in the lower two miles of the reservoir. Thus the highest potential for increasing sediment storage capacity through agitation dredging is in the lower two miles. The bed sediments in the lower two miles consist of primarily silts, with some clay and sand (81 percent silt, 9 percent clay, and 10 percent sand). These sediments are co- hesive in nature, and will consolidate over time in the bed. As the sedi- ments consolidate, the clay and silt particles are tightly packed and become resistant to erosion. Because of the cohesive properties of silts and clays, disturbance of the sediment bed by agitation dredging most likely will result in re-suspension of fine sediment aggregates instead of primary silt and clay particles. These fine sediment aggregates will have higher fall velocities than the primary silt and clay particles, thus higher flows in the reservoir will be required to transport the re-suspended sediments through the dam.
ANALYSIS METHODOLOGY
The potential for sediments to transport in suspension can be evaluated by the ratio of the shear velocity to the sediment particle fall velocity. The shear velocity defines the turbulence intensity due to the flow, and is de- fined as:
U *
where U* is the shear velocity, is the bed shear stress, and is the water density. The particle fall velocity of primary silt and clay particles ranges
B-4
4
from about 0.00002 – 0.003 meters per second. However, fine sediment aggregates can be much larger in size and have higher settling velocities. For the purpose of this study, it is assumed that the average fine sediment aggregate re-suspended from the bed in the lower two miles of the reser- voir is approximately 0.1 millimeter, which represents fine sand with a fall velocity of 0.00347 meters per second.
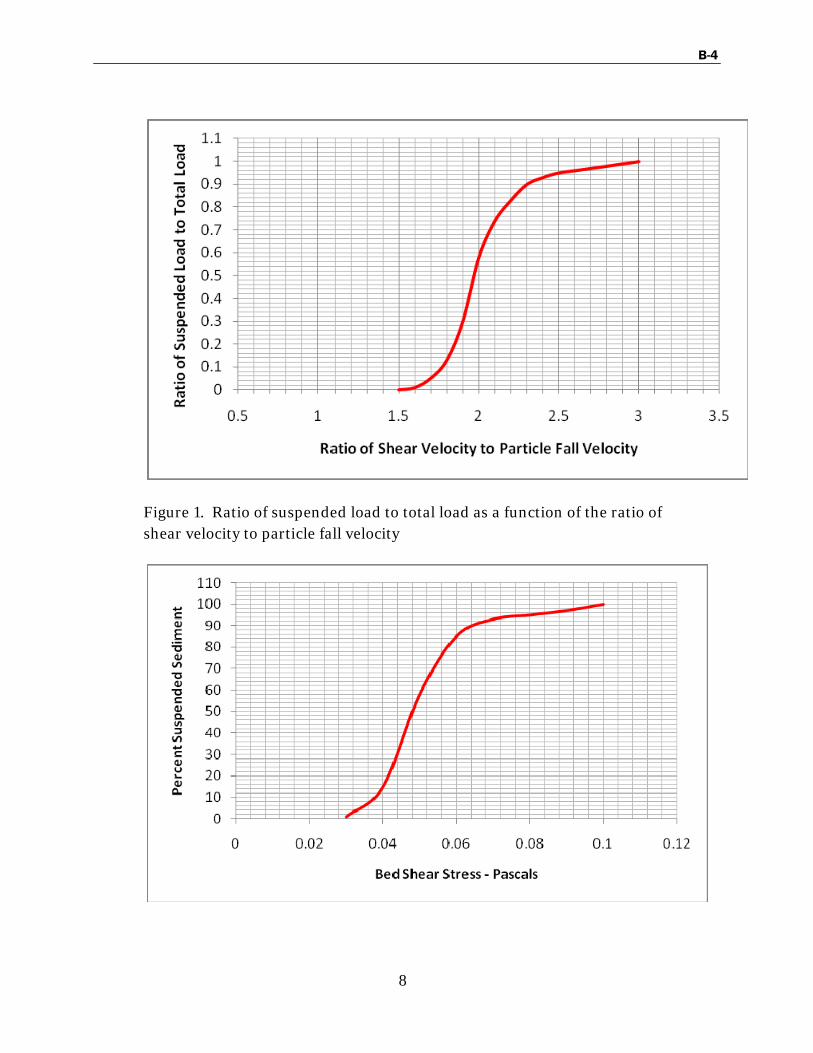
Julien (1995) presents the ratio of suspended load to total load as a func- tion of the ratio of the shear velocity to the particle fall velocity. A repre- sentative data curve is presented in Figure 1. As the shear velocity increases due to higher flows (increased turbulence), the percentage of suspended sediment load increases. Figure 1 indicates that at a shear ve- locity to particle fall velocity ratio of about 3.0, the load is fully suspended. At a ratio of 2.0 about 60 percent is suspended, and at a ratio of 1.8 about 15 percent of the load is suspended. Assuming a constant fall velocity for the agitated sediments, the percent of suspended load as a function of bed shear stress is presented in Figure 2. These data were used to evaluate the effectiveness of agitation dredging as a function of discharge in Conowingo Reservoir. Over the bed shear stress range of 0.07 – 0.10 Pascals, about 92 – 100 percent of the sediments will transport as suspended load.
APPROACH AND RESULTS
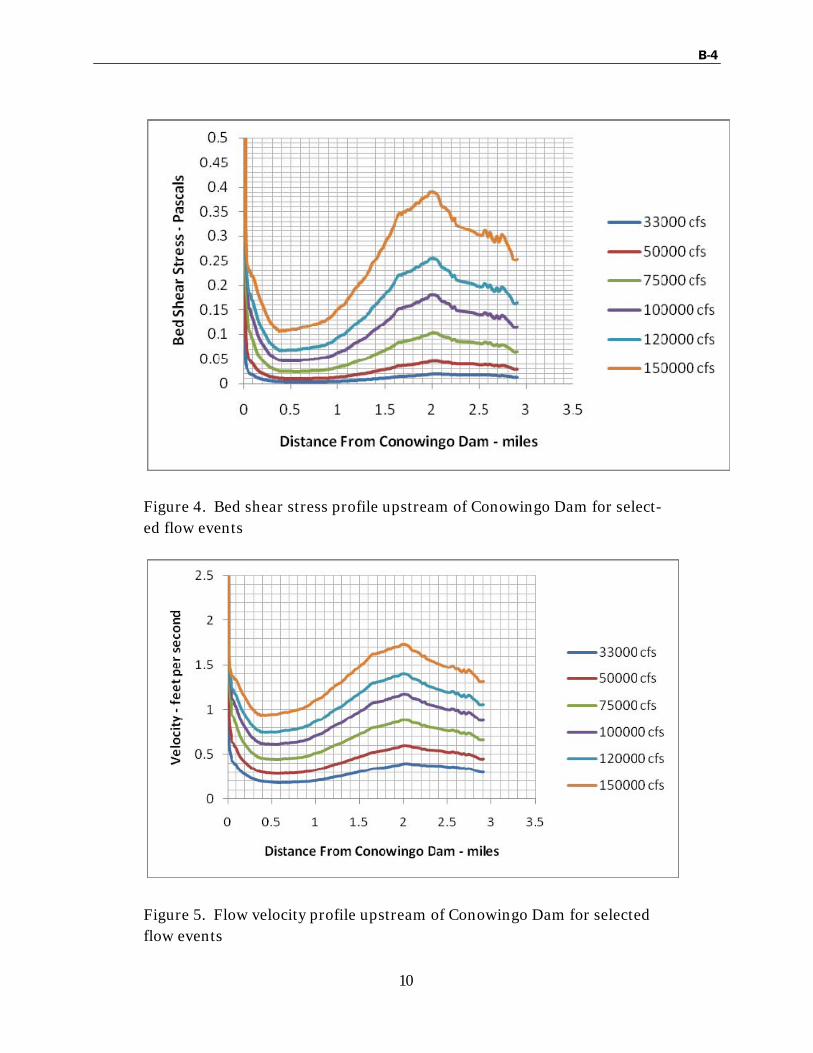
The goal of this study was to determine the required discharge through Conowingo Reservoir to transport the majority of sediment suspended from the agitation dredging process through the dam. The study concen- trated on the lower three miles of the reservoir. Six 2D model simulations were conducted using the AdH model. Discharges of 33,000, 50,000, 75,000, 100,000, 120,000, and 150,000 cubic feet per second (cfs) were simulated in the model. For each simulation, the bed shear stress, flow ve- locity, and depth were analyzed along a longitudinal profile (Figure 3) from the dam to a point three miles upstream. Figure 4 shows the bed shear stress along the longitudinal profile for each of the simulations. The minimum bed shear stress occurs between 0.5 and 2.0 miles from the dam, referred to in this document as the area of concern. This is the deep- est area of the reservoir that contains the remaining sediment storage ca- pacity. The 120,000 cfs discharge event shows a minimum bed shear stress in the area of concern of about 0.07 Pascals, which from Figure 2 indicates about 92 percent of the sediment will remain in suspension. The

B-4
5
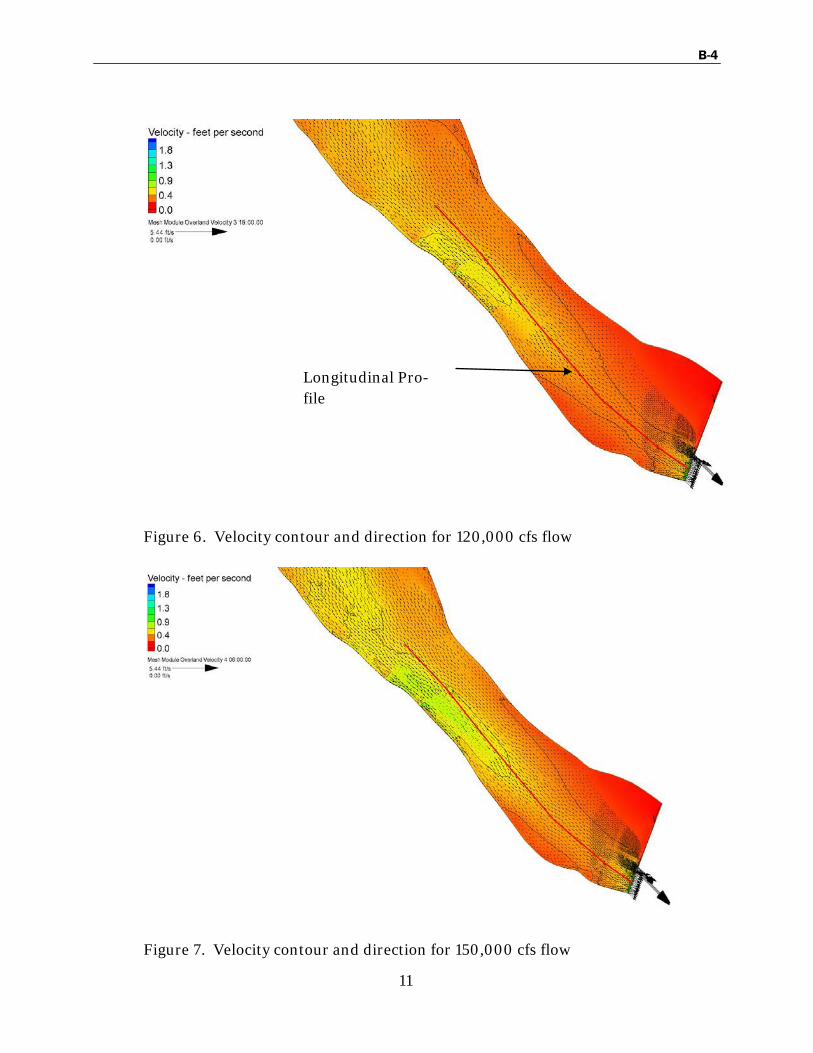
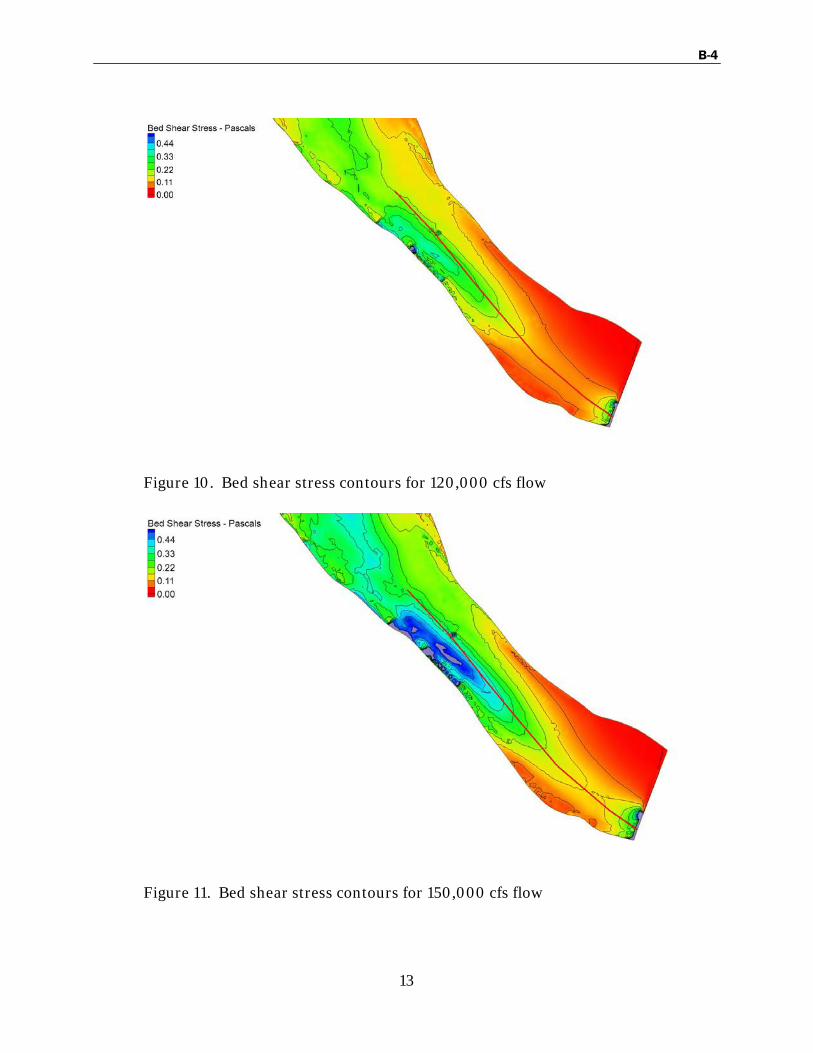
150,000 cfs discharge event has a minimum bed shear stress in the area of concern of over 0.1 Pascals. At 0.1 Pascals, Figure 2 predicts 100 percent of sediment will remain in suspension. The lower flow events show a reduced suspended sediment load, indicating that agitation dredging would be in- efficient at these flows. Table 1 presents the percent of suspended sedi- ment as a function of flow for each event. Figure 5 shows the corresponding velocity. The velocity range that an agitation dredge would encounter at the 150,000 cfs flow would be about 1 – 1.75 feet per second through the proposed dredging area. Figures 6 – 11 present the spatial dis- tribution of velocity, depth, and bed shear stress for the 120,000 and 150,000 cfs simulations.
Table 1. Percent of suspended sediment as a function of discharge
Flow Event – cubic feet per second Percent Suspended Sediment
33,000 0.0
50,000 0.0
75,000 1.0
100,000 58.0
120,000 92.0
150,000 100.0
CONCLUSIONS
Analysis of Conowingo Reservoir hydrodynamics for varying discharge scenarios indicates that a flow of 150,000 cfs will result in all of the 0.1 millimeter or smaller agitated sediment transporting in suspension through the dam. Sediment particles larger than the assumed size (0.1 mil-
B-4
6
limeter) will likely deposit within the reservoir. In addition, re-suspended sediments, including those smaller than 0.1 millimeter that transport to lower energy areas of the lower reservoir, will likely deposit before reach- ing the dam.
REFERENCES
Julien, P.Y., 1995, “Erosion and Sedimentation”, Cambridge University Press, page 187.

B-4
7
LIST OF FIGURES
B-4
8
Figure 1. Ratio of suspended load to total load as a function of the ratio of shear velocity to particle fall velocity

B-4
9
Figure 2. The percent of sediment in suspension as a function of bed shear stress
Profile
Figure 3. Agitation dredging study area including longitudinal profile used for data analysis
B-4
10
Figure 4. Bed shear stress profile upstream of Conowingo Dam for select- ed flow events
Figure 5. Flow velocity profile upstream of Conowingo Dam for selected flow events
B-4
11
Longitudinal Pro- file
Figure 6. Velocity contour and direction for 120,000 cfs flow
Figure 7. Velocity contour and direction for 150,000 cfs flow

B-4
12
Figure 8. Depth contours for 120,000 cfs flow
Figure 9. Depth contours for 150,000 cfs flow
B-4
13
Figure 10. Bed shear stress contours for 120,000 cfs flow
Figure 11. Bed shear stress contours for 150,000 cfs flow