model simulation of the patient flow through a screening centre for diabetic retinopathy
TRANSCRIPT

Model simulation of the patientflow through a screening centrefor diabetic retinopathy
Anja B. Hansen,1 Rene Normann Hansen,2 Morten Colding-
Jørgensen,2 Knut Borch-Johnsen3,4 and Henrik Lund-Andersen1
1Department of Ophthalmology, Herlev Hospital, University of Copenhagen,
Herlev, Denmark2Novo Nordisk A/S, Bagsværd, Denmark3Steno Diabetes Centre, Gentofte, Denmark4Faculty of Health Science, University of Aarhus, Aarhus, Denmark
ABSTRACT.
Purpose: To construct a quantitative, flexible and simplified mathematical model
of the patient flow through the Eye Clinic at the Steno Diabetes Centre (SDC) in
order to enable rational dimensioning and assess the effects of modifications.
Methods: Patient data were drawn from the Eye Care database at the SDC. A
simple patient flow model was constructed, allowing simultaneous adjustments of
all variables, and the model was tested. Two scenarios were simulated: (1)
adjusting the algorithm that assigns the follow-up intervals, and (2) increasing
the population size to include all patients with diabetes in Copenhagen County.
Results: The model can describe the patient flow under steady state conditions,
but is less precise in predicting transient changes with the present set-up.
Accordingly all simulations were run for a substantial number of iterations.
The two scenarios illustrate the usefulness of the model by calculating the
required photographic examination capacity for the specific population, thereby
allowing better estimations of future dimensioning of the organization.
Conclusion: The study presents a patient flow model that can be used to
illustrate the effects of proposed changes prior to their implementation, specifi-
cally with respect to the capacity of the system.
Key words: model simulation – patient flow – diabetic retinopathy screening – capacity
Acta Ophthalmol. Scand. 2005: 83: 678–686Copyright # Acta Ophthalmol Scand 2005.
doi: 10.1111/j.1600-0420.2005.00555.x
Introduction
Regular screening for diabetic retinopa-thy (DR) to prevent loss of vision is animportant part of any health care pro-gramme designed to provide health careto patients with diabetes mellitus(Stefansson et al. 2000; Arun et al. 2003).
The Steno Diabetes Centre (SDC)offers all patients enrolled at the centrecontinuous comprehensive diabetescounselling, medical evaluation anddiabetes education in an outpatient set-ting (Jensen et al. 2002). This includesregular screening for DR, which is per-formed in close co-operation with the
Department of Ophthalmology atHerlev Hospital.
The movement of patients through ascreening system is, however, complex,and can be affected by many mutuallyinterdependent variables, such aspatient volume, patient mix andresources (economical and staff).These simultaneously changing vari-ables in the patient flow environmentmake it very difficult to predict theimplications of proposed changes. Thesolution to this is model simulation.Once a model has been constructed itis possible to adjust various parameterssimultaneously and observe the effect ofthese changes on the rest of the system.
Building a model to illustrate theflow of patients through a particularsystem requires information aboutmany different parameters and may bedescribed in four phases. First, a dia-gram that describes the flow of patientsthrough the system must be constructed.Second, information about patientvolume, patient mix, time-constantsand staff size must be collected. Third,the model must be mathematicallyformulated. Fourth, the model mustbe tested using examples and validatedby comparing the information pro-duced by the model to actual data.
The purpose of this study was toconstruct a quantitative, flexible, sim-plified mathematical model of thepatient flow through the Eye Clinicat the SDC, in order to enable
ACTA OPHTHALMOLOGICA SCANDINAVICA 2005
678

calculations of dimensioning and assessthe consequences of adjusting the pre-valence of DR, the population size andthe screening frequencies.
Methods
The Eye Clinic at the Steno Diabetes
Centre
The SDC manages the health care ofall patients with type 1 diabetes abovethe age of 15 years in the County ofCopenhagen, and also that of thosewith type 2 diabetes, who have moresevere complications. Furthermore,the SDC also manages the care ofpatients who have been referred to thecentre by hospital departments locatedin other Danish counties. The totalnumber of patients enrolled at the cen-tre is approximately 5400. Amongthese 5400 patients approximately 900,referred to the SDC from H : S (theCopenhagen Hospital Co-operation),are seen and treated at a separate StenoClinic at Rigshospitalet, Copenhagen.
Regular screening for DR is an inte-gral part of the health care programmeoffered to all patients at the SDC. Thefollow-up interval for each individualpatient varies from 3 months to2 years, and is determined by an assess-ment of the retinopathy severity inte-grated with medical findings, andmedical treatment within the SDC pro-gramme. The goal is to preserve visionby appropriate follow-up, medical careand/or timely laser treatment or vitrect-omy surgery. The screening is carriedout in close co-operation with theDepartment of Ophthalmology atHerlev Hospital, which provides themedical staff for the SDC Eye Clinicand manages the treatment of patientsin need of laser and/or vitrectomysurgery. The total number of patientsscreened at the SDC Eye Clinic isapproximately 3750 out of the 5400(900 patients are screened atRigshospitalet as mentioned above anda further 750 patients prefer to bescreened by a private ophthalmologist).
Since November 2002, screening forDR at the SDC has been performedusing a digital non-mydriatic funduscamera, a TRC-NW6S (TOPCON,Tokyo, Japan), interfaced with a3CCD colour camera (KY-F70B;JVC, Tokyo, Japan) with a pixel reso-lution of 1450 � 1026 combined with
an IMAGEnet 2000 computer system.The camera and photographic protocolhave been demonstrated in a previousstudy to be comparable to ETDRSseven standard field stereoscopicphotography in a screening setting(Hansen et al. 2004).
Tropicamide 1% is instilled, patientsare refracted and visual acuity (VA) ismeasured. When the pupil is adequatelydilated the patient is photographed, cap-turing five overlapping, non-stereoscopic,45-degree photographs of each eye(posterior pole, nasal, temporal, superiorand inferior). The five images from eacheye are arranged as a single mosaic imageusing the IMAGEnet mosaic softwareand stored (Fig. 1). To increase patientunderstanding of the disease, the imagesare viewed with the patient immediatelyafter the photographic session and thepatient is given a preliminary assessmentof the severity of retinopathy.
The images are later assessed byreaders using the Steno grading form(Fig. 2). The readers have all success-fully completed a thorough trainingprogramme, but to further ensure uni-form and high quality grading, a for-mal quality control is performed everysecond month by reviewing approxi-mately 5% of the gradings.
Typically, a single reader evaluatesan image set, but consultations and dis-cussions among the readers are per-mitted. The grading results are
recorded in the Eye Care database,and the software immediately calcu-lates the clinical level of DR alongwith an algorithm-generated suggestedfollow-up for the patient (Table 1). Thegrader then decides whether or not thissuggested follow-up is acceptable; if itis not then the interval can be changedmanually. This decision is based on thepatient’s HbA1c, renal status, bloodpressure status, progression rate of DRand whether or not there are otherassociated risk factors for progressionof retinopathy present. Patients assessedas having DR that requires treatment
Fig. 1. A mosaic image of five fundus photographs of the left eye of a patient with mild non-
proliferative diabetic retinopathy captured with the non-mydriatic digital fundus camera.
Table 1. The algorithm for the computer pro-
gram to calculate patient follow-up at the
SDC. (for abbreviations, see Fig. 2).
Steno grading Follow-up
0
1 ¼ A, B, C 2 years
2 ¼ A, B
2 ¼ C 1 year
2SE/2HE ¼ A
L ¼ X 6 months
2SE/2HE > A
2I
2VA 3 months
2MA
3P/3PA
4
ACTA OPHTHALMOLOGICA SCANDINAVICA 2005
679

are referred to the Department ofOphthalmology at Herlev Hospital.
In cases where there is doubt abouthow a specific lesion should be graded,the reader may mark the image forgrading by the ophthalmologist resi-dent at the SDC Eye Clinic, or referthe patient to the ophthalmologist fora comprehensive eye examination.
Patient flow through the Eye Clinic at the
SDC
A schematic depiction of the patientflow through the system was
constructed (Fig. 3). To keep the rulesas simple as possible, it was decided toleave out the possibility of having aquestionable grading and referring thepatient to the ophthalmologist for acomprehensive eye examination.
Accordingly, patients are screened atfour different intervals depending onthe severity of their DR: at 3, 6, 12 or24 months. The result of the photo-graphic screening can be one of thefollowing: the patient is evaluated ashaving treatment requiring DR and isreferred to the Department ofOphthalmology, or as having no or
non-treatment requiring DR and re-enters the SDC patient populationwith a new assigned interval to thenext photographic screening based onthe severity of DR. The influx ofpatients into the population is due tonew referrals, and the outflux is mainlydue to patients relocating or dying.
Data collection
Data describing the patient populationwere drawn from the Eye Care data-base at the SDC for the period 1January 1995 to 31 December 2004,
0 1 2 2SE 2HE 2I 2VA 2M 3P 3PA 4 L 6 7 FH
Periphery
Macula
6 7
Quantitative fundus lesions:0: no pathology 2I: intraretinal microvascular abnormalities 4: proliferation and connective tissue1: red lesions (vessel diameter size) 2VA: vessel changes L: laser treatment
Quantification of fundus lesions:Non: 0 A: 1–5 B: 6–10 C: >10 FH: 1– 4
2HE: hard exudates FH: fundus hypertonicus3PA:proliferations at the papil
2: large red lesions (haemorrhages) 2M: maculopathy (A: CSME, B: non sign. oedema) 6: other2SE: soft exudates 3P: proliferations in periphery 7: vessels
Fig. 2. The grading form used at the Steno Diabetes Centre, which is based on a quantification of fundus lesions, where none ¼ 0 lesions, A ¼ 1–5
lesions, B ¼ 6–10 lesions, C ¼ more than 10 lesions. If no pathology is present in the mosaic image the grader will simply cross off 0 for both
periphery and macula. If in the entire periphery of the mosaic image there are nine small red lesions, two hard exudates and one intraretinal
microvascular abnormality; and in the macula three small red lesions and one hard exudate; then the reader will write B in periphery 1, A in periphery
2HE, A in periphery 2I, A in macula 1 and A in macula 2HE.
PATIENT POPULATION
Consisting of patients screened at
Photographic screening at SDC
3-monthintervals
Treatment requiring DR
Influxi.e. new referrals
No DR or non-treatment requiring DR
Out fluxi.e. relocation or death
Department of Ophthalmology,Herlev Hospital
6-monthintervals
24-monthintervals
12-monthintervals
Fig. 3. A simplified depiction of the patient flow at the Steno Diabetes Centre.
ACTA OPHTHALMOLOGICA SCANDINAVICA 2005
680
using specially designed computer pro-grams, which were all initially testedusing a test database to ensure accu-racy of the obtained data. The follow-ing information was obtained: the totalnumber of patients at the SDC, totalnumber of patients screened at the EyeClinic at the SDC, patient distributionaccording to screening intervals, andthe progression and regression rates ofDR within the different screeningintervals.
Model equations
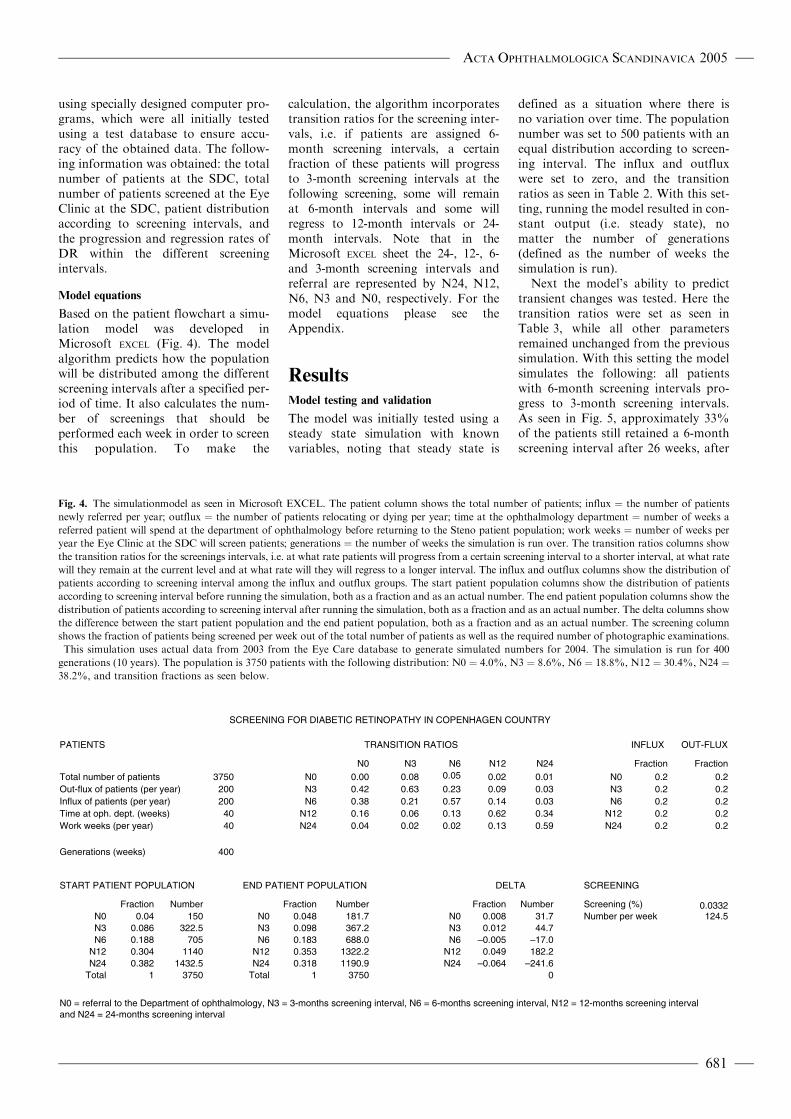
Based on the patient flowchart a simu-lation model was developed inMicrosoft EXCEL (Fig. 4). The modelalgorithm predicts how the populationwill be distributed among the differentscreening intervals after a specified per-iod of time. It also calculates the num-ber of screenings that should beperformed each week in order to screenthis population. To make the
calculation, the algorithm incorporatestransition ratios for the screening inter-vals, i.e. if patients are assigned 6-month screening intervals, a certainfraction of these patients will progressto 3-month screening intervals at thefollowing screening, some will remainat 6-month intervals and some willregress to 12-month intervals or 24-month intervals. Note that in theMicrosoft EXCEL sheet the 24-, 12-, 6-and 3-month screening intervals andreferral are represented by N24, N12,N6, N3 and N0, respectively. For themodel equations please see theAppendix.
Results
Model testing and validation
The model was initially tested using asteady state simulation with knownvariables, noting that steady state is
defined as a situation where there isno variation over time. The populationnumber was set to 500 patients with anequal distribution according to screen-ing interval. The influx and outfluxwere set to zero, and the transitionratios as seen in Table 2. With this set-ting, running the model resulted in con-stant output (i.e. steady state), nomatter the number of generations(defined as the number of weeks thesimulation is run).
Next the model’s ability to predicttransient changes was tested. Here thetransition ratios were set as seen inTable 3, while all other parametersremained unchanged from the previoussimulation. With this setting the modelsimulates the following: all patientswith 6-month screening intervals pro-gress to 3-month screening intervals.As seen in Fig. 5, approximately 33%of the patients still retained a 6-monthscreening interval after 26 weeks, after
PATIENTS TRANSITION RATIOS INFLUX OUT-FLUX
N0 N3 N6 N12 N24 Fraction FractionTotal number of patients 3750 N0 0.00 0.08 0.02 0.01 N0 0.2 0.2Out-flux of patients (per year) 200 N3 0.42 0.63 0.23 0.09 0.03 N3 0.2 0.2Influx of patients (per year) 200 N6 0.38 0.21 0.57 0.14 0.03 N6 0.2 0.2Time at oph. dept. (weeks) 40 N12 0.16 0.06 0.13 0.62 0.34 N12 0.2 0.2Work weeks (per year) 40 N24 0.04 0.02 0.02 0.13 0.59 N24 0.2 0.2
Generations (weeks) 400
START PATIENT POPULATION END PATIENT POPULATION DELTA SCREENING
Fraction Number Fraction Number Fraction Number Screening (%) 0.0332N0 0.04 N0 0.048 181.7 N0 0.008 31.7 124.5N3 0.086 322.5 N3 0.098 367.2 N3 0.012 44.7N6 0.188 N6 0.183 688.0 N6 –0.005 –17.0
N12 0.304 N12 0.353 1322.2 N12 0.049 182.2N24 0.382 N24 0.318 1190.9 N24 –0.064 –241.6
Total 1 3750 Total 1 3750 0
N0 = referral to the Department of ophthalmology, N3 = 3-months screening interval, N6 = 6-months screening interval, N12 = 12-months screening interval and N24 = 24-months screening interval
0.05
150
7051140
1432.5
Number per week
SCREENING FOR DIABETIC RETINOPATHY IN COPENHAGEN COUNTRY
Fig. 4. The simulationmodel as seen in Microsoft EXCEL. The patient column shows the total number of patients; influx ¼ the number of patients
newly referred per year; outflux ¼ the number of patients relocating or dying per year; time at the ophthalmology department ¼ number of weeks a
referred patient will spend at the department of ophthalmology before returning to the Steno patient population; work weeks ¼ number of weeks per
year the Eye Clinic at the SDC will screen patients; generations ¼ the number of weeks the simulation is run over. The transition ratios columns show
the transition ratios for the screenings intervals, i.e. at what rate patients will progress from a certain screening interval to a shorter interval, at what rate
will they remain at the current level and at what rate will they will regress to a longer interval. The influx and outflux columns show the distribution of
patients according to screening interval among the influx and outflux groups. The start patient population columns show the distribution of patients
according to screening interval before running the simulation, both as a fraction and as an actual number. The end patient population columns show the
distribution of patients according to screening interval after running the simulation, both as a fraction and as an actual number. The delta columns show
the difference between the start patient population and the end patient population, both as a fraction and as an actual number. The screening column
shows the fraction of patients being screened per week out of the total number of patients as well as the required number of photographic examinations.
This simulation uses actual data from 2003 from the Eye Care database to generate simulated numbers for 2004. The simulation is run for 400
generations (10 years). The population is 3750 patients with the following distribution: N0 ¼ 4.0%, N3 ¼ 8.6%, N6 ¼ 18.8%, N12 ¼ 30.4%, N24 ¼38.2%, and transition fractions as seen below.
ACTA OPHTHALMOLOGICA SCANDINAVICA 2005
681

52 weeks approximately 11%, andafter 2 and 3 years approximately1.2% and 0.1%, respectively.
Finally the model was tested usingdata drawn from the SDC Eye Caredatabase, assessing the model’s abilityto predict the distribution of the popula-tion in 2004 using data from 2003. TheSDC population number in 2003 was3750 patients with distribution and tran-sition ratios as seen in Fig. 4. The influxand outflux were set to 200 patients peryear, equally distributed according toscreening interval. The simulation wasrun to steady state and the result can beseen in Fig. 4. In Fig. 6 the results of thesimulation are compared to the actualdistribution of the population in 2004;
based on this, it was concluded that themodel was running satisfactorily.
Simulation 1
15% of all patients assigned a 3-month
screening interval are given a 6-month
interval instead
An unpublished study from the EyeClinic at the SDC has shown that thelikelihood of a patient with intraretinalmicrovascular abnormalities (2I in thegrading form, Fig. 2) and no or veryfew other retinal lesions progressingto treatment requiring DR within6 months is very small (paper in pre-paration). Accordingly, we have con-templated changing the algorithm so
that 2I would no longer result in a 3-month interval but in a 6-month inter-val. Currently, approximately 15% ofpatients are assigned a 3-month screen-ing interval solely due to 2I.
In this simulation the actual 2003data on patient number and patient dis-tribution are used, and the simulation isbased on the following assumptions:
(1) 15% of all patients assigned a3-month screening interval are given a6-month screening interval, adjustingthe transition ratios as seen inTable 4, and(2) the influx as well as outflux is200 patients per year with an equaldistribution according to screeninginterval.
The simulation was run to steadystate and the resultant patient distribu-tion is as seen in Table 5. It wouldrequire 121 photographic examinationsper week to screen this population.
Simulation 2
All patients in Copenhagen County are to
be screened at the SDC
Currently the organization of theDanish Health Services is underrevision. This may result in amove towards greater centralization.Accordingly, it was found pertinent toinvestigate capacity requirements if allpatients in Copenhagen County wereto be screened at the SDC.
This simulation is based on the fol-lowing assumptions:
(1) the total number of patients inCopenhagen County with diagnoseddiabetes mellitus is 15 000;(2) the distribution of the populationresembles that of the diabetes popula-tion in Denmark, where 65% have noDR, 20% have mild non-proliferativeDR, 10% moderate non-proliferativeDR, 3% severe non-proliferative DRand 2% proliferative DR;(3) the progress of DR is lower forpatients with no or mild DR in thispopulation compared to the Stenopopulation, thus the transition ratiosfor N24 and N12 are adjusted as seenin Table 6;(4) the influx as well as outflux is 1000patients per year;(5) patients in the influx group will dis-tributed as follows: N0 ¼ 0.05,N3 ¼ 0.05, N6 ¼ 0.1, N12 ¼ 0.01 andN24 ¼ 0.7, and
Table 3. The transition ratios for the screening intervals, (i.e. at what rate patients will progress
from a certain screening interval to a shorter interval, at what rate they will remain at the current
level and at what rate they will regress to a longer interval), in this instance simulating that all
patients with 6-month screening intervals will progress to 3-month intervals.
Preceding screening interval
N0 N3 N6 N12 N24
Subsequent N0 1.00 0 0 0 0
screening N3 0 1.00 1.00 0 0
interval N6 0 0 0 0 0
N12 0 0 0 1.00 0
N24 0 0 0 0 1.00
Table 4. The transition ratios for the screening intervals, (i.e. at what rate patients will progress
from a certain screening interval to a shorter interval, at what rate they will remain at the current
level and at what rate they will regress to a longer interval), in this instance simulating that 15% of
patients with 3-month intervals will progress to 6-month intervals.
Preceding screening interval
N0 N3 N6 N12 N24
Subsequent N0 0.00 0.08 0.05 0.02 0.01
screening N3 0.36 0.54 0.20 0.08 0.03
interval N6 0.44 0.30 0.60 0.14 0.03
N12 0.16 0.06 0.13 0.62 0.34
N24 0.04 0.02 0.02 0.13 0.59
Table 2. The transition ratios for the screening intervals, (i.e. at what rate patients will progress
from a certain screening interval to a shorter interval, at what rate they will remain at the current
level and at what rate they will regress to a longer interval), in this instance simulating that all
patients will remain at the same screening interval.
Preceding screening interval
N0 N3 N6 N12 N24
Subsequent N0 1.00 0 0 0 0
screening N3 0 1.00 0 0 0
interval N6 0 0 1.00 0 0
N12 0 0 0 1.00 0
N24 0 0 0 0 1.00
ACTA OPHTHALMOLOGICA SCANDINAVICA 2005
682

(6) patients in the outflux group will bedistributed equally according to screen-ing interval.
The simulation was run to steadystate and the results are presented inTable 5. The prevalence of DR withinthe population remains almost thesame over time, requiring approxi-mately 327 photographic examinations
per week in order to screen thepopulation.
Discussion
This paper presents a simple mathema-tical model of the patient flow througha DR screening centre and illustrates
how model simulation can be used toassess the consequences of adjustingthe prevalence of DR, population sizeand screening frequencies.
The following discussion focuses onthe design of the model, the validity ofthe input data, the specific simulationspresented in this paper, model limita-tions and future perspectives.
The model was constructed using arelatively simple design based on anEXCEL worksheet, and incorporatestransition ratios for the screening inter-vals to calculate:
(1) how the population will be distribu-ted among the different screenings inter-vals after a specified period of time, and(2) the number of screenings thatshould be performed each week inorder to screen this population.
It would have been fairly easy toconstruct a model without the transi-tion ratios, based on the assumptionthat the number of patients in eachscreening interval group remains thesame over time. However, such amodel could not have been used topredict the future distribution of thepopulation, but merely to calculatethe current required photographiccapacity. Consequently, the transitionratios are an important feature of themodel, as they make it possible to takeinto account the rate of progressionand regression within the differentscreening interval groups. We foundthat even small alterations in the tran-sition ratios would result in substantialchanges in the simulation results,emphasizing the importance of havingvalid input data.
In this study great care was taken toensure that the input data were correct,as the validity of the results from anysimulation model, besides the formula-tion of the model itself will dependgreatly upon the quality of the inputdata. Initially, great difficulties wereencountered in obtaining accuratedata, despite the availability of a data-base. This was because the Eye Caredatabase at the SDC is a clinical data-base which was not originally designedfor research purposes. Consequently,to ensure the validity of the obtaineddata, a test database was constructedand used to test the computer pro-grams specially designed to drawpatient data from the Eye Care data-base. When the computer programswere found to operate satisfactorily,
0
20
40
60
80
100
120
140
160
180
200
1 52 103 154 205 256 307 358
Weeks
N0, N12 & N24N3N6
Fig. 5. A depiction of the model’s ability to predict transient changes. The simulation is run for
400 generations. The population number is set to 500 patients equally distributed according to
screening intervals. The influx and outflux are set to zero and the transition ratios are as seen in
Table 4. The curves for N3 and N6 are asymptotically approaching the 200 line and the 0 line,
respectively.
0
10
20
30
40
50
60
70
80
90
100
N0 N3 N6 N12 N24
Screening intervals
Simulated distributionin 2004
Actual distributionin 2004
Fig. 6. The model’s ability to predict the population distribution in 2004 based on data drawn
from the Eye Care database for the year 2003. The simulated distribution is compared to the
actual population distribution in 2004.
ACTA OPHTHALMOLOGICA SCANDINAVICA 2005
683

they were used to draw the actualpatient data from the Eye Care data-base. However, with regards to theinflux and outflux of patients, it stillproved difficult to obtain accuratenumbers. Thus, when actual data from2003 were used to generate simulatednumbers for 2004, the model simulationwas based on the assumptions that theinflux and outflux of patients were iden-tical, as well as equally distributedaccording to screening intervals(Fig. 4). Whether or not it is fair tomake such assumptions is, of course,debatable. With respect to the influxand outflux being identical, the assump-tion is supported by the fact that thetotal number of patients enrolled at theSDC has remained fairly stable over theyears. With respect to the patients beingequally distributed according to screen-ing intervals, this assumption is unsup-ported and most likely inaccurate.However, this distribution was nonethe-less chosen because small alterations inpatient distribution in the influx andoutflux groups were shown to result insignificant changes in the simulation
results, and it was found that currentlythe most valid simulation results wouldbe obtained with an equal patientdistribution.
In this study two simulations wereperformed. The first example illustrateshow simulation can be used to demon-strate the result of changing a singlevariable in the SDC patient follow-upalgorithm. The question was: what if15% of all patients assigned a 3-month screening interval were to begiven a 6-month screening intervalinstead? Intuitively, we know the cor-rect answer: the number of patientsscreened at 6-month intervals willincrease, and the number of patientsscreened at 3-month intervals willdecrease, as will the number of photo-graphic examinations per week. Whatwe do not know, however, is howmuch. This is where the simulationmodel can help us. If we compare thesimulation results with the actual num-bers from 2004 (Table 5), we see that itwould result in a reduction of fivephotographic examinations per week.This, of course, only looks at the
question from a capacity point of viewand does not take into account thepossible benefits to patients.
The second example illustrates howsimulation can be used before a greaterreorganization is implemented to pre-dict the necessary dimensions of thefuture screening system. The questionwas: what if all patients in CopenhagenCounty were to be screened at the SDC?Simulation shows that it would requireapproximately 327 photographic exam-inations per week (Table 5). However,this simulation uses numbers based onestimations, and, as stated previously, itis prudent to be aware of the fact that thevalidity of the simulation results willdepend upon the validity of the estima-tions. We used three sets of estimateddata:
(1) the prevalence of DR within thepopulation, which was based on datafromDenmark and Sweden (Henricssonet al. 2003; Jacobsen et al. 2003; Hoveet al. 2004);(2) the transition ratios, which werebased on data from the Eye Care data-base at the SDC and progression ratedata from the Liverpool Diabetic EyeStudy (Younis et al. 2003a, 2003b), and(3) influx and outflux, which werebased on estimations made by theophthalmologist at the SDC.
With respect to estimating the preva-lence of DR, it should be noted that theprevalence of macula oedema wasomitted, as it was not possible to ascer-tain consistent data for the prevalenceof macula oedema and the distributionof macula oedema within the differentlevels of DR. However, running thesimulation model with varying maculaoedema prevalences and distributionsdid not alter the number of requiredphotographic examinations by morethan 1–2 per week. Thus, as we areconfident that our estimations arevalid, the information obtained in thissimulation could be used in the plan-ning phase, specifically with regard todimensioning the capacity of the futurescreening system.
The model was shown to be less pre-cise in predicting transient changeswith the present set-up as the modelworks in fractions, approaching thecorrect number asymptotically. This isillustrated in Fig. 5, where the modelsimulates a situation where all patientswith 6-month screening intervals pro-gress to 3-month intervals. After
Table 5. The 2004 distribution of the population according to screening intervals and the number
of photographic examinations needed to screen the population, compared with the results of
simulations 1 and 2.
Population distribution after simulationActual population
distribution in 2004Simulation 1 Simulation 2
Screening intervals N0 4.4% 4.5% 1.3%
N3 11.5% 7.4% 3.3%
N6 17.4% 21.2% 8.9%
N12 35.3% 35.4% 22.7%
N24 31.4% 31.5% 63.8%
Photographic examinations
per week needed to screen 126 121 327
the population
Simulation 1: 15% of all patients assigned a 3-month screening interval are given a 6-month sc-
reening interval.
Simulation 2: all patients in Copenhagen County are to be screened at the SDC.
Table 6. The transition ratios for the screening intervals, (i.e. at what rate patients will progress
from a certain screening interval to a shorter interval, at what rate they will remain at the current
level and at what rate they will regress to a longer interval), in this instance simulating that all
patients in Copenhagen County will be screened at the SDC.
Preceding screening interval
N0 N3 N6 N12 N24
Subsequent N0 0.00 0.08 0.05 0.02 0.01
screening N3 0.42 0.63 0.23 0.03 00.2
interval N6 0.38 0.21 0.57 0.20 0.02
N12 0.16 0.06 0.13 0.75 0.10
N24 0.04 0.02 0.02 0.00 0.85
ACTA OPHTHALMOLOGICA SCANDINAVICA 2005
684

6 months the result should be that 200patients are screened at 3-month inter-vals and no patients are screened at 6-month intervals. This is not the case,and this is the model’s limitation, as itmakes it difficult to observe changesover time. If, for instance, we wereinterested in seeing what would happenif all patients screened at 24-monthintervals were to be given 12-monthintervals at their next photographicexamination, and, more specifically,wanted to find out when the resultantincrease in photographic examinationswould require the employment ofanother nurse due to insufficientphotographic capacity, it would onlybe possible within a margin of errorof up to 33%. When constructingthe model we were, however, awarethat it would have this limitation.Nevertheless, we initially opted for arelatively simple design that was stablein steady state conditions with theintention of further developing themodel once its usefulness had beendemonstrated. All simulations in thisstudy were therefore run for a substan-tial number of iterations.
Many readers may find that theuse of a 2-year follow-up should bejustified. However, it should be notedthat the purpose of this paper was notto evaluate and provide justificationfor the screening system at SDC, butto present a simulation model of ascreening centre and show how it canbe used to assess the implicationsof proposed changes prior to theirimplementation. A paper evaluatingthe screening system at the SDC is inpreparation, where, among otherthings, the 2-year follow-up will bediscussed.
Model simulations are not yet com-monly used to evaluate health care sys-tems, and within the field of medicinethey have thus far mainly been used tomodel emergency departments andmedical wards to help with capacityplanning (el-Darzi et al. 1998; Coats& Michalis 2001; Groothuis et al.2001; Seymour 2001; Su & Shih 2003;Kreke et al. 2004). Accordingly, we arenot aware of any article of this kindthat deals with the field of ophthalmol-ogy or screening services.
Further development of the presentmodel is needed, specifically enhancingit so that it will be possible to se changesaccurately over time. Moreover, moreaccurate data on the influx and outfluxof patients must be collected. Finally,the model should be made so that itis applicable in most other screeningcentres, allowing other screeningunits to tune the model to representtheir particular patient mix andorganization.
In conclusion, this study has shownthat a simple model of patient flowthrough a DR screening centre can beconstructed and used to assess the impli-cation of proposed changes prior to theirimplementation, specifically with respectto the capacity of the system.
Acknowledgements
The study was funded by the VeluxFoundation, the Danish DiabetesAssociation, the Danish Eye HealthSociety (Værn om Synet), the EyeFoundation (Øjenfonden), the T.Elmquist Foundation and SynoptikA/S.
ReferencesArun CS, Ngugi N, Lovelock L & Taylor R
(2003): Effectiveness of screening in prevent-
ing blindness due to diabetic retinopathy.
Diabet Med 20: 186–190.
Coats TJ & Michalis S (2001): Mathematical
modelling of patient flow through an acci-
dent and emergency department. Emerg
Med J 18: 190–192.
el-Darzi E, Vasilakis C, Chaussalet T &
Millard PH (1998): A simulation modelling
approach to evaluating length of stay, occu-
pancy, emptiness and bed blocking in a hos-
pital geriatric department. Health Care
Manag Sci 1: 143–149.
Groothuis S, van Merode GG & Hasman A
(2001): Simulation as decision tool for capa-
city planning. Comput Meth Programs
Biomed 66: 139–151.
Hansen AB, Hartvig NV, Jensen MS, Borch-
Johnsen K, Lund-Andersen H & Larsen M
(2004): Diabetic retinopathy screening
using digital non-mydriatic fundus photo-
graphy and automated image analysis.
Acta Ophthalmol Scand 82: 666–672.
Henricsson M, Nystrom L, Blohme G et al.
(2003): The incidence of retinopathy
10 years after diagnosis in young adult
people with diabetes: results from the nation-
wide population-based Diabetes Incidence
Study in Sweden (DISS). Diabetes Care 26:
349–354.
HoveMN, Kristensen JK, Lauritzen T & Bek T
(2004): The prevalence of retinopathy in an
unselected population of type 2 diabetes
patients from Arhus County, Denmark.
Acta Ophthalmol Scand 82: 443–448.
Jacobsen N, Kjer BE, Goldschmidt E,
Andersen OO & Thorsteinsson B (2003):
[Diabetic retinopathy in type 1 diabetics in
the county of Frederiksborg]. Ugeskr Laeger
165: 2953–2956.
Jensen T, Musaeus L, Molsing B, Lyholm B &
Mandrup-Poulsen T (2002): Process mea-
sures and outcome research as tools for
future improvement of diabetes treatment
quality. Diabetes Res Clin Pract 56:
207–211.
Kreke JE, Schaefer AJ & Roberts MS (2004):
Simulation and critical care modelling. Curr
Opin Crit Care 10: 395–398.
Seymour DG (2001): Health care modelling
and clinical practice. Theoretical exercise
or practical tool? Health Care Manag Sci
4: 7–12.
Stefansson E, Bek T, Porta M, Larsen N,
Kristinsson JK & Agardh E (2000):
Screening and prevention of diabetic
blindness. Acta Ophthalmol Scand 78:
374–385.
Su S & Shih CL (2003): Modelling an
emergency medical services system using
computer simulation. Int J Med Inform 72:
57–72.
Younis N, Broadbent DM, Harding SP &
Vora JP (2003a): Incidence of sight-
threatening retinopathy in type 1 diabetes
in a systematic screening programme.
Diabet Med 20: 758–765.
Younis N, Broadbent DM, Vora JP &
Harding SP (2003b): Incidence of sight-
threatening retinopathy in patients with
type 2 diabetes in the Liverpool Diabetic
Eye Study: a cohort study. Lancet 361:
195–200.
Received on March 16th, 2005.
Accepted on July 12th, 2005.
Correspondence:
Anja Bech Hansen
Department of Ophthalmology
Herlev Hospital
DK-2730 Herlev
Denmark
Tel: þ 45 4488 4657
Fax: þ 45 4453 8669
Email: [email protected]
ACTA OPHTHALMOLOGICA SCANDINAVICA 2005
685

Appendix
The model equations are as follows:
N0nþ1 ¼ N0n þðQ0 � 1Þ
P0N0n þ
Q3
12N3n þ
Q6
24N6n þ
Q12
48N12n þ
Q24
96N24n þ V0S�W0T
N3nþ1 ¼ N3n þR0
P0N0n þ
ðR3 � 1Þ12
N3n þR6
24N6n þ
R12
48N12n þ
R24
96N24n þ V3S�W3T
N6nþ1 ¼ N6n þX0
P0N0n þ
X3
12N3n þ
ðX6 � 1Þ24
N6n þX12
48N12n þ
X24
96N24n þ V6S�W6T
N12nþ1 ¼ N12n þY0
P0N0n þ
Y3
12N3n þ
Y6
24N6n þ
ðY12 � 1Þ48
N12n þY24
96N24n þ V12S�W12T
N24nþ1 ¼ N24n þZ0
P0N0n þ
Z3
12N3n þ
Z6
24N6n þ
Z12
48N12n þ
ðZ24 � 1Þ96
N24n þ V24S�W24T
where N0, N3, N6, N12 andN24 ¼ screening intervals, P0 ¼ numberof weeks the patients are at theDepartment of Ophthalmology; Q, R,X, Y and Z ¼ transition ratios for 0,
3, 6, 12 and 24 months, respectively;V ¼ fraction of the influx of patients;S ¼ influx of patients per year/totalnumber of patients in the population/number of work weeks per year;
W ¼ fraction of the outflux of patients;T ¼ outflux of patients per year/totalnumber of patients in the population/number of work weeks per year; andn ¼ time step (1 week).
Screening ¼ 48
40
N0nþ1
P0þN3nþ1
12þN6nþ1
24þN12nþ1
48þN24nþ1
96
� �
ACTA OPHTHALMOLOGICA SCANDINAVICA 2005
686