model portfolio update -...
TRANSCRIPT

Model Portfolio update
March 15, 2018

Deal Team – At Your ServiceLatest Model Portfolio
Source: Bloomberg, ICICIdirect.com Research
*Diversified portfolio - Combination of 70% large cap and 30% midcap portfolio
Midcap
• Exclusion – Zee Entertainment, Asian Paints and reduced weight in Tata
Motors DVR
• Inclusion – ITC and increased weight in Eicher, Maruti and L&T
Large cap
• Exclusion – Supreme Industries
• Inclusion – Kalpataru Power Transmission
Name of the company Weightage(%)
Auto 17.0
Tata Motor DVR 3.0
Maruti 6.0
EICHER Motors 4.0
Mahindra & Mahindra (M&M) 4.0
BFSI 37.0
HDFC Bank 10.0
Axis Bank 6.0
HDFC 9.0
Bajaj Finance 6.0
SBI 6.0
Capital Goods 6.0
L & T 6.0
Cement 4.0
UltraTech Cement 4.0
FMCG/Consumer 19.0
Dabur 5.0
Marico 4.0
ITC 6.0
Nestle 4.0
IT 6.0
TCS 6.0
Metals 6.0
Hindustan Zinc 6.0
Oil and Gas 5.0
GAIL Ltd. 5.0
Total 100.0
Name of the company Weightage(%)
Auto 6.0
Bharat Forge 6.0
BFSI 20.0
Bajaj Finserve 8.0
J&K Bank 6.0
Indian Bank 6.0
Capital Goods 12.0
Bharat Electronics 6.0
Kalpataru Power transmission 6.0
Cement 6.0
Ramco Cement 6.0
Consumer 30.0
Symphony 6.0
Kansai Nerolac 6.0
Pidilite 6.0
Tata Chemicals 6.0
Bata 6.0
Metals 6.0
Graphite India 6.0
Infrastructure 8.0
NBCC 8.0
Logistics 6.0
Container Corporation of India 6.0
Textile 6.0
Arvind 6.0
Total 100.0

• Our indicative large cap equity model portfolio has continued to deliver an
impressive return (inclusive of dividends) of 117.1% since its inception
(June 21, 2011) vis-à-vis the index return of 97.7% during the same
period, an outperformance of 19%. This validates our thesis of selecting
companies with sound business fundamentals that form the core theme of
our portfolio. Our midcap portfolio has outperformed the benchmark by
2.3x (since June 2011), posting returns of 350%
• Our consistent outperformance demonstrates our superior stock picking
ability over these years aligned to our view of favourable risk-reward,
good franchisee vs. reward-at-any-risk businesses. Some key performers
of our portfolio are Bajaj Finance, HDFC Bank and HDFC in the large cap
portfolio while Natco Pharma, Kansai Nerolac and Bajaj Finserv have
delivered stupendous returns in the midcap portfolio. We continue to
advocate the SIP mode of investment as the preferred mode of
deployment given the rich valuations that some pockets of the market
have reached. We highlight that the SIP return of our portfolio has
consistently outperformed indices. This affirms our belief in the staggered
and systematic approach of investment amid market volatility
• Quarterly results are encouraging thereby depicting upbeat domestic
economic sentiments (also depicted by November-December 2017 IIP
numbers) thereby reinforcing our view of a smart earnings recovery being
under way. Sensex companies (ex-banks) posted a robust Q3FY18
performance partly due to the low base due to demonetisation in base
quarter i.e. Q3FY17 and adapting of trading channel to the new GST
regime. On the sectoral front, in Q3FY18, the auto space continued the
positive momentum with overall 16% volume growth on a YoY basis. The
key surprise was upbeat M&HCV sales (up 37% YoY)
• Given the outperformance, we have increased the allocation to the auto
sector by 100 bps to 17% (vs. earlier 16%). The portfolio ideology
remains receptive to newer opportunities available in the market.
Subsequently, we have made several changes to the portfolio. The new
additions in our large cap portfolio is ITC. Moreover, in addition to the
auto sector, we have increased allocated weights in L&T. In our midcap
portfolio, we have added Kalpataru Power. Considering the near term
challenges in the business profile, we have reduced our weightage in Tata
Motors. We have exited Zee Entertainment from the large cap portfolio.
Moreover, given the strengthening crude prices we have also excluded
Supreme Industries
Deal Team – At Your ServiceOutperformance continues across all portfolios…
House view on Index
• We maintain our index targets (Sensex at 37,600 & Nifty at 11,725) with
revised Sensex earnings, implying ~17x P/E on FY20E EPS, which is in
tandem with the long period average. The earnings growth at the index
level will be led by the index heavy (~40% weight) banking & NBFC space
primarily tracking bottoming of asset quality pressure and resolution of
big ticket stressed assets through NCLT mechanism. In the consumer
space, the earnings growth will be led by the auto space
• We continue to maintain our high allocation towards the BFSI space with
total weightage of 37% in the large cap portfolio and 20% in midcap
portfolio. Apart from this, we continue to remain positive on consumption
theme with allocation of 19% and 30% in large cap and midcap portfolio,
respectively
• Over the last quarter, companies continue to witness pressure on gross
margins on account of a rise in commodity prices, which remains low in
our portfolio pecking order. Our preferred picks are companies with
higher capacity utilisation along with improved operating leverage
• A revival in the capex cycle coupled with a lower interest rate scenario
would benefit the BFSI and construction space (SBI, UltraTech, L&T, HDFC
and HDFC Bank)
1403 1480 1869 21902.0%
5.5%
26.3%
17.2%
0.0%
10.0%
20.0%
30.0%
0
200
400
600
800
1000
1200
1400
1600
1800
2000
2200
2400
FY17 FY18E FY19E FY20E
(|)
Sensex EPS Growth (%)
Strategy 2018 - Sensex & Nifty Target

Deal Team – At Your ServicePerformance so far* …
Source: Bloomberg, ICICIdirect.com Research
• The large cap equity model portfolio continued its outperformance vis-à-
vis the index with 117.1% return since its inception (June 21, 2011) vis-à-
vis index return of 97.7% in the same period. Our sustained preference for
high quality names has aided this outperformance on a consistent basis.
We continue to be rewarded for our meticulous approach towards stock
selection while we endeavour to emulate the broader index
• On the other hand, given the astute selection in the midcap portfolio, the
outperformance in the same continues, with a return of 350.1% compared
to the midcap index return of 150.4%
• Given the overall outperformance in both (large & midcap) portfolios, the
diversified portfolio (combination of 70/30 ratio) has outperformed its
benchmark indices
• Since the last update (August 2017), our large cap portfolio has slightly
outperformed the benchmark index performance generating a return of
5% compared to benchmark return of 4.8%. The index outperformance
was mainly on the back of performance in Gail and Maruti. Our large cap
portfolio was impacted by the underperformance of Tata Motors and
Eicher Motors
• Our conservative stock selection in the midcap portfolio continues to
exhibit strong outperformance vs. the broader indices. The portfolio
outperformed with a return of 15.4% compared to index return of 6.1%.
Strong performance in Graphite India and Symphony resulted in the
outperformance. However, the portfolio performance was impacted by
J&K Bank and Bharat Electronics
Portfolio performance since inception Portfolio performance since last update (August 2017)
117.1
350.1
165.4
97.7
150.4
111.7
0
100
200
300
400
Large Cap Midcap Diversified
%
Portfolio Benchmark
5.0
15.4
8.1
4.8
6.1 5.8
0
2
4
6
8
10
12
14
16
18
Large Cap Midcap Diversified
%
Portfolio Benchmark

Deal Team – At Your ServiceTop movers* so far…
Large cap Midcap Diversified
Source: Bloomberg, ICICIdirect.com Research , *Starred stocks have been included in the portfolio since the last rejig in July 2012/May, August ,December 2013/ April, June, December 2014/ May 2015/July
2015/October 2015. Rest all are since inception in June 2011
Large cap Midcap Diversified
0
50
100
150
200
250
300
Bajaj
Finance
HDFC Bank HDFC TCS Axis Bank
(%
)
Gainers
0
100
200
300
400
500
Natco
Pharma*
Kansai
Nerolac*
Bajaj
Finserve*
Ramco
Cements
IndusInd
Bank
(%
)
Gainers
0
50
100
150
200
250
300
350
400
Natco
Pharma*
Kansai
Nerolac*
Bajaj
Finance
HDFC Bank Bajaj
Finserve*
(%
)
Gainers
-30
-25
-20
-15
-10
-5
0
Tata S
teel
Bharti A
irtel
Aurobin
do P
harm
a
Coal India
Bio
con
(%
)
Draggers
-25
-20
-15
-10
-5
0U
nited S
pirits
Indig
o
Castrol India
Exid
e Industrie
s L
td
CA
RE
(%
)
Draggers
-40
-32
-24
-16
-8
0
Castrol
India
Exide
Industries
Ltd
CARE Coal India Biocon
(%
)
Draggers

Deal Team – At Your ServicePerformance* so far in SIP mode …
Source: Bloomberg, ICICIdirect.com Research
• Systematic investments at regular intervals in all our three portfolios have outperformed their respective benchmarks, acting as a perfect shield to the
volatility that the market encountered last year
• Assuming | 1,00,000 invested as SIP at the end of every month
• Start date of SIP is June 30, 2011
8,3
00
,00
0
8,3
00
,00
0
8,3
00
,00
0
11
,76
8,7
60
24
,21
9,2
62
13
,38
8,3
98
11
,95
1,8
54
12
,51
4,5
65
13
,05
2,6
00
0
2,000,000
4,000,000
6,000,000
8,000,000
10,000,000
12,000,000
14,000,000
16,000,000
Largecap Midcap Divesified
|
Investment Value of Investment in Portfolio Value if invested in Benchmark

Deal Team – At Your ServiceWhat’s in, what’s out?
What's in?
Source: ICICIdirect.com Research
What's out ?
Name Portfolio Weight
ITC Largecap 6%
L&T Largecap Increased from 4% to 6%
Maruti Largecap Increased from 5% to 6%
Eicher Motors Largecap Increased from 3% to 4%
Kalpataru Power Midcap 6%
Name Portfolio Weight
Zee Entertainment Largecap 4%
Asian Paints Largecap 5%
Tata Motors DVR Largecap Reduced from 4% to 3%
Supreme Industries Midcap 6%

Deal Team – At Your ServiceThe story of the stocks…
Source: Bloomberg ICICIdirect.com Research
Kalpataru Power (KALPOW)
• Kalpataru Power is a leading power T&D EPC player with well diversified
operations in both domestic and international markets. The company has
also emerged as a leading EPC player in the railways and oil & gas
pipeline infrastructure
• As of 9MFY18, KPTL commands a strong order backlog of | 10532 crore
which renders comfortable revenue visibility till FY20E. Till 9MFY18, the
company has won significant orders to the tune of | 8440 crore. Going
ahead, opportunities in the power T&D space (international markets),
railways and pipeline segment will add to order wins. Hence, we build in
order inflow of | 10500 crore and | 12000 crore in FY19E and FY20E,
respectively
• With robust wins in the infrastructure segment (railways and pipeline),
overall revenues are likely to witness revenue CAGR of 15.9% during
FY18E-20E. EBITDA margins are likely to be in the 11-11.8% range, which
is expected to result in PAT CAGR of 21.9%
• JMC’s improved performance and robust outlook in the core EPC
business and lower capex intensity in BOT assets may further aid the
consolidated performance while the logistics subsidiary that is likely to
turn around at PBT level by FY19E may further aid the performance
• Scalability of new business segments, operating leverage gains supported
by consistent growth in base business may drastically improve return
ratios of the company from 11.4% in FY17 to 13.2 in FY20E. We believe
KPTL is on a very strong footing and will get rerated. We value the
company on a SoTP basis and arrive at a fair value of | 600/share
(| Crore) FY17 FY18E FY19E FY20E
Net Sales 4,894.1 5,508.8 6,483.5 7,399.4
EBITDA 546.3 621.4 745.2 864.5
PAT 284.7 322.2 398.9 478.6
EPS (|) 18.5 21.0 26.0 31.2
P/E (x) 24.8 21.9 17.7 14.7
RoE (%) 11.2 11.4 12.5 13.2
RoCE (%) 15.5 16.1 17.5 18.4
ITC (ITC)
• ITC is a leading player in the Indian cigarettes industry with a market
share of over 80%. Apart from cigarettes, it has a diversified presence in
the hotels, agri, paperboards & packaging and FMCG industry. ITC has
successfully built the FMCG brands, which have recorded strong sales
growth over a short span of time, e.g. Aashirvaad (~| 3500 crore),
Sunfeast (~| 3000 crore) and Bingo (more than | 1000 crore)
• Additionally, it is foraying into new segments like dairy (Aashirvaad
Svasti ghee), premium chocolates (Flabelle), juices (B Naturals) and
Coffee (Sunbean), which bodes well for the company’s long term
revenue target of | 1 lakh crore by FY30. Post GST implementation, ITC
would be the key beneficiary of a) demand revival, b) shift in
consumption pattern (from unorganised to organised) and c) supply
chain benefits
• We value the cigarettes business at | 223 (P/E multiple of 25x FY20E
EPS), FMCG at | 61 (5x MCap/sales FY20E), paperboards at | 9 (6x FY20E
EV/EBITDA), agri-business at | 6 (3x P/BV FY19E) and hotels at | 8 (2x
EV/room FY20E) and also added the cash per share of | 13. We believe
revenue growth and profitability of FMCG business would be the key
driven catalyst for the growth over the long term period. We maintain
our BUY rating on the stock price with a target price of | 320 per share
(| Crore) FY17 FY18E FY19E FY20E
Revenue (| crore) 39,641.9 39,114.9 44,534.9 48,688.1
EBITDA (| crore) 14,578.0 14,478.7 16,908.0 18,598.1
Net Profit (| crore) 10,200.9 10,590.2 11,987.4 13,155.3
EPS (|) 8.4 8.7 9.9 10.8
P/E (x) 32.4 31.2 27.6 25.1
P/BV (x) 7.3 6.7 6.6 6.4
ROE (%) 22.5 21.0 23.8 25.4
ROCE (%) 32.9 29.9 34.3 36.7
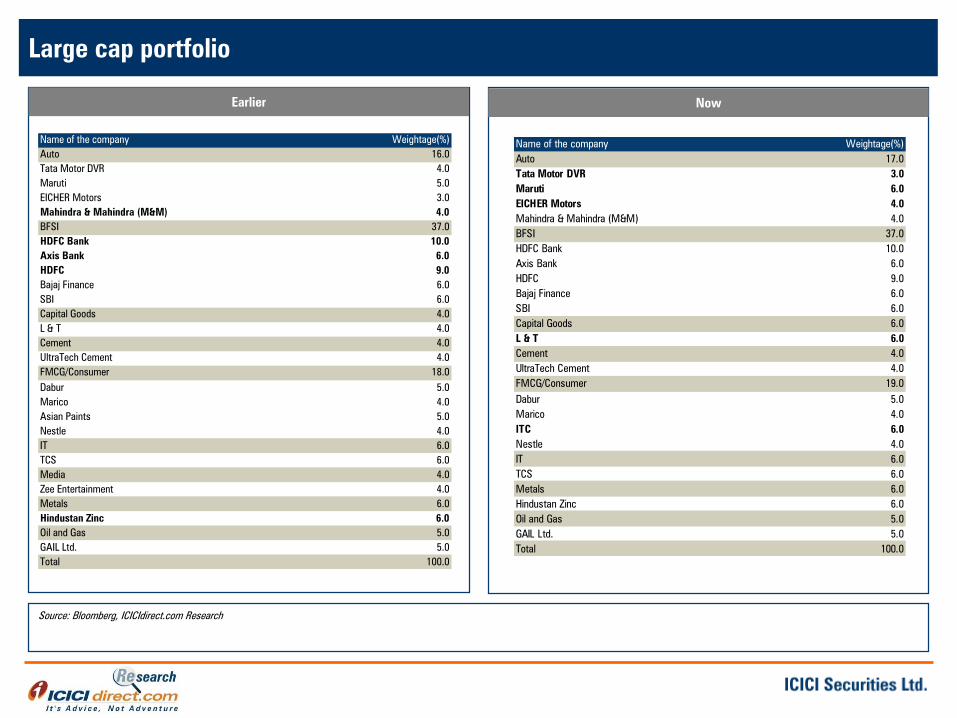
Deal Team – At Your ServiceLarge cap portfolio
Source: Bloomberg, ICICIdirect.com Research
Earlier Now
Name of the company Weightage(%)
Auto 16.0
Tata Motor DVR 4.0
Maruti 5.0
EICHER Motors 3.0
Mahindra & Mahindra (M&M) 4.0
BFSI 37.0
HDFC Bank 10.0
Axis Bank 6.0
HDFC 9.0
Bajaj Finance 6.0
SBI 6.0
Capital Goods 4.0
L & T 4.0
Cement 4.0
UltraTech Cement 4.0
FMCG/Consumer 18.0
Dabur 5.0
Marico 4.0
Asian Paints 5.0
Nestle 4.0
IT 6.0
TCS 6.0
Media 4.0
Zee Entertainment 4.0
Metals 6.0
Hindustan Zinc 6.0
Oil and Gas 5.0
GAIL Ltd. 5.0
Total 100.0
Name of the company Weightage(%)
Auto 17.0
Tata Motor DVR 3.0
Maruti 6.0
EICHER Motors 4.0
Mahindra & Mahindra (M&M) 4.0
BFSI 37.0
HDFC Bank 10.0
Axis Bank 6.0
HDFC 9.0
Bajaj Finance 6.0
SBI 6.0
Capital Goods 6.0
L & T 6.0
Cement 4.0
UltraTech Cement 4.0
FMCG/Consumer 19.0
Dabur 5.0
Marico 4.0
ITC 6.0
Nestle 4.0
IT 6.0
TCS 6.0
Metals 6.0
Hindustan Zinc 6.0
Oil and Gas 5.0
GAIL Ltd. 5.0
Total 100.0
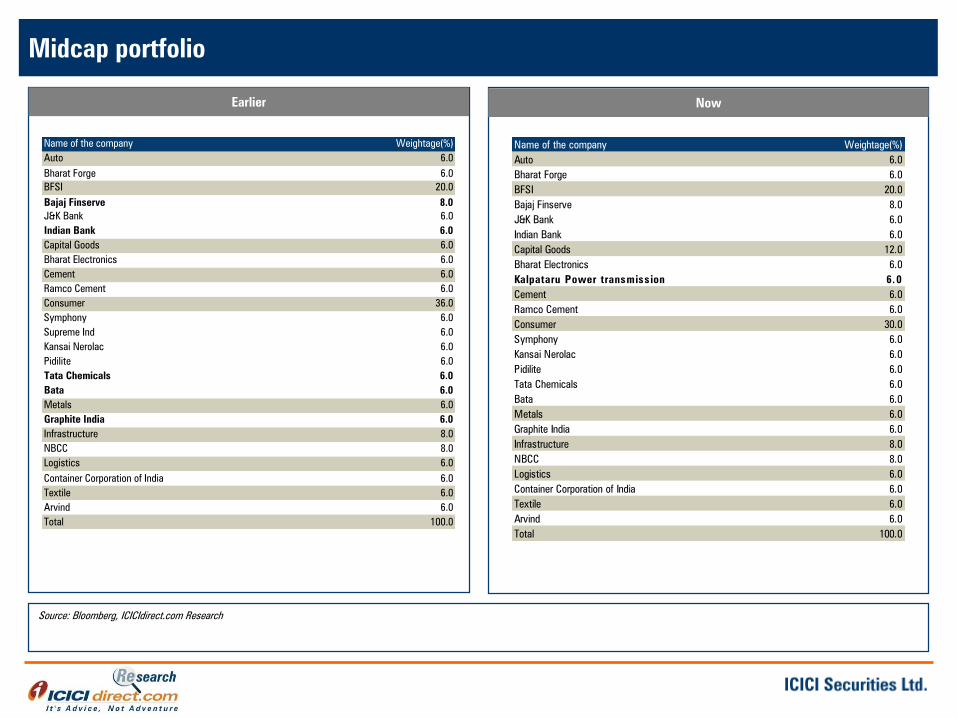
Deal Team – At Your ServiceMidcap portfolio
Source: Bloomberg, ICICIdirect.com Research
Earlier Now
Name of the company Weightage(%)
Auto 6.0
Bharat Forge 6.0
BFSI 20.0
Bajaj Finserve 8.0
J&K Bank 6.0
Indian Bank 6.0
Capital Goods 6.0
Bharat Electronics 6.0
Cement 6.0
Ramco Cement 6.0
Consumer 36.0
Symphony 6.0
Supreme Ind 6.0
Kansai Nerolac 6.0
Pidilite 6.0
Tata Chemicals 6.0
Bata 6.0
Metals 6.0
Graphite India 6.0
Infrastructure 8.0
NBCC 8.0
Logistics 6.0
Container Corporation of India 6.0
Textile 6.0
Arvind 6.0
Total 100.0
Name of the company Weightage(%)
Auto 6.0
Bharat Forge 6.0
BFSI 20.0
Bajaj Finserve 8.0
J&K Bank 6.0
Indian Bank 6.0
Capital Goods 12.0
Bharat Electronics 6.0
Kalpataru Power transmission 6.0
Cement 6.0
Ramco Cement 6.0
Consumer 30.0
Symphony 6.0
Kansai Nerolac 6.0
Pidilite 6.0
Tata Chemicals 6.0
Bata 6.0
Metals 6.0
Graphite India 6.0
Infrastructure 8.0
NBCC 8.0
Logistics 6.0
Container Corporation of India 6.0
Textile 6.0
Arvind 6.0
Total 100.0

Deal Team – At Your ServiceDiversified portfolio (1/2)
Source: Bloomberg, ICICIdirect.com Research
Earlier Now
Name of the company Weightage(%)
Auto 13.0
Tata Motor DVR 2.8
Maruti 3.5
Eicher Motors 2.1
Bharat Forge 1.8
Mahindra & Mahindra (M&M) 2.8
Consumer Discretionary 16.1
Symphony 1.8
Supreme Ind 1.8
Kansai Nerolac 1.8
Pidilite 1.8
Asian Paints 3.5
Arvind 1.8
Tata Chemicals 1.8
Bata 1.8
BFSI 31.9
HDFC Bank 7.0
Axis Bank 4.2
SBI 4.2
HDFC 6.3
Bajaj Finance 4.2
Bajaj Finserve 2.4
J&K Bank 1.8
Indian Bank 1.8
Power, Infrastructure & Cement 13.4
L & T 2.8
UltraTech Cement 2.8
Ramco Cement 1.8
NBCC 2.4
Bharat Electronics 1.8
Container Corporation of India 1.8
Name of the company Weightage(%)
Auto 13.7
Tata Motor DVR 2.1
Maruti 4.2
Eicher Motors 2.8
Bharat Forge 1.8
0 2.8
Consumer Discretionary 15.0
Symphony 1.8
Kansai Nerolac 1.8
Pidilite 1.8
ITC 4.2
Arvind 1.8
Container Corporation of India 1.8
Textile 1.8
BFSI 31.9
HDFC Bank 7.0
Axis Bank 4.2
SBI 4.2
HDFC 6.3
Bajaj Finance 4.2
Bajaj Finserve 2.4
J&K Bank 1.8
Indian Bank 1.8
Power, Infrastructure & Cement 16.6
L & T 4.2
Kalpataru Power transmission 1.8
UltraTech Cement 2.8
Ramco Cement 1.8
NBCC 2.4
Bharat Electronics 1.8
Container Corporation of India 1.8

Deal Team – At Your ServiceDiversified portfolio (2/2)
Source: Bloomberg, ICICIdirect.com Research
Earlier Now
Name of the company Weightage(%)
FMCG 9.1
Nestle 2.8
Marico 2.8
Dabur 3.5
Metals 6.0
Hindustan Zinc 4.2
Graphite India 1.8
IT 4.2
TCS 4.2
Media 2.8
Zee Entertainment 2.8
Oil and Gas 3.5
GAIL Ltd. 3.5
Total 100.0
Name of the company Weightage(%)
FMCG 9.1
Nestle 2.8
Marico 2.8
Dabur 3.5
Metals 6.0
Hindustan Zinc 4.2
Graphite India 1.8
IT 4.2
TCS 4.2
Oil and Gas 3.5
GAIL Ltd. 3.5
Total 100.0

13
Pankaj Pandey Head – Research [email protected]
ICICIdirect.com Research Desk,
ICICI Securities Limited,
1st Floor, Akruti Trade Centre,
Road No 7, MIDC
Andheri (East)
Mumbai – 400 093

ANALYST CERTIFICATION
We /I, Pankaj Pandey, Research Analysts, authors and the names subscribed to this report, hereby certify that all of the views expressed in this research report accurately reflect our views about the
subject issuer(s) or securities. We also certify that no part of our compensation was, is, or will be directly or indirectly related to the specific recommendation(s) or view(s) in this report.
Terms & conditions and other disclosures:
ICICI Securities Limited (ICICI Securities) is a full-service, integrated investment banking and is, inter alia, engaged in the business of stock brokering and distribution of financial products. ICICI Securities
Limited is a Sebi registered Research Analyst with Sebi Registration Number – INH000000990. ICICI Securities is a wholly-owned subsidiary of ICICI Bank which is India’s largest private sector bank and
has its various subsidiaries engaged in businesses of housing finance, asset management, life insurance, general insurance, venture capital fund management, etc. (“associates”), the details in respect of
which are available on www.icicibank.com.
ICICI Securities is one of the leading merchant bankers/ underwriters of securities and participate in virtually all securities trading markets in India. We and our associates might have investment banking
and other business relationship with a significant percentage of companies covered by our Investment Research Department. ICICI Securities generally prohibits its analysts, persons reporting to
analysts and their relatives from maintaining a financial interest in the securities or derivatives of any companies that the analysts cover.
The information and opinions in this report have been prepared by ICICI Securities and are subject to change without any notice. The report and information contained herein is strictly confidential and
meant solely for the selected recipient and may not be altered in any way, transmitted to, copied or distributed, in part or in whole, to any other person or to the media or reproduced in any form,
without prior written consent of ICICI Securities. While we would endeavour to update the information herein on a reasonable basis, ICICI Securities is under no obligation to update or keep the
information current. Also, there may be regulatory, compliance or other reasons that may prevent ICICI Securities from doing so. Non-rated securities indicate that rating on a particular security has
been suspended temporarily and such suspension is in compliance with applicable regulations and/or ICICI Securities policies, in circumstances where ICICI Securities might be acting in an advisory
capacity to this company, or in certain other circumstances.
This report is based on information obtained from public sources and sources believed to be reliable, but no independent verification has been made nor is its accuracy or completeness guaranteed.
This report and information herein is solely for informational purpose and shall not be used or considered as an offer document or solicitation of offer to buy or sell or subscribe for securities or other
financial instruments. Though disseminated to all the customers simultaneously, not all customers may receive this report at the same time. ICICI Securities will not treat recipients as customers by
virtue of their receiving this report. Nothing in this report constitutes investment, legal, accounting and tax advice or a representation that any investment or strategy is suitable or appropriate to your
specific circumstances. The securities discussed and opinions expressed in this report may not be suitable for all investors, who must make their own investment decisions, based on their own
investment objectives, financial positions and needs of specific recipient. This may not be taken in substitution for the exercise of independent judgment by any recipient. The recipient should
independently evaluate the investment risks. The value and return on investment may vary because of changes in interest rates, foreign exchange rates or any other reason. ICICI Securities accepts no
liabilities whatsoever for any loss or damage of any kind arising out of the use of this report. Past performance is not necessarily a guide to future performance. Investors are advised to see Risk
Disclosure Document to understand the risks associated before investing in the securities markets. Actual results may differ materially from those set forth in projections. Forward-looking statements are
not predictions and may be subject to change without notice.
ICICI Securities or its associates might have managed or co-managed public offering of securities for the subject company or might have been mandated by the subject company for any other
assignment in the past twelve months.
ICICI Securities or its associates might have received any compensation from the companies mentioned in the report during the period preceding twelve months from the date of this report for services
in respect of managing or co-managing public offerings, corporate finance, investment banking or merchant banking, brokerage services or other advisory service in a merger or specific transaction.
ICICI Securities or its associates might have received any compensation for products or services other than investment banking or merchant banking or brokerage services from the companies
mentioned in the report in the past twelve months.
ICICI Securities encourages independence in research report preparation and strives to minimize conflict in preparation of research report. ICICI Securities or its associates or its analysts did not receive
any compensation or other benefits from the companies mentioned in the report or third party in connection with preparation of the research report. Accordingly, neither ICICI Securities nor Research
Analysts and their relatives have any material conflict of interest at the time of publication of this report.
It is confirmed that Pankaj Pandey Research Analysts of this report have not received any compensation from the companies mentioned in the report in the preceding twelve months.
Compensation of our Research Analysts is not based on any specific merchant banking, investment banking or brokerage service transactions.
ICICI Securities or its subsidiaries collectively or Research Analysts or their relatives do not own 1% or more of the equity securities of the Company mentioned in the report as of the last day of the
month preceding the publication of the research report.
Since associates of ICICI Securities are engaged in various financial service businesses, they might have financial interests or beneficial ownership in various companies including the subject
company/companies mentioned in this report.
ICICI Securities has received an investment banking mandate from Government of India for disinvestment in ONGC. This report is prepared based on publicly available information
ICICI Securities has received an investment banking mandate from Government of India for disinvestment in Bharat Electronics. This report is prepared based on publicly available information.