model inter-comparison between statistical and dynamic
TRANSCRIPT

CLIMATE RESEARCHClim Res
Vol. 45: 227–248, 2010doi: 10.3354/cr00974
Published online December 30
1. INTRODUCTION
Recent observations of a decline in soil organic car-bon (SOC; abbreviations used in this article are alsodefined in Table 1) stocks in England and Wales(Bellamy et al. 2005) and increased dissolved organiccarbon (DOC) concentrations in upland surface waters(Freeman et al. 2001a, Monteith et al. 2007) have
prompted great interest in soil conservation andrestoration in Great Britain. Particular attention hasbeen given to blanket peats as these soils are themost significant terrestrial carbon stores in GreatBritain (Milne & Brown 1997, Billett et al. 2010, thisSpecial) and many areas have been degraded by along history of land management and pollution (Ram-chunder et al. 2009).
© Inter-Research 2010 · www.int-res.com*Email: [email protected]
Addresses for all authors are given in the Electronic supple-ment at www.int-res.com/articles/suppl/c045p227_supp.pdf
Model inter-comparison between statistical anddynamic model assessments of the long-term
stability of blanket peat in Great Britain (1940–2099)
J. M. Clark1,*, M. F. Billett, M. Coyle, S. Croft, S. Daniels, C. D. Evans, M. Evans, C. Freeman, A. V. Gallego-Sala, A. Heinemeyer, J. I. House, D. T. Monteith, D. Nayak, H. G. Orr, I. C. Prentice, R. Rose, J. Rowson,
J. U. Smith, P. Smith, Y. M. Tun, E. Vanguelova, F. Wetterhall, F. Worrall
1Grantham Institute for Climate Change Fellow, Civil and Environmental Engineering, Imperial College London, South Kensington, London SW7 2AZ, UK
ABSTRACT: We compared output from 3 dynamic process-based models (DMs: ECOSSE, MILLEN-NIA and the Durham Carbon Model) and 9 bioclimatic envelope models (BCEMs; including BBOGensemble and PEATSTASH) ranging from simple threshold to semi-process-based models. Modelsimulations were run at 4 British peatland sites using historical climate data and climate projectionsunder a medium (A1B) emissions scenario from the 11-RCM (regional climate model) ensemble under-pinning UKCP09. The models showed that blanket peatlands are vulnerable to projected climatechange; however, predictions varied between models as well as between sites. All BCEMs predicted ashift from presence to absence of a climate associated with blanket peat, where the sites with thelowest total annual precipitation were closest to the presence/absence threshold. DMs showed a morevariable response. ECOSSE predicted a decline in net C sink and shift to net C source by the end ofthis century. The Durham Carbon Model predicted a smaller decline in the net C sink strength, but noshift to net C source. MILLENNIA predicted a slight overall increase in the net C sink. In contrast tothe BCEM projections, the DMs predicted that the sites with coolest temperatures and greatest totalannual precipitation showed the largest change in carbon sinks. In this model inter-comparison, thegreatest variation in model output in response to climate change projections was not between theBCEMs and DMs but between the DMs themselves, because of different approaches to modelling soilorganic matter pools and decomposition amongst other processes. The difference in the sign of theresponse has major implications for future climate feedbacks, climate policy and peatland manage-ment. Enhanced data collection, in particular monitoring peatland response to current change, wouldsignificantly improve model development and projections of future change.
KEY WORDS: Peatland · Carbon · Climate change · Bioclimatic envelope model · Dynamic model ·Uplands · ECOSSE · MILLENNIA · Durham carbon model
Resale or republication not permitted without written consent of the publisher
Contribution to CR Special 24 ‘Climate change and the British Uplands’ OPENPEN ACCESSCCESS

Clim Res 45: 227–248, 2010
Blanket peat formation is dependent on a positivewater balance that is favoured by cooler and wetterconditions (Wieder & Vitt 2006); therefore, climatechange could provide an additional risk to peat stabil-ity, which in turn could provide a positive feedback to
climate change by releasing stored SOC to the atmo-sphere (Limpens et al. 2008). The impact of climatechange on the overall net carbon (C) balance is un-certain, as both increases and decreases in SOC stocksare possible, depending on the balance between de-composition and net primary productivity (NPP)(Limpens et al. 2008, Smith & Fang 2010). At present,there are few detailed measurements of peatland Cbudgets both within Great Britain and globally (Billettet al. 2010). In the absence of long-term data, model-ling tools are required to provide broader-scale esti-mates of long-term changes in C balances to aid policyand management decisions.
Peatland models show large differences in complexityand structure. Bioclimatic envelope models (BCEMs)range from simple statistical relationships to semi-process-based models. They estimate the probability ofblanket peat presence or absence based on persistenceof a climate that is associated with peat (e.g. Clark et al.2010, this Special, Gallego-Sala et al. 2010, this Special).It is important to note that BCEMs only tell us aboutchanging climatic conditions, they do not model whatwill actually happen to the peat. Modelling of changes insoil carbon and vegetation in response to climate changeis carried out by dynamic models (DMs). These range incomplexity from net C balance models based on em-pirical C flux predictions (Worrall et al. 2009b) to com-plex dynamic process-based models that use both cli-matic and biogeochemical parameter data to simulatechanges in peat accumulation and decomposition basedon the peat cohort (i.e. organic material of similar ageand depth in peat profile) (Frolking et al. 2001, Heine-meyer et al. 2010, this Special) or the size of C pool(Smith et al. 2007, Smith et al. 2010a,b, both this Special).
Both BCEMs and DMs have been used to inform pol-icy decisions regarding blanket peat management(e.g. Smith et al. 2007, House et al. 2010). It is unclearwhether simple BCEMs—that primarily predict theprobability of presence or absence of a climate associ-ated with peat—provide a closer approximation of thetrajectory of change in long-term peat stability pre-dicted by more complex DMs that calculate both thesign and the magnitude of the C balance.
There are advantages and disadvantages to DMsand BCEMs, such that no single model provides a fullycomprehensive solution. Although DMs are appealingbecause they explicitly represent ecosystem processes,all such models in practice only provide a partial repre-sentation of environmental systems because of theinherent complexity of the natural environment andour incomplete understanding of these systems. Forinstance, most peat models (Worrall et al. 2009b, Smithet al. 2010a,b) represent the dynamics of decomposi-tion using empirical relationships to define decomposi-tion rates and partitioning between different gaseous
228
Table 1. List of abbrevations
Abbreviation Definition
AAMWD Annual accumulated monthly water deficit (see Clark et al. 2010)
AC Auchencorth Moss peatland siteAET Actual evapotranspirationAWS Automatic Weather StationBADC British Atmospheric Data CentreBBOG British Blanket Bog BCEM (see Clark et al.
(2010)BBOG-GAM British Blanket Bog BCEM constructed
using a generalised additive model (see Clark et al. 2010)
BBOG-GLM British Blanket Bog BCEM constructed using a generalised linear model (see Clark et al. 2010)
BBOG-TREE British Blanket Bog BCEM constructed using a classification tree model (see Clark et al. 2010)
BCEM Bioclimatic envelope modelBK Bleaklow peatland siteCEH Centre for Ecology and HydrologyCH4 MethaneCW Conwy peatland siteDIC Dissolved inorganic carbonDM Dynamic model (ECOSSE, MILLENNIA,
Durham Carbon Model)DOC Dissolved organic carbonECOSSE Estimating Carbon in Organic Soils
Sequestration and Emission, dynamic model for organic soils (see Smith et al. 2010a,b)
GCM Global climate modelGPP Gross primary productionHadRM3 Hadley Centre Regional Climate Model
version 3H-GLM Peatland BCEM after Hossell et al. (2000)HOST Hydrology of soil types (see Table 2)LM Peatland BCEM after Lindsay et al. (1998)MH Moor House peatland siteMILLENNIA Dynamic peatland model (see Heinemeyer
et al. 2010)MOS Model output statisticsNPP Net primary productionP50 Peatland BCEM adapted after Pearsall
(1950)P65 Peatland BCEM adapted after Pearsall
(1965)PE Potential evaporationPEATSTASH Peatland BCEMPFT Plant functional typePOC Particulate organic carbonRCM Regional climate modelRothC Rothamsted Carbon Model (Coleman &
Jenkinson 1996)SOC Soil organic carbonSOM Soil organic matterTMI Thornthwaite-Mather moisture indexUKCP09 United Kingdom Climate Projections
2009

Clark et al.: Model inter-comparison for GB blanket peat
and aquatic C fluxes. Dynamic feedbacks betweenwater table, vegetation change and micro-topographicvariations, which in turn change decomposition ratesdue to dynamic changes in vegetation/litter qualityand hydrologic conditions, are often not included inthese models, and are a recent development (Belyea &Malmer 2004, Ise et al. 2008, Heinemeyer et al. 2010).Data to parameterise and initialise DMs are oftenscarce (e.g. decomposition rates, carbon pool sizes),limiting application and validation of these models(Heinemeyer et al. 2010). In addition, the detailed pro-cess representation tends to make DMs site specificand computationally expensive to run over long timeperiods and/or spatial scales and so may not be practi-cal to apply at regional or global scales (Fronzek et al.2006). By contrast, BCEMs have the advantage of onlyrequiring readily available climatic data and can beapplied quickly and easily over a wide area (e.g. Clarket al. 2010). Yet, BCEMs are based on static relation-ships with climate and ignore interactions betweenother changing variables like land use and atmosphericdeposition (Hampe 2004); these limitations need toconsidering in any BCEM application examining cli-mate change impacts (Heikkinen et al. 2006).
Model inter-comparison studies have highlightedhow the differences in C cycle representation withincomplex models can lead to different results (e.g. Smithet al. 1997, Jones et al. 2005, Friedlingstein et al. 2006).For instance, in a comparison of 11 global climate mod-els (GCMs), when vegetation and soil dynamics wereexplicitly included (coupled climate–C cycle models),all models showed an increase in atmospheric CO2 dueto feedbacks from the C cycle (e.g. increased soil respi-ration and vegetation change). The magnitude ofchange varied considerably from +20 to +200 ppm CO2
depending on the model structure, with differences inmodelled response of soil respiration to temperaturebeing one of the major sources of variance (Friedling-stein et al. 2006). Other studies comparing changing Cstocks have also found agreement between models interms of long-term decline in C stocks under future cli-mate projections, although the magnitude of declinewas greater from simple models with 1 SOM pool thanmore complex models with 5 SOM pools (Jones et al.2005). Moreover, when compared with observationaldata, a comparison between 9 soil organic matter (SOM)models and long-term field observations showed thatthe models tested fell into 2 groups, with one groupwhere models were developed specifically for soils andcontained more SOM pools performing statistically bet-ter than the other group where models were developedfor a specific system (e.g. forestry) and were not aswidely tested (Smith et al. 1997).
Soil model intercomparison exercises have been use-ful in identifying areas for model development and
observational needs (Smith et al. 1997, Randerson et al.2009); however, these intercomparisons have mostlybeen carried out for mineral soils. To date, there hasbeen little analysis of models for organic soils, in spiteof their use in aiding policy and management decisionsin recent years (e.g. Smith et al. 2007, Worrall et al.2009b, House et al. 2010).
In the present study, we compare the outputs fromrelatively simple static BCEMs (Clark et al. 2010, Gal-lego-Sala et al. 2010) with more complex dynamic Caccumulation and C flux models (Worrall et al. 2009b,Heinemeyer et al. 2010, Smith et al. 2010a,b) to deter-mine whether (1) there is any agreement betweencomplex models in terms of the change in C balanceunder more recent and future climate projections, and(2) the BECMs can give a useful indication of the prob-able changes. Comparison between BECMs and DMswas based on the assumption that, in areas whereblanket peat is present and the BCEMs predict contin-ued presence (due to maintaining a ‘suitable’ climate),the peat was assumed to be a C sink (i.e. the sign of thenet C balance is positive) whereas in areas whereblanket peat was present and bioclimatic models pre-dict blanket peat to be absent (i.e. the climate shiftsaway from that currently associated with peat), thepeat was assumed to be a net C source (i.e. the sign ofthe C balance is negative).
Model comparison was carried out using data from4 data-rich blanket peat field-sites across Great Britainwhere long-term monitoring data were available toparameterise and run the DMs. Two climatic data setswere used to compare model outputs over the recentobserved period (1940–2005) (Perry & Hollis 2005) andfor modelled projections (1950–2099) using the HadleyCentre Regional Climate Model (HadRM3) under theA1B emissions scenario. The A1B scenario has a story-line of an integrated world with rapid economic growthand growing population until 2050 and balanced em-phasis on all energy sources (Nakicenovic et al. 2000).These 11 outputs from HadRM3 (11-regional climatemodel [RCM] ensemble) formed part of the underlyingdata used to create the UKCP09 climate projections forthe UK (Murphy et al. 2009).
2. METHODS
2.1. Site descriptions and data availability
Models were run for 4 blanket peat sites across GreatBritain where peatland C balances have been moni-tored; 3 of these sites form part of the Centre for Ecologyand Hydrology (CEH) C catchments network (www.ceh.ac.uk/sci_programmes/CarbonExchangeattheCatchmentScale.htm). A location map of each of these sites is shown
229

Clim Res 45: 227–248, 2010
in Fig. 1 and brief description is given below. Sites werechosen because of the availability of parameter data, dri-ving climatic variables and measurements of C fluxesand stocks needed to run and verify models (Table 2)(Billett et al. 2010).
2.1.1. Auchencorth Moss, southern Scotland
Auchencorth Moss is a long-term monitoring site insouthern Scotland (55.79° N, 3.24° W). The site is partlydrained and used primarily for rough grazing, with asmall amount of peat extraction to the western edge. Ap-proximately 85% of the 335 ha is covered with blanketpeat (0.5 to 5 m deep) over an altitudinal range of 248 to300 m (Billett et al. 2004). Vegetation cover is dominatedby Eriophorum vaginatum, Juncus effusus, and Sphag-num spp. with Calluna vulgaris in drained areas (Dins-more & Billett 2008). Mean annual precipitation (2002–2008) and temperature (1971–2000) were 1155 mm and10°C, respectively (Drewer et al. 2010). Mean watertable depth at 9 dip wells was 12.5 cm below the surface(Dinsmore et al. 2010). Typical pH of the peat is pH 2.5 to3.0 in CaCl2 (Billett et al. 2004). Continuous AutomaticWeather Station (AWS) data has been collected since1995; for this work the period 2007–2008 was used. Re-cent measurements combining both gaseous and aquatic
230
Fig. 1. Location of field sites in Great Britain with respect topeatland area. Crown copyright/database right 2009. An Ord-nance Survey/EDINA supplied service. Geological Map Data
NERC 2009
Table 2. Summary of model data needs and data availability. Exact bioclimatic envelope model (BCEM) climate data require-ments vary between models (Clark et al. 2010, Gallego-Sala et al. 2010, both this Special). ECOSSE is a pool-based soil organicmatter model (Smith et al. 2010a,b, both this Special); MILLENNIA is a cohort-based peat accumulation model (Heinemeyer etal. 2010); and the Durham Carbon Model (DCM) is a flux-based C balance model (Worrall et al. 2009b). H: hourly, D: daily,
M: monthly, A: annual, K: millennial. HOST: Hydrology of soil type (classification of soil hydrology)
Model data requirements Field site data availabilityBCEM ECOSSE MILLENNIA DCM Auchencorth Moss Moor House Conwy Bleaklow
ParametersLand management � � � � � �Vegetation/bare soil � � � � �Acrotelm depth � � �Bulk density � �Clay content � �Carbon content � � � �Soil pH � � � �Wetness class HOST � � � � �Hydraulic conductivity �Basal age � � � �Litter quality � � �Peat depth � � �Decomposition rate � � � �Peat description � � �
Driving variablesWater table M/A D/M M H H HTemperature M/A M/D M/A D/M H H H HRainfall M/A M/D M/A D/M H H H HRain days D D D DCloudiness M/A D D HEvaporation M/A M/D M/A H H H HPaleo climate K �

Clark et al.: Model inter-comparison for GB blanket peat
carbon fluxes suggest this site is currently a net sink forC (69.5 g C m–2 yr–1, 2007–2008) (Dinsmore et al. 2010).More details on this site can be found in Billett et al.(2004) and Dinsmore & Billett (2008).
2.1.2. Moor House, North Pennines
Moor House National Nature Reserve is located inthe North Pennines, England (54.70° N, 2.39° W). Thesite has been monitored since 1992 by the Environ-mental Change Network (ECN). Data include continu-ous AWS and water table. The Cottage Hill Sike catch-ment is a 20 ha subcatchment of Trout Beck, coveredalmost entirely by blanket peat over an altitudinalrange of 540 to 562 m. Peat depth is estimated to be2.4 m on average (Heinemeyer et al. 2010), although adepth range of 0.4 to 5.0 m has been noted across thereserve (Heal & Smith 1978). Vegetation is dominatedby Calluna vulgaris, Eriophorum vaginatum and Sphag-num spp. The typical pH of surface peat is pH 3.6 to4.3 in H2O and pH 3.0 to 3.5 in CaCl2 (Adamson et al.2001). Mean annual rainfall is 1982 mm yr–1 (1931–2000) and mean annual temperature is 5.3°C (Holden& Adamson 2001). The water table is predominantly5 cm in depth, although drawdown to 45 cm has beenobserved during drought years (Evans et al. 1999). Acomplete C budget produced for Trout Beck showedthat the catchment was a small net sink of C, with aver-age net C accumulation of 56 g C m–2 yr–1 between1993 and 2005 (Worrall et al. 2009a). More site detailscan be found in Adamson et al. (1998, 2001).
2.1.3. Migneint, Conwy, North Wales
The Migneint is located in the headwaters of the riverConwy, North Wales (52.99° N, 3.80° W). Mean annualrainfall is approximately 2200 mm yr–1 and mean annualtemperature is 5.6°C; mean water table elevation in anundrained part of the catchment is ca. 9 cm. The top15 cm of the peat has a pH 3.9 in H2O. Mean peat depthmeasured within the 1 km2 monitoring catchment is1.2 m (M. Cooper pers. comm.). Vegetation is dominatedby Calluna vulgaris and Eriophorum vaginatum (Ellis &Tallis 2000). A full carbon budget for this has not yetbeen calculated, although long-term monitoring isunderway. More site details can be found in Evans etal. (2006) and Billett et al. (2010).
2.1.4. Bleaklow, South Pennines
Bleaklow is located in the southern Pennines(53.44° N, 1.86° W). Mean annual rainfall is 1554 mm
yr–1 (1961–2004) (Daniels et al. 2008) and mean annualtemperature is 7.1°C. Large parts of the site have beenheavily eroded, and are dissected by a number of gul-lies (Evans & Lindsay 2010a). Water table drawdown istypically within the top 30 cm of the peat, althoughdrawdown up to 80 cm has been noted close to thegully edge (Daniels et al. 2008). Peat depths rangefrom 1 to 4 m. Vegetation cover is principally Eriopho-rum vaginatum and Eriophorum augustifolium, Cal-luna vulgaris, Erica tetralix, Vaccinium myrtillus andEmpetrum nigrum, with patches of Sphagnum spp.(Daniels et al. 2008). Since 2006, the C budget at13 plots and 5 catchments has been monitored by Dur-ham University and the University of Manchester.These include a range of sites from ‘pristine’, restoredand eroded sites. Calculations based on peat growthrates (Tallis 1994) suggest that most pristine sites area net C sink with a mean rate of +20.3 g C m–2 yr–1
(Evans & Lindsay 2010b, this Special) with other esti-mates varying between +70 to +102 g C m–2 yr–1 (Bil-lett et al. 2010). The sites are described in more detailin Daniels et al. (2008).
2.2. Models
Static statistical and semi-process-based BCEMs andprocess-based DMs were used, each with differingstructure and data requirements, are described belowand in Table 2.
2.2.1. BCEMs (P50, P65, LM, H-GLM, BBOG, BBOG-TREE, BBOG-GLM, BBOG-GAM, PEATSTASH)
The 9 BCEMs used average climate data for precipi-tation, temperature and cloudiness to predict the pres-ence or absence of blanket peat (Clark et al. 2010, Gal-lego-Sala et al. 2010). Four models were publishedpreviously: P50 is a simple threshold model (i.e. whereblanket peat presence is predicted when the chosenclimate variable is above or below defined values)based on annual precipitation where blanket peat isfound in areas with annual precipitation >1250 mmyr–1 (Pearsall 1950); P65 is also a simple thresholdmodel where peat is found in areas where the annualpotential evaporation (PE) is less than a third of annualprecipitation (Pearsall 1965); LM is another simplethreshold model where blanket peat is found in areaswhere total annual precipitation is >1000 mm yr–1 andmean temperature of the warmest month is <15°C(Lindsay 1995); and H-GLM which is a logistic regres-sion model based on average temperature (Hossell etal. 2000). Four models were derived by Clark et al.(2010) from further statistical analysis: BBOG is a
231

Clim Res 45: 227–248, 2010
threshold-based model based on the sum of the annualaccumulated monthly water deficit (AAMWD; i.e. pre-cipitation – PE); BBOG-TREE is a regression treemodel using maximum temperature, the Thornthwaite-Mather moisture index (TMI) and AAMWD; BBOG-GLM is a logistic regression model using maximumtemperature and the TMI; BBOG-GAM is a gener-alised additive model based on minimum temperature,continentality (difference between maximum and min-imum temperature) and the TMI. One model, PEAT-STASH, was derived from a semi-process-based globalbioclimatic model (Sykes et al. 1996) that defines blan-ket peat presence or absence based on maximum tem-perature and a derived moisture index (Gallego-Sala etal. 2010). The BCEMs are described in more detail inClark et al. (2010) and Gallego-Sala et al. (2010).
The BECMs were originally calibrated to the currentmapped blanket peat area using average climate datafor 1961–1990 (Clark et al. 2010, Gallego-Sala et al.2010). The data were averaged over a 30 yr period tofactor out interannual variability. For the model analy-sis described in this paper, the BECMs were also runusing 30 yr mean monthly climate data to be consistentwith the input data used to calibrate the models.
2.2.2. Multi-pool dynamic simulation model (ECOSSE)
The ECOSSE model (Estimating Carbon in OrganicSoils Sequestration and Emission) calculates the net Cstorage within soils by calculating the net decay ofeach of the conceptual SOM pools (Smith et al. 2007,2010a,b) after an initial short-term soil C spin-upperiod using average climate and water table informa-tion as well as SOC stock data. The spin-up processruns the model using an assumed plant input until therate of change of SOC matches the observed value.The plant inputs are then adjusted according to theratio of simulated to measured SOC and the simulationis repeated until both the simulated SOC and the rateof change of SOC match the measured values. Thisapproach is consistent with the majority of SOC models(Smith 2001). The SOM pools are rapidly decomposingorganic matter, slow turnover organic matter and inertorganic matter. Inputs to the system are as resistantplant material and decomposable plant material. Car-bon cycling is based upon the Rothamsted Carbon(RothC) model, developed for mineral soils (Coleman& Jenkinson 1996), although ECOSSE has been devel-oped to also simulate anaerobic processes in organicsoils (Smith et al. 2007, 2010a).
Decomposition within each pool is described by firstorder kinetics where decompositions is dependenton the amount of material within that pool, and the de-composition rates are modified to account for changes
in temperature, moisture, pH and land management.Monthly climatic data were used to drive the model.Water table was used as a static input parameter ratherthan being simulated. Plant inputs were estimatedusing the spin up to match initial measured soil C asdescribed in Smith et al. (2010a). During the dynamicphase of the simulation, plant inputs were furtheradjusted according to climate using the Miami model(Leith & Box 1972), where NPP is calculated based onempirical relationships with mean annual temperatureand total precipitation.
ECOSSE calculates both the changes in the size of allC pools over time (i.e. changes in overall C stock) andthe fluxes of C in gaseous and aquatic form. In bothcases, the overall net C balance can be calculated fromeither the net change in the C stock or the balancebetween inputs and simulated fluxes. Output datawere provided on a monthly time step and were aggre-gated to 1, 10 and 30 yr periods for comparison withother model outputs.
2.2.3. Peat accumulation model (MILLENNIA)
MILLENNIA (i.e. considering millennia of peat accu-mulation and therefore no short-term equilibrium SOCspin up) uses either constant or variable past annualmean climate data over the entire period of peat devel-opment (i.e. in the UK context this is estimated to beapproximately 10 000 yr by Heinemeyer et al. (2010).The net C storage within the peat is estimated by mod-elling the net C balance within each soil layer or cohort(as opposed to pools), either accumulating or decom-posing peat based on the balance between NPP andoverall decomposition based on litter quality defineddecomposition rates. NPP is calculated empiricallyafter Leith & Box (1972), where the mass of dry matter(converted to C, assuming 50% of dry matter is C) isestimated from site actual evapotranspiration (AET).Litter decomposition rates are based on the initial litterquality fraction specific decay rates (i.e. lignin, holocel-lulose and soluble), which are then subject to internal(i.e. ligono-cellulose quotient and nitrogen-factor) andexternal (i.e. soil temperature, water table and oxygenavailability) factors that modify the decomposition rate.The model considers 8 plant functional types (PFTs;Sphagnum, other bryophytes, herbs, shrubs, trees,grasses, sedges and rushes) differing in litter qualityand root NPP C inputs. The NPP input of the PFTs isallowed to change over time, reflecting water tablechanges based on a simple hydrological model. First,the model was run annually for an initial 10 000 yr peataccumulation period (i.e. to grow peat depth corre-sponding to time since peat initiation) using a recre-ated past climate, then monthly climate data were used
232

Clark et al.: Model inter-comparison for GB blanket peat
as available to drive the model, calculating a dynamicwater table with respect to the balance between pre-cipitation, evapotranspiration and runoff.
Like ECOSSE, MILLENNIA then calculates bothannual changes in overall C stock over time and thebalance between inputs and C fluxes via gaseous [CO2
and methane (CH4)] and aquatic (total organic carbonin runoff) fluxes (Heinemeyer et al. 2010). Output datawere provided on an annual time step and were aggre-gated to 1, 10 and 30 yr periods for comparison withother model outputs.
2.2.4. Dynamic flux model (Durham Carbon Model)
The Durham Carbon Model calculates the net car-bon balance by calculating the main flux pathways:input via gross primary production (GPP) and outputvia gaseous (CO2 and CH4) and aquatic fluxes (dis-solved CO2, DOC and particulate organic carbon[POC]) (Worrall et al. 2009b). All flux estimates werebased on empirical relationships between precipitationand/or water table elevation. Water table fluctuationswithin the model are determined from the balancebetween precipitation and evapotranspiration from thepeat profile developed for the Moor House catchment(Worrall & Burt 2005). Monthly climate data averagedover a 10 yr period were used to drive the model.
The Durham Carbon Model was initially developedto understand the impact of management (e.g. burn-ing, grazing, land drainage, etc.) on peat C fluxes overmedium-term (i.e. 10 yr) time periods. It estimates thenet C balance only, from the balance between GPP andC fluxes, and does not report changes in the C stock.Output data were provided as an average annual valueover a 10 yr period, and were aggregated in to 30 yrperiods for comparison.
2.3. Climate data
2.3.1. Observed data (Met Office/UKCP)
To provide a long-term, consistent climate data setfor each field site, time series for key climatic variables(Table 2) were extracted for each location from the MetOffice/UKCP 5 km gridded data sets (www.metoffice.gov.uk). The gridded data were produced by inte-grating long-term meteorological measurements usinginterpolation and multiple regression models based onlocation (easting and northing), terrain elevation, openwater and urban land use (Perry & Hollis 2005). Totalmonthly precipitation, maximum and minimum tem-perature, and sunshine hours from 1940 to 2005 wereused. Gridded data from 2006 onwards were not avail-
able. Mean daily temperature was determined as theaverage of maximum and minimum temperature (Allenet al. 1998). Sunshine hours were converted to percent-age cloud cover for daylight hours. The converted day-light cloud cover data (1940–2005) were then correctedrelative to the measured cloud cover data (1961–2000)by applying a factorial change determined from theperiod where the 2 data sets overlapped.
2.3.2. Projected data (11-member RCM data ensemble)
Monthly transient modelled and projected climatedata (1950–2100) were obtained from the 11-memberRCM ensemble (HadRM3-PPE-UK) and run for theA1B (medium) emissions scenario only. Data wereobtained from the British Atmospheric Data Centre(BADC; http://badc.nerc.ac.uk/home/index.html). Dailyprecipitation, maximum and minimum temperatureand cloud cover were extracted for each 25 km gridcell overlying each field site and then aggregated tomonthly values.
2.3.3. Correction of output statistics from MetOffice/UKCP and 11-member RCM data
Measured meteorological data for Moor House andConwy for periods that overlapped with the MetOffice/UKCP gridded climate data (i.e. 2005 andearlier) were used to correct for biases in the monthlyprecipitation and temperature data due to long-termsystematic differences between these data series. Fac-torial changes (i.e. percentage multiplier) were deter-mined from the gridded data and observed data forprecipitation and cloud cover changes, whereasdifferences (i.e. fixed values) in the temperature datawere identified. For Auchencorth Moss and Bleaklow,measured meteorological data for the period 2007 and2008 were used. Therefore, correction of the griddeddata was performed relative to the corrected modelled11-member RCM data (described below) for the period1991–2005 using the same method used for Moor Houseand Conwy.
The 11-member RCM ensemble data were also cor-rected using similar factorial and difference methods formonthly precipitation and temperature data to accountfor systematic deviations between measured and mod-elled data series (correction of model output statistics[MOS]; Maraun et al. 2010). MOS correction factors/differences were determined using the mean value forthe 11-member RCM output rather than each individualmodel run, as this maintained the variation in outputbetween each of the ensemble members. For MoorHouse and Conwy, correction factors/differences were
233

Clim Res 45: 227–248, 2010
determined between the corrected gridded data and 11-member RCM mean between 1991 and 2005. As notedabove, for Bleaklow and Auchencorth Moss, correctionwas determined between the observed data and the 11-member RCM mean as observed data did not overlapwith the gridded data set. Comparison between thelong-term averages for 1961–1989 for the MetOffice/UKCP and 11-member RCM ensemble meanshowed that the MOS correction was effective at adjust-ing both data sets to represent a similar magnitude oftemperature and precipitation conditions at each of thefield sites studied (Table 3).
2.3.4. Potential evaporation calculations
PE was estimated using the Priestley-Taylor model(Priestley & Taylor 1972). To determine whether thechoice of PE model significantly affected simulations,model outputs for Moor House were compared with 2other PE models: Hargreaves (Hargreaves et al. 1985,Allen et al. 1998) and Thornthwaite (Thornthwaite1948). These methods were chosen as they had mini-mal data requirements (temperature and cloud cover)which were available from the long-term data.Extraterrestrial and net radiation were estimated using
Julian day and the latitude of each site following meth-ods outlined in Allen et al. (1998). More physicallybased models like Penman-Monteith require addi-tional data, such as wind speed, that are often unavail-able. For climate change studies, previous work hasshown that temperature-based evaporation equationsprovide more reliable estimates of potential evapora-tion from GCM model output data as there is lessuncertainty with temperature than other climatic vari-ables like wind speed (Kay & Davies 2008).
2.4. Model comparison and data analysis
The model comparison procedure followed a similarprinciple to the method outlined in Smith et al. (1997).The aim of the comparison was to determine whethermodels were able to provide broadly consistent mea-sures of peat stability and not to compare the detailedshort-term processes represented. Hence, DM outputscompared were the magnitude of the net C balance(g C m–2 yr–1), the sign of the net C balance (1 for posi-tive and 0 for negative) and changes in overall C stock(kg C m–2). Relevant climate and parameter data weremade available to the modellers, who were then askedto use their own judgement to calibrate and para-
234
Table 3. Summary climate data. Correction of monthly gridded 5 km Met Office/UKCP gridded data (1940–2005) and 25 km11-member regional climate model (RCM) ensemble data (1950–2099), and projected future climate change from the 11-memberRCM ensemble. Annual mean values for the 11-member RCM ensemble are shown, with the range from minimum to maximumchange shown in brackets. Rain and cloud clover cover corrections were applied as factorial changes and temperature changeswere applied as differences to monthly data. AC: Auchencorth Moss; BK: Bleaklow; CW: Conwy; MH: Moor House. Note that for
rain, the units for Baseline climate data are in mm yr–1, while those for Projected change are in percent
Site Baseline climate 1960–1989 Projected climate changeGrid (raw) Grid (corr.) RCM (raw) RCM (corr.) RCM (corr.) 2040–2069 RCM (corr.) 2070–2099
Rain (mm yr–1)AC 1023 1046 726 998 +3.7% (–8.1 to +13.2%) +4.2% (–5.4 to +13.3%)MH 1283 1683 1523 1784 +0.3% (–15.4 to +19.8%) +0.9% (–13.9 to +22.4%)BK 1128 1359 1130 1303 +1.5% (–12.2 to +17.4%) +1.5% (–11.8 to +17.3%)CW 2565 2136 1742 2172 +2.1% (–13.5 to +20.9%) +1.8% (–14.1 to +23.9%)
Max. temperature (°C)AC 10.3 10.3 10.7 10.4 +2.6 (+1.6 to +3.2) +3.7 (+2.4 to +4.8)MH 6.78 7.89 8.97 8.03 +2.6 (+1.6 to +3.3) +3.8 (+2.7 to +4.9)BK 10.58 8.14 11.00 8.66 +2.7 (+1.7 to +3.4) +3.9 (+2.8 to +5.0)CW 9.61 9.16 9.61 9.37 +2.6 (+1.6 to +3.2) +3.7 (+2.7 to +4.7)
Min. temperature (°C)AC 3.40 3.11 4.18 3.16 +2.5 (+1.3 to +3.1) +3.5 (+2.1 to +4.5)MH 1.85 2.23 3.36 2.28 +2.5 (+1.3 to +3.2) +3.5 (+2.1 to +4.6)BK 4.59 3.34 4.45 3.44 +2.5 (+1.4 to +3.1) +3.6 (+2.2 to 4.6)CW 4.10 3.08 3.93 3.26 +2.4 (+1.3 to +3.2) +3.5 (+2.1 to +4.5)
Cloud cover (%)AC 72.3 – 60.8 72.9 –2.8 (–10.7 to +8.0) –2.0 (–8.0 to +8.7)MH 72.1 – 70.4 71.2 –3.0 (–15.4 to +19.8) +0.8 (–13.9 to +22.4)BK 70.1 – 63.4 70.3 –4.7 (–11.1 to +1.7) –3.4 (–8.9 to +3.0)CW 71.8 – 71.3 70.9 –3.3 (–2.7 to +7.7) –4.8 (–9.7 to +1.8)

Clark et al.: Model inter-comparison for GB blanket peat
meterise their models and to provide as many of theoutputs requested as possible. All models (DMs andBCEMs) were able to produce a binary output indi-cating net C balance over a 30-yr period; only 2 DMs(ECOSSE and MILLENNIA) could produce data forboth net C balance and overall change in C stock.
As noted above, BCEMs do not explicitly calculatethe C balance, they only predict the probability ofpresence or absence of blanket peat at a particularlocation based on the presence or absence of a climatecurrently associated with peat presence (Clark et al.2010, Gallego-Sala et al. 2010). To compare the outputsof the BCEMs with DMs, a number of assumptionsneed to be made about the implications of change inthe prediction of blanket peat presence or absence forpeat accumulation and, therefore, net C balance and Csource/sink status. If the mapped blanket peat areacan be assumed to represent areas of active peat for-mation or areas where peat can be sustained, the cali-brated BCEMs can also be assumed to show areas ofactive and sustained peat growth where there is a netaccumulation (or no net loss) of C, indicating the peatis a C sink. If climate projections show a change in thebioclimatic space such that blanket peat is predicted tobecome absent from an area over time, this suggeststhat peat accumulation will no longer occur as the cli-mate becomes unfavourable to support blanket peat-lands. Under unfavourable climatic conditions for peatformation or sustainability, we assume that there will bea net loss of C, such that areas become a net C source.
The exact 95% confidence intervals were calculatedusing the Student’s t-distribution. Data analysis wascarried out in Excel and R (version 2.7) (R DevelopmentCore Team 2008).
3. RESULTS
3.1. Trends in the observed and projected climate data
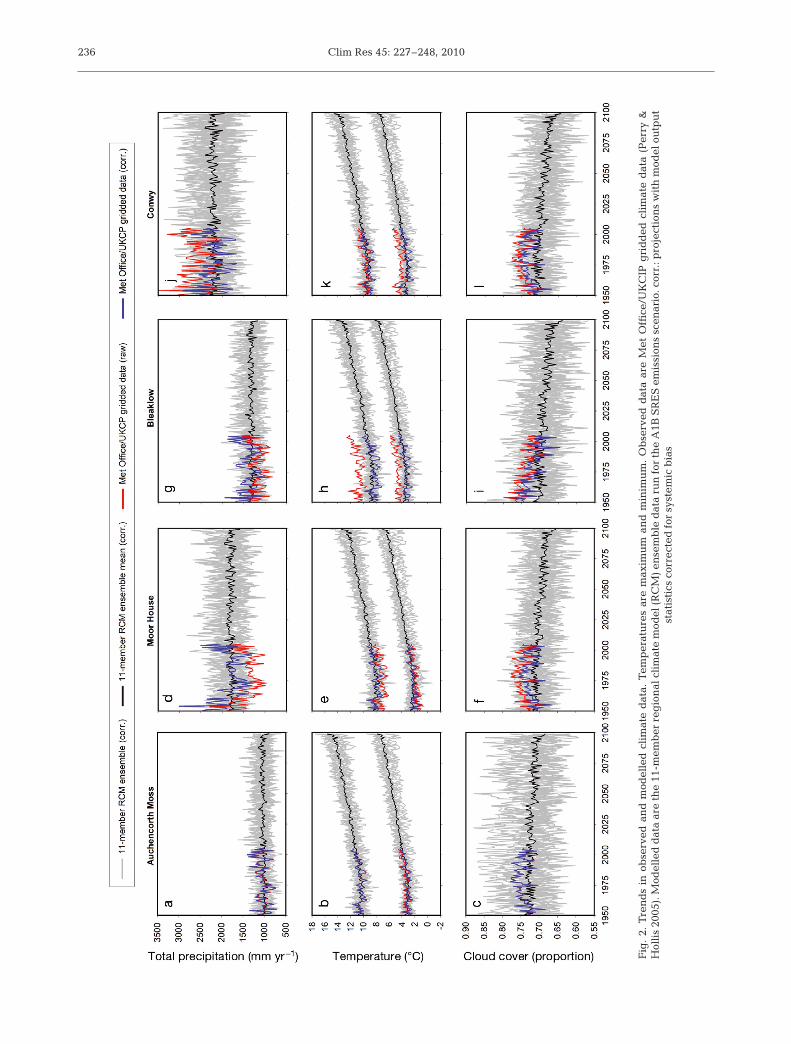
It is important to understand the underlying trends inclimate data as this will influence the DM and BCEMpredictions. All 4 sites are characterised by a cool andwet climate with mean monthly minimum tempera-tures of 2.2 to 3.3°C, mean monthly maximum temper-atures of 7.9 to 10.3°C and mean annual precipitationof 1046 to 2136 mm yr–1 from the corrected Met Office/UKCP gridded climate data for the baseline period(1960–1989) (Table 3). The corrected data providedsimilar results to published long-term average climate;however, some differences between the data pre-sented in Table 3 and data quoted above (see Section2) are likely to be due to differences in the time periodscovered.
The coolest to warmest sites are in the order MoorHouse < Conwy < Auchencorth Moss < Bleaklow interms of minimum temperature and Moor House <Bleaklow < Conwy < Auchencorth Moss in terms ofmaximum temperature for 1960–1989. Wettest to dri-est sites are in the order Conwy > Moor House > Bleak-low > Auchencorth Moss for the same period. Cloudcover is similar between sites, ranging from 70.1 to72.3% on average for the period 1960–1989 (Table 2),with considerable interannual variability (<60 to>85%; Fig. 2).
Total annual precipitation was highly variablebetween years in both observed and modelled data forboth recent observations and future projections (Fig.2). There was little apparent long-term trend in meantotal annual precipitation from 1950–2099, with only asmall increase averaged across all 11-member RCMmodels (+0.9 to +4.2% of 1960–1989 by 2070–2099;Table 3), with large variability between the outputs ofdifferent models (–14.1 to 23.9% of 1960–1989 by2070–2099; Table 3). It is important to note that long-term trends in the balance between summer andwinter precipitation have been reported, and bothUKCIP02 and UKCP09 projections suggest that thesetrends will continue over this century (Hulme et al.2002, Murphy et al. 2009). Projections for cloud covershow a slight decrease over time, although like precip-itation, there was considerable variability betweeneach model output with individual model runs showingboth an increase or decrease in cloud cover (–13.9 to22.4% for 1960–1989 by 2070–2099; Table 3). By con-trast, both projections for maximum and minimumtemperature show a steady increase of +2.6 to 2.7°C onaverage by 2040–2069 and +3.7 to 3.9°C on average by2070–2099 (Table 3). Therefore, temperature showedthe strongest long-term trend, followed by cloud cover;as temperature and cloud cover also influence PE esti-mates, changes in these variables could affect re-sponses driven directly by temperature and indirectlyby the net water balance.
3.2. Influence of climate data on model outputs
3.2.1. Influence of PE model
The Priestley-Taylor model for PE was primarilyused for this study. To determine whether the choice ofPE model influenced the output of the 2 DMs, MIL-LENNIA and ECOSSE, that used PE as a drivingvariable, differences in the net C balance from 1940to 1999 for Moor House determined using the Priest-ley-Taylor model were compared with estimates madeusing the Hargreaves and Thornthwaite models (Fig. 3).As the choice of PE models was explicit in the BCEMs,
235
Clim Res 45: 227–248, 2010236
Fig
. 2.
Tre
nd
s in
ob
serv
ed a
nd
mod
elle
d c
lim
ate
dat
a. T
emp
erat
ure
s ar
e m
axim
um
an
d m
inim
um
. O
bse
rved
dat
a ar
e M
et O
ffice
/UK
CIP
gri
dd
ed c
lim
ate
dat
a (P
erry
&
Hol
lis
2005
). M
odel
led
dat
a ar
e th
e 11
-mem
ber
reg
ion
al c
lim
ate
mod
el (
RC
M)
ense
mb
le d
ata
run
for
th
e A
1B S
RE
S e
mis
sion
s sc
enar
io. c
orr.
: pro
ject
ion
s w
ith
mod
el o
utp
ut
stat
isti
cs c
orre
cted
for
sys
tem
ic b
ias

Clark et al.: Model inter-comparison for GB blanket peat
the influence of the different PE models was not com-pared here. In general, the Priestley-Taylor model pro-vided lower PE estimates (mean of 379 mm yr–1) thanboth Hargreaves and Thornthwaite (mean of 461 and486 mm yr–1, respectively), using the raw Met Office/UKCP data (Table 4). The net C balance by MILLEN-NIA increased with PE estimated by the different mod-els and showed a very small decrease from ECOSSEestimates (Table 4). This implies that MILLENNIA ismore sensitive to changes in PE than ECOSSE, andthat the models differ in their response to changes inPE. Given the model structure, the small decrease innet C balance predicted by ECOSSE is due to a smallincrease in decomposition under drier conditions. Bycontrast, the increase in net C balance predicted byMILLENNIA is due to increased NPP and changes inPFT groups associated with the dynamic water table.
3.2.2. Influence of correction of Met Office/UKCPdata on dynamic and statistical model results
The Met Office/UKCP and 11-member RCM ensem-ble data were both corrected to account for systematicdifferences between the modelled and observed datafor each site. Comparison between the model predic-tions for the raw and corrected Met Office/UKCP datashows that corrections influenced the magnitude andsometimes sign of the net C balance (Table 5). Specifi-cally, MOS correction altered the estimated net C bal-ance for Moor House and Conwy for MILLENNIA andfor all sites except Moor House for ECOSSE, but hadless impact on the Durham Carbon Model (Table 5).
237
Table 4. Variation in potential evaporation (PE) and net Cbalance calculated using raw Met Office/UKCP data forMoor House using different PE models (1940–1999). Data are
averaged over 10 yr
Variable PE modelPriestley-Taylor Hargreaves Thornthwaite
PE (min yr–1)Mean 379 461 486SD (10 yr) 4 21 10SD (1 yr) 12 29 18
Net C balance (g m–2 yr–1)MILLENNIAMean 26.9 35.3 41.0SD (10 yr) 8.3 12.4 10.5SD (1 yr) 20.7 24.4 28.1
ECOSSEMean 8.6 7.6 7.5SD (10 yr) 16.1 17.8 11.8SD (1 yr) 88.6 90.5 91.2
Table 5. Mean net C balance (g C m–2 yr–1) over the baselineclimate period (1960–1989) between raw and corrected MetOffice/UKCP data. Data are mean and 95% confidence inter-
val, based on the data averaged over 10 yr period
Net C balanceRaw Bias-corrected
Auchencorth MossMILLENNIA 30.5 ± 0.7 29.6 ± 0.7ECOSSE 15.6 ± 13.5 22.5 ± 37.7Durham 136.5 ± 1.60 137.0 ± 5.70
Moor HouseMILLENNIA 21.8 ± 0.5 7.7 ± 0.2ECOSSE 3.5 ± 39.0 3.4 ± 64.7Durham 147.5 ± 1.20 141.8 ± 1.10
BleaklowMILLENNIA 32.7 ± 0.8 29.1 ± 0.7ECOSSE 7.6 ± 45.7 10.0 ± 59.7Durham 130.1 ± 0.40 137.3 ± 6.90
ConwyMILLENNIA –2.7 ± 0.1 12.1 ± 0.2ECOSSE –11.3 ± 61.1 4.2 ± 238.4Durham 127.3 ± 5.00 133.9 ± 0.20
Fig. 3. Relationships between annual net C balance (1940–1999) calculated using different potential evaporation modelsfor (a) MILLENNIA and (b) ECOSSE. Potential evaporationmodels used were Priestley-Taylor (PT; Priestley & Taylor1972), Hargreaves (H; Hargreaves 1985) and Thornthwaite
(Th, Thornthwaite & Mather 1955)

Clim Res 45: 227–248, 2010
The implications are that MILLENNIA and ECOSSEare more sensitive to differences in input climate datathan the Durham Carbon Model, although their actualsensitivity and response to climate variables differs(see Section 3.2.1.).
For the BCEMs, MOS correction had the greatestinfluence on predictions for Bleaklow, and to a lesserextent Auchencorth Moss, where correction increasedthe number of BCEMs predicting blanket peat pres-ence (Fig. 4). For both sites, the same BCEMs pre-dicted blanket peat absence: P50 and P65. Both theseBCEMs were based on thresholds of either total pre-cipitation or the ratio between total precipitation andPE (Pearsall 1950, 1965, Clark et al. 2010) (Tables S1and S2 in the Supplement, available at www.int-res.com/articles/suppl/c045p227_supp.pdf).
3.3. Estimated blanket peat C budget andprobability of blanket peat presence from observed
climate data (1940–1999)
3.3.1. Relationship between DMs
For the observed historic period, the Durham Car-bon Model predicted the greatest C sink, with theleast variation between sites. ECOSSE showed thelowest net C balance (i.e. the smallest sink) with a netC source at Conway (Table 5, Fig. 5). ECOSSE wasalso the most sensitive model to climate drivers, show-ing the greatest interannual variability (Fig. 5).Although MILLENNIA showed less interannual vari-ability than ECOSSE and generally estimated agreater net C sink, model outputs between MILLEN-NIA and ECOSSE were more similar to each otherthan to the Durham Carbon Model (Fig. 5). Whenaveraged over a 30 yr period (Fig. 5), models gener-ally showed a decline in the net C balance (i.e. less Ctaken up or more C emitted) from 1940–1969 to1970–1999. Specifically, MILLENNIA predicted adecline for all sites (–20 to –61%) and ECOSSE pre-dicted a decline for all sites (–30 to –125%) exceptAuchencorth Moss, where the net C sink increased(+178%) because of increased plant inputs over theperiod. The Durham Carbon Model predicted a smalldecline for Bleaklow and Conwy (–0.6 and –0.5%,respectively) and a small increase for Moor Houseand Auchencorth Moss (0.1 and 0.4%, respectively).MILLENNIA and ECOSSE both predicted that Conwyand Moor House were closer to the threshold betweennet C sink or source than Auchencorth Moss andBleaklow, whereas the Durham Carbon Model pre-dicted little difference between sites with a net C sinkan order of magnitude greater than the other models(>100 g C m–2 yr–1; Table 5).
3.3.2. Relationship between modelled and measuredestimates of net C balance
Modelled estimates of net C balance were comparedwith measured estimates of net C balance for Auchen-corth Moss and Moor House, as these sites were theonly locations where data were available before 2005(the year when Met Office/UKCP data ends). ForAuchencorth Moss, year-on-year estimates of the aver-age net C balance vary from –8.3 g C m–2 yr–1 for theperiod 1996–1998 (Billett et al. 2004) to +69.5 g C m–2
yr–1 for the period 2007–2008 (Dinsmore et al. 2010).These values reflect significant interannual variability,which are largely caused by differences in net ecosys-tem exchange. Over an extended period, however, thesite would appear to be acting as a C sink; this is con-sistent with the model predictions (Table 6). In addi-tion, both the 1996–1998 and 2007–2008 measuredestimates were within the range of values estimated byboth ECOSSE and MILLENNIA but were an order ofmagnitude lower than the Durham Carbon Model pre-dicted. Moor House has a longer record of monitoringdata, with an estimated net C balance of 56 g C m–2
yr–1 between 1993 and 2005 (Worrall et al. 2009a). Thisvalue is greater than the long-term average C sinkpredicted by ECOSSE and MILLENNIA. Furthermore,other net C balance estimates based on longer-term Cpeat accumulation rates indicate values of approxi-mately 25 g C m–2 yr–1 (Garnett 1998), very close to theECOSSE and MILLENNIA predictions (Tables 6 & 7).Although comparison between measured and modelleddata shows some discrepancies and variability betweenyears, values predicted by ECOSSE and MILLENNIAare a similar order of magnitude and within a realisticrange of plausible values.
238
Table 6. Comparison between measured and modelled net Cbalance (g C m–2 yr–1) (range in parentheses) using correctedMet Office/UKIP gridded data for years where measured dataare available before 2005. Measured C balance has been de-termined from previous flux measurements (Billett et al. 2004,Worrall et al. 2009a, Billett et al. 2010, this Special, Dinsmoreet al. 2010). A negative sign indicates a net source of C fromthe peat and a positive sign indicates a net sink of C to the peat
Net C balanceAuchencorth Moss Moor House
(1996–1998) (1993–2005)
Measured –8.3 +56 (+20 to +90)
ModelledMILLENNIA +33.5 (–1.3 to +56.1) +17.2 (–22.0 to +125)ECOSSE +19.0 (–97.0 to +82.5) +18.7 (–22.0 to +125)Durham +134a +77aOutputs from the Durham Carbon Model are averagedover the period 1990–1999

Clark et al.: Model inter-comparison for GB blanket peat
3.3.3. Relationship between dynamic and statisticalmodels
For the historical period, the semi-process-basedBCEM PEATSTASH provided similar predictions tothe statistical BCEMs (Fig. 4), consistent with findingsat the national scale (Gallego-Sala et al. 2010). Al-though most DMs predicted sites to be a net C sink andmost BCEMs predicted blanket peat presence, theDMs and BCEMs differed in terms of sites whichappeared to be closer to the net C source/sink or blan-ket peat presence/absence threshold. BCEMs sug-gested that Auchencorth Moss and Bleaklow weremore vulnerable in terms of a potential shift from pres-ence to absence (Fig. 4), whereas the DMs suggestedthat Moor House and Conwy were closer to shift fromnet C sink to source (Fig. 5).
3.4. Estimated blanket peat C budget andprobability of blanket peat presence from predicted
future climate data (1950–2099)
3.4.1. Relationship between net C balance estimatedfrom Met Office data and from the 11-member RCM
ensemble data for baseline period (1960–1989)
Differences exist between the net C balance pre-dicted by the 3 DMs from the different climate datasources over the baseline period 1960–1989 (Tables 5& 7). The mean net C balance for both MILLENNIAand ECOSSE for the corrected Met Office/UKCP data(Table 5) is within the range of values predicted usingthe 11-member RCM ensemble data for the same timeperiod (Table 7). By contrast, the net C balance for theDurham Carbon Model for the corrected Met Office
data (Table 5) were greater than the range of val-ues estimated from the 11-member RCM ensemble(Table 7). As with the Met Office/UKCP data, the meanvalues for the 11-member RCM climate data forECOSSE and MILLENNIA were more similar to eachother than to the Durham Carbon Model. During thisperiod, all models estimate all sites to be a net C sink,with the exception of Conwy, which ECOSSE pre-dicted to be either a net sink or source across the 11-member RCM climate projections.
3.4.2. Long-term trends in net C balance and C sinkstrength predicted by DMs
In general, ECOSSE predicted a decrease in the netC balance over time at all 4 sites with a correspondingshift from net C sink to source; the Durham CarbonModel predicted a general decrease in net C sinkalthough all sites remain a net C sink (except Conwy);and, in contrast, MILLENNIA predicted a gradual andsometimes small increase in net C sink (Table 7,Fig. 6). ECOSSE showed the greatest variation in mag-nitude and sign of the net C balance, with the greatestvariability between each model run seen at Conwy,followed by Moor House, and the least variability atBleaklow (Fig. 6).
The variability between each of the 11-memberRCM model runs and trends in the predicted net C bal-ance for ECOSSE and MILLENNIA were also seen inthe C ‘sink strength’ (i.e. where the magnitude ofchange in the C flux is compared with the size of the Cpool within the model) (Fig. 7). However, only Conwyand some predicted output from Moor House showed areduction in net C storage to values less than the initialvalues in 1950. Although the rate of C sequestration
239
Table 7. Net C balance (g C m–2 yr–1) predicted by the dynamic models between 1960–1989, 2040–2069 and 2070–2099 using the corrected 11-member RCM ensemble data
Field site Model 1960–1989 2040–2069 2070–2099Mean Range Mean Range Mean Range
Auchencorth Moss MILLENNIA 31.6 24.6–36.3 31.0 26.3–35.7 32.5 27.2–37.3ECOSSE 19.8 13.0–35.3 12.1 –1.99–26.9 –0.26 –10–13.4Durham 88.4 86.6–90.4 81.3 75.7–86.0 76.4 71.2–83.0
Moor House MILLENNIA 27.4 5.8–38.3 31.3 15.8–37.5 34.5 13.3–39.4ECOSSE 32.2 18.0–60.0 –11.7 –26.7–13.8 –24.1 –44.1– –4.3Durham 84.2 82.0–89.5 77.8 73.6–85.4 72.1 68.8–82.2
Bleaklow MILLENNIA 36.5 28.7–41.9 35.8 30.5–40.6 38.4 29.1–45.6ECOSSE 21.3 13.9–33.6 8.3 0.2–25.5 –2.8 –12.9 – 6.8Durham 85.6 83.0–90.4 78.3 75.1–84.0 72.3 69.3–80.6
Conwy MILLENNIA 22.1 8.5–42.5 26.9 17.7–44.6 29.6 21.4–42.3ECOSSE 15.4 –14.1–56.7 –52.0 –120.5–12.9 –79.2 –131.4–39.9Durham 78.4 45.0–85.4 67.2 –0.1–81.6 58.6 –42.5–77.4

Clim Res 45: 227–248, 2010
declined at both Bleaklow and Auchencorth Moss, thesink strength in both cases was >1, and so ECOSSEstill predicted an overall net increase in the peatland Csink over the 150 yr period at these sites (Fig. 7). Incontrast to the other 2 models, MILLENNIA showed asteady increase in sink strength over this time period,in response to the gradual increase in net C balance(Table 7).
3.4.3. Relationship between dynamic and statisticalmodels under future climate projections
When considered together, the DM outputs show adecline in the number of models predicting a net Csink towards the end of this century, with a minimumof 1–2 out of the 3 models predicting a net C sink by2070–2099 (Fig. 8). The shift from net C sink to source
240
Fig. 4. Number of dynamic models (DMs) predicting a net C sink and number of bioclimatic envelope models (BCEMs) predictingclimate associated with blanket peat presence for the raw and corrected Met Office/UKCIP gridded data. Black circles indicate
years where PEATSTASH predicts probability of blanket peat presence

Clark et al.: Model inter-comparison for GB blanket peat 241
Fig. 5. Magnitude of the net annual C balance predicted by each of the dynamic models and averaged over 1, 10 and 30 yr periods using corrected gridded Met Office/UKCP data. NB: 1 yr outputs for Durham Carbon Model were not available

Clim Res 45: 227–248, 2010242
Fig. 6. Long-term trends in the net annual C balance predicted by the dynamic models, averaged over 30 yr periods between 1950 and 2099 using the corrected projections from the 11-member RCM ensemble data
Fig. 7. Change in the net C sink strength over 30 yr periods for MILLENNIA and ECOSSE. Sink strength was calculated as the ra-tio between C stock during 1950–1979 and future time periods. Increasing sink strength shows a net C accumulation relative to1950–1979 and decreasing sink strength shows net C depletion relative to 1950–1979. The Durham Carbon Model was not
included as changes in total C stocks were not reported by this model

Clark et al.: Model inter-comparison for GB blanket peat
was mainly predicted by ECOSSE and the DurhamCarbon Model in one instance for Conwy (Fig. 6,Table S3). As noted before (Fig. 4), the DMs predictConwy and Moor House to be the most vulnerableblanket peat sites in terms of a reduction or reversalof the C sink by the end of this century (Figs. 6 & 8).Like the DMs, the BCEMs (including PEATSTASH)
also show the potential for increased vulnerability ofblanket peat under projected future climate change,as the climate space associated with blanket peatpresence declines over time with a minimum of0–2 BCEMs covering the sites by 2070–2099 (TableS3 in the supplement at www.int-res.com/articles/suppl/c045p227_supp.pdf).
243
Fig. 8. Number of dynamic models predicting a net C sink and number of bioclimatic envelope models predicting climate associ-ated with blanket peat presence for the corrected 11-member RCM ensemble data. Minimum, mean and maximum outputs forthe 11 different simulations are shown. White circles show years where PEATSTASH predicts blanket peat presence in at least
1 of the 11 RCM climate projections

Clim Res 45: 227–248, 2010
4. DISCUSSION
The DMs estimate all sites to be a net C sink duringthe baseline period (1960–1989) from the corrected MetOffice/UKCP data. The size of the current C sink esti-mated by ECOSSE and MILLENNIA (+3.4 to +29.6 g Cm–2 yr–1 across all sites for 1960–1989; Table 5), is closeto the ‘typical’ long-term net accumulation rate ofnorthern peatlands of approximately 20 g C m–2 yr–1
(Gorham 1991, Vitt et al. 2000). By contrast, the Dur-ham Carbon Model predicted a significantly greater netC sink (133.9 to 141.8 g C m–2 yr–1 across all sites for1960–1989; Table 5), with less variation between sitesand years than predicted by the other DMs. Comparedwith measured C fluxes over shorter time periods at 2of the actual sites studied, Auchencorth Moss and MoorHouse (Table 6), the observed results were within therange of those modelled by ECOSSE and MILLENNIA;however, these ranges were quite large and variedfrom sink to source. There were considerable differ-ences between the modelled climate output of the 11-member RCM ensemble, particularly with regard toprecipitation, and this is partly why the range in themodelled C flux is so large. Furthermore, there weresignificant differences in the way models represent in-terannual variability and responses to key climatic dri-vers. Interannual variation in net C accumulation ischaracteristically large in peatlands, in spite of steadylonger-term rates of C accumulation (Belyea & Clymo2001). For instance, at Auchencorth Moss the measurednet C balance varied from net C source (–8.3 g C m–2
yr–1 for 1996–1998; Billett et al. 2004) to net C sink(+69.5 g C m–2 yr–1 for 2007–2008; Dinsmore et al. 2010)over ca. 10 yr. Therefore, to some extent, these modelsmay be realistic in capturing the magnitude of interan-nual variation. It is encouraging that ECOSSE and MIL-LENNIA reproduce reasonable estimates for the long-term net C balance over 30 yr periods.
Differences between DM increases under future cli-mate can be explained by differences in model struc-ture. ECOSSE predicted an overall decline in magni-tude of the net C balance, with many sites shiftingfrom net sink to source, whereas MILLENNIA pre-dicted an increase in net C sink at all sites over time.The Durham Carbon Model showed the least varia-bility over time and between sites. Decompositionrates in all models responds to changes in temperatureand water table; however, the sensitivity to thesechanges differed inherently between models. MIL-LENNIA appeared to be more sensitive to changes inwater balance (specifically PE) whereas ECOSSE andthe Durham Carbon Model appeared more sensitive tochanges in temperature. Therefore, the decliningtrend in net C balance under future climate projectionspredicted by ECOSSE and the Durham Carbon Model
is likely to be due to increased decomposition rates rel-ative to the increase in plant productivity underwarmer temperatures. By contrast, the overall slightincrease in net C balance predicted by MILLENNIA islikely due to this model being the only one to also con-sider dynamic feedbacks between water table, PFTand associated changes in litter quality. These cause anegative rather than a positive feedback on decompo-sition, whilst temperature increased NPP through in-creased AET, therefore resulting in an overall increasein net C accumulation. A full assessment of DMsensitivity is needed to verify this relationship.
For the baseline period, the BCEMs predicted blan-ket peat presence consistent with DM predictions ofa net C sink. As the BCEMs were calibrated relativeto the baseline period (Clark et al. 2010, Gallego-Salaet al. 2010), this is unsurprising. As temperature andPE increased under future climate projections, BCEMsconsistently predicted increased absence of a climateassociated with blanket peat presence. The trend fora shift from predictions of blanket peat presence toabsence was broadly consistent with the pattern ofpredictions for shift from net C sink to source byECOSSE, although the timing and rate of change dif-fered between models. In particular, BCEMs predictedthe drier sites with the lowest total annual precipitation(Auchencorth Moss and Bleaklow) to be closer to thepresence/absence threshold, whereas ECOSSE pre-dicted the cooler and wetter sites (Moor House andConwy) to be closer to the threshold between net Csink/source. The Durham Carbon Model predictedsites to remain a net C sink, although the trajectory ofchange (i.e. decline in net C sink) was consistent withthe BCEM trends. As MILLENNIA predicted an overallslight increase in the future net C sink at all sites, theseprojections were inconsistent with the trajectory forchange predicted by the BCEMs.
As BCEMs were calibrated to the existing blanketpeat map, assuming all these peatlands are areas ofactive peat formation, they could be adjusted in futureto bring predictions of blanket peat presence/absencein line with areas of net C accumulation based oneither an improved national map based on field mea-surements or a national map based on modelled esti-mates of the net C balance produced by models likeECOSSE. However, further work would be requiredto examine how robust recalibrated models were interms of predicting response to projected changes inclimate. Previous model inter-comparisons betweenstatic BCEMs and process-based DMs for tree speciesin boreal and temperate regions found that BCEMstended to predict stronger extinction and greaterexpansion/colonization than process-based DMs be-cause more localised feedbacks and processes werenot included (Morin & Thuiller 2009).
244

Clark et al.: Model inter-comparison for GB blanket peat
Every model is a simplification and incomplete repre-sentation of the system, and it does not necessarily followthat the most complex models are the most accurate(Smith et al. 1997). It is commonly impossible to identifythe ‘best’ or most ‘representative’ model for all situations.The results here indicate that BCEMs, in some situations,can provide a broadly consistent indication of changethat is also predicted by some DMs. However, there maybe a more fundamental reason for differences betweenBCEMs and DMs. It is plausible that the climatic condi-tions needed for peat initiation are not the same as thosethat allow peat to grow once a peatland is established.Therefore, models defining the bioclimatic space wherepeat occurs do not necessarily capture the same climaticvariables that control the dynamics between primaryproduction and decomposition. If this is the case, then fu-ture model development may need to integrate bothBCEMs and DMs in order to effectively define the geo-graphic location for peat formation and associated accu-mulation rate. A similar principle is already used inglobal dynamic vegetation models (Prentice et al. 2007),which apply bioclimatic constraints on the potentialpresence of a PFT in addition to physiological calcula-tions that determine that plant type’s rates of assimila-tion, respiration and growth wherever it is present.
Perhaps the greatest variation in response was notbetween the structurally different BCEMs and DMs,but between the DMs themselves. The discrepancybetween DMs is large and has very different implica-tions in terms of a positive or negative feedback to theclimate system. Other studies have predicted either anet C source because of increased decomposition (e.g.Jones et al. 2005) or a net C sink because of increasedNPP relative to decomposition (e.g. Qian et al. 2010).Quantifying and modelling the balance betweenchanges in NPP and decomposition under a changingclimate is poorly understood and a key research prior-ity (Smith & Fang 2010).
Future development of C cycling models in blanketpeat will need to address key uncertainties includingthe availability of parameter data and the conceptualrepresentation of processes in models. It is well knownthat peatland plant species, vegetation productivity,peat decomposition and C fluxes are influenced bywater table elevation (Moore et al. 1998, Freeman et al.2001b, Strack et al. 2006, Clark et al. 2009). However,models do not always include a dynamic representa-tion of water table and the associated changes in veg-etation type and micro-topography (Belyea & Clymo2001, Belyea & Malmer 2004, Heinemeyer et al. 2010).These dynamic feedbacks can lead to an increase in netaccumulation and promote long-term stability of peataccumulation or persistence under changing climaticconditions (Belyea & Clymo 2001, Belyea & Malmer2004, Strack et al. 2006).
Conceptual representation of SOM pools is also a keydifference between models. ECOSSE has 5 SOM poolsfor the whole profile whereas MILLENNIA calculatesannual litter cohorts based on 7 different PFTs, resultingin 3 discrete SOM pools based on litter quality (i.e. lignin,holo-cellulose and soluble carbohydrates) that accumu-late in layers every year. By contrast, the Durham Car-bon Model has no explicit representation of SOM poolsize, as C fluxes are estimated from water table elevationand were initially designed to be determined over short-time periods to support management decisions. Giventhe semi-empirical nature of the Durham Carbon Model,variation between this model and the other DMs is morelikely due to the specific data used to calibrate the model.In general, decomposition rates based on the proportionof the total mass or C content present (i.e. as used inECOSSE) have been argued to be a robust method ofrepresenting the intrinsic process of net peat accumula-tion rather than considering average accumulation rateover a fixed time period (Clymo et al. 1998). The ability toparameterise models explicitly in terms of partitioningtotal C lost between different gaseous (i.e. CO2 and CH4)and aquatic (i.e. DOC, dissolved inorganic carbon andPOC) pathways is still uncertain as few data are avail-able. Integrated research between modellers and exper-imenters is urgently needed to address this crucial gap inknowledge.
DMs of blanket peatlands are in the early stages of de-velopment. Although many SOM models have been de-veloped (e.g. Smith et al. 1997), these have largely beenfor mineral soils where organic matter contents are typ-ically <10%, unsaturated conditions prevail and, conse-quently, temperature effects on decomposition are mostimportant. Model inter-comparison studies represent animportant part of model evaluation and development.Differences in predictions between specific models andfield data and between models themselves highlight theneed for further research to verify, develop and includekey process representation within these models (e.g. wa-ter table dynamics and the associated feedbacks) and toobtain relevant parameter and calibration data. Thesedifferences also highlight the need for caution when in-terpreting projections from any model. It is also im-portant to remember that the choice of GCM used togenerate climate projections can often be the greatestsource of uncertainty in climate change impact assess-ments (Arnell 1999, Graham et al. 2007, Kay et al. 2009).
5. CONCLUSIONS
Comparison between 3 DMs and 9 BCEMs at 4British peatland sites (Auchencorth Moss, Moor House,Bleaklow and Conwy) showed that stability of theseblanket peatlands is likely to be vulnerable to pro-
245

Clim Res 45: 227–248, 2010
jected increases in temperature and potential evapora-tion under future climate change. BCEMs consistentlyshowed a shift away from a climate currently associ-ated with blanket peat presence under future climateprojections, with the sites with the lowest total annualprecipitation expected to switch from predicted pres-ence to absence earlier than wetter sites. DMs had amore variable response, with ECOSSE predicting a de-cline in net C sink and shift to net C source by the endof this century; the Durham Carbon Model predicting asmaller decline in the net C sink strength but no con-sistent shift to net C source; and MILLENNIA, by con-trast, predicting a slight overall increase in the net Csink. Contrary to the BCEMs, the sites that were mostvulnerable to change using DM predictions were thecoolest sites with greatest total annual precipitation.
There was reasonable agreement between modelson the sign of net C balance (DMs) and prediction ofblanket peat presence (BCEMs) during the historicbaseline climate period (1960–1989). However, therewas considerable difference in both the sign and mag-nitude of change of the net C balance in the futurebetween the DMs. This is due to differences in modelstructure, in particular the differences in the sensitivityto changes in key climate variables. It is not clearwhich model is ‘correct’ as there are not enough ob-served data on past change with which to verify themodels. This limits our ability to judge whether BECMsare a suitable proxy for future change in peat C stocks
This model comparison indicates that British peat-lands are likely to be vulnerable to future climatechange, but shows that there is still considerableuncertainty regarding the magnitude and timing ofchanges in C stocks. Because of the large C stocks inpeatlands, climate feedbacks could be considerableand there are consequently clear implications for pol-icy makers and land managers with an interest in cli-mate change mitigation. Therefore, care needs to betaken with the interpretation of predictions from indi-vidual models. Simple bioclimatic models only informus whether the climate under which blanket peatsexist today persists into the future. No prediction aboutthe implications of ‘change’ for C stocks or otherecosystem properties is made, and no account is takenof inherent feedbacks within the system, particularlythe balance between primary production and decom-position. DMs are more complex and contain ecosys-tem processes. They can account for possible feed-backs but only for those included in their structures.Further research to develop and test the process repre-sentation within these models against field observa-tions, and more observational and experimental datato do this, will enable more robust predictions aboutthe stability of blanket peatlands under future climatechange.
Acknowledgements. This research was jointly funded by theEnvironment Agency (Science Project Sc070036) and theNERC QUEST research programme, including support forJ.M.C., A.V.G.S. and J.I.H.. J.M.C. was also supported by afellowship from the Grantham Institute for Climate Change,Imperial College; P.S. is a Royal Society-Wolfson ResearchMerit Award holder; F.W. was supported by NERC/FREEgrant NE/E002242/1; S.C.’s studentship was financed byNERC and model development was partly funded by theUKPopNet (NERC) initiative. The views expressed are thoseof the authors and do not necessarily represent the positionof the funding organisations. We thank the Met Office/UKCPfor use of their gridded climate data (www.metoffice.gov.uk/climatechange/science/monitoring/ukcp09/index.html);UK Met Office, Hadley Centre HadRM3-PPE-UK Model Data(http://badc.nerc.ac.uk/data/hadrm3-ppe-uk) for future cli-mate projections; and M. Cooper for data for the Conwycatchment. In particular, we thank the EA-QUEST Uplandsnetwork for their input in the development of this work atworkshops and throughout the duration of the project (http://quest.bris.ac.uk/research/wkg-gps/soil.html).
LITERATURE CITED
Adamson JK, Scott WA, Rowland AP (1998) The dynamics ofdissolved nitrogen in a blanket peat dominated catch-ment. Environ Pollut 99:69–77
Adamson JK, Scott WA, Rowland AP, Beard GR (2001) Ionicconcentrations in a blanket peat bog in northern Englandand correlations with deposition and climate variables.Eur J Soil Sci 52:69–79
Allen RG, Pereira LS, Raes D, Smith M (1998) Crop evapo-transpiration. Guidelines for computing crop waterrequirements. FAO Irrigation and Drainage Paper 56,FAO, Rome
Arnell NW (1999) The effect of climate change on hydrologi-cal regimes in Europe: a continental perspective. GlobalEnviron Change 9:5–23
Bellamy PH, Loveland PJ, Bradley RI, Lark RM, Kirk GJD(2005) Carbon losses from all soils across England andWales 1978-2003. Nature 437:245–248
Belyea LR, Clymo RS (2001) Feedback control of the rate ofpeat formation. Proc R Soc Lond B Biol Sci 268:1315–1321
Belyea LR, Malmer N (2004) Carbon sequestration in peat-land: patterns and mechanisms of response to climatechange. Global Change Biol 10:1043–1052
Billett MF, Palmer SM, Hope D, Deacon C, Storeton-West R,Hargreaves KJ, Flechard C, Fowler D (2004) Linkingland–atmosphere–stream carbon fluxes in a lowlandpeatland system. Global Biogeochem Cycles 18:GB1024doi:1010.1029/2003GB002058
Billett MF, Charman DJ, Clark JM, Evans CD and others(2010) Carbon balance of UK peatlands: current state ofknowledge and future research challenges. Clim Res 45:13–29
Clark JM, Ashley D, Wagner M, Chapman PJ, Lane SN,Evans CD, Heathwaite AL (2009) Increased temperaturesensitivity of net DOC production from ombrotrophic peatdue to water table draw-down. Global Change Biol 15:794–807
Clark JM, Gallego-Sala AV, Allott TEH, Chapman S and others(2010) Assessing the vulnerability of blanket peat to cli-mate change using an ensemble of statistical bioclimaticenvelope models. Clim Res 45:131–150
Clymo RS, Turunen J, Tolonen K (1998) Carbon accumulationin peatland. Oikos 81:368–388
246

Clark et al.: Model inter-comparison for GB blanket peat 247
Coleman K, Jenkinson DS (1996) RothC-26.3: a model for theturnover of carbon in soil. Springer-Verlag, Heidelberg
Daniels SM, Agnew CT, Allott TEH, Evans MG (2008) Watertable variability and runoff generation in an eroded peat-land, South Pennines, UK. J Hydrol 361:214–226
Dinsmore KJ, Billett MF (2008) Continuous measurement andmodeling of CO2 losses from a peatland stream duringstormflow events. Water Resour Res 44:W12417 doi:10.1029/2008WR007284
Dinsmore KJ, Billett MF, Skiba UM, Rees RM, Drewer J,Helfter C (2010) Role of the aquatic pathway in the carbonand greenhouse gas budgets of a peatland catchment.Global Change Biol 16:2750–2762
Drewer J, Lohila A, Aurela M, Laurila T and others (2010)Comparison of greenhouse gas fluxes and nitrogen bud-gets from an ombrotrophic bog in Scotland and a pristinemire in Finland. Eur J Soil Sci 61:640–650
Evans CD, Cooper DM, Juggins S, Jenkins A, Norris D (2006)A linked spatial and temporal model of the chemical andbiological status of a large, acid-sensitive river network.Sci Total Environ 365:167–185
Ellis CJ, Tallis JH (2000) Climatic control of blanket miredevelopment at Kentra Moss, north-west Scotland. J Ecol88:869–889
Evans MG, Burt TP, Holden J, Adamson JK (1999) Runoffgeneration and water table fluctuations in blanket peat:evidence from UK data spanning the dry summer of 1995.J Hydrol 221:141–160
Evans MG, Lindsay J (2010a) High resolution quantificationof gully erosion in upland peatlands at the landscapescale. Earth Surf Process Landf 35:876–886
Evans MG, Lindsay J (2010b) Impact of gully erosion on car-bon sequestration in blanket peatlands. Clim Res 45:31–41
Freeman C, Evans CD, Monteith DT, Reynolds B, Fenner N(2001a) Export of organic carbon from peat soils. Nature412:785
Freeman C, Ostle N, Kang H (2001b) An enzymic ‘latch’ on aglobal carbon store. Nature 409:149
Friedlingstein P, Cox P, Betts R, Bopp L and others (2006) Cli-mate-carbon cycle feedback analysis: results from the(CMIP)-M-4 model intercomparison. J Clim 19:3337–3353
Frolking S, Roulet NT, Moore TR, Richard PJH, Lavoie M,Muller SD (2001) Modeling northern peatland decomposi-tion and peat accumulation. Ecosystems 4:479–498
Fronzek S, Luoto M, Carter TR (2006) Potential effect of cli-mate change on the distribution of palsa mires in subarcticFennoscandia. Clim Res 32:1–12
Gallego-Sala AV, Clark JM, House JI, Orr HG and others(2010) Bioclimatic envelope model of climate changeimpacts on blanket peatland distribution in Great Britain.Clim Res 45:151–162
Garnett MH (1998) Carbon storage in a Pennine moorlandand response to change. PhD thesis, Department of Geo-graphy, University of Newcastle-Upon-Tyne
Gorham E (1991) Northern peatlands: role in the carbon cycleand probable responses to climatic warming. Ecol Appl1:182–195
Graham LP, Hagemann S, Jaun S, Beniston M (2007) Oninterpreting hydrological change from regional climatemodels. Clim Change 81:97–122
Hampe A (2004) Bioclimate envelope models: what they de-tect and what they hide. Global Ecol Biogeogr 13:469–471
Hargreaves GL, Hargreaves GH, Riley JP (1985) Irrigationwater requirements for Senegal River basin. J Irrig DrainEng 111:265–275
Heal OW, Smith RAH (1978) Introduction and site description.
In: Heal OW, Perkins DF (eds) Production ecology of Britishmoors and montane grasslands. Springer, Berlin, p 2–16
Heikkinen RK, Luoto M, Araujo MB, Virkkala R, Thuiller W,Sykes MT (2006) Methods and uncertainties in bioclimaticenvelope modelling under climate change. Prog PhysGeogr 30:751–777
Heinemeyer A, Croft S, Garnett MH, Gloor E, Holden J,Lomas MR, Ineson P (2010) The MILLENNIA peat cohortmodel: predicting past, present and future soil carbonbudgets and fluxes under changing climates in peatlands.Clim Res 45:207–226
Holden J, Adamson JK (2001) Gordon Manley: an uplandmeteorological pioneer. J Meteorol 26:369–374
Hossell JE, Briggs B, Hepburn IR (2000) Climate Change andUK Nature Conservation: a review of the impact of climatechange on UK species and habitat conservation policy.Department of the Environment,Transport and the Regions,London
House JI, Clark JM, Gallego-Sala AV, Orr HG and others(2010) Vulnerability of upland peatland services to climatechange. Environment Agency Science Report SC070036/SR Draft, Bristol
Hulme M, Jenkins GL, Lu X, Turnpenny JR and others (2002)climate change scenarios for the United Kingdom: theUKCIP02 Scientific Report. Tyndall Centre for ClimateChange Research, School of Environmental Sciences, Uni-versity of East Anglia, Norwich
Ise T, Dunn AL, Wofsy SC, Moorcroft PR (2008) High sensitiv-ity of peat decomposition to climate change throughwater-table feedback. Nat Geosci 1:763–766
Jones C, McConnell C, Coleman K, Cox P, Falloon P, Jenkin-son D, Powlson D (2005) Global climate change and soilcarbon stocks; predictions from two contrasting models forthe turnover of organic carbon in soil. Global Change Biol11:154–166
Kay AL, Davies HN (2008) Calculating potential evapora-tion from climate model data: A source of uncertaintyfor hydrological climate change impacts. J Hydrol 358:221–239
Kay AL, Davies HN, Bell VA, Jones RG (2009) Comparison ofuncertainty sources for climate change impacts: flood fre-quency in England. Clim Change 92:41–63
Leith H, Box E (1972) Evapotranspiration and primary pro-ductivity: Thornthwaite Memorial Model. Publ Climatol25:37–46
Limpens J, Berendse F, Blodau C, Canadell JG and others(2008) Peatlands and the carbon cycle: from local pro-cesses to global implications – a synthesis. Biogeosciences5:1475–1491
Lindsay RA (1995) Bogs: the ecology, classification and con-servation of ombrotrophic mires. Scottish Natural Her-itage, Battleby
Lindsay RA, Charman DJ, Everingham F, O’Reilly RM,Palmer MA, Rowell TA, Stroud DA (1988) The FlowCountry: the peatlands of Caighness and Sutherland.Nature Conservancy Council, Peterborough
Maraun D, Wetterhall F, Ireson AM, Chandler RE and others(2010) Precipitation downscaling under climate change.Recent developments to bridge the gap between dynami-cal models and the end user. Rev Geophys doi:10.1029/2009RG000314
Milne R, Brown TA (1997) Carbon in the vegetation and soilsof Great Britain. J Environ Manag 49:413–433
Monteith DT, Stoddard JL, Evans CD, de Wit HA and others(2007) Dissolved organic carbon trends resulting fromchanges in atmospheric deposition chemistry. Nature 450:537–540

Clim Res 45: 227–248, 2010
Moore TR, Roulet NT, Waddington JM (1998) Uncertaintyin predicting the effect of climatic change on the carboncycling of Canadian peatlands. Clim Change 40:229–245
Morin X, Thuiller W (2009) Comparing niche- and process-based models to reduce prediction uncertainty in speciesrange shifts under climate change. Ecology 90:1301–1313
Murphy J, Sexton D, Jenkins G, Boorman P and others (2009)UK Climate Projections science report: climate changeprojections. Met Office Hadley Centre, Exeter
Nakicenovic N, Alcamo J, Davis G, de Vries B and others(2000) Special Report on Emissions Scenarios: a SpecialReport of Working Group III of the IntergovernmentalPanel on Climate Change. Cambridge University Press,Cambridge
Pearsall WH (1950) Mountains and moorlands. Collins,London
Pearsall WH (1965) Mountains and moorlands. BloomsberryBooks, London
Perry M, Hollis D (2005) The generation of monthly griddeddatasets for a range of climatic variables over the UK. Int JClimatol 25:1041–1054
Prentice IC, Bondeau A, Cramer W, Harrison SP and others(2007) Dynamic global vegetation modelling: quantifyingterrestrial ecosystem responses to large-scale environ-mental change. In: Canadell JG, Pitelka L, Pataki D(eds) Terrestrial ecosystems in a changing world. Springer-Verlag, Berlin, p 175–192
Priestley CHB, Taylor RJ (1972) Assessment of surface heatflux and evaporation using large scale parameters. MonWeather Rev 100:81–92
Qian HF, Joseph R, Zeng N (2010) Enhanced terrestrial car-bon uptake in the northern high latitudes in the 21st cen-tury from the Coupled Carbon Cycle Climate Model Inter-comparison Project model projections. Global Change Biol16:641–656
Ramchunder SJ, Brown LE, Holden J (2009) Environmentaleffects of drainage, drain-blocking and prescribed vegeta-tion burning in UK upland peatlands. Prog Phys Geogr33:49–79
Randerson JT, Hoffman FM, Thornton PE, Mahowald NMand others (2009) Systematic assessment of terrestrial bio-geochemistry in coupled climate-carbon models. GlobChange Biol 15:2462–2484
R Development Core Team (2008) R: a language and environ-mnet for statistical computing. R Foundation for StatisticalComputing, Vienna
Smith P (2001) Soil organic matter modeling. In: Lal R (ed)Encyclopedia of soil science. Marcel Dekker, New York
Smith P, Fang C (2010) Carbon cycle: a warm response bysoils. Nature 464:499–500
Smith P, Smith JU, Powlson DS, McGill WB and others (1997)A comparison of the performance of nine soil organicmatter models using datasets from seven long-term ex-periments. Geoderma 81:153–225
Smith P, Smith J, Flynn H, Killham K and others (2007)ECOSSE: Estimating Carbon in Organic Soils Sequestra-tion and Emission. Scottish Exectuive, Edinburgh
Smith JU, Gottschalk P, Bellarby J, Chapman S and others(2010a) Estimating changes in Scottish soil carbon stocksusing ECOSSE. I. Model description and uncertainties.Clim Res 45:179–192
Smith JU, Gottschalk P, Bellarby J, Chapman S and others(2010b) Estimating changes in Scottish soil carbon stocksusing ECOSSE. II. Application. Clim Res 45:193–205
Strack M, Waddington JM, Rochefort L, Tuittila ES (2006)Response of vegetation and net ecosystem carbon dioxideexchange at different peatland microforms followingwater table drawdown. J Geophys Res 111:G02006
Sykes MT, Prentice IC, Cramer W (1996) A bioclimatic modelfor the potential distributions of north European treespecies under present and future climates. J Biogeogr 23:203–233
Tallis JH (1994) Pool-and-hummock patterning in a SouthernPennine blanket mire. II. The formation and erosion of thepool system. J Ecol 82:789–803
Thornthwaite CW (1948) An approach toward a rationalclassification of climate. Geogr Rev 38:55–94
Thornthwaite CW, Mather JR (1955) The water balance.Climatology 8:1–104
Vitt DH, Halsey LA, Bauer IE, Campbell C (2000) Spatial andtemporal trends in carbon storage of peatlands of con-tinental western Canada through the Holocene. Can JEarth Sci 37:683–693
Wieder RK, Vitt DH (2006) Boreal peatland ecosystems.Springer, Berlin
Worrall F, Burt T (2005) Predicting the future DOC flux fromupland peat catchments. J Hydrol (Amst) 300:126–139
Worrall F, Burt TP, Rowson JG, Warburton J, Adamson JK(2009a) The multi-annual carbon budget of a peat-coveredcatchment. Sci Total Environ 407:4084–4094
Worrall F, Evans MG, Bonn A, Reed MS, Chapman D, HoldenJ (2009b) Can carbon offsetting pay for upland ecologicalrestoration? Sci Total Environ 408:26–36
248
Submitted: August 24, 2010; Accepted: November 12, 2010 Proofs received from author(s): December 14, 2010