model construction for human motion classification...
TRANSCRIPT

MODEL CONSTRUCTION FOR HUMAN MOTION CLASSIFICATION USING INERTIAL SENSORS
Chieh Chien, James Yan Xu, Hua-I Chang, Xiaoxu Wu, Greg J. Pottie
University of California, Los Angeles
ABSTRACT
Many commercial products have appeared that claim to classify human motions using a single inertial sensor. While certain motions can sometimes be accurately classified in this manner, for many medically significant activities, performance is inadequate. In particular, there are challenges in customizing to the activities of interest for particular individuals, dealing with motions of the upper limbs, assessing quality of motions, and coping with members of the general public not following usage instructions precisely. We present a general model that takes these factors into account, and present our progress in building tracking systems and classifiers that can scale to large populations.
Index Terms— Motion classification, wireless health
1. INTRODUCTION Classification of human motions and the quality with which motions are performed is important in a broad range of applications, including health and wellness promotion, rehabilitative therapy, chronic disease management, post-operative recovery, and sports training. Camera-based systems have long been used in the entertainment industry for motion capture, but these are expensive and fixed in location [1]. The Kinect system, while inexpensive, suffers from the latter defect [2][3]. Also at the low end of the cost scale, research and commercial systems built around triaxial accelerometers (and sometimes also gyros and magnetometers) have been developed [4]. These typically attach at one location on the body, and then attempt to distinguish among activity classes such as running, walking and inactivity, possibly counting steps and estimating calorie consumption. A variety of problems arise in attempting to use such systems out of the box. Commercial systems are typically trained to deal with people without significant disabilities to motion, and are easily confused when presented with impairments. Likewise, completely misleading results are easily generated when devices are not attached to the correct limb (and sometimes even when they are). Even if successful in classifying gross activity differences, variations in how activities are performed are found both within populations and even for the same
individual as she progresses in therapy. Thus models must be tuned to individuals for many applications. The objective of our research is to create an end-to-end low-cost system based on commercially available sensors that can provide reliable inferences when deployed in the general population, given it is expensive to obtain ground truth at a large scale and unrealistic to expect strict compliance with operating instructions. We now review some relevant related work.
The finest level of detail is to require motion reconstruction. In [1], a continuous-wavelet-transform based method was performed to analytically integrate accelerometer data to avoid integration drifts when integrating numerically. However, subjects in that study only performed motions slowly, and some reconstructed patterns are only recognizable rather then accurate. [6] used kinematic models combined with unscented Kalman filters to estimate orientations of human joints under slow and fast motions, in which only simple arm movements were evaluated.
The progress in motion classification relies on both the performance of new sensor fusion methods that provide inference, and the energy efficiency of energy-constrained monitoring sensors. Both of these objectives require advances in the capability of detecting and classifying the location and environmental context [7][8]. Context directly enables both enhanced motion classification accuracy and speed through reduction in search space, and reduced energy demand through context-aware optimization of sensor sampling and operation schedules. There have been attempts to introduce context awareness into activity monitoring [7][9][10] with limited success, due to the ambiguity in the definition of context, and the lack of a system architecture that enables the adaptation of signal processing and sensor fusion algorithms specific to the task of personalized activity monitoring. In this paper we present a novel end-to-end system that provides context guided personalized activity classification.
One of the main obstacles for the application of motion tracking and classifier is sensor misplacement. Two basic approaches are: (1) finding placement invariant features [11][12][13]; (2) using pre-defined calibration gestures [14]. Finding invariant features might miss some important information and is not applicable for motion tracking problems. Using pre-defined calibration gestures, on the

other hand, introduces difficulty in real-life medical applications. Patients can face both physical and cognitive barriers to consistently performing such activities with high quality. We propose a novel calibration process based on walking activities, which is easily available in people’s daily life.
In this paper, we present a general model that can exploit information at multiple levels: context, sensor pose estimation, activity classification, and motion trajectory, with interaction among these levels. Figure 1 shows the proposed model containing the whole system. While in principle one could train a single classifier to perform the diverse tasks, it would require excessive training data to produce reliable results. A modular approach demands more attention to the physical models underlying the different parts, but yields benefits of reduced computation and training sets. In this paper, we mainly focus on motion reconstruction (section 2), context-guided universal tree classifier (section 3) and sensor misplacement correction (section 4), and leave out discussion of tools required in data collection, storage, and synchronization. Section 5 presents our conclusions and suggestions for further research.
2. HUMAN MOTION TRACKING USING NON-LINEAR COMPLEMENYARY FILTERS
In this section, we discuss how to combine non-linear complementary filters and biomechanical models to track upper-body motion. 2.1. Definitions and Measurement Modeling From geometry we know every rotation matrix can be expressed as a orthogonal matrix, and every orientation can be written as a vector containing yaw, pitch and roll angles of the orientation. We define the operator such that
Figure 1. Overall classifier structure
where is a rotation matrix. We also define the operator
as the inverse of , therefore we have , where is an orientation vector.
For convenience we define the following frames of reference (coordinates)
{B} is aligned with the sensor coordinate, and we introduce {E} since we can only estimate the rotation between {B} and {A}. Therefore we define this virtual frame and try to approach {B}. Between these frames of reference, there exists a unique rotation matrix describing their relationship. For instance, let and represent the orientation relative to the body and Earth frames respectively, then describes the rotation from Earth to the body frame, and thus we have
We also define the noisy measurement of
accelerometers, gyros and magnetometers relative to the body frame as , and respectively. In this study, we define the relationship between the noisy and true measurements using where is the true value, is the constant bias of the measurement, and is the zero-mean additive white Gaussian noise. 2.2. Non-linear Complementary Filter with Bias Correction In this section, we show how to estimate the orientation of the sensor with respect to Earth frame of reference. This is denoted by representing the rotation from the estimator frame to Earth frame, which should be close to the true rotation .
We quantize the error of our estimation by using
R3! 3
v!R3
!
v! =0 "v3 v2v3 0 "v1"v2 v1 0
#
$
%%%
&
'
(((
v!vex ! vex v!( ) = v
v
A{ }: Earth frame of referenceB{ }: Body frame of referenceE{ }: Estimator frame of reference
RBv Av
vBA R
Av =BA RAv
B !a B !! B !m
!v = v + bv + nv
v bvnv
EA R̂
BA R
! = vex 1
2!RT " !R( )#
$%&'( )R3

where is the rotation error. When the estimator frame is equal to the body frame, we have thus .
To find the orientation of the sensor, we first use measurements from accelerometers and magnetometers from the sensor to estimate its orientation , which we call the static orientation.
(1)
where is the vector cross product. This estimation is called static since it is accurate when the object is still or moving slowly.
We then further improve the accuracy of our estimation using kinematics of a rigid body
where is the instantaneous angular velocity. By modifying the above equation and from [15][16][17], we define two types of filters.
Direct complementary filter with bias correction
(2)
Passive complementary filter with bias correction
(3)
where and are direct and passive estimates of the orientation from the estimator frame to Earth frame, and
are the estimated bias of gyros, and are positive gains. In [15] it can be showed that the and will converge to , which is the true value. 2.3. Upper Body Motion Decomposition After finding the orientations of sensors using non-linear complementary filters, we then use biomechanical models to
reconstruct upper limb human motions. In this paper, we assume that the human upper limbs motions are the combination of forearm and upper arm movements. We use a double pendulum model to model this problem. As shown in Figure 2, in this study we put sensors in the middle of the forearm and upper arm, where the plus direction of the -axis points outward from the human body.
We use a hierarchical model to describe positions of human joints, where parent joints are those closer to the center of the body, and child joints are those connecting to their parents and away from the center. In modeling the upper arm, the shoulder is considered the parent of the upper arm, and the upper arm is the parent of the forearm. We set the origin at the position of the shoulder, and let and
represent the estimated orientation from the estimator to the Earth frame of the upper arm and forearm respectively. We also assume and are the lengths of the upper arm and forearm. Since the sensor is placed which its
-axis points outward, ideally in the estimator frame we have the following relative vector
for the upper arm and forearm respectively. Then we can find the position of the elbow and the fist in the Earth frame by
(4)
By calculating and , we can then estimate upper limb trajectories in the Earth coordinates.
Figure 2. Position and orientation of sensor placement
!R =E
A R̂T !BA R
!R = I! = 0 0 0"# $%
T
EA R̂S
EA R̂S = B !a
B !a! B !m
B !m"
#$%
&'! B !a
B !aB !aB !a
! B !mB !m
B !aB !a
(
)
**
+
,
--
T
!
!!tR = R"# = R"( )# R
!
!!t E
AR̂D = EA R̂S B !" # b̂"
D( ) + kp EAR̂D$( )%EAR̂D
!!tb̂"D = #kI$
$ = vex 12!RT # !R( )&
'()*+
EAR̂D 0( ) = E
AR̂S0
b̂!D 0( ) = b̂! 0D
!R = EAR̂D( )T E
AR̂S
!!t E
AR̂P = EA R̂P
B !" # b̂"P( ) + kp EAR̂P$( )
%EAR̂P
!!tb̂"P = #kI$
$ = vex 12!RT # !R( )&
'()*+
EAR̂P 0( ) = E
AR̂S0
b̂!P 0( ) = b̂! 0P
!R = EAR̂P( )T E
AR̂S
EA R̂D
EA R̂D
b̂!D
b̂!P kp kI
EA R̂D
EA R̂D
BAR
y
EA R̂U
EA R̂F
L u( ) L f( )
y
EVU = 0 L u( ) 0!"
#$T
EVF = 0 L f( ) 0!"
#$T
APW APF
APW = EAR̂U EVU
APF = APW + EAR̂U EVF
APW APF

Figure 3. Error rate with different parameters of passive
complementary filters. The red dot marks minimum-error position
2.4. Filter Parameters Determination Since human limbs deform when twisting, they cannot be considered as ideal rigid bodies. Therefore, the above double pendulum model needs to be fixed. We remodel the problem into a supervised training procedure.
In our study, we first have the subject wear sensors in the upper arm and forearm, and then the subjects are asked to draw some simple training patterns with length . Later on, we apply the complementary filter and the biomechnical model to the collected data, and find out positions of the fist, and thus we can find the upper limb trajectory of the training pattern. We calculate estimation error by measuring the difference between and the lengths of reconstructed patterns. During the complementary filter computation, we apply different sets of as described in (2) and (3) to the filter and record the estimation error. The optimal set of
can be found where the total estimation error is minimized. In other word, we have
(5)
where is the vertex of the square.
It turns out that equation (5) is a nonconvex problem, and therefore we perform exhaustive search to find the optimal set. Figure 3 shows an instance of this problem, where the minimum error of 2.72% happens when
. We then apply this optimal set of parameters to the testing data. This completes the training process. 2.5. Experimental Results of Motion Tracking Experiments were conducted using a Sparkfun 9 degrees of freedom IMU chip [22], containing triaxial accelerometers, gyros, and magnetometers. We placed the sensors as shown in Figure 2. 12 subjects participated in the experiments. In the first experiments we asked subjects to draw three shapes on a wall: squares, circles and triangles. The length, height and diameters are 20 inches for squares, triangles and circles
Figure 4. Square reconstruction
Figure 5. Circle reconstruction
Figure 6. Triangle
reconstruction
Figure 7. Book reaching
respectively. Subjects were free to move and stretch their arms as long as their fists followed the pattern. Each shape took no more than 5 second to complete and was repeated for 10 times. Figure 4 to Figure 6 show the reconstructed trajectories using only accelerometers and magnetometers, and using direct and passive complementary filters. Table 1 shows average errors in estimating lengths for squares and triangles, and radius for circles using direct and passive complementary filters, and using direct integration. From the figures we can see the static model suffers from severe noise from the sensors, and from the table we can see the error increases dramatically without using filters. On the other hand, with the use of either the direct or passive complementary filter, the reconstructed patterns are very close to the ground truth, with very low error.
In the second experiment, we simulated reaching for and grasping books. In this experiment we portioned a 20’ by 20’ square hanging on a wall into a array. Then we tapped each point 10 times to simulate patients taking books off a shelf. Figure 7 shows the reconstructed result where black stars mark the ground truth, and average errors in distance to ground truth are shown in Table 1.
In summary, we had less than 7% error in the pattern plot experiment. In the book reaching experiment, we had 12% error, compared to 38% error using numerical integration. Compared to prior work [1] [6] the proposed method can track more complex and rapid arm movements. As a result, the use of complementary filters with a biomechanical model enables us to greatly reduce noise caused by sensors, and eliminate drifts due to numerical integration.
Table 1. Percentage of errors for experiments
Experiment Direct Passive Integration Square 6.14 5.04 33.39 Triangle 6.43 6.00 33.54 Circle 4.52 4.23 37.31 Book taking 13.01 12.05 38.86
00.5
11.5
2
00.5
11.5
20
5
10
15
20
kI
Error of Passive Filter
kp
Erro
r %
2
4
6
8
10
12
14
16
18
l
l
kI ,kp( )kI!,kp
!( )
kI!,kp
!( ) = argminkI ,kp( )"R,R( )>0
APF ,k+1 # APF ,k # lk=1
N#1
$
APF , j j th
kI!,kp
!( ) = 0.8,1.3( )
3 2 1 0 1
2
0
2
Static Models
East
Dow
n
3 2 1 0
2
0
2
Direct Filters
East
Dow
n
3 2 1 0
2
0
2
Passive Filters
East
Dow
n
3 2 1 0
1
0
1
2
Static Models
East
Dow
n
3 2 1 0 1
2
0
2
Direct Filters
East
Dow
n
3 2 1 0
2
0
2
Passive Filters
East
Dow
n
3 2 1 0
1
0
1
2
Static Models
East
Dow
n
3 2 1 0
1
0
12
Direct Filters
East
Dow
n
3 2 1 0 1
1
01
2
Passive Filters
East
Dow
n
3 2 1 0 1
2
0
2
Static Models
East
Dow
n
3 2 1 0 1
2
0
2
Direct Filters
East
Dow
n
3 2 1 0 1
2
0
2
Passive Filters
East
Dow
n
3! 3

3. CONTEXT GUIDED UNIVERSAL DECISION TREE CLASSIFIER
In this section, we present a model that classifies activities under different contexts. As shown in Figure 8, this model first selects contexts based on collected context and inertial sensor data, and then it determines the corresponding activity classifier, where each classifier is of the universal hybrid tree structure. 3.1. Universal Hybrid Decision Tree Classifier As in [18], a universal hybrid decision tree classifier is a classifier that may have different kinds of single-stage classifiers in its nodes, and can be adapted to new data from other subjects with little additional training. We achieve this by the following steps.
First, we propose a hybrid tree classifier with internodes, that is, there are single-stage classifiers in , and each with its subset of classes, features and the decision rules used for the node. Then we can write (6) where C is the subset of classes of node t, indicating how to group classes in that node; F is the feature set used for node t; and D is the decision rule of node t. in this study, we consider both the naïve Bayes classifier and support vector machine (SVM) at internal nodes. Compared to other tree classifier design where only one type of decision rule is used [19] [20], this hybrid decision tree classifier takes advantage of more appropriate statistical modeling of different activity classes and achieves higher classification accuracy.
After we have a hybrid tree classifier, we then tried to find a single tree that can classify multiple sets of test data from many subjects. The reason is that we want to have a universal model that can be personalized to subjects or sub-populations with minimal addition training. Since in supervised learning, the less marginal data we have to collect for training a model for additional subjects, the less (costly) logistical effort is required when applying this model to the general public. This universal hybrid decision tree maintains the tree structure, features used and decision rules on each node, and changes only the decision thresholds corresponding to different people. Therefore, we only need a small training set to find the threshold for each personalized
Figure 8. System diagram of context guided universal classifier
model. The detailed procedure of this universal model can be stated as follows: Begin
1. Given we have subjects with training data named , and we manually form hybrid decision tree where is tree with nodes can be written as
with internal nodes. The class subset is determined for every internal node. Let be part of the training data whose classes that are involved in node of the tree.
is the probability of error of node when applying feature set and decision rule on training data .
2. Randomly pick a tree with internal nodes 3. For to
Find the optimal set that minimizes the weighted probability of error
where is the weighting function for the subject , indicating the weighting of that type of people
to the general public
4. If
Terminate the for loop, go to step 1 and try the next tree , where is the predefined error threshold End if
End for 5. Output the tree classifier
(7) This algorithm takes the differences among people into account while maintaining a satisfactory error rate. 3.2. Integration of Contexts into Activity Monitoring
By refining the definition of context typically used in areas such as pervasive computing (that often entangles physical activities into the definition), we can use context as a high level separator to first determine a set of activities of interest under the user’s current situation before carrying out activity classification [21]. This context-driven approach brings a number of advantages compared to traditional activity monitoring: by pre-selecting the activities of interest (or likely activities), the model complexity of the subsequent activity classification stage is reduced, thus increasing the accuracy, improves classification throughput and enables sensor operating time and data sample/transmission optimization.
T ll T
T = C t( ),F t( ),D t( ){ } t = 1,!,l
M
TDi ,i = 1,!,M NTi l
Ti = C t( ),F t( ),D t( ){ }i = 1,!,N t = 1,!,l
l i( ) C t( )TDj ,t
TDjt
Pe j ,t F t( ),D t( )TDj ,t( )t F t( )
D t( ) TDj ,tT l
t = 1 lF! t( ),D! t( )( )
F! t( ),D! t( )( ) = arg minF t( ),D t( )( )
wjj=1
M" #Pe j ,t F t( ),D t( ),TDj ,t( )wj
j
wjj=1
M! "Pe j ,t F# t( ),D# t( ),TDj ,t( ) > therr
T therr
T ! = C t( ),F! t( ),D! t( ){ } t = 1,!,l
We performed a number of studies where context is defined as a subset of all attributes that characterizes an environment or situation, external to the user. This clearly distinguishes between attributes of external environment and of the user’s physical motion. For example, a "meeting" environment is a context, and its characteristics may involve certain sound profiles and a set of possible locations. "Sitting in a meeting" in contrast is not a context, as it contains the physical activity "sitting".
This definition of context can capture a large number of situations, so that users with different objectives can define their own useful sets, identify the required characteristics to distinguish the contexts, and select necessary sensors. This generalization increases classification difficulty, as the system must account for a diverse range of data sources such as GPS coordinates, wireless information, audio, and illumination level. In order to detect context based on a variety of data sources, multiple classifiers should be employed for different features and then combined using a committee approach (Figure 9). The individual classifiers are trained separately, and after training they are tested for individual classification accuracy. A voting weight (α) is determined for each classifier, proportional to the perceived accuracy. When an unknown class is encountered, the committee performs a linear combination of the individual classifiers, and the context with the highest vote is chosen.
The committee approach provides data fusion of sensors with various data types, and adapts to individuals with varying habits. For the former, it is easy to see that different classifiers can be selected to compose the committee, depending on inputs. For the latter, suppose a habitual individual exhibits strong correlation in time of day relating to context. The weight of a classifier based on time-of-day would be adjusted during training to become higher, compared to a subject that is irregular.
In most of our experiments, context detection committee is made up of three classifiers: k-nearest neighbors (kNN) with time-of-day as a feature; kNN with wireless MAC address and signal strength as features; and AdaBoost with audio peak frequency, peak energy, average power and total energy as features. Once a context is determined through the committee, a context specific activity model can be selected for activity classification. This is the concept of a context driven classifier, through which specifically optimized models can be used with each being focused on the activities of interest within a context. Unlike conventional activity monitoring, there is no single list of comprehensive activities that need to be built into a
Figure 9. Classifier committee
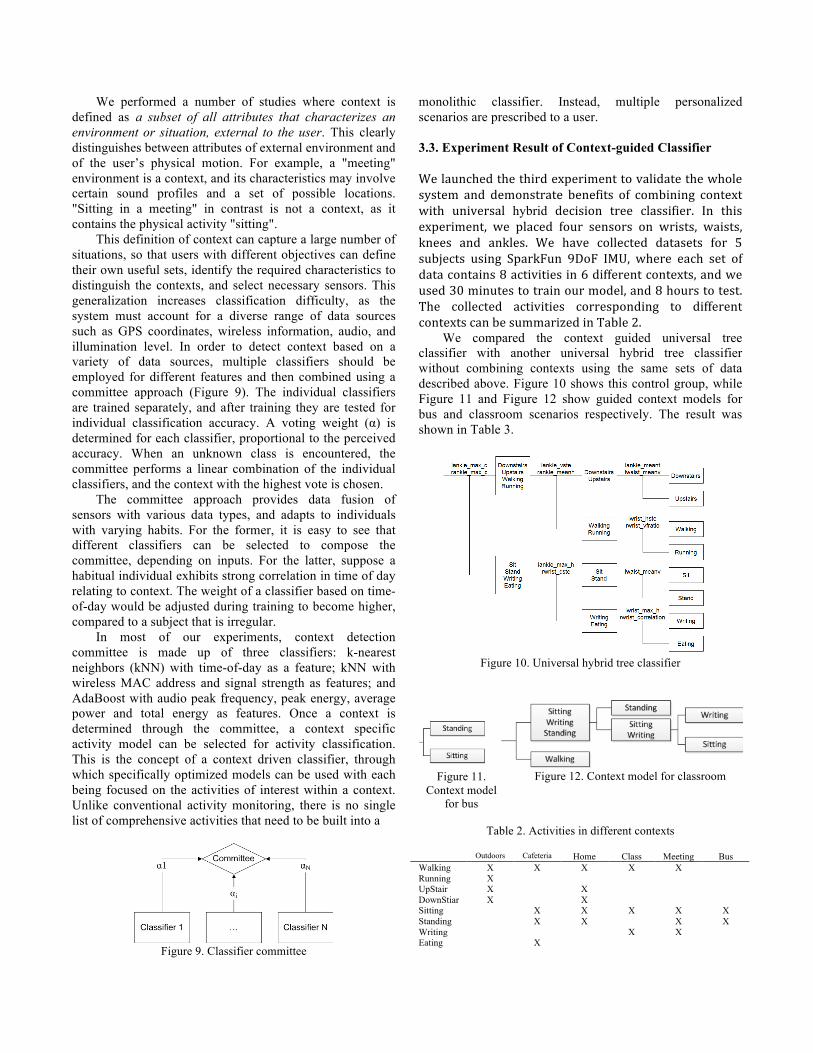
monolithic classifier. Instead, multiple personalized scenarios are prescribed to a user. 3.3. Experiment Result of Context-guided Classifier We launched the third experiment to validate the whole system and demonstrate benefits of combining context with universal hybrid decision tree classifier. In this experiment, we placed four sensors on wrists, waists, knees and ankles. We have collected datasets for 5 subjects using SparkFun 9DoF IMU, where each set of data contains 8 activities in 6 different contexts, and we used 30 minutes to train our model, and 8 hours to test. The collected activities corresponding to different contexts can be summarized in Table 2.
We compared the context guided universal tree classifier with another universal hybrid tree classifier without combining contexts using the same sets of data described above. Figure 10 shows this control group, while Figure 11 and Figure 12 show guided context models for bus and classroom scenarios respectively. The result was shown in Table 3.
Figure 10. Universal hybrid tree classifier
Figure 11.
Context model for bus
Figure 12. Context model for classroom
Table 2. Activities in different contexts
Outdoors Cafeteria Home Class Meeting Bus Walking X X X X X Running X UpStair X X DownStiar X X Sitting X X X X X Standing X X X X Writing X X Eating X

Through a series of experimental field evaluations, the critical benefits of this system were demonstrated. It was demonstrated that context guided classification has enabled a substantial advance in classification accuracy for many activities including upper body motion. This benefit will be exploited in the immediate future to enable substantial operating lifetime extension for critical applications.
4. SENSOR MISPLACEMENT CALIBRATION
BASED ON WALKING ACTIVITY
The general public and even medical professionals will often fail to precisely follow directions, including for consistent placement of sensors. Sensor misplacement within the same body part can be decomposed into three types as is shown in Figure 13: disorientation, rotational displacement and linear displacement. Here we focus on the first two types. 4.1. Rotation Matrix Model For sensor misorientation, the z axis signal is not distorted and the signal on the x and y axes can be represented by a rotation matrix in equation (8)
xy
!
"##
$
%&&= cos' (sin'
sin' cos'!
"#
$
%&
)x)y
!
"##
$
%&&
(8)
For sensor rotational displacement, assuming that we
can ignore the location difference for the misplaced sensor, the y axis signal is not distorted, and the signal distortion on the x and z axes can be represented by a rotation matrix in equation (9)
xz
!
"#
$
%& =
cos' (sin'sin' cos'
!
"#
$
%&
)x)z
!
"#
$
%& (9)
4.2. System Block Diagram Figure 14 shows the system block diagram of the signal recovery system. Both the training and testing data are divided into gait cycles. From those gait cycles, the best representatives are chosen based on the dynamic time wrapping (DTW) distance [23]. They are further passed to an MMSE estimator for the rotation angle. Multiplying the testing data with the rotational matrix, we can obtain the recovered signal data.
Figure 13. Sensor misplacement scenario
Figure 14. System diagram of signal recovery
Table 3. Context guided classification accuracy (in percentage unless otherwise stated)
Context Generic Specific Improve Context Generic Specific Improve Cafeteria
Standing Walking Eating Sitting
96.91 84.81 1 100
98.97 100 96.77 100
2 17 95.77 times 0
Meeting Sitting Walking Writing Standing
91.67 97.83 2.5 96.84
100 100 69.62 100
9 2 28.84 times 3
Outdoors Walking Running Upstairs Downstairs
99.29 95.79 90.47 97.30
99.29 95.79 90.47 97.30
0 0 0 0
Home Sitting Standing Walking Upstairs Downstairs
100 94.12 98.47 100 96.61
100 100 96.95 100 96.61
0 6 -1 0 0
Bus Sitting Standing
95.94 81.29
100 86.33
4 6
Class Walking Sitting Writing
98.56 87.33 3.66
100 71.04 79.41
1 -20 20.7 times
(a) Misorientation

4.3. Experiment Results of Sensor Misorientation
4.3.1 Sensor Misorientation During sensor misorientation, sensor signals on the z-axis are not distorted, while sensor signals on the x and y-axes are changed by a rotation matrix. Figure 15 and Figure 16 show the signal recovery results for accelerometer and gyro signals respectively. The match is excellent with ground truth. 4.3.2. Sensor Rotational Displacement We model the rotational displacement by a rotation on the x-z plane assuming the location difference can be ignored. Fig. Figure 17 and Figure 18 show the signal recovery results for accelerometer and gyro respectively. Accelerometer signals on the x-axis and gyroscope signals on the z-axis match the validation set very well. Accelerometer signals on the z-axis and gyroscope signals on the x-axis, however, still have room for improvement. The main reason is in MMSE estimation of the rotation angle, the total absolute error was minimized which has a bias against components with smaller amplitude.
Figure 15. Reconstruction of misoriented accelerometer signals
Figure 16. Reconstruction of misoriented gyro signals
4. CONCLUSION
As indicated in the preceding discussion, there are many possible uses for human motion classification, with different levels of granularity required for these uses. The path forward requires development of models that account for common impairments and variations to be expected in the target populations. This will sometimes only require a single sensor, but in other cases may require several. A modular model offers advantages in breaking the problems down into more manageable pieces, with signal processing that is optimized for the problem of interest. We have presented a subset of the components required for building a truly scalable and reliable low cost system for classifying human motions, and shown that interactions between some of them can lead to tangible benefits (e.g., correction of sensor location using decisions on activities such as walking, activity classifier simplification using context).
Many research challenges remain, including completing other elements of the system in Figure 1, optimizing the interaction between levels of the system, improving the various modules, and developing bounds to characterize the statistical optimality of the individual modules or sets of units. Challenges also exist in the realm of system interactions with both expert users and the general public so that logistical tasks are minimized in large-scale studies.
Figure 17. Reconstruction of displaced accelerometer signals
Figure 18. Reconstruction of displaced gyro signals
5. REFERENCES [1] Y. Zhu, M. Cox, and S. Lucey, “3D motion reconstruction for
realworld camera motion”, IEEE Conference on Computer Vision and Pattern Recognition, Providence, 2011, pp.1-8.
[2] K. Lai, J. Konard, and P. Ishwar, “A gesture-driven computer interface using Kinect” in 2012 IEEE Southwest Symposium on Image analysis and Interpretation (SSIAI), pp. 185-188.
[3] Belinda Lange, Chien-Yen Chang, Evan Suma, Bradley Newman, Albert Skip Rizzo and Mark Bolas, “Development and Evaluation of Low Cost Game-Based Balance Rehabilitation Tool Using the Microsoft Kinect Sensor” in Engineering in Medicine and Biology Society (EMBC), 2011 Annual International Conference of the IEEE, pp. 1831-1834.
[4] S. P. Tseng, W.-L. Li, C.-Y. Sheng, J.-W. Hsu, and C.-S.
Chen, “Motion and attitude estimation using inertial measurements with complementary filter,” in Proceedings of 2011 8th Asian Control Conference (ASCC) , pp. 863–868, May 2011.
[5] S. Suvorova, T. Vaithianathan, and T. Caelli, “Action
trajectory reconstruction from inertial sensor,” in The 11th International Conference on Information Science, Signal Processing and their applications, July 2012.
[6] M. El-Gohary, L. Holmstrom, J. Huisinga, E. King, J.
McNames, and F. Horak, “Upper limb joint angle tracking with inertial sensors,” in 33rd Annual International Conference of the IEEE EMBS, 2011.
[7] A. Schmidt, M. Beigl, and H. Hans-W. “There is more to
context than location.” in Computers and Graphics, vol. 23, pages 893-901, 1999.
[8] A. K. Dey. “Understanding and Using Context.” in Personal
and Ubiquitous Computing, vol. 5, pages 4-7, 2001. [9] Siewiorek, Daniel, et al. "Sensay: A context-aware mobile
phone." Proceedings of the 7th IEEE International Symposium on Wearable Computers. Vol. 248. 2003.
[10] K. Van Laerhoven, A. Schmidt, and H. W. Gellersen. “Multi-
sensor context aware clothing.” in Proceedings Sixth International Symposium on Wearable Computers, pages 49-56, 2002.
[11] Villamizar M., Sanfeliu A., Andrade-Cetto J. (2006)
“Orientation invariant features for multiclass object recognition.” Progress in Pattern Recognition, Image Analysis and Applications 4225: 655–664
[12] U. Steinhoff and B. Schiele., “Dead reckoning from the
pocket - An experimental study.” 2010 IEEE International Conference on. Pervasive Computing and Communications (PerCom), 162-170.
[13] K. Forster, P. Brem, D. Roggen, and G. Tr ¨ oster, “Evolving
discriminative features robust to sensor displacement for
activity recognition in body area sensor networks,” in Proc. 5th Int. Conf. on Intelligent Sensors, Sensor Networks and Information Processing (ISSNIP 2009). IEEE Press, 2009
[14] A. Friedman, N. H. Chehade, C. Chien, and G. Pottie,
“Estimation of accelerometer orientation for activity recognition”, in Engineering in Medicine and Biology Society (EMBS). 2012 Annual International Conference
[15] R. Mahony, T. Hamel, and J.-M. Pimlin, “Non-linear
complementary filters on the special orthogonal group,” IEEE Transactions on Automatic Control , vol. 53, pp. 1203–1217, May 2008.
[16] R. Mahony and T. Hamel, “Attitude estimation on SO(3)
based on direct inertial measurements,” in International Conference on Robotics and Automation, ICRA2006, 2006.
[17] R. Mahony, T. Hamel, and J.-M. Pimlin, “Complementary
filter design on the special orthogonal group SO(3),” in 44th IEEE Conference on Decision and Control, and the European Control Conference 2005, pp. 1477–1484, December 2005.
[18] C. Chien and G. J. Pottie, “A universal hybrid decision tree
classifier design for human activity classification,” in Engineering in Medicine and Biology Society (EMBC), 2012 Annual International Conference of the IEEE, August 2012.
[19] Breiman, L., J. Friedman, R. Olshen, and C. Stone.
Classification and Regression Trees. Boca Raton, FL: CRC Press, (1984).
[20] De’Ath, G. & Fabricius, K.E. (2000) Classi!cation and
regression trees: a powerful yet simple technique for ecological data analysis. Ecology, 81, 3178–3192.
[21] J. Y. Xu, Y. Sun, Z. Wang, W, J. Kaiser, and G. J. Pottie,
“Context Guided and Personalized Activity Classification System” in Proceedings of the 2nd Conference on Wireless Health Article No. 12, 2011
[22] Sparkfun Electronics, “9 degrees of freedom – razor imu” [23] Rabiner, L., & Juang, B. H. (1993). Fundamentals of speech
recognition.