model based analyses direct and indirect pk-pd modelling
TRANSCRIPT

Model Based Analyses Direct and Indirect PK-PD modelling Roger Gunn Imanova Ltd. and Imperial College, London
FP7 Neurophysics WORKSHOP 23-24 Jan 2012: Pharmacological fMRI
Warwick Conference Centre, University of Warwick, Coventry UK

Roger Gunn, 23/01/2012
Overview
• Introduction
• Direct PK/PD Modelling
• Indirect PK/PD Modelling
• Predicting Repeat Dose Response from Single Dose data

Roger Gunn, 23/01/2012
PK-PD Modelling
• Relating the blood concentration of the drug (PK) to the Pharmacodynamic Response (PD) – Characterize efficacy in terms of dose/pk conc – Safety/therapeutic index
• Examples of Imaging PD Measures
– PET Occupancy at a particular Target • Occupancy can often be related to efficacy
– fMRI measures of activation

Roger Gunn, 23/01/2012
PET Occupancy
• Occupancy studies measure occupancy of the target by the candidate drug
• Require the existence or development of a PET ligand (usually different from the candidate drug)
• Occupancy studies best performed just after or during FTIH
Binding Potential Map (mL/g) Baseline Scan After 4 mg risperidone
Roger Gunn, 23/01/2012
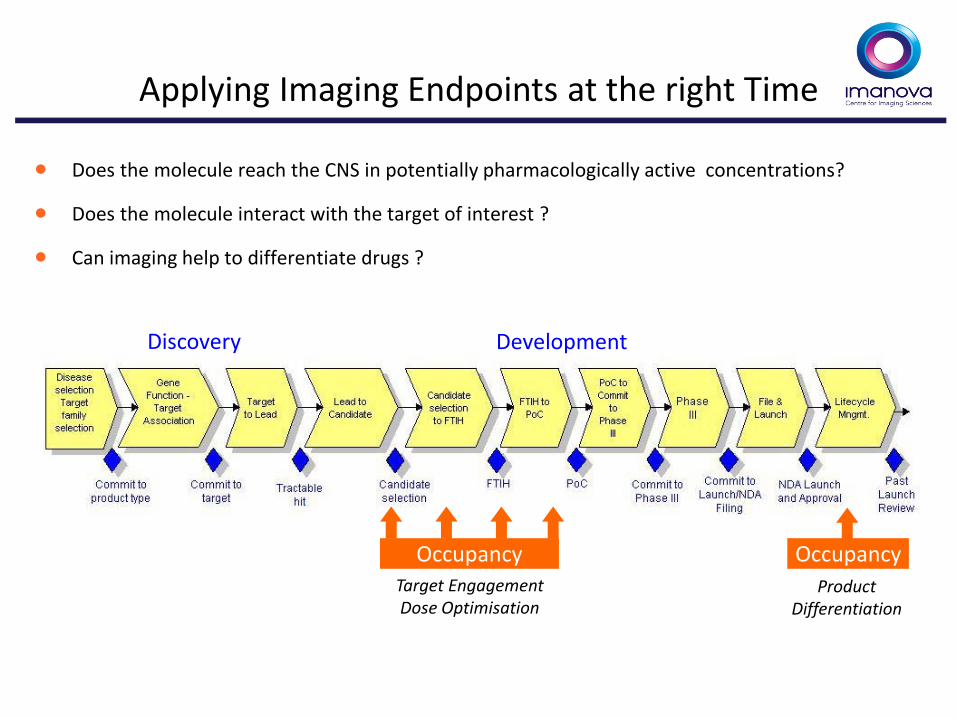
Applying Imaging Endpoints at the right Time
Occupancy
Discovery Development
Target Engagement Dose Optimisation
• Does the molecule reach the CNS in potentially pharmacologically active concentrations?
• Does the molecule interact with the target of interest ?
• Can imaging help to differentiate drugs ?
Occupancy Product
Differentiation

Roger Gunn, 23/01/2012
Characterizing the PK-RO Relationship
Plasma PK PET Occupancy PK/RO Model

Roger Gunn, 23/01/2012
Occupancy (Response)
Log [Plasma Conc]
Direct Model
𝑂𝑂𝑂 = 𝐶𝑃𝐶𝑃+𝐸𝐶50
Peripheral (PK)
Effect (PD)

Roger Gunn, 23/01/2012
Occupancy (Response)
Log [Plasma Conc]
Direct Model
𝑂𝑂𝑂 = 𝐶𝑃𝐶𝑃+𝐸𝐶50
EC50 (or ED50 )
100%
50%
Peripheral (PK)
Effect (PD)

Roger Gunn, 23/01/2012
Occupancy (Response)
Log [Plasma Conc]
Direct Model
𝑂𝑂𝑂 = 𝐶𝑃𝐶𝑃+𝐸𝐶50
EC50 (or ED50 )
100%
50%
𝑂𝑂𝑂 = 𝑂𝑂𝑂𝑚𝑚𝑚𝐶𝑃𝑁
𝐶𝑃𝑁+𝐸𝐶50𝑁
More General “Hill” Equation
Peripheral (PK)
Effect (PD)

Roger Gunn, 23/01/2012
Simple Single Dose Example
Occupancy Plasma PK Do
se
Dose
Time Time

Roger Gunn, 23/01/2012
Occupancy of GlyT1 antagonist
Baseline
Post-Dose
Co-registered Structural MRI T1
Direct Model Fit to Occupancy (PD) and Plasma Concentration (PK)
EC50 Gunn, Synapse, 2011
Roger Gunn, 23/01/2012
0
50
100
0 100 200 300 400 500 600 700 800
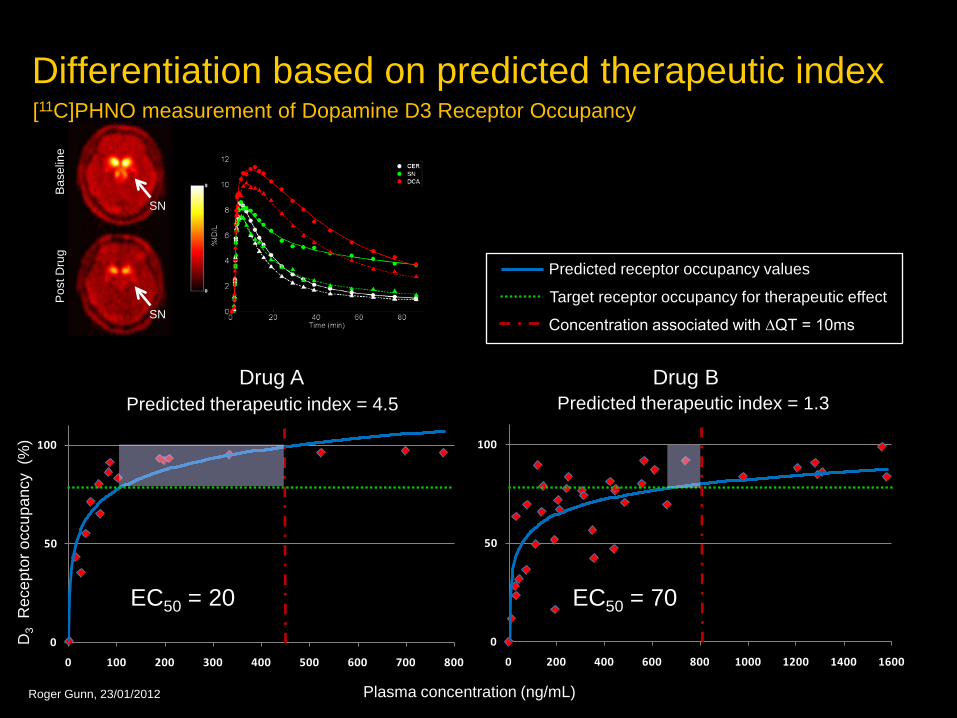
Differentiation based on predicted therapeutic index
Plasma concentration (ng/mL)
D3
Rec
epto
r occ
upan
cy (
%)
Drug A
0
50
100
0 200 400 600 800 1000 1200 1400 1600
Drug B
Concentration associated with ∆QT = 10ms
Predicted receptor occupancy values
Target receptor occupancy for therapeutic effect
Predicted therapeutic index = 4.5 Predicted therapeutic index = 1.3
SN
SN
Bas
elin
e P
ost D
rug
[11C]PHNO measurement of Dopamine D3 Receptor Occupancy
EC50 = 20 EC50 = 70

Roger Gunn, 23/01/2012
Optimal Design of these experiments
• Given a Model and Set of Parameters – OD Determines an optimum set of sampling points

Roger Gunn, 23/01/2012
Optimal Design: A Simple Example
• Emax Model: Dose-Occupancy Model – 1 parameter (ED50) – 1 data point: What dose should we sample at ?
( )50
50 EDDDEDDOcc
+=;

Roger Gunn, 23/01/2012
Optimal Design: A Simple Example
• Calculate Information Matrix from partial derivatives
( )( )25050
50
EDDD
EDEDDOcc
+−
=∂
∂ ;
( ) ( )( )450
2
50
50
50
50
EDDD
EDEDDOcc
EDEDDOccH
+=
∂∂
∂∂
=;;

Roger Gunn, 23/01/2012
Optimal Design: A Simple Example
•Maximize determinant (D-Optimal) over D
• In this simple case can differentiate and set=0 to find max,
{ }( )
{ } ( )
+= 4
50
2
EDDDHDet
DDmax)(max
( ) ( )( )550
502EDD
DEDDD
HDet+
−=
∂∂
50EDD =

Roger Gunn, 23/01/2012
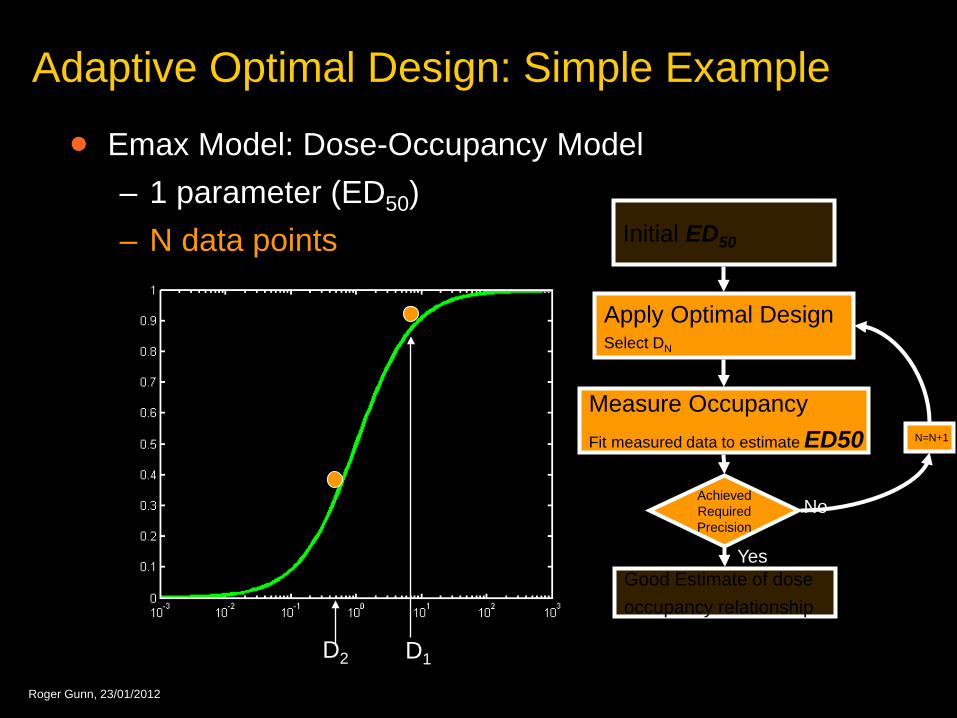
Adaptive Optimal Design: Simple Example
• Emax Model: Dose-Occupancy Model – 1 parameter (ED50) – N data points Initial ED50
Apply Optimal Design Select DN
Measure Occupancy Fit measured data to estimate ED50 N=N+1
Achieved Required Precision
Good Estimate of dose occupancy relationship
No
Yes
Initial ED50

Roger Gunn, 23/01/2012
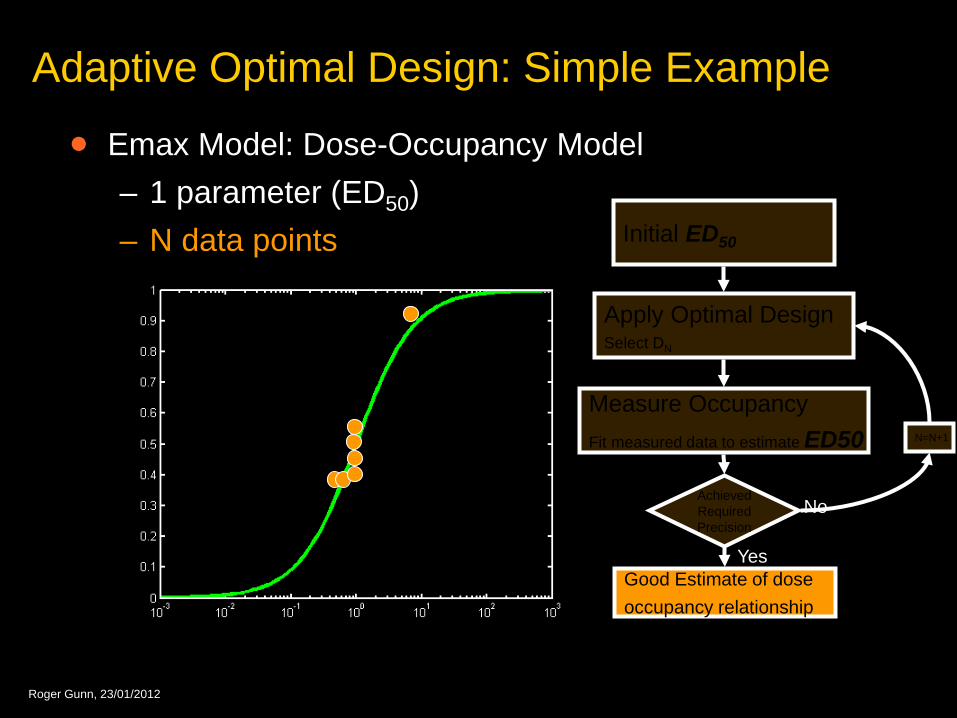
Adaptive Optimal Design: Simple Example
• Emax Model: Dose-Occupancy Model – 1 parameter (ED50) – N data points Initial ED50
Apply Optimal Design Select DN
Measure Occupancy Fit measured data to estimate ED50 N=N+1
Achieved Required Precision
Good Estimate of dose occupancy relationship
No
Yes
Initial ED50 (D1)
noise
Estimated ED50
Roger Gunn, 23/01/2012
Adaptive Optimal Design: Simple Example
• Emax Model: Dose-Occupancy Model – 1 parameter (ED50) – N data points Initial ED50
Apply Optimal Design Select DN
Measure Occupancy Fit measured data to estimate ED50 N=N+1
Achieved Required Precision
Good Estimate of dose occupancy relationship
No
Yes
D1 D2
Roger Gunn, 23/01/2012
Adaptive Optimal Design: Simple Example
• Emax Model: Dose-Occupancy Model – 1 parameter (ED50) – N data points Initial ED50
Apply Optimal Design Select DN
Measure Occupancy Fit measured data to estimate ED50 N=N+1
Achieved Required Precision
Good Estimate of dose occupancy relationship
No
Yes

Roger Gunn, 23/01/2012
Direct Model - Summary
Occupancy (or response) is determined by the instantaneous plasma concentration and the direct model parameters (EC50).
Occupancy (Response)
Log [Plasma Conc]
Can be sampled using Adaptive Optimal Experimental Design

Roger Gunn, 23/01/2012
Extended Single Dose Example Occupancy Plasma PK
Dose
Dose
Time Time

Roger Gunn, 23/01/2012
GSK1521498 µ-opioid PET receptor occupancy
Direct Model Fit
Rabiner, Mol Psych, 2011

Roger Gunn, 23/01/2012
Naltrexone µ-opioid PET receptor occupancy
Polynomial Interpolation
Rabiner, Mol Psych, 2011
Roger Gunn, 23/01/2012
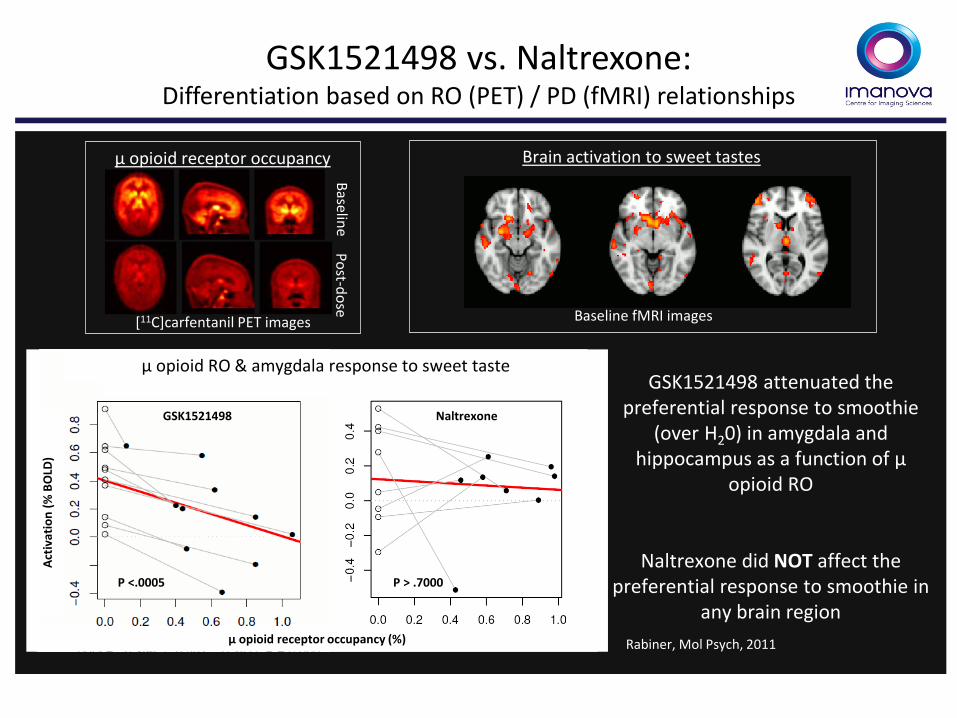
GSK1521498 vs. Naltrexone: Differentiation based on RO (PET) / PD (fMRI) relationships
Baseline Post-dose [11C]carfentanil PET images
µ opioid receptor occupancy Brain activation to sweet tastes Amygdala Hippocampus
Baseline fMRI images
P <.005
µ opioid receptor occupancy (%)
Activ
atio
n (%
BO
LD)
P <.0005
GSK1521498 Naltrexone
P > .7000
µ opioid RO & amygdala response to sweet taste GSK1521498 attenuated the
preferential response to smoothie (over H20) in amygdala and
hippocampus as a function of µ opioid RO
Naltrexone did NOT affect the preferential response to smoothie in
any brain region Rabiner, Mol Psych, 2011

Roger Gunn, 23/01/2012
Indirect Models
Peripheral (PK)
Central
Effect (PD)
Hysteresis effect or
Indirect effect or
delay effect or …
Conc
time

Roger Gunn, 23/01/2012
Indirect PK RO Models
CP CF Bocc
BAV K1
Plasma Tissue
Receptor
k2
kon
koff
Where are the slow kinetics ?

Roger Gunn, 23/01/2012
Indirect PK RO Models
Model I: BBB Limited Model Assumes brain concentration is described as a single exponential convolved with the plasma concentration and that the occupancy is instantaneously related in a EMax fashion to the brain concentration.
( ) ( )( ) γβ
β
+⊗⊗
= −
−
tP
tP
etCetCtTOC
CP CF Bocc
BAV K1
Plasma Tissue
Receptor
k2
kon
koff
Where are the slow kinetics ?

Roger Gunn, 23/01/2012
Indirect PK RO Models
Model II: kon-koff Limited Model Assumes receptor association and dissociation are finite.
CP CF Bocc
BAV K1
Plasma Tissue
Receptor
k2
kon
koff
( ) ROkRORCkdt
dROoffTPon ⋅−−⋅⋅=
Where are the slow kinetics ?

Roger Gunn, 23/01/2012
Indirect PK RO Models
Model I: BBB Limited Model Assumes brain concentration is described as a single exponential convolved with the plasma concentration and that the occupancy is instantaneously related in a EMax fashion to the brain concentration. Model II: kon-koff Limited Model Assumes receptor association and dissociation are finite.
CP CF Bocc
BAV K1
Plasma Tissue
Receptor
k2
kon
koff
( ) ROkRORCkdt
dROoffTPon ⋅−−⋅⋅=
Mathematically can have more complex systems with both effects
Where are the slow kinetics ?
( ) ( )( ) γβ
β
+⊗⊗
= −
−
tP
tP
etCetCtTOC
Roger Gunn, 23/01/2012
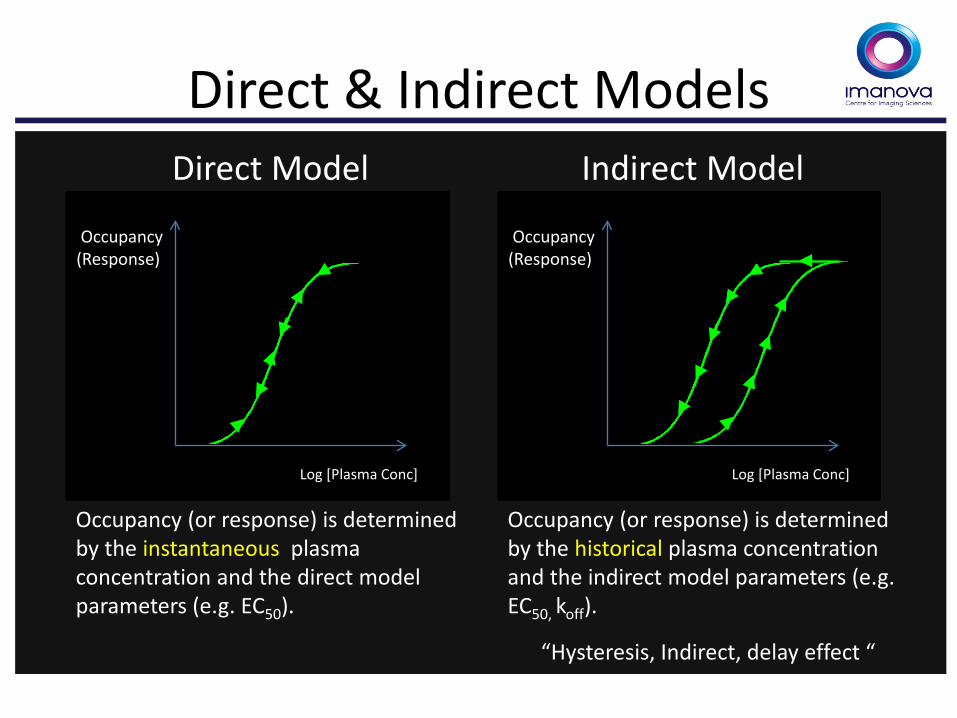
Direct & Indirect Models
Occupancy (or response) is determined by the instantaneous plasma concentration and the direct model parameters (e.g. EC50).
Occupancy (Response)
Log [Plasma Conc]
Occupancy (Response)
Log [Plasma Conc]
Occupancy (or response) is determined by the historical plasma concentration and the indirect model parameters (e.g. EC50, koff).
“Hysteresis, Indirect, delay effect “
Direct Model Indirect Model

Roger Gunn, 23/01/2012
Model Selection and Implications Direct Model Indirect Model
Dire
ct M
odel
In
dire
ct M
odel
True Model
Chosen Model
Model Parsimony Criteria used to Determine Best Model Balance of Goodness of Fit and Model Complexity

Roger Gunn, 23/01/2012
Model Selection and Implications Direct Model Indirect Model
Dire
ct M
odel
In
dire
ct M
odel
True Model
Chosen Model
Good DD
Decisions
Good DD
Decisions
Model Parsimony Criteria used to Determine Best Model Balance of Goodness of Fit and Model Complexity

Roger Gunn, 23/01/2012
Model Selection and Implications Direct Model Indirect Model
Dire
ct M
odel
In
dire
ct M
odel
True Model
Chosen Model
Good DD
Decisions
Good DD
Decisions
Poor DD
Decisions “Dose to Low”
Poor DD
Decisions “Increased variance”
Model Parsimony Criteria used to Determine Best Model Balance of Goodness of Fit and Model Complexity

Roger Gunn, 23/01/2012
Post Dose Scan 1
Baseline Scan
Post Dose Scan 2
Drug Candidate Dosing
[11C]Radioligand [11C]Radioligand [11C]Radioligand
• Dosimetry considerations typically limits the number of scans to 3 • Occupancy will vary as a function of time and dose • Example: 4 volunteers, scanned at 4 h and 7 d post MTD Mean Occupancy at 4 h post MTD : 44% Mean Occupancy at 7 d post MTD: 52% Target Occupancy: >75% Go or No Go?
Receptor Occupancy in Drug Development

Roger Gunn, 23/01/2012
Characterizing the PK-RO Relationship
Plasma PK PET Occupancy PK/RO Model
Dos
e
Time
Occ
upan
cy

Roger Gunn, 23/01/2012
Sin
gle
Dos
e (S
D)
PK
/RO
Mod
el
Plasma PK Occupancy (PET)
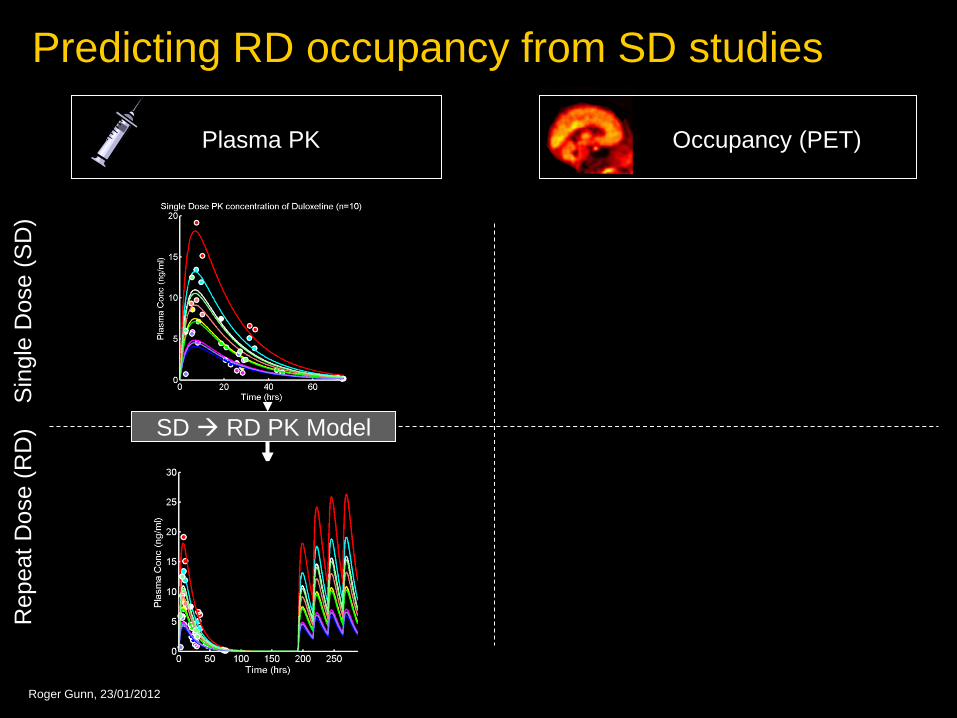
Predicting RD occupancy from SD studies

Roger Gunn, 23/01/2012
Sin
gle
Dos
e (S
D)
Rep
eat D
ose
(RD
) SD RD PK Model
PK
/RO
Mod
el
Plasma PK Occupancy (PET)
Predicting RD occupancy from SD studies

Roger Gunn, 23/01/2012
Sin
gle
Dos
e (S
D)
Rep
eat D
ose
(RD
)
Plasma PK Occupancy (PET)
SD RD PK Model
PK
/RO
Mod
el
Predicting RD occupancy from SD studies
Roger Gunn, 23/01/2012
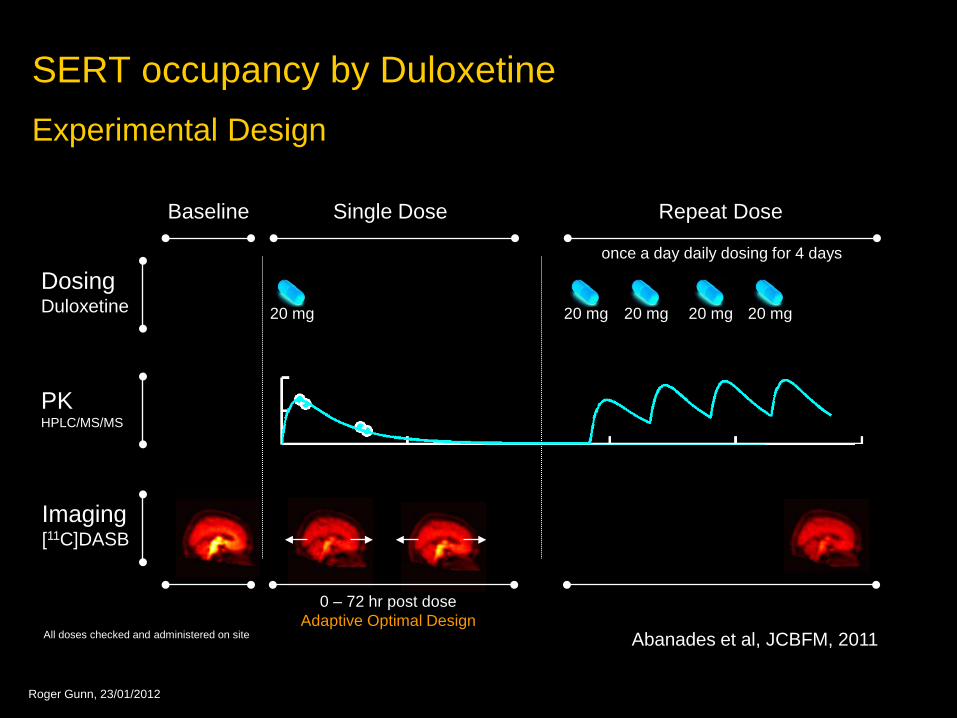
SERT occupancy by Duloxetine Experimental Design
Baseline Single Dose Repeat Dose
0 – 72 hr post dose Adaptive Optimal Design
once a day daily dosing for 4 days
20 mg 20 mg 20 mg 20 mg 20 mg
Imaging [11C]DASB
PK HPLC/MS/MS
Dosing Duloxetine
All doses checked and administered on site Abanades et al, JCBFM, 2011

Roger Gunn, 23/01/2012
Single Dose: PK/Occupancy Model
= f( ,p)
Occupancy Plasma PK D
ose
Dos
e
Time Time
Adaptive-Optimal Design • Measures
•Expensive •Technically sophisticated
• Optimal sampling critical to define Dose-Time Occupancy Surface
Established Methods • Measures
•Cheaper •Technically simpler
Optimize Sampling

Roger Gunn, 23/01/2012
Application of Adaptive Optimal Designs to estimate PK-RO Model Parameters
CP CF Bocc
BAV K1
Plasma Tissue
Receptor
k2
kon
koff
( ) ROkRORCkdt
dROoffTPon ⋅−−⋅⋅=
Indirect Model kon - koff Limited Model
Assumes receptor association and dissociation are finite
2 Parameters

Roger Gunn, 23/01/2012
Baseline
SD @ 6 hrs
SD @ 26 hrs
RD
Imag
ing
Dat
a SERT occupancy by Duloxetine Adaptive Design
1 2 3 4
5 6 7
8 9 10
Tim
e po
st S
D (h
rs)

Roger Gunn, 23/01/2012
Sin
gle
Dos
e (S
D)
Rep
eat D
ose
(RD
)
Plasma PK Occupancy (PET)
SD RD PK Model
PK
/RO
Mod
el
Predicting RD occupancy from SD studies
Roger Gunn, 23/01/2012
Sin
gle
Dos
e (S
D)
Rep
eat D
ose
(RD
)
Plasma PK Occupancy (PET)
SD RD PK Model
Predicting RD occupancy from SD studies
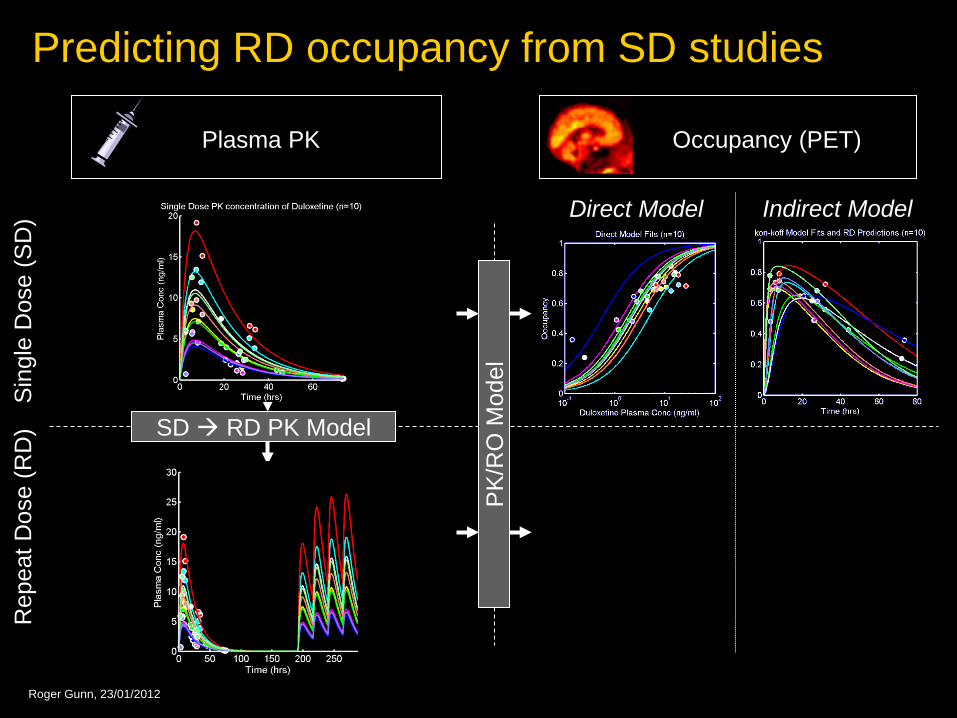
Roger Gunn, 23/01/2012
Sin
gle
Dos
e (S
D)
Rep
eat D
ose
(RD
)
Plasma PK Occupancy (PET)
SD RD PK Model
PK
/RO
Mod
el
Predicting RD occupancy from SD studies
Direct Model Indirect Model

Roger Gunn, 23/01/2012
Sin
gle
Dos
e (S
D)
Rep
eat D
ose
(RD
)
Plasma PK Occupancy (PET)
SD RD PK Model
PK
/RO
Mod
el
Predicting RD occupancy from SD studies
Direct Model Indirect Model

Roger Gunn, 23/01/2012
Direct & Indirect Model Fits and RD Prediction
SD Model Fits RD Model Predictions
EC50 = 2.28 ± 1.10
SD Model Fits RD Model Predictions
kon = 0.28 ± 0.38 KD = 0.46 ± 0.24
Indirect Model is the better predictor of RD occupancy
Abanades et al, JCBFM, 2010

Roger Gunn, 23/01/2012
Summary
Sing
le D
ose
(SD)
Re
peat
Dos
e (R
D) SD RD PK Model
PK/R
O M
odel
• PK/RO Modelling
- Direct/Indirect Model • Multiple Time Point Assays • Adaptive Designs • Predict RD Response
If we can accurately characterise the relationship between
PK (dose/conc) and PD (efficacy) this puts us in a strong Drug Development position
Direct Model Indirect Model
PK PD