model and functional specification of the decision support
TRANSCRIPT
Model and functional specification of the Decision Support System
Sara Colantonio, Mario D’Acunto, Massimo Martinelli, Davide Moroni, Gabriele Pieri, Ovidio Salvetti, Marco
Tampucci
Institute of Information Science and Technologies -
Istituto di Scienza e Tecnologie dell’Informazione
“A. Faedo” – ISTI-CNR
March 1st, 2011

page 2 of 52
Abstract _______________________________
This document defines the functional specifications of ARGOMARINE Environmental Decision Support System and describes the main models the system relies on. The main components of the systems are presented, along with the instruments to develop them. A roadmap for the implementation of the decision support system is reported as well.
pag. 3 of 52
Table of Contents _______________________________
Abstract........................................................................................................................................... 2
Table of Contents ............................................................................................................................ 3
Summary ........................................................................................................................................ 4
1. Introduction .......................................................................................................................... 5
2. Review of MIS Architecture .................................................................................................. 9
2.1. Introduction .............................................................................................................................. 9 2.2. The Middleware ..................................................................................................................... 11 2.3. The Service Unit .................................................................................................................... 12 2.4. The Notification Unit .............................................................................................................. 13 2.5. The Operation Storage Unit .................................................................................................. 13 2.6. The GUI Unit ......................................................................................................................... 13 2.7. The Knowledge Discovery Unit ............................................................................................. 14 2.8. The Environmental Decision Support Unit ............................................................................ 15
3. Analysis of ARGOMARINE Workflows & Functional Specifications of the Decision
Support System ............................................................................................................................ 17
3.1. Introduction ............................................................................................................................ 17 3.2. Management of Oil Slicks in the Tuscany Archipelago ......................................................... 17 3.3. Functional Specifications of ARGO EDSS ............................................................................ 20 3.4. Operational Workflows .......................................................................................................... 22
4. Models and Methods for Environmental Risk Analysis and Resource Management ........... 30
4.1. Historical and online information for data fusion ................................................................... 30 4.2. Models for environmental risk assessment ........................................................................... 32 4.3. Models for the Resource Management Service .................................................................... 37
5. Technological tools and software for the implementation of the Rule Engine and
Workflow Manager components .................................................................................................... 39
5.1. Environmental Decision Support System .............................................................................. 39 5.2. Middleware applications for the integration of the EDSS ...................................................... 42
6. ARGO EDSS Implementation Roadmap............................................................................. 46
7. Bibliography ....................................................................................................................... 49
List of abbreviations ...................................................................................................................... 51
pag. 4 of 52
Summary _______________________________
The focus of this document is the description of the core intelligence of the ARGOMARINE
Marine Information System (MIS), i.e. the ARGO Environmental Decision Support System (ARGO EDSS), which is deeply involved in solving the tasks of detecting, analysing, monitor and manage oil spill events.
The MIS has been precisely described in Deliverable 7.1, where a first insight into ARGO
EDSS has been also provided. Here, much attention is paid to the functional specifications of the system and the description of its structure.
After an introductory chapter that discusses the main features of environmental decision
support tools and highlights how ARGO EDSS enjoy all of them, a recall to the MIS architecture is provided in order to enlighten the framework the system is working within.
In Chapter 3, the procedures that involve ARGO EDSS functionalities have been identified and are described in order to highlight how the system works and cooperates with the other components of the MIS.
Chapter 4 goes in more detail into the structure of the ARGO EDSS and describes its
main components. In Chapter 5, a recall to the technological instruments for the development of ARGO
EDSS is reported. Finally, Chapter 6 states the roadmap of the development of the ARGO EDSS.
pag. 5 of 52
1. Introduction _______________________________
Decision making plays a vital and challenging role in environmental management, due to the degree of uncertainty that characterizes this task and the need for facing multiple and often conflicting objectives. Environmental processes are, indeed, not easy to model due to their multivariable and dynamic nature and the knowledge about them is still incomplete and uncertain. Due to these factors, it is very important that every bit of knowledge about the processes, possibilities of improvement, and innovation is effectively made available and distributed among all actors involved in the process of environmental management.
In this framework, Environmental Decision Support Systems (EDSS) are emerging as fundamental tools to aid analyses and planning of all the decision processes that are pertinent to environmental management. The advantage of using EDSS is twofold: from one side, it aids decision makers in their activity by facilitating the use of data, models and structures, while, from the other side, it helps the reproducibility and transparency of decision making.
Mansfield and Moohan (2002) report “three primary uses for decision support:
Integrating information into a coherent framework for analysis and decision making, discerning key information that impacts decision making from more basic information;
Identifying realistic management choices; Providing a framework for transparency (i.e. all parameters, assumption, and data
used to reach the decision should be clearly documented) and ensuring that the decision making process itself is documented.”
Generally, environmental monitoring processes imply continuous intelligent monitoring system, an increasing volume of data and, in many instances, a decreasing time for making decisions.
In particular, when dealing with problems related to oil spill detection, a number of decision points that benefit from the intervention of an EDSS are:
the collection of information about the site: in order to be as much accurate as possible, it should be decided the number, frequency, and location of the site-specific data to be collected;
the assessment of the risk: based on the initial site characterization data, models for interpolation, extrapolation, and prediction should be applied for evaluating the hazard and guiding the decisions on recovery strategies;
the projections of contamination levels: here, decisions should regard which strategy should be followed for an effective recovery and, to this end, whether more data are needed to better define the region that require recovery or to improve the remedy selection or remedy design;
the monitoring of the interventions made: further decisions should be on what and where to monitor, the duration of monitoring, and, of course, the effective monitoring of the selected areas.

pag. 6 of 52
Moreover, there are a number of basic decisions that should be made before the general decision process is developed. For instance, about what risk levels are acceptable, what to sample, when to sample, what technologies should be used.
It is unlikely that any single person will have the knowledge to perform all of the analyses required in supporting all of the above mentioned decisions. Typically, a number of people with different expertise are involved in interpreting basic information and providing it in a form useful for others in the decision process chain.
An EDSS is, then, strictly helpful for different activities of the environmental management process, which consist mainly in the following:
Hazard identification, by filtering and screening criteria and reasoning about the activity being considered. This phase may be characterised as a continuous activity of the system looking for possible adverse outcomes and includes the search for further data to enhance its own performance.
Risk assessment, by quantitative and qualitative measurements of the hazard. The heterogeneity of data coming from various sources and with many different levels of precision may be faced by using a Model-based System using model based reasoning, and/or a Knowledge-based System using rule-based reasoning, and/or by a Case-based System using case-based reasoning.
Risk evaluation. Once potential risks have been assessed, it is possible to introduce value judgements regarding the degree of concern about a certain hypothesis. This is possible if the system has accumulated experience solving similar situations using for instance a Case-based Reasoning approach, or an Inferential modelling, where previous experience of risk evaluation is used to assist for future judgements.
Intervention decision-making. The system needs appropriate methods for controlling or reducing risks. The system also requires knowledge about the context where the activity takes place and must be able to interpret its results and knowledge about the risk/benefit balancing methods.
According to this analysis, in order to be effective and useful, an EDSS should be able to:
Collect all the relevant data, by suggesting how to collect them, if necessary; Interpret these data according to prediction models for understanding the situation
and assess the risk; Manage the monitoring resources for acquiring more useful data or planning a
remedy intervention.
These considerations have driven the modelling of ARGOMARINE EDSS (ARGO EDSS), which is the core component of the ARGOMARINE Marine Information System (MIS).
The MIS is being developed for meeting the needs for improved marine pollution monitoring and forecasting in support of emergency handling. It is, indeed, an information system where remote sensing data, field experiment results and estimates from simulation models are integrated with tools for data storage and retrieval, data manipulation and analysis, as well as data presentation, in order to detect, monitor and manage oil spill events.
The MIS intelligence is represented by ARGO EDSS which is responsible of the detection and monitoring of pollution accidents by analyzing and combining the multisource data coming from the different data acquisition and processing subsystems of the MIS.
Designing ARGO EDSS has required understanding the environmental problem domain and identifying the domain experts and authorities to cooperate with. Particularly important has
pag. 7 of 52
been the identification of the problems to be solved by exploiting the ARGO EDSS aid, and how the system can intervene and improve the current oil spill detection and management procedures. A number of meetings with the authorities have been planned and some results are reported in the next chapters. According to these results and according to the considerations reported above, ARGO EDSS has been conceived according to a three levels structure, i.e. by endowing it with three main functionalities:
1. Data Gathering 2. Diagnosis and/or Prediction 3. Decision Support
1. Data Gathering. As typically happens, ARGO EDSS has to cope with very different types of data, which can arrive even in real time from a variety of sensors. Indeed, data are gathered from various monitoring resources and consist of:
SAR images; Hyperspectral images collected during flight campaigns; Data collected by buoys; Data collected by underwater vehicles; e-nose data; forecast data obtained by applying simulation models; data about the ship traffic through AIS systems; data reported by sailing volunteers.
The heterogeneity of these data has suggested distributing the interpretation task among different modules that nominally correspond to different subsystems of the MIS. Results of the interpretation are stored within the MIS, in dedicated databases, and are used by ARGO EDSS for the other two functional levels.
2. Diagnosis and/or Prediction. Risk analysis models are applied for diagnosis and prediction. In particular, the environmental data acquired by the various monitoring resources are fused by applying simulation and optimization models for site characterization and observation, in order to detect possible marine pollution events. 3. Decision Support. Support to decisions is, finally, supplied by drawing an optimized plan of exploitation of the resources available for monitoring and of the processes for data analysis, so as to confirm the detection of the event and issue an alarm. Suitable presentation and documentation of alarms are supplied along with feasible ARGO EDSS suggestions aimed at supporting the feasible event management and recovery interventions. According to this conceptual model, ARGO EDSS has been design as composed by two main components, as discussed in the next chapter:
The Risk Analysis Model The Resource Management Service.
These have been modelled in order to assure a number of desirable features, such as:
ability to acquire, represent and structure the knowledge in the specific domain under investigation
ability to separate data from models, in order to be re-usable ability to deal with geo-referenced data ability to provide expert knowledge related to the specific domain ability to be used for planning, management and alerting

pag. 8 of 52
ability to give the end-users (both on the manager/experts side, and the external users) assistance for interfacing with the system and selection of resolution methods.
Finally, another important feature of the environmental decision support tools has been complied with when designing ARGO EDSS: the possibility to dynamically upgrade the system when novel knowledge about the environmental processes is revealed. This is, indeed, performed thanks to the knowledge discovery functionalities that are supplied by the MIS.
In the following chapters, ARGO EDSS model and functional specifications are described in more details.
pag. 9 of 52
2. Review of MIS Architecture _______________________________
2.1. Introduction
Understanding and describing the ARGOMARINE EDSS requires having in mind all the data, information and models that are acquired processed and applied within the ARGOMARINE Marine Information System (MIS). To this end, a recall to the MIS architecture and its main components is particularly helpful.
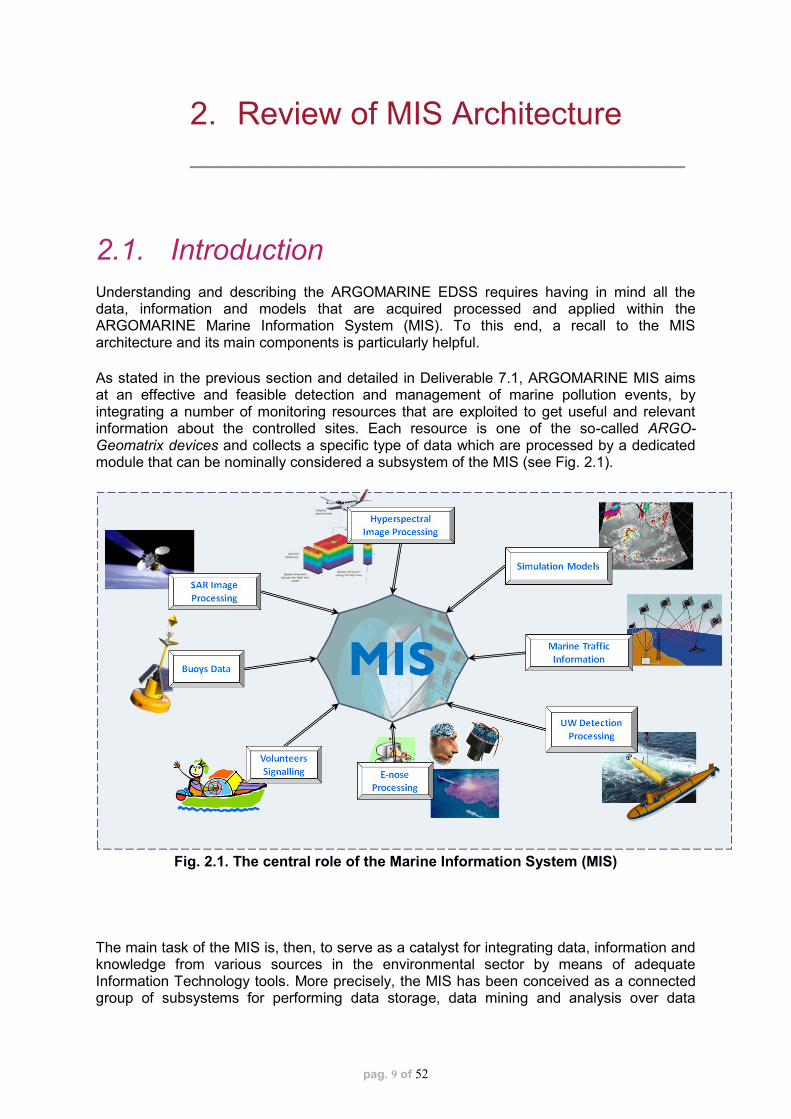
As stated in the previous section and detailed in Deliverable 7.1, ARGOMARINE MIS aims at an effective and feasible detection and management of marine pollution events, by integrating a number of monitoring resources that are exploited to get useful and relevant information about the controlled sites. Each resource is one of the so-called ARGO-Geomatrix devices and collects a specific type of data which are processed by a dedicated module that can be nominally considered a subsystem of the MIS (see Fig. 2.1).
Fig. 2.1. The central role of the Marine Information System (MIS)
The main task of the MIS is, then, to serve as a catalyst for integrating data, information and knowledge from various sources in the environmental sector by means of adequate Information Technology tools. More precisely, the MIS has been conceived as a connected group of subsystems for performing data storage, data mining and analysis over data
pag. 10 of 52
warehouses, decision-support, as well as a web-GIS portal for the access and usage of products and services released to System Managers and end-users.
Architecturally, six main units have been identified when designing the MIS, they are:
Service Unit Notification Unit Operational Storage Unit GUI Unit Knowledge Discovery Unit Environmental Decision Support System Unit.
The Service Unit and the Notification Unit, having a direct interfacing with the external data sources (i.e. the ARGOMARINE different technologies and sensors used for data acquisition and processing), provide and allow data access and data exchange from and to the MIS for each external data source involved in the ARGOMARINE Project.
In particular, the Service Unit is in charge of acting as a data manager for integrating information from all available data sources, including the ARGO-Geomatrix devices, applications (such as mathematical simulation models and image analysis methods) and repositories (like AIS data). The Notification Unit instead dispatches messages, such as alerts and suggestions, to personnel enrolled in ARGOMARINE system.
The Operational Storage Unit constitutes an internal storage unit of the MIS useful for guaranteeing timely access to operational data. In particular, a geo-enabled data base and a multimedia repository constitute the core of this unit.
The GUI Unit represents the graphical front-end of the MIS, comprising also the Web Portal, the interface for the end-users and the Manager.
The Environmental Decision Support System Unit and the Knowledge Discovery Unit are the most advanced services of the MIS. The first aims at providing real-time suggestions to system users, while the second is oriented to offline trend analysis and to the discovery of hidden patterns in the data.
The management of the data flow and of the main communications among these units is charged a central orchestrator called Middleware.
The complete and detailed scheme of the composing units is shown in Fig. 2.2., which highlight the internal structure of the units and their communication links used for data flows and exchange are also highlighted in the figure.
In the following a brief overview of each unit is reported.

pag. 11 of 52
Fig. 2.2. Detailed MIS architecture with working flow
2.2. The Middleware
The Middleware provides interfaces and methods to the single components to cooperate, to exchange information, products or results among them in a reliable, efficient way and with an optimized approach. Indeed, it is not just a communication bus to transfer data, but consists of an Interface engine that guarantees the functioning of the entire MIS system. This is the reason why it is actually composed by two modules: the Workflow manager and the Communication infrastructure.
The former orchestrates business processes in the MIS. An internal business logic engine is included for managing complex sequences of process executions and for coping with branching in case of connection failures. The workflow manager incorporates a scheduler of the event driven stream of information/requests.
The latter, i.e. the Communication infrastructure, covers the connectivity logic part of the MIS and it manages the message based communications between the single units and services, routing and transforming the needed data and requests.
The workflow manager is also in charge of acting as a logging facility, by keeping trace about the platform workflow and saving the performed operations into a log. When an
pag. 12 of 52
operation is performed, the relative identifying code is saved into the log along with the involved units and the operation outcome.
2.3. The Service Unit
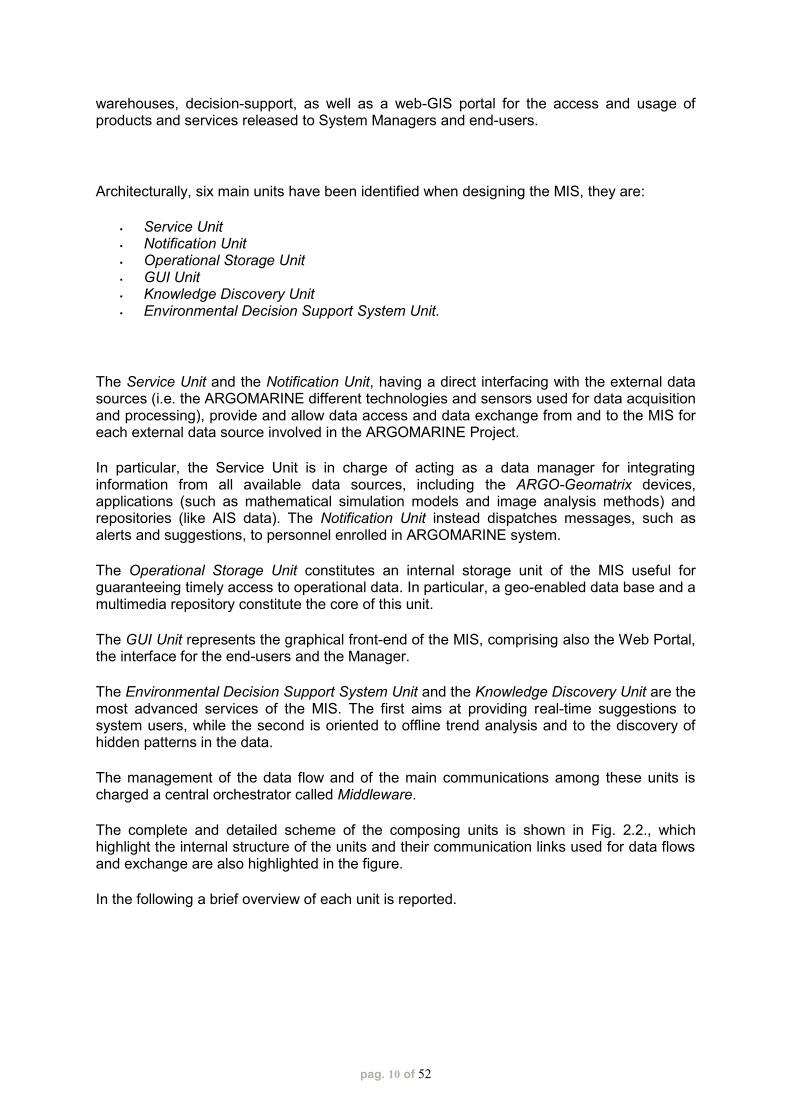
The Service Unit consists of a collection of interfaces for accessing external data sources and for collecting and integrating the acquired data. It is introduced to decouple the heterogeneity of the information considered by ARGOMARINE MIS by providing a set of modular and highly specialized services, according to the interoperability and portability philosophy underlying MIS design. Indeed, each service is in charge of managing the specificity of the addressed data type and communication standard and of transforming the incoming data in an interoperable format for their deployment in the MIS.
In particular, each module will provide a connector which either will wait for incoming requests (e.g. by means of a web service or more generally by listening on some ports) or will perform queries to an external data source according to its proper communication protocol.
Six services have been identified for gathering and managing data coming from the different Geo-matrix devices, as described in the following table.
Services
The Buoys E-nose service is in charge of managing the communications and data exchange with the buoys sensors available in the monitored areas. Besides receiving sensor data at scheduled time, the service will be able to actively query and retrieve sensor data as well as information on the sensor status for diagnostic purposes.
The AUV E-nose service addresses instead communication with the AUV ground station. The service will wait in this case for the ground station uploading mission outcome results, including the E-nose report.
The Acoustic data service is in charge of managing communication with cabled underwater platforms. The service will provide an interface for receiving the processed acoustic data.
The AIS data service is devoted to the management of AIS related information. In particular, it is in charge of connecting to an external AIS data provider and database for retrieving data of interest. The retrieved AIS data will be used in visualization procedures and/or for correlating oil spill information with marine traffic, both for real time and offline analysis.
The Image analysis service is in charge of controlling the communication flows with external units for SAR, Hyperspectral and Thermal image acquisition and processing. The main functionality provided by the service will be the reception of new oil spill
The Mathematical simulation module is in charge of controlling the communication flow with external applications and repositories devoted to weather and oil spill drifting forecast. Since such external applications are also in charge of transforming sensed
pag. 13 of 52
reports obtained by image analysis from dedicated external applications.
weather information from third party operational data (e.g. MFS and MM5 wind forecasts), actual weather information will also made available to the MIS through this module.
2.4. The Notification Unit
The Notification Unit is in charge of packing, queuing and dispatching notification to the users and to possibly external personnel, including oil spill authorities. Two notification methods have been considered, namely email and SMS, though other types may be added in the future.
2.5. The Operation Storage Unit
The Operational Storage Unit aims at storing and providing all the data needed by the MIS in order to identify and detect an oil spill, and managing the administration and user information. It is composed of a GeoDatabase and a Multimedia repository.
The GeoDatabase is being designed in such a way to be able to manage geo-tagged data and to contain all the system information needed by other services (e.g. EDSS Unit, Mathematical simulation model and Web map server). It manages raster data (e.g. SAR data), gridded data (e.g. wind, currents) and georeferenced data (e.g. E-nose, AUVs and buoys reports).
Aiming at increasing the system portability, also user information are georefenced so that the platform is able to manage the monitoring of more than one location and to alert the qualified oil spill authority. In order to manage the multimedia data present in the platform without overloading the GeoDatabase, a proper infrastructure, called Multimedia Repository, has been designed.
The Multimedia Repository exploits the collaboration between GeoDatabase, the file system, and a controller, in order to manage the data, without being influenced by data type and format, to store them into a hierarchical folder structure and to provide search and retrieve operations that exploit the related metadata which are stored into the GeoDatabase.
2.6. The GUI Unit
The GUI Unit is not just a graphical interface to give access to the MIS indeed, through its components, it also provides a set of functionalities proper to the GIS systems and the operations to interact with the project components external to the MIS; the unit is composed by a Web map server, a Desktop GIS client and a Web portal with a WebGIS client integrated.

pag. 14 of 52
The Web map server is the component through which the user interfaces can interact with the operative data stored into GeoDatabase.
The MIS platform has two User interfaces: a Desktop application and a Web portal.
The Desktop application has a service role; it will not be accessed neither by the external end-users nor the Manager (see Section 3.2) and will be used to edit stored data in order to:
simulate an oil spill emergency during the development and the testing phases; correct some data or enrich the maps with specifically needed details (e.g. modify or
add a new established marine route).
It is in charge of editing the stored data and it will be composed of a thick WebGIS client that allows the data editing, performed by users having Administrator rights (see Section 3.2), through the connection with the proper Webservice provided by the Web map server.
2.7. The Knowledge Discovery Unit
The Knowledge Discovery Unit is devoted to managing the procedures related to the analysis of all the information collected and produced by ARGOMARINE platform with the ultimate goal of gaining more insight in the monitored processes.
With the aim of designing a pluggable architecture, the Knowledge Discovery Unit has been separated and endowed with an internal data storage unit, i.e. the data warehouse. In this way, the Knowledge Discovery Unit will not be dependent from the actual implementation of other units and may be easily reconfigured in case of changes in other units or even in case of inclusion of additional units not foreseen in ARGOMARINE project.
Three components of the Knowledge discovery Unit have been identified, namely the Extract, Transform and Load (ETL) service, the Data warehouse and the Data mining service. In brief, the ETL service is a component providing extract, transform and load functionalities to the Data Mining Unit. Indeed this component is in charge of retrieving, aggregating and filtering data from heterogeneous sources and finally saving the data in the data warehouse.
The data warehouse is a database optimized for OLAP procedures, it will contain the bulk of data, possibly organized in multidimensional cubes, on which data mining algorithms may work both for discovering new patterns and for extracting significant statistical parameters.
Finally, the Data mining service provides a library of methods and algorithms for data mining as well as suitable interfaces for accessing data in the warehouse and presenting results to the users.

pag. 15 of 52
2.8. The Environmental Decision Support Unit
The EDSS Unit has a central role into the MIS since is responsible of combining all the multisource data that get into the system through the Service Unit in order to detect and monitor oil slicks, issue alarms and support their management.
Advanced models of risk analysis are developed and applied for characterizing and monitoring the observed sites. More precisely, a dynamic risk map, called ARGO-Geomatrix Model, is defined for assessing the hazard of oil slicks by evaluating several risk factors through the combination of the data collected by the MIS. This map is used for planning a monitoring prioritization of the resources in order to improve the degree of monitoring and control of an area at high risk.
In the same way, whenever the likeliness of a pollution event is determined by the risk analysis or reported by the processing results of one of the other MIS subsystems, the ARGO EDSS is in charge of drawing an optimized plan of exploitation of the monitoring resources and of the data analysis models so as to confirm the detection of the event and issue an alarm. Suitable presentation and documentation of alarms are supplied along with feasible ARGO EDSS suggestions aimed at supporting the possible event management and recovery interventions.
According to this functional description, ARGO EDSS is logically organized according to a three levels structure that consists in:
1. Data gathering 2. Analysis and/or prediction 3. Decision support
(1) Data are gathered through the Service Unit and stored into the Operational Storage Unit. Planning of their collection and retrieval is performed through requests that are orchestrated by the Middleware. (2) Analysis and prediction is realized through the risk assessment models applied to the collected data, while (3) decisions are supported by, first of all, defining an optimized exploitation plan of the resources available for monitoring in order to confirm the detection of the event and issue an alarm. Then, suggestions are supplied in order to support feasible event management and recovery interventions.
This logical structure corresponds architecturally to the two components of ARGO EDSS (Fig. 2.3):
The Risk Analysis Model The Resource Management Service
pag. 16 of 52
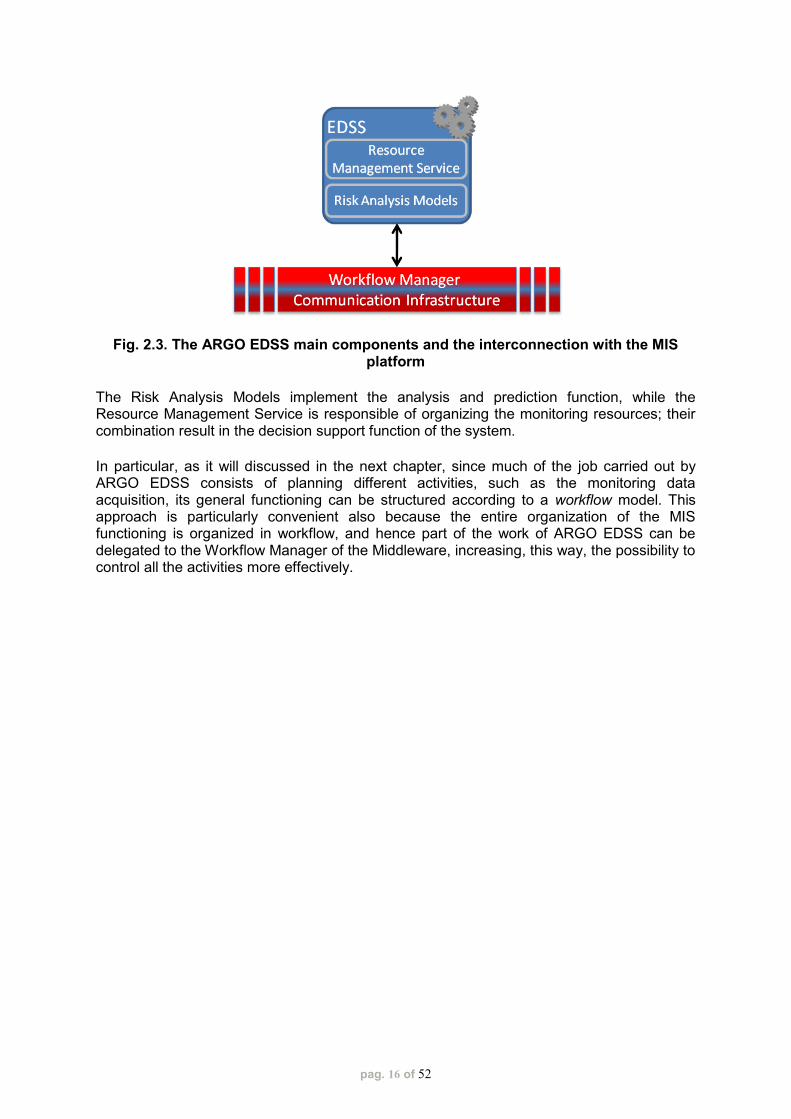
Fig. 2.3. The ARGO EDSS main components and the interconnection with the MIS platform
The Risk Analysis Models implement the analysis and prediction function, while the Resource Management Service is responsible of organizing the monitoring resources; their combination result in the decision support function of the system.
In particular, as it will discussed in the next chapter, since much of the job carried out by ARGO EDSS consists of planning different activities, such as the monitoring data acquisition, its general functioning can be structured according to a workflow model. This approach is particularly convenient also because the entire organization of the MIS functioning is organized in workflow, and hence part of the work of ARGO EDSS can be delegated to the Workflow Manager of the Middleware, increasing, this way, the possibility to control all the activities more effectively.
pag. 17 of 52
3. Analysis of ARGOMARINE Workflows & Functional Specifications of the Decision Support System _______________________________
3.1. Introduction
ARGOMARINE MIS has been designed as a set of specialized subsystems that cooperates for the analysis and interpretation of the data collected by different resources. The MIS organizes these subsystems according to operational workflows that correspond to different scenarios the system covers. Describing such workflows allows the comprehension of the functionalities of the system and offer practical examples of its functioning.
ARGO EDSS represents the focal subsystem when merging the results of the other subsystems and when assessing the risk of pollution events. Hence, it is the protagonist of many workflows of MIS functioning. The definition of how ARGO EDSS intervenes in these workflows in order to effectively support the management of pollution events has required understanding the current situations in terms of procedures followed by the authorities and agreeing with these how to effectively supply support. In this context, some meetings with the authorities have been organized and have supplied useful information.
In this chapter, the description of the procedures followed by the Coast Guard at Portoferraio is reported as emerged from one of meetings. Some considerations about the ARGOMARINE MIS and EDSS interventions are discussed.
This is at the basis of the definition of the functional specifications of the ARGO EDSS that are reported in herein reported as well.
Finally, to better explain these specifications, the workflows that involve the ARGO EDSS are reported and detailed so as to exemplify the functioning of the system.
3.2. Management of Oil Slicks in the Tuscany Archipelago
The Marine area of the Tuscan Archipelago is monitored in real time with the AIS data, available from the Operative Central located in Rome, and the radar data available from the Radar located in Pianosa Island.
More precisely, the following facilities are available at the Portoferraio control room:
pag. 18 of 52
− Radar information received from a device located in Pianosa Island. Such device is linked through a radio bridge, whose receiving station is located on the Monte Capanne. The radar may be also operated by a server located in Pianosa Island (during summer there is a patrol in Pianosa).
− AIS. There is a dedicated monitor for showing AIS data. The data are received from Rome, where a central server is available. No receiver is directly operated by the coast guard in Portoferraio. AIS system is compulsory for vessels on international routes weighting 400tons and more. In the control room, they use “AIS Working Station” provided by dKart TM (http://www.dkart.ru/) on a Windows pc.
The software allows for searching historical data and to review vessels routes in a sort of “movie”. This is useful to look for potential/candidate polluters after a pollution event. This feature has been used after the 2009 oil spill near to Fetovaia beach.
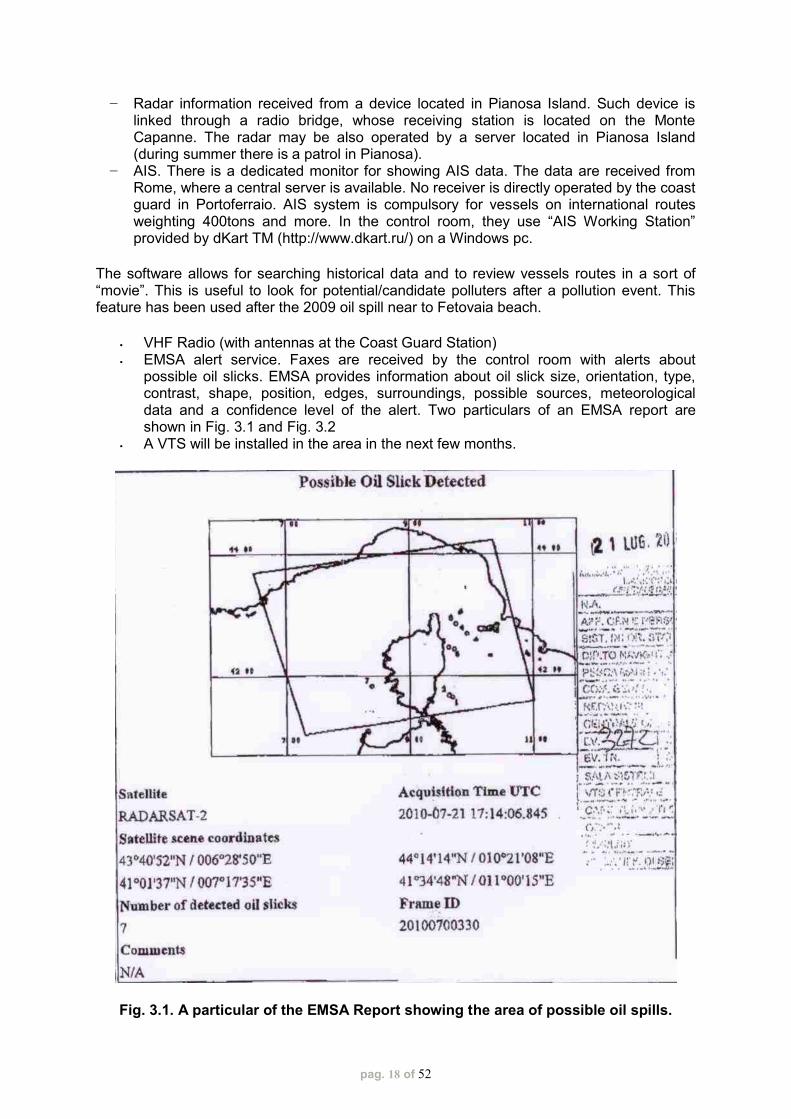
VHF Radio (with antennas at the Coast Guard Station) EMSA alert service. Faxes are received by the control room with alerts about
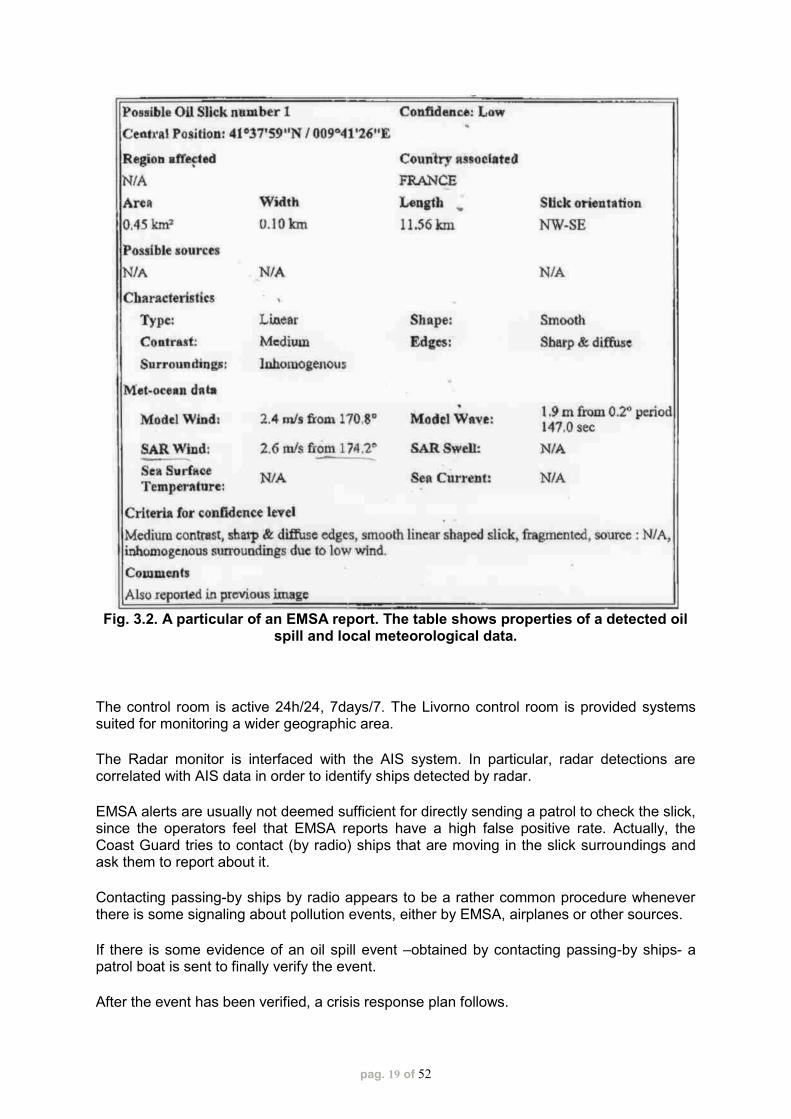
possible oil slicks. EMSA provides information about oil slick size, orientation, type, contrast, shape, position, edges, surroundings, possible sources, meteorological data and a confidence level of the alert. Two particulars of an EMSA report are shown in Fig. 3.1 and Fig. 3.2
A VTS will be installed in the area in the next few months.
Fig. 3.1. A particular of the EMSA Report showing the area of possible oil spills.
pag. 19 of 52
Fig. 3.2. A particular of an EMSA report. The table shows properties of a detected oil
spill and local meteorological data.
The control room is active 24h/24, 7days/7. The Livorno control room is provided systems suited for monitoring a wider geographic area.
The Radar monitor is interfaced with the AIS system. In particular, radar detections are correlated with AIS data in order to identify ships detected by radar.
EMSA alerts are usually not deemed sufficient for directly sending a patrol to check the slick, since the operators feel that EMSA reports have a high false positive rate. Actually, the Coast Guard tries to contact (by radio) ships that are moving in the slick surroundings and ask them to report about it.
Contacting passing-by ships by radio appears to be a rather common procedure whenever there is some signaling about pollution events, either by EMSA, airplanes or other sources.
If there is some evidence of an oil spill event –obtained by contacting passing-by ships- a patrol boat is sent to finally verify the event.
After the event has been verified, a crisis response plan follows.

pag. 20 of 52
To this end, the Coast Guard maintains a list of department resources (also to be hired from private body) to be used in case of pollution events. The list consists in printed tables. For each resource some data are provided, such as telephone number, equipment, possible role, speed, range and endurance. The activity of any of such resources should be first approved by the “Ministero dell’Ambiente” (Reparto Ambiente Marino – RAM) – Ministry for Environmental protection (Marine Environment Department).
During an interview, the Coast Guard referred also about a service called BlueBox, whose adoption is compulsory on fishing boats with length above 15 meters. A BlueBox device should be installed on board, in order to send a short message every two hours containing information about boat and its location. BlueBox data is managed by the “Direzione Marittima” of Livorno. More information needs to be collected on this point in the future.
In the operative chain, the Portoferraio Coast Guard should receive as final user the output signal about the possible oil spill events and should assess the existence of the pollution event as well as its possible impact on the environment.
Analyzing the Coast Guard facilities and procedures, possible operative scenarios of ARGOMARINE EDSS have emerged. For example, when an alert is generated, the DSS should include in it a list of vessels that may be contacted to verify and assess the presence of a pollution event by direct observation.
In addition, considering i) that it takes some hours to verify the presence of an oil spill and ii) that no quantitative models are used to predict the oil spill motion and weathering, integrating mathematical simulation models into the MIS would be a value-added to the ARGOMARINE platform that may be highly beneficial for end users.
3.3. Functional Specifications of ARGO EDSS
The EDSS Unit consists of a multi-criteria decision support system aimed at aiding decision-makers by offering them criteria for the evaluation of the most suitable way for the prevention, control, and recover of oil spills pollution events. The system can be defined as the main intelligence of the MIS and can be envisaged as an advisory and supervisory service that implements predictive and planning tasks of environmental monitoring.
This is obtained by supplying the following functional features, i.e.:
(i) Detection and characterization of possible oil slick events and consequent alerting (ii) Organization and management of the different ARGOMARINE monitoring resources
deployable in situ (ARGO-Geomatrix devices) (iii) Orchestration and combination of the results of the different data acquisition and
processing subsystems (iv) Harmonization and presentation of alerts (v) Suggestions on possible intervention protocols
and these are indeed aimed at:
(iv) issuing specific and well-documented alarms to the authorities in charge.
In more detail, the system acts according to two different modalities: it could be
pag. 21 of 52
(i) reactive or (ii) proactive.
In the reactive mode, the ARGO EDSS is triggered when new data or new reports coming from the monitoring resources is uploaded into the system and will analyze them in order to detect possible pollution events. If some anomalies are this way detected, the system will try to better clarify the situation by collecting all the other related information, e.g., previous, current or future data acquirable from other monitoring resources. By combining the analyses of all the available monitoring data, the system decides whenever to issue an alarm or a warning and supply all related and well-documented information. This can be done automatically or by assisting an operator in the flow of analysis of the different resources.
When proactive, the ARGO EDSS would apply the dynamic risk analysis derived from the ARGO-Geomatrix model for detecting the possible areas that are under-monitored, i.e., where there is a high risk of a pollution event, but the resources deployed in situ are not enough to supervise the area. When this happens, the system organizes a prioritization of the resources, by, for instance, increasing the acquisition rate of the data from the buoys or organizing a mission of the AUV in those areas. The analysis of data obtained in this way is then periodically scheduled and the system will move to the reactive functioning modality.
Once an alarm is issued, the ARGO EDSS provides a potential protocol that can be followed by the authorities in charge for the intervention activities. This might be selected among a number of possible procedures that are properly represented and stored. Suitable reasoning mechanisms for this selection might be employed, such as simple case-based processing.
To supply the above described functionalities, the ARGO EDSS should be aware of the monitoring resources available in the platform and be able to optimize their employment by suitably handling the different events that can occur. This might be achieved by developing proper optimization and risk analysis models, and by implicitly encoding the relevant knowledge into orchestration and organization procedures.
In particular, as already introduced in the previous chapter, the EDSS Unit comprises
- Risk Analysis Models (RAM), which pertain the detection of areas with high risk of oil spill, and will be developed following the inferential statistics approach;
- a Resource Management Service (RMS), which is devoted to the prioritization of the resources for detecting possible oil spill events, and will be developed according to an optimization approach.
The application of the models, the provision of services, and the integration of the results coming from different resources and subsystems of the MIS might be orchestrated according to a business logics approach based on event handling. This means that the flow of data and actions of the system might be codified according to a workflow based representation. The possibility to make the ARGO EDSS lighter and move this functionality to the Middleware component will be investigated.
Data, Resources & Communication
The EDSS Unit is strictly connected with the Middleware for any communication with the other components of the MIS. In particular, it receives input data from the Service Unit and the Operational Storage Unit. Its output is managed by the Middleware and displayed on the GUI Unit when necessary.

pag. 22 of 52
New possible models coming from the Knowledge Discovery Unit will be eventually encoded and suitably moved into the ARGO EDSS.
3.4. Operational Workflows
In this section, the main workflows that rely on the intervention of the ARGO EDSS are reported. These workflows highlight the functionalities of the system and correspond to practical scenario of its working when released.
Before going in detail, some notation can be useful:
- the following acronyms are used within the graphical representation of workflows o SU: Service Unit o NU: Notification Unit o OSU: Operational Storage Unit o MW: Middleware o GUI-MS: GUI Map Server o AoI: Area of Interest o DRM: Dynamic Risk Map o EDSS-RAM: EDSS Risk Analysis Models o EDSS-RMS: EDSS Resource Management Service
- The following arrows are used for different cases: o Normal data flows o Results of operations o Alternative flows o Flow exceptions
- Different shapes and colors are used for different MIS units, and inside the shape the acronym of the unit is reported. When dealing with the Middleware, the activity performed usually consists in service orchestration and communication, and for this reason is not reported into the shape.
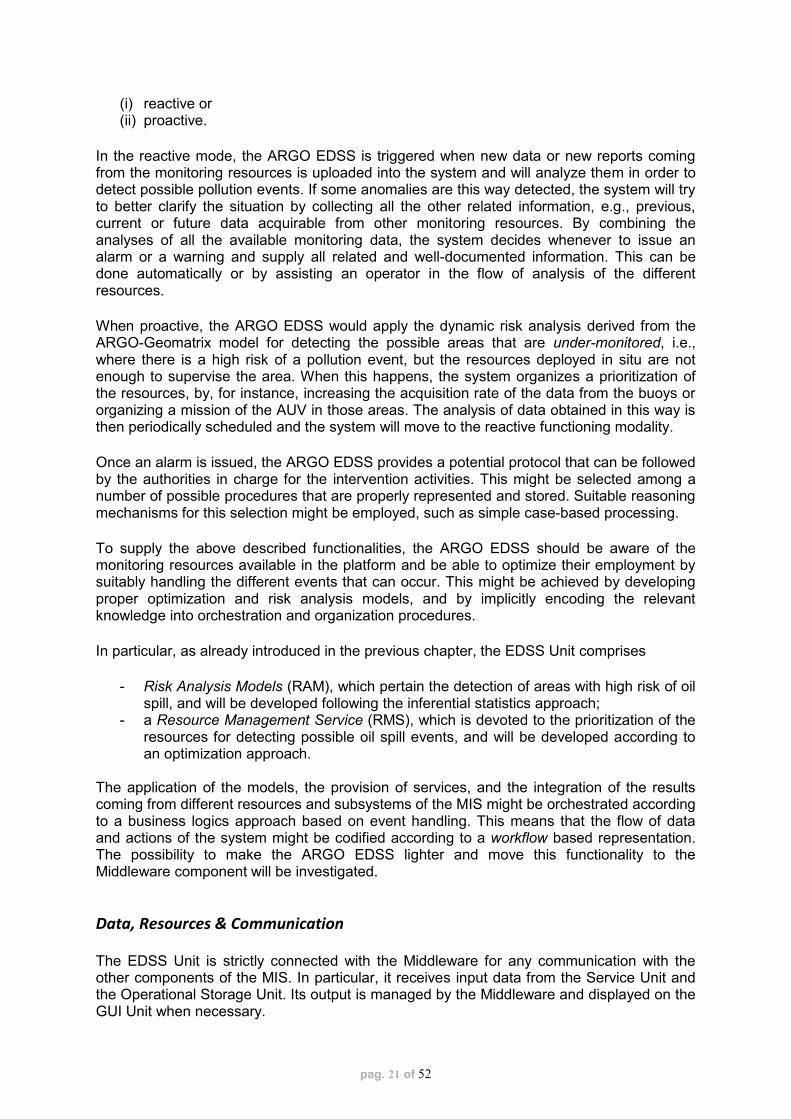
Workflow 1 – Oil Slick Definition
When an oil slick report is gathered by the MIS, the EDSS retrieves the related information about the event, by recalling AIS and acoustic data, and then compiles a report with the potential polluters. Plus, the system builds a map of the interested site and alerts the manager.
The graphical workflow is reported in Fig. 3.3
pag. 23 of 52
Fig. 3.3. The workflow “Oil Slick Definition”
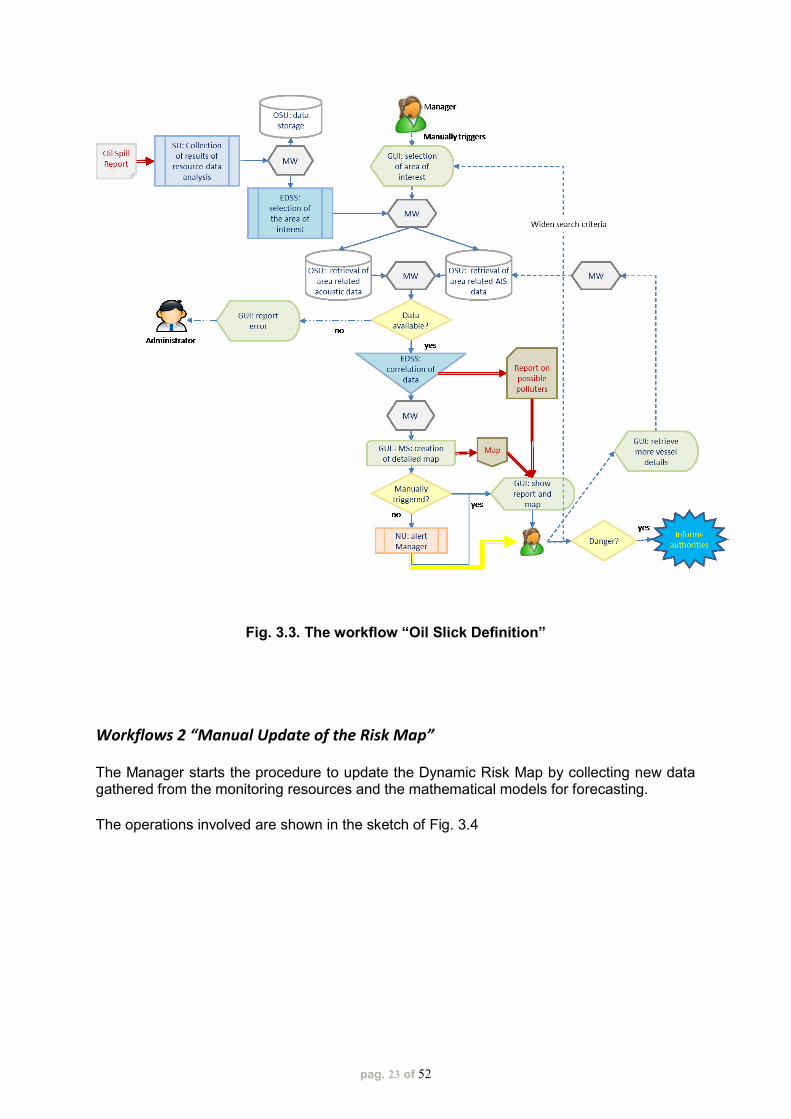
Workflows 2 “Manual Update of the Risk Map”
The Manager starts the procedure to update the Dynamic Risk Map by collecting new data gathered from the monitoring resources and the mathematical models for forecasting.
The operations involved are shown in the sketch of Fig. 3.4
pag. 24 of 52
Fig. 3.4. The workflow “Manual Update of the Dynamic Risk Map”
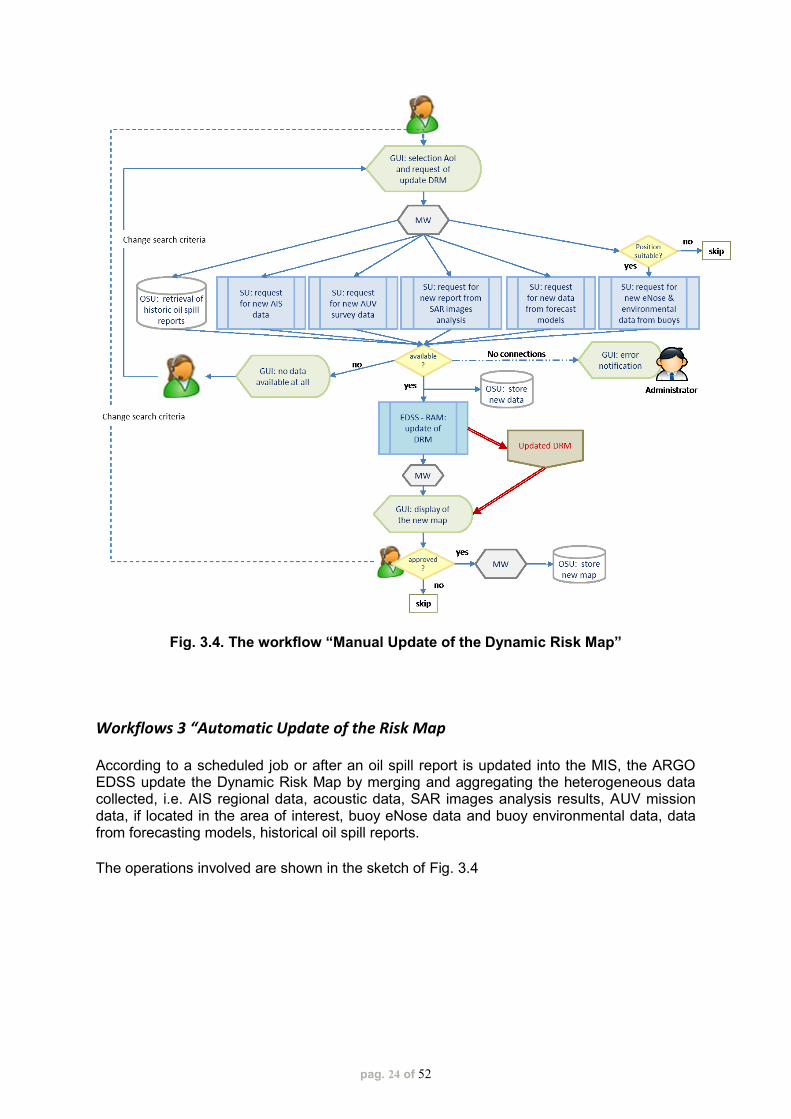
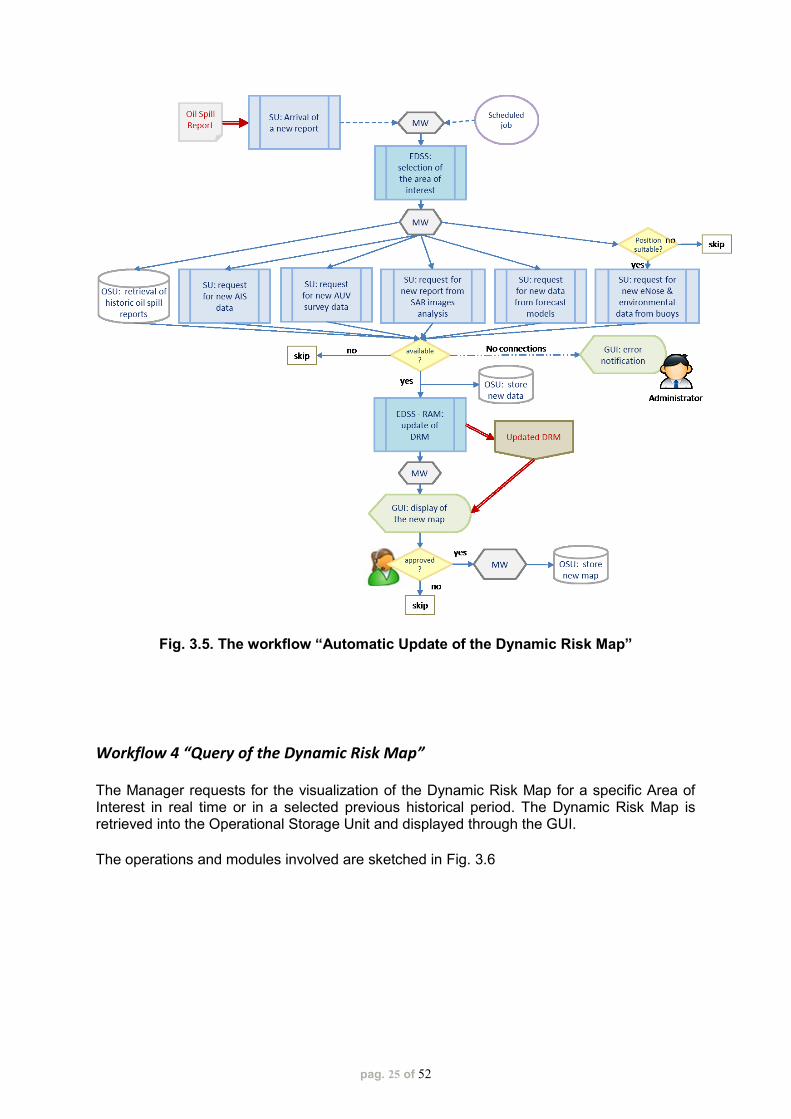
Workflows 3 “Automatic Update of the Risk Map
According to a scheduled job or after an oil spill report is updated into the MIS, the ARGO EDSS update the Dynamic Risk Map by merging and aggregating the heterogeneous data collected, i.e. AIS regional data, acoustic data, SAR images analysis results, AUV mission data, if located in the area of interest, buoy eNose data and buoy environmental data, data from forecasting models, historical oil spill reports.
The operations involved are shown in the sketch of Fig. 3.4
pag. 25 of 52
Fig. 3.5. The workflow “Automatic Update of the Dynamic Risk Map”
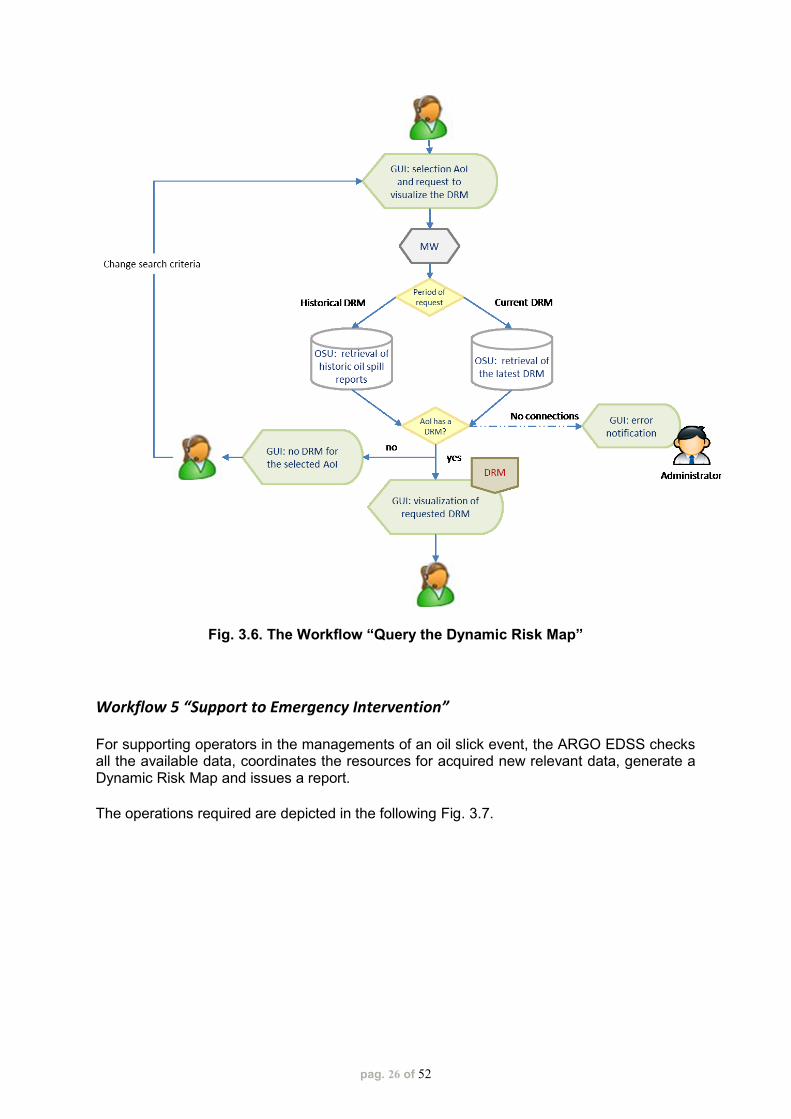
Workflow 4 “Query of the Dynamic Risk Map”
The Manager requests for the visualization of the Dynamic Risk Map for a specific Area of Interest in real time or in a selected previous historical period. The Dynamic Risk Map is retrieved into the Operational Storage Unit and displayed through the GUI.
The operations and modules involved are sketched in Fig. 3.6
pag. 26 of 52
Fig. 3.6. The Workflow “Query the Dynamic Risk Map”
Workflow 5 “Support to Emergency Intervention”
For supporting operators in the managements of an oil slick event, the ARGO EDSS checks all the available data, coordinates the resources for acquired new relevant data, generate a Dynamic Risk Map and issues a report.
The operations required are depicted in the following Fig. 3.7.

pag. 27 of 52
Fig. 3.7. The workflow “Support to Emergency Intervention”
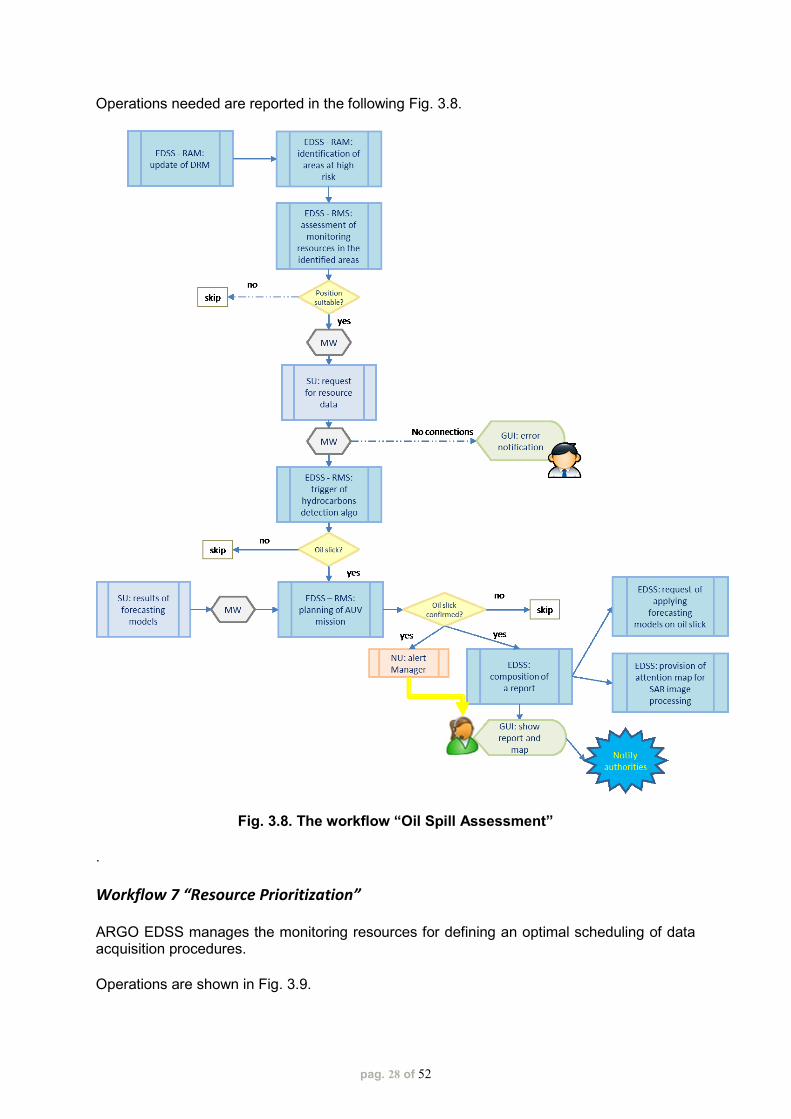
Workflow 6 “Oil Spill Assessment”
The proactive functionality of the ARGO EDSS consists in evaluating the dynamic risk of having a pollution event, by managing monitoring resources to get data and then computing the Dynamic Risk Map. Possible suggestions are also provided.
pag. 28 of 52
Operations needed are reported in the following Fig. 3.8.
Fig. 3.8. The workflow “Oil Spill Assessment”
.
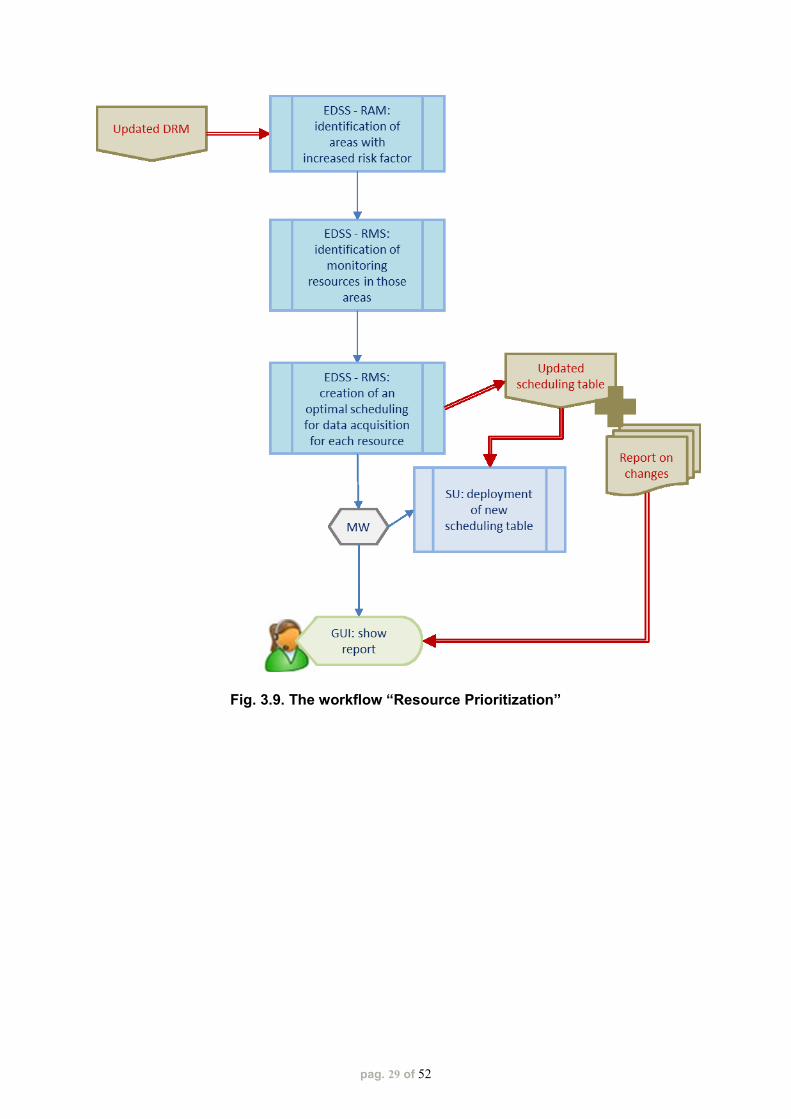
Workflow 7 “Resource Prioritization”
ARGO EDSS manages the monitoring resources for defining an optimal scheduling of data acquisition procedures.
Operations are shown in Fig. 3.9.
pag. 29 of 52
Fig. 3.9. The workflow “Resource Prioritization”
pag. 30 of 52
4. Models and Methods for Environmental Risk Analysis and Resource Management
_______________________________
The aim of this chapter is to introduce decision support methods for the analysis of risk over marine areas in order i) to grant accurate monitoring of the environment, ii) to favour optimal usage of monitoring resources and, finally, iii) to reduce costs.
In particular, we introduce computational models for dynamic risk analysis based on a Bayesian approach. In such models, several data, available through the MIS, are suitably fused for inferring correct assessment of oil spill risk. More in detail, the models may exploit both online information regarding the current situation (e.g. as sensed by the Argo-Geomatrix devices scattered on the monitored area) as well as historical information collected in the ARGOMARINE repositories. The models produce maps of the area in which every point is associated with a local risk coefficient. In this way, visual inspection of the map may provide immediate information about the monitoring status of the area. Pro-active decision support services, based on the computed local coefficients, may be also envisaged to achieve an optimal management of monitoring resource.
The chapter is organized as follows. In Section 4.1, the historical and online data which may be fused for achieving dynamic risk analysis are discussed, while in Section 4.2, the actual computational models for risk assessment are presented.
4.1. Historical and online information for data fusion
In ARGOMARINE MIS heterogeneous information will be made available through the Integrated Communication System (ICS), which will act as a collector of the data produced both by the devices scattered in the marine areas under monitoring and by remote monitoring and computing facilities (e.g. satellite and meteorological information providers). To this end, suitable interfaces have been designed for connecting the ICS with the MIS (see Argomarine Deliverable 7.2). The decision support services will employ such data to infer a detailed reconstruction of the scene. In particular, suitable methods for fusing into an overall picture all the partial pieces of information obtained separately by each data source are to be incorporated into the decision support services. In our approach, both historical and online data will be fused to create dynamic risk maps. More in detail, a dynamic risk map provides for each location in the monitored area a synthetic indicator of risk, which represents the result of the fusion of all the available information at a given time according to a risk analysis model. The most useful sources of information for performing analysis of risk are discussed below.

pag. 31 of 52
AIS and marine traffic Automatic Identification System (AIS) data provided by the Marine traffic monitoring subsystem (See Deliverable 7.1, Section 3.1.6) will play an essential role among risk factors. Indeed, AIS data permits to monitor the density of vessels in a given area, also considering their type (e.g. cargo or tankers), speed, weight and size, thus giving precise information about traffic status. In ARGOMARINE, the Marine traffic monitoring subsystem will not only import external AIS data for real-time visualization and analysis of traffic through a Web Map Server service, but historical data will be also stored in ARGOMARINE data warehouse. The offline analysis of such data will permit to use machine learning paradigms to compute suitable model parameters. Besides AIS, cabled UW platform data are also been collected for a characterization of marine traffic. An UW platform transmits information regarding vessels passing over it. Vessels are detected on the basis of acoustic signals, independently of the presence of an AIS transmitting station on board, and are characterized in term of weight and acoustic signature. In this way, also vessels without AIS (or with un-activated AIS) may be detected and recognized, leading to a more comprehensive and accurate evaluation of marine traffic. Meteorological data In ARGOMARINE, Meteorological data will be imported from external operational data providers (e.g. MFS and MM5 wind forecast) through the mathematical simulation model subsystem (See Deliverable 7.1, Section 3.1.3). Apart from their use in the detection of oil slicks and in the simulation of their displacement and weathering, current weather forecasts will be incorporated in the evaluation of risks, since severe weather condition might interfere both with safe navigation and with prompt reaction to pollution events. Already issued oil spill reports Several disparate services in ARGOMARINE platform issue oil spill reports regarding suspected or verified pollution events. Among them, the SAR and the hyperspectral-thermal image analysis modules provide information about slicks detected in the marine area under monitoring, characterizing their size and type and describing their possible chemical composition. A confidence level may be associated with each identified slick. Similarly, buoys and AUVs provide local water quality information, integrating e-nose sniffing outcomes. Volunteers, coast guard and crew on board vessels navigating across the area of interest may also report about possible oil slick, providing qualitative and semi-quantitative information. The presence of even non-confirmed oil slicks clearly increases the level of risk, requires a stronger deployment of monitoring resources available in the area and demands for a higher alert level. Outcome of numerical simulations The mathematical simulation module is a subsystem of the MIS devoted to the provision of simulation results on the base of models for 3D hydrodynamics, waves, oil-spill transport and weathering. In particular, the simulation module provides information about possible displacements of oil spills and, thus, it may be used to select the areas in which it is more likely to find pollutants. Clearly, risk analysis models should incorporate this information to precisely drive monitoring and crisis-response activities. Deployed monitoring resources In the marine area under monitoring there will be several resources in charge of controlling the environment, preventing pollution events and promptly alerting in case of accidents and pollutions. Among such resources, Argomarine will consider sensorized buoys (equipped with e-nose), AUVs, cable underwater platforms with acoustic sensors, coast guard crew and volunteers equipped with specially designed devices (see Deliverable 6.3). The presence of such resources in a sea area, since they grant for adequate monitoring of the environment, is expected to lower the level of risk. For this reason, geo-positioned data
pag. 32 of 52
about the monitoring resource deployed in the area should be included in the assessment of risk. Miscellanous Apart from the data considered so far, other source of data should be used for risk assessment. In particular, the bathymetry and the coast profile will be included in the model for obvious reasons. The required level of monitoring will also be linked to the importance of the safety in a particular area. In particular, for marine natural parks having different restriction policies in different zones, the subdivision in zones will be used to offer the most adequate level of monitoring in each zone. The presence of conditions of particular interest on the coast (e.g. for reproduction of threatened animals) will be also taken into account. If available, historical data about oil spills and, more generally, accidents will be incorporated.
4.2. Models for environmental risk assessment
Models for risk analysis have been designed to act as a smart system that should conjugate the ability to monitor in real time large marine areas while granting optimal use of resources and reduction of costs. In particular, a so-called Argo-Geomatrix (ARGO-G for short) has been designed and studied (see Cocco et al., 2011). The main quantities introduced into ARGO-G are three, as described below. The Load function L, taking in account all the possible source of oil spill pollution events, such as ship traffic, shore activities or oil platforms, when present in the marine area or nearby. The Monitoring function M, taking in account all the skills and facilities for the oil spill monitoring included communication infrastructure. Such two functions define the cost function S, defined as S=M-L. The balance S=0 represents the ideal situation occurring when the monitoring activity is adequate to the local load and the costs incidence is optimal. The third main function denoting the ARGO-G model is the dynamic risk, R. The dynamic risk is based on the Kaplan theory on the risk (Kaplan, 1997), and modified for being used for marine oil spill surveillance (van Dorp and Merrick, 2009). The functions L, M and S are time dependent, depending locally by the ship density and traffic, so the risk is dynamic in the sense not only that the functions can change in time, but that same configurations of ships on the same marine area could involve different dynamic risks. So defined, the dynamic risk is strictly connected to inferential methods (Szwed et al., 2006).
The type of risk under consideration is the risk of Oil Spill Pollution (OSP) event and subsequent environmental damage. The risk is commonly measured in units of tons of oil spill per ship year, referred as pollution risk in the literature (see e.g. Eide et al, 2007).
However, since the impact of oil spills may be very considerably depending on what, when and where it is spilled, it may be more useful to include some measure on the environmental impact of the OSP, thus assigning a risk unit of OSP impact for ship year.
pag. 33 of 52
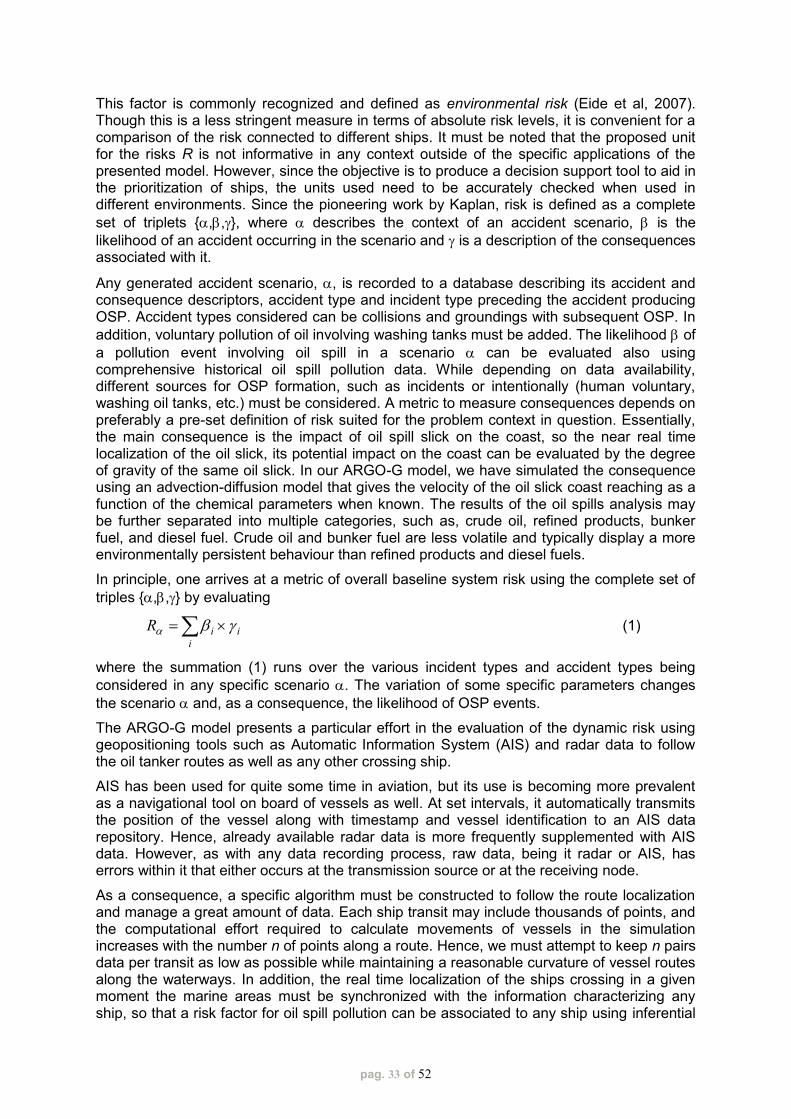
This factor is commonly recognized and defined as environmental risk (Eide et al, 2007). Though this is a less stringent measure in terms of absolute risk levels, it is convenient for a comparison of the risk connected to different ships. It must be noted that the proposed unit for the risks R is not informative in any context outside of the specific applications of the presented model. However, since the objective is to produce a decision support tool to aid in the prioritization of ships, the units used need to be accurately checked when used in different environments. Since the pioneering work by Kaplan, risk is defined as a complete
set of triplets {,,}, where describes the context of an accident scenario, is the
likelihood of an accident occurring in the scenario and is a description of the consequences associated with it.
Any generated accident scenario, , is recorded to a database describing its accident and consequence descriptors, accident type and incident type preceding the accident producing OSP. Accident types considered can be collisions and groundings with subsequent OSP. In
addition, voluntary pollution of oil involving washing tanks must be added. The likelihood of
a pollution event involving oil spill in a scenario can be evaluated also using comprehensive historical oil spill pollution data. While depending on data availability, different sources for OSP formation, such as incidents or intentionally (human voluntary, washing oil tanks, etc.) must be considered. A metric to measure consequences depends on preferably a pre-set definition of risk suited for the problem context in question. Essentially, the main consequence is the impact of oil spill slick on the coast, so the near real time localization of the oil slick, its potential impact on the coast can be evaluated by the degree of gravity of the same oil slick. In our ARGO-G model, we have simulated the consequence using an advection-diffusion model that gives the velocity of the oil slick coast reaching as a function of the chemical parameters when known. The results of the oil spills analysis may be further separated into multiple categories, such as, crude oil, refined products, bunker fuel, and diesel fuel. Crude oil and bunker fuel are less volatile and typically display a more environmentally persistent behaviour than refined products and diesel fuels.
In principle, one arrives at a metric of overall baseline system risk using the complete set of
triples {,,} by evaluating
i
i
iR (1)
where the summation (1) runs over the various incident types and accident types being
considered in any specific scenario . The variation of some specific parameters changes
the scenario and, as a consequence, the likelihood of OSP events.
The ARGO-G model presents a particular effort in the evaluation of the dynamic risk using geopositioning tools such as Automatic Information System (AIS) and radar data to follow the oil tanker routes as well as any other crossing ship.
AIS has been used for quite some time in aviation, but its use is becoming more prevalent as a navigational tool on board of vessels as well. At set intervals, it automatically transmits the position of the vessel along with timestamp and vessel identification to an AIS data repository. Hence, already available radar data is more frequently supplemented with AIS data. However, as with any data recording process, raw data, being it radar or AIS, has errors within it that either occurs at the transmission source or at the receiving node.
As a consequence, a specific algorithm must be constructed to follow the route localization and manage a great amount of data. Each ship transit may include thousands of points, and the computational effort required to calculate movements of vessels in the simulation increases with the number n of points along a route. Hence, we must attempt to keep n pairs data per transit as low as possible while maintaining a reasonable curvature of vessel routes along the waterways. In addition, the real time localization of the ships crossing in a given moment the marine areas must be synchronized with the information characterizing any ship, so that a risk factor for oil spill pollution can be associated to any ship using inferential
pag. 34 of 52
statistical methods as mentioned before. In the next section we present a Bayesian approach for the definition of an OSP.
A Bayesian approach for the definition of OSP event Probability
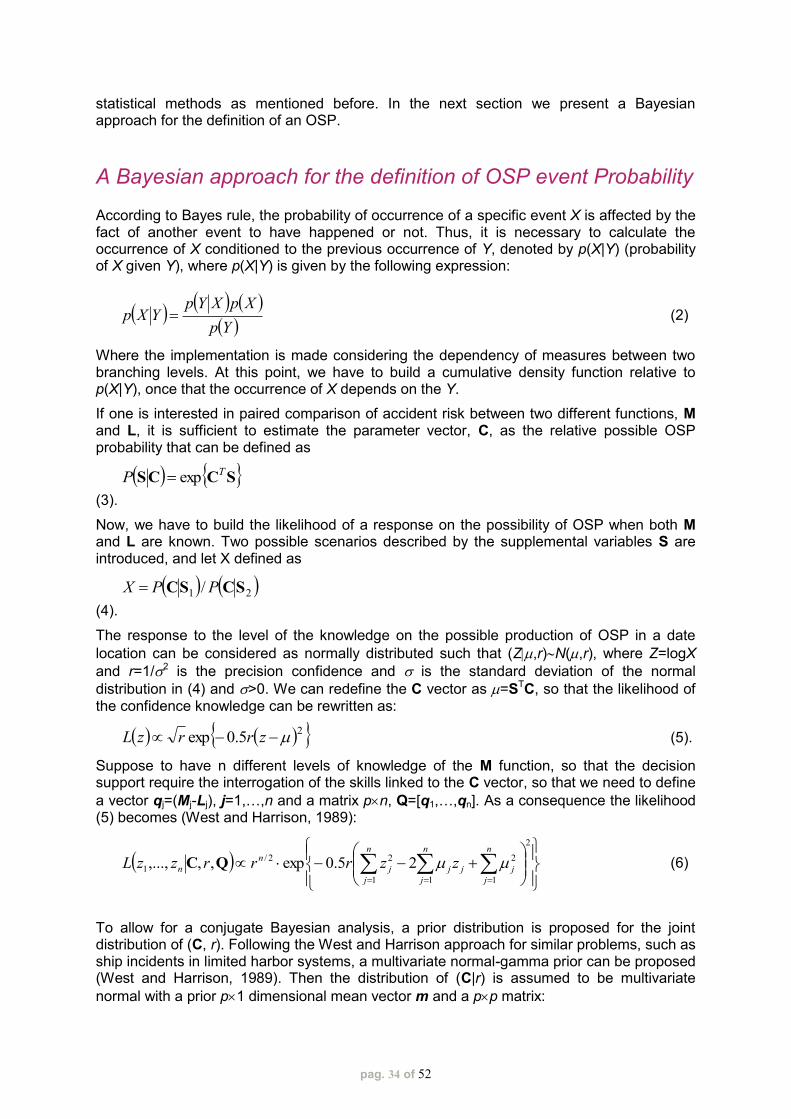
According to Bayes rule, the probability of occurrence of a specific event X is affected by the fact of another event to have happened or not. Thus, it is necessary to calculate the occurrence of X conditioned to the previous occurrence of Y, denoted by p(X|Y) (probability of X given Y), where p(X|Y) is given by the following expression:
Yp
XpXYpYXp (2)
Where the implementation is made considering the dependency of measures between two branching levels. At this point, we have to build a cumulative density function relative to p(X|Y), once that the occurrence of X depends on the Y.
If one is interested in paired comparison of accident risk between two different functions, M and L, it is sufficient to estimate the parameter vector, C, as the relative possible OSP probability that can be defined as
SCCSTP exp
(3).
Now, we have to build the likelihood of a response on the possibility of OSP when both M and L are known. Two possible scenarios described by the supplemental variables S are introduced, and let X defined as
21 / SCSC PPX
(4).
The response to the level of the knowledge on the possible production of OSP in a date
location can be considered as normally distributed such that (Z,r)N(,r), where Z=logX
and r=1/2 is the precision confidence and is the standard deviation of the normal
distribution in (4) and >0. We can redefine the C vector as =STC, so that the likelihood of the confidence knowledge can be rewritten as:
25.0exp zrrzL (5).
Suppose to have n different levels of knowledge of the M function, so that the decision support require the interrogation of the skills linked to the C vector, so that we need to define
a vector qj=(Mj-Lj), j=1,…,n and a matrix pn, Q=[q1,…,qn]. As a consequence the likelihood (5) becomes (West and Harrison, 1989):
2
1
2
11
22/
1 25.0exp,,,...,n
j
j
n
j
jj
n
j
j
n
n zzrrrzzL QC (6)
To allow for a conjugate Bayesian analysis, a prior distribution is proposed for the joint distribution of (C, r). Following the West and Harrison approach for similar problems, such as ship incidents in limited harbor systems, a multivariate normal-gamma prior can be proposed (West and Harrison, 1989). Then the distribution of (C|r) is assumed to be multivariate
normal with a prior p1 dimensional mean vector m and a pp matrix:
pag. 35 of 52
mCmCCTn rr
rr2
exp2
exp2/1 (7)
where (r)-1 is the variance covariance. Applying Bayes theorem utilizing the likelihood (6) to
the prior distribution, (7), it follows that the posterior distribution (C,r|L,Q) is proportional to (8). The posterior distribution (8) can be updated and represented on a grid, where to any
cell can be assigned a numerical value that can be considered as the factor, i.e. the OSP
likelihood. To obtain the dynamic risk, we have to calculate the impact factor of an OSP, , when a pollution event is occurred.
A possible evaluation of will be made in the next section.
mCmCCCCC
Tn
j
n
j
T
jj
T
Tn
j
jjj
n rrqqzqz
rrr
2exp
2exp2
2exp
2
1 11
22/1
(8)
Evaluation of the Impact Factor for OSP events
The dynamic risk, R, requires the quantitative knowledge of the impact of an OSP on the
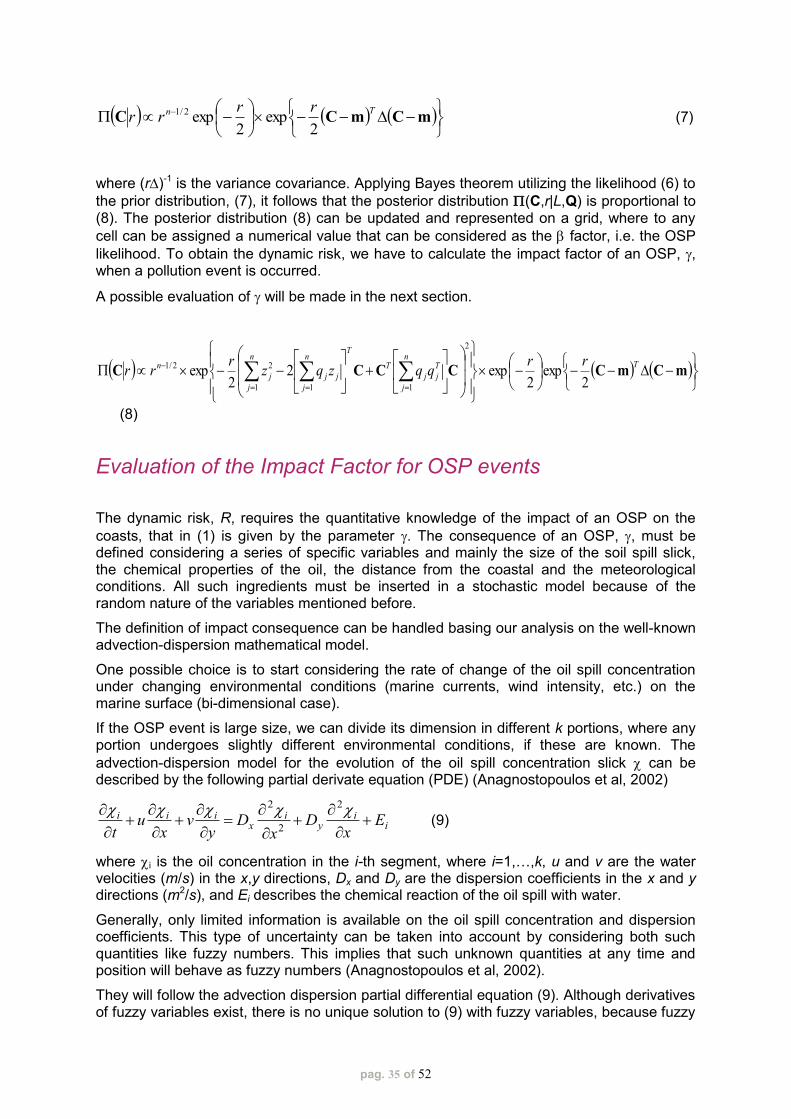
coasts, that in (1) is given by the parameter . The consequence of an OSP, , must be defined considering a series of specific variables and mainly the size of the soil spill slick, the chemical properties of the oil, the distance from the coastal and the meteorological conditions. All such ingredients must be inserted in a stochastic model because of the random nature of the variables mentioned before.
The definition of impact consequence can be handled basing our analysis on the well-known advection-dispersion mathematical model.
One possible choice is to start considering the rate of change of the oil spill concentration under changing environmental conditions (marine currents, wind intensity, etc.) on the marine surface (bi-dimensional case).
If the OSP event is large size, we can divide its dimension in different k portions, where any portion undergoes slightly different environmental conditions, if these are known. The
advection-dispersion model for the evolution of the oil spill concentration slick can be described by the following partial derivate equation (PDE) (Anagnostopoulos et al, 2002)
ii
yi
xiii E
xD
xD
yv
xu
t
2
2
2
(9)
where i is the oil concentration in the i-th segment, where i=1,…,k, u and v are the water velocities (m/s) in the x,y directions, Dx and Dy are the dispersion coefficients in the x and y directions (m2/s), and Ei describes the chemical reaction of the oil spill with water.
Generally, only limited information is available on the oil spill concentration and dispersion coefficients. This type of uncertainty can be taken into account by considering both such quantities like fuzzy numbers. This implies that such unknown quantities at any time and position will behave as fuzzy numbers (Anagnostopoulos et al, 2002).
They will follow the advection dispersion partial differential equation (9). Although derivatives of fuzzy variables exist, there is no unique solution to (9) with fuzzy variables, because fuzzy

pag. 36 of 52
numbers take different values at different levels of confidence.
The solution is given taking any fuzzy numbers represented by a discrete set of h-level cuts, and for every confidence level h, we look only for the lower and the upper limiting values of the unknown fuzzy variables. A solution of (9) in the ordinary intervals for the fuzzy variables can be found using finite differences and finite elements (Anagnostopoulos et al, 2002). Here, we write a possible solution that can be expressed as:
210 11),,( 21 ZerfeZerfetyxTT
(10)
with yx DxiDuuT 2422,1
and tDtiDuuZ yx 242
2,1
, where the number
indexes, 1,2 are respectively correspondent to the signs - and +.
Once is known, the parameter can be computed taking in account the capacity of
intervention by the Coast Guard or other correspondent institution. United to the factor calculated with the Bayesian approach, the dynamic risk can be quantified.
Fig. 1 Example of operative results obtained mapping the dynamic risk R factor as given by the ARGO-G model. On the left image it is represented the marine area to be monitored with the representation of the load function, L. Such function is obtained taking in account the density of ships crossing the marine area. On the right image, the correspondent scheme produced by the ARGO-G predictive algorithm. The dark domains on the marine area represent the localization of the critical sub-areas where
an OSP event is more probable (and high damage produced) and efforts on the monitoring activity are required.
In Figure 1, we give a schematic sketch of the dynamic risk mapped using the Bayesian approach and the advection model for the propagation of OSP. The cargo tankers are considered as the main sources for OSP, nevertheless, coastal activities could have an important role for the production of OSP, and their inclusion in the present model is one of the future steps for improving the ARGO-G model.
pag. 37 of 52
4.3. Models for the Resource Management Service
The Resource Management Service (RMS) is devoted to the optimization of the monitoring resources that compose the ARGO-G devices model in order to cover the monitoring areas and get the most valuable information possible about pollution events.
An example of functioning of this service has been reported in the previous chapter, when presenting the workflow about resource prioritization. The idea is that when an oil spill event is detected by one of the monitoring resources, ARGO EDSS with its Resource Management Service organizes the use of the other resources to get more information about the site interested and to provide suggestions about the recovery strategy to be followed.
Methods for the development of RMS are based on optimization models that try to drive effective and efficient use of resources, according to tasks to be performed. In particular, the aim is to define strategies for assigning resources to different activities with both a process focus and a resource use focus to optimize task operations.
To this end, different options should be usually explored about resource allocation, availability, relevance, and data; therefore, the development of descriptive and analytical models is required to accurately represent and simulate the processes that involve resources deployment.
For the ARGO EDSS purposes, these models are dynamic and provide a new resource deployment plan each time it is required.
From a methodological point of view, defining the resource optimization models requires outlining objectives, decision variable and constraints.
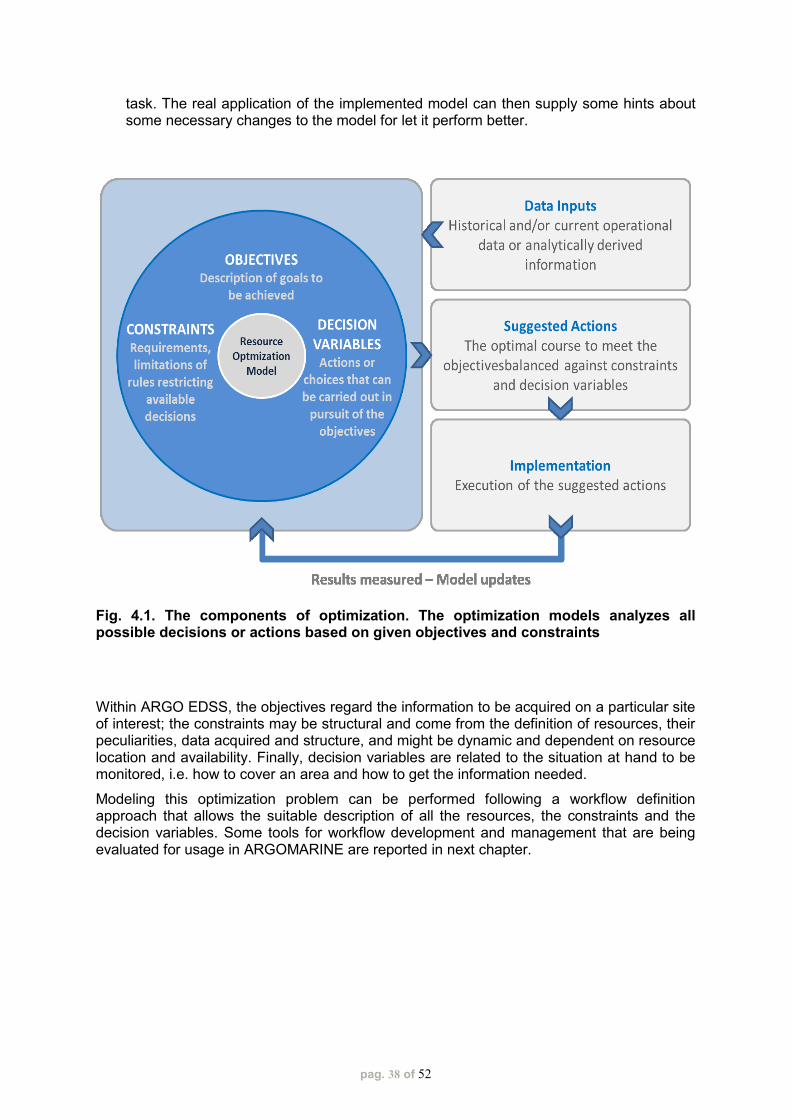
How these are involved in the optimization process can be illustrated as depicted in Fig. 4.1, and described according to the following steps that are being performed to develop the resource optimization model:
Step 1. Define the objective to reflect model mission and strategy The objectives to be pursued need to be determined: what resources are meant to do, how they are characterized, described and catalogued for assessing their relevance and availability to the tasks to be performed. Moreover, the activities to reach these objectives should be outlined, and how success or failure be measured.
Step 2. Establish the context The requirements, rules and constraints are required to define precisely the action scene of the optimization model and the decisions that will be made.
Step 3. Define the conceptual model All the elements of the model should be inserted into a conceptual framework. First of all input data should be defined and then decision variables and actions listed, in accordance to objectives and constraints. The optimization model is, this way, depicted and designed.
Step 4. Formulate the resource optimization model The conceptual model is then translated into an analytic model with more rigor and detail, represented in mathematical terms. The key elements of the optimization model – objective, constraints and decision variables are initially coded. There is no single “right” way to use mathematical expressions to represent the elements of a decision problem. Every formulation represents a compromise because no mathematical representation can reflect every detail of a real-world scenario. Good modeling balances realism and workability.
Step 5. Implement and update the model The model should be finally implemented and analytical software can turn useful for this
pag. 38 of 52
task. The real application of the implemented model can then supply some hints about some necessary changes to the model for let it perform better.
Fig. 4.1. The components of optimization. The optimization models analyzes all possible decisions or actions based on given objectives and constraints
Within ARGO EDSS, the objectives regard the information to be acquired on a particular site of interest; the constraints may be structural and come from the definition of resources, their peculiarities, data acquired and structure, and might be dynamic and dependent on resource location and availability. Finally, decision variables are related to the situation at hand to be monitored, i.e. how to cover an area and how to get the information needed.
Modeling this optimization problem can be performed following a workflow definition approach that allows the suitable description of all the resources, the constraints and the decision variables. Some tools for workflow development and management that are being evaluated for usage in ARGOMARINE are reported in next chapter.
pag. 39 of 52
5. Technological tools and software for the implementation of the Rule Engine and Workflow Manager components
_______________________________
In this chapter, a survey of existing technological tools for the implementation of the Rule Engine and the Workflow Manager is presented. In particular, existing libraries, software packages, applications and frameworks for actually developing each of the identified components are reviewed, giving special attention to robustness and portability issues. Besides comparing the features of available tools with respect to ARGO EDSS functional requirements, emphasis is given to open-source solutions and interoperability. Besides, with respect to the more general analysis of available tools reported in Deliverable 7.1, a selection of the tools responding more adequately to ARGO EDSS is performed.
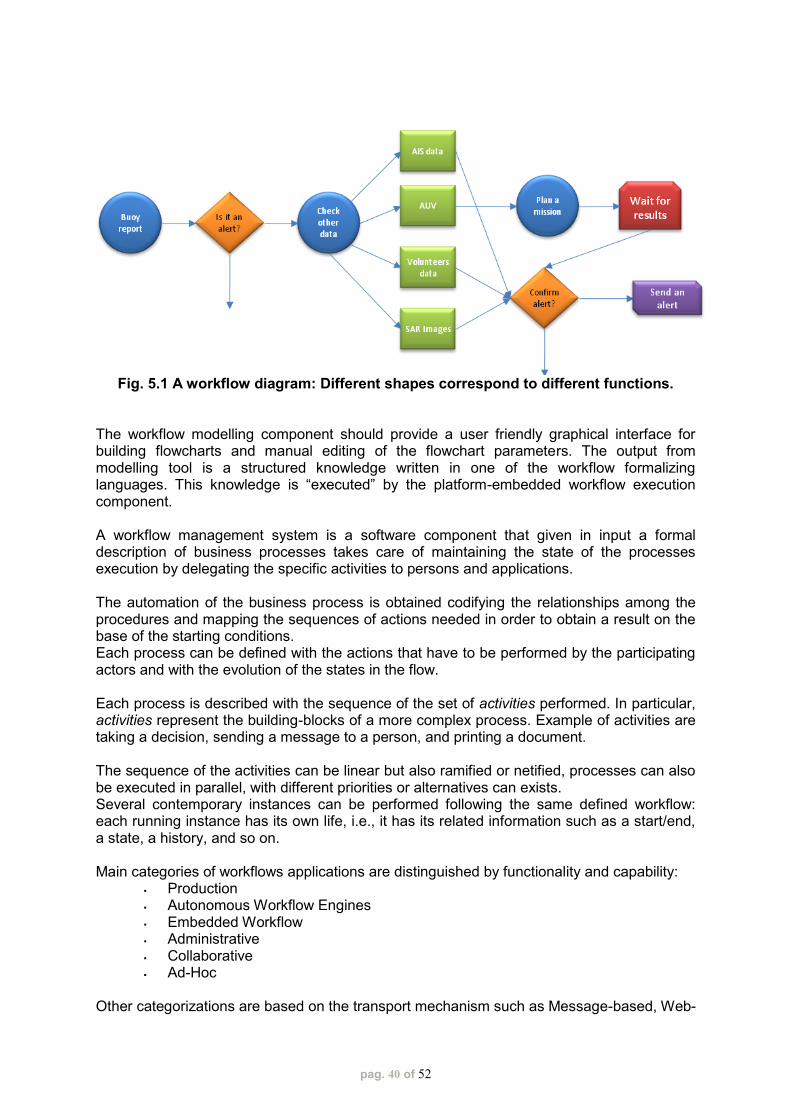
5.1. Environmental Decision Support System As stated in previous chapters, an EDSS can be loosely defined as a collection of methods that include knowledge-based systems, tools for scenario analysis and optimization procedures. Different approaches can be followed for understanding, designing and formally coding the relevant knowledge and the information needed for implementing models for environmental problems identification and solving. Among them, particularly suitable for merging together models for resource management, risk analysis and other knowledge-based methods, which are all pertinent to environmental monitoring, is the representation paradigm based on workflows. Workflows, indeed, represent a useful and powerful instrument for knowledge representation when adopting a planning approach, i.e., when dealing with business logics and an event driven approach. A flowchart of tasks, states, events and actions are used to mainly formalize procedural knowledge, which refers to knowing how to do something. Workflow problems can be modelled and analysed using graph-based formalisms where structures are built on the standardized graphical notations (using nodes and directed arcs, see Fig. 5.1). The obvious advantage of the flowchart representation is that it is a format that is familiar to human experts and at the same time easily interpreted by machines. In Section 3 of this document, we followed exactly this paradigm to model ARGOMARINE workflows in order to understand and state the functional requirements of ARGO EDSS. Workflow diagram systems are defined as “systems that help organizations to specify, execute, monitor, and coordinate the flow of work cases within a distributed office environment”. There are two logically separated parts of the workflow system: - the workflow modelling component - the workflow execution component (engine + interface)
pag. 40 of 52
Fig. 5.1 A workflow diagram: Different shapes correspond to different functions.
The workflow modelling component should provide a user friendly graphical interface for building flowcharts and manual editing of the flowchart parameters. The output from modelling tool is a structured knowledge written in one of the workflow formalizing languages. This knowledge is “executed” by the platform-embedded workflow execution component. A workflow management system is a software component that given in input a formal description of business processes takes care of maintaining the state of the processes execution by delegating the specific activities to persons and applications. The automation of the business process is obtained codifying the relationships among the procedures and mapping the sequences of actions needed in order to obtain a result on the base of the starting conditions. Each process can be defined with the actions that have to be performed by the participating actors and with the evolution of the states in the flow. Each process is described with the sequence of the set of activities performed. In particular, activities represent the building-blocks of a more complex process. Example of activities are taking a decision, sending a message to a person, and printing a document. The sequence of the activities can be linear but also ramified or netified, processes can also be executed in parallel, with different priorities or alternatives can exists. Several contemporary instances can be performed following the same defined workflow: each running instance has its own life, i.e., it has its related information such as a start/end, a state, a history, and so on. Main categories of workflows applications are distinguished by functionality and capability:
Production Autonomous Workflow Engines Embedded Workflow Administrative Collaborative Ad-Hoc
Other categorizations are based on the transport mechanism such as Message-based, Web-
pag. 41 of 52
based and Suite-based. Some tools for developing workflow management systems and workflow definition languages have been selected among the several reported in Deliverable 7.1, giving special emphasis to the Business Process Execution Language (BPEL) 1. BPEL is an XML-based language defined for a formal description of processes which allows different tasks to be assigned to different actors. It results from the fusion of IBM and Microsoft researches on WSFL2 and XLANG3, both outperformed by BPEL. In 2003, OASIS made BPEL a standard language, called BPEL4WS, WS-BPEL or simply BPEL. A BPEL application is implemented as a Web Service4 and is able to interact with external entities through web service operations. This way, it can be considered as a service orchestrator5 which allows for a recursive composition of services. An orchestration specifies an executable process that involves message exchanges with other systems, such that the message exchange sequences are controlled by the orchestration designer. A BPEL engine is needed for running a generic BPEL application. Going in more detail, the BPEL language allows a process to be defined as a set of activities, which can be simple or structured. A simple activity corresponds to an action (e.g., call a service, assign a value to a variable, and so on), while a structured activity is usually employed for grouping simple activities into loops, conditional operations, sequential or concurrent procedures. An entire process is described by a unique structured activity, the so called top-level activity, which is usually sequential. BPEL suites for modelling workflows which can completely automated for the composition and integration of services. Usually, a workflow, represented by a diagram, is composed by operations, messages, actors (users or applications), web-services, logic conditions (e.g., IF), parallelisms, loops and tasks for synchronizing different operations. BPEL allows the definition of an existing workflow or an abstract process by transforming a graphical UML6 model into a programming code. This is particularly useful for when there is the need of integrating two or more processes that are modelled with different terminologies but can be represented by an UML notation. Indeed, BPEL provides importing and exporting facilities of UML diagrams which make it possible to move from one proprietary database to another without losing its content. The BPEL language is based on the definition of transactions: a transaction can be atomic or long running (LRT). An atomic transaction is defined as a process that can end with a “commit” or an “abort”, without any intermediate state. Long running transactions are an extension of the ACID7 transactions to long lasting processes which is implemented through the concept of compensation of the performed activities. Several BPEL engines have been implemented, among them worth of mention, since open-source, is ActiveBPEL and Twister. However BPEL engine are included in most ESB frameworks, which are described in the following section.
1 http://en.wikipedia.org/wiki/Business_Process_Execution_Language
2 http://xml.coverpages.org/wsfl.html
3 http://xml.coverpages.org/xlang.html
4 http://en.wikipedia.org/wiki/Web_service
5 http://en.wikipedia.org/wiki/Orchestration_%28computing%29
6 http://en.wikipedia.org/wiki/Unified_Modeling_Language
7 http://it.wikipedia.org/wiki/ACID
pag. 42 of 52
5.2. Middleware applications for the integration of the EDSS
As detailed in Deliverable 7.1, ARGOMARINE platform may be regarded as a System of Systems (SoS) and, as such, a suitable solution for inter-system communication should be chosen. In the architecture of the MIS, a middleware layer was included with the aim of orchestrating in an intelligent way all the components of the platform and of providing an information exchange environment. The middleware layer has been distinguished in a Workflow Manager and a Communication infrastructure. While the workflow manager implements the business logic behind the SoS, providing the functionalities described in the previous section, the communication infrastructure implements the connectivity logic. In particular, it is in charge of providing a message-base environment flexible enough to connect and integrate disparate components and, notably, capable of interacting with the Workflow Manager. For these reasons, the inclusion into the MIS of an Enterprise Service Bus (ESB) is interesting for achieving the required service integration. Indeed, an ESB is a platform that provides services, such as message routing and transformation, which can be generally used to implement a Service-Oriented Architecture (SOA) (Rademakers and Dirksen, 2008). ESB typically allows for designing and developing pluggable architectures. In particular, ESBs are well suited to scenarios where loose coupling, scalability and robustness are required. In addition, adopting an ESB based on open and recognized standard guarantees both a) interoperability of ARGOMARINE platform with other environmental information systems to come and b) a greater reusability of the developed code. Generally, an ESB consists of a software architecture framework, which provides fundamental services for complex architectures via an event-driven and standard-based messaging-engine (the bus). Messages that are passed between existing services and clients are transformed along the bus by mediation flows. Typically, a mediation flow mediates or intervenes to provide functions, such as message logging, data transformation and routing. The mediation flow consists of a series of mediation primitives that manipulate messages as they flow through the bus. The ESB provides an abstraction layer on top of an implementation of an enterprise messaging system. To be effective, an ESB should provide great flexibility and should support many transport media capable of implementing both traditional SOA patterns as well as SOA 2.0-enriched business architecture. ESBs often come together with major application servers. This is the case for example of the commercial IBM WebSphere ESB, which is part of the WebSphere family of products and of Oracle ESB. Anyway, most ESB may work also with third party applications servers. After having reviewed all common ESB frameworks inn Deliverable 7.1, we decided to focous on Apache ServiceMix and openESB for the actual implementation of ARGOMARINE ESB. Indeed, both are mature, yet non-obsolete, ESB implementation. They both grant great flexibility in interfacing with other components (since they provide a variety of bindings components, including modules for SOAP, WSDL, HTTP and FTP), thus easing the integration of the Service Unit (see Deliverable 7.2) and they come with the possibility to seamlessly incorporate business logic engines.
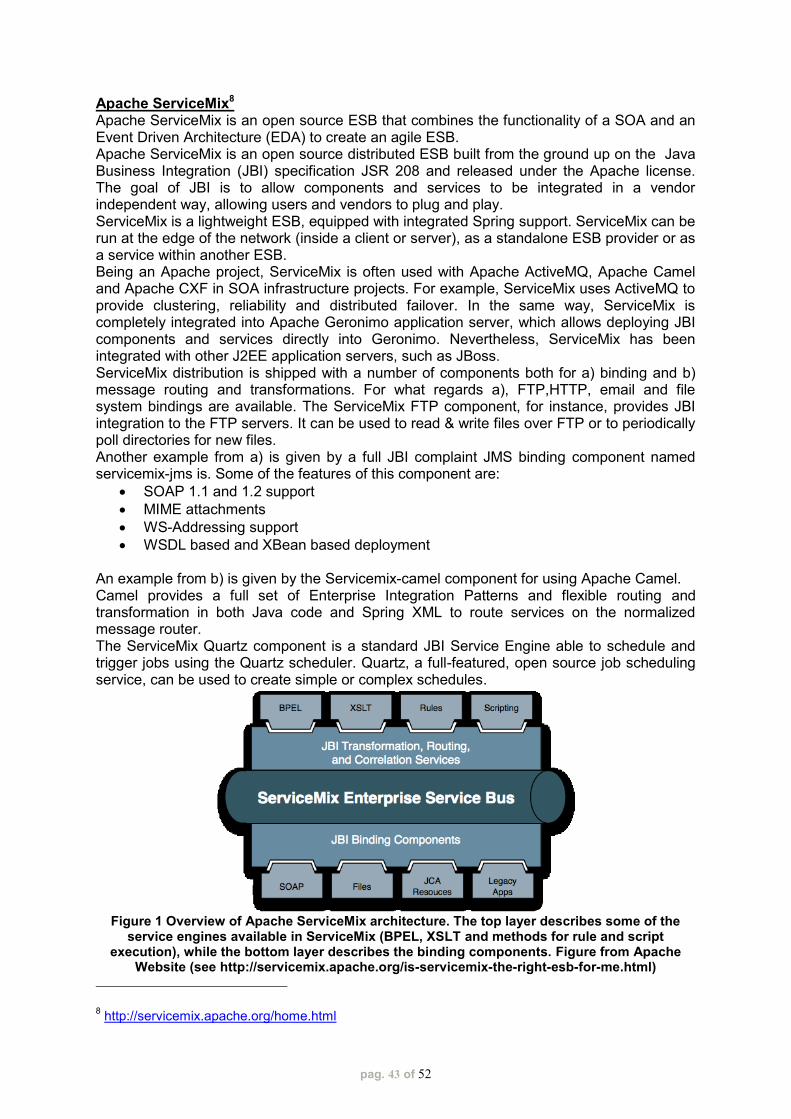
pag. 43 of 52
Apache ServiceMix8 Apache ServiceMix is an open source ESB that combines the functionality of a SOA and an Event Driven Architecture (EDA) to create an agile ESB. Apache ServiceMix is an open source distributed ESB built from the ground up on the Java Business Integration (JBI) specification JSR 208 and released under the Apache license. The goal of JBI is to allow components and services to be integrated in a vendor independent way, allowing users and vendors to plug and play. ServiceMix is a lightweight ESB, equipped with integrated Spring support. ServiceMix can be run at the edge of the network (inside a client or server), as a standalone ESB provider or as a service within another ESB. Being an Apache project, ServiceMix is often used with Apache ActiveMQ, Apache Camel and Apache CXF in SOA infrastructure projects. For example, ServiceMix uses ActiveMQ to provide clustering, reliability and distributed failover. In the same way, ServiceMix is completely integrated into Apache Geronimo application server, which allows deploying JBI components and services directly into Geronimo. Nevertheless, ServiceMix has been integrated with other J2EE application servers, such as JBoss. ServiceMix distribution is shipped with a number of components both for a) binding and b) message routing and transformations. For what regards a), FTP,HTTP, email and file system bindings are available. The ServiceMix FTP component, for instance, provides JBI integration to the FTP servers. It can be used to read & write files over FTP or to periodically poll directories for new files. Another example from a) is given by a full JBI complaint JMS binding component named servicemix-jms is. Some of the features of this component are:
SOAP 1.1 and 1.2 support
MIME attachments
WS-Addressing support
WSDL based and XBean based deployment An example from b) is given by the Servicemix-camel component for using Apache Camel. Camel provides a full set of Enterprise Integration Patterns and flexible routing and transformation in both Java code and Spring XML to route services on the normalized message router. The ServiceMix Quartz component is a standard JBI Service Engine able to schedule and trigger jobs using the Quartz scheduler. Quartz, a full-featured, open source job scheduling service, can be used to create simple or complex schedules.
Figure 1 Overview of Apache ServiceMix architecture. The top layer describes some of the
service engines available in ServiceMix (BPEL, XSLT and methods for rule and script execution), while the bottom layer describes the binding components. Figure from Apache
Website (see http://servicemix.apache.org/is-servicemix-the-right-esb-for-me.html)
8 http://servicemix.apache.org/home.html
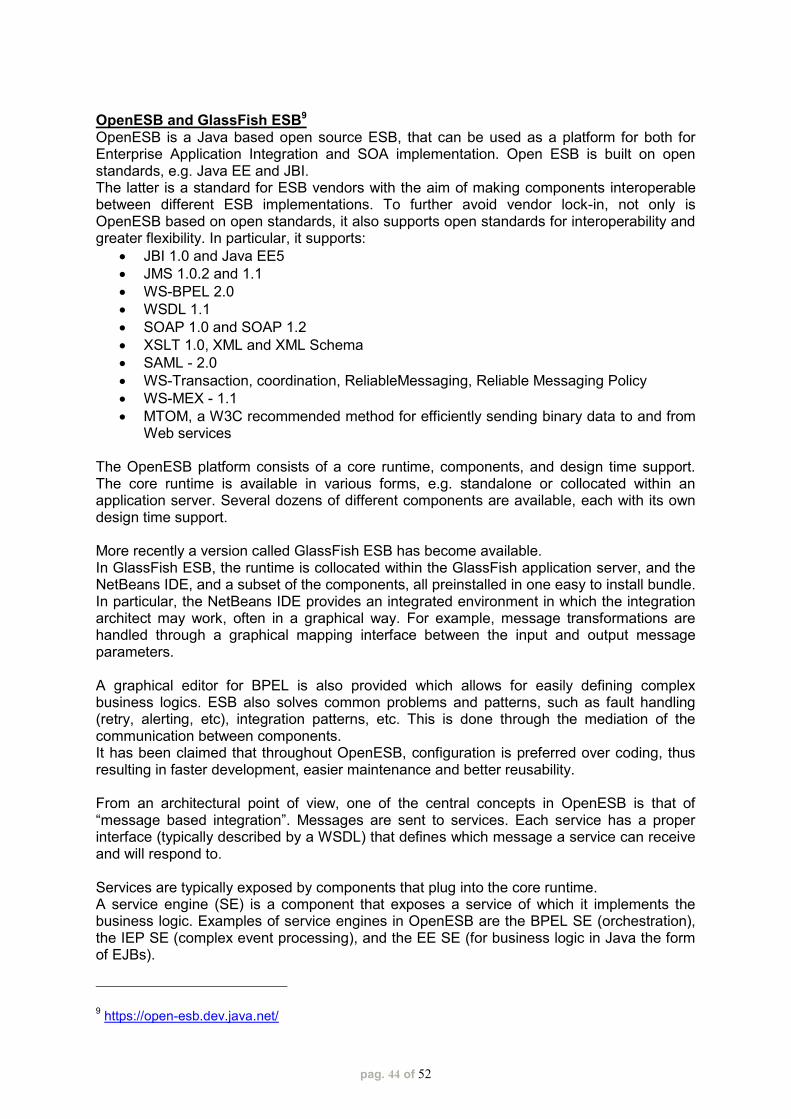
pag. 44 of 52
OpenESB and GlassFish ESB9 OpenESB is a Java based open source ESB, that can be used as a platform for both for Enterprise Application Integration and SOA implementation. Open ESB is built on open standards, e.g. Java EE and JBI. The latter is a standard for ESB vendors with the aim of making components interoperable between different ESB implementations. To further avoid vendor lock-in, not only is OpenESB based on open standards, it also supports open standards for interoperability and greater flexibility. In particular, it supports:
JBI 1.0 and Java EE5
JMS 1.0.2 and 1.1
WS-BPEL 2.0
WSDL 1.1
SOAP 1.0 and SOAP 1.2
XSLT 1.0, XML and XML Schema
SAML - 2.0
WS-Transaction, coordination, ReliableMessaging, Reliable Messaging Policy
WS-MEX - 1.1
MTOM, a W3C recommended method for efficiently sending binary data to and from Web services
The OpenESB platform consists of a core runtime, components, and design time support. The core runtime is available in various forms, e.g. standalone or collocated within an application server. Several dozens of different components are available, each with its own design time support. More recently a version called GlassFish ESB has become available. In GlassFish ESB, the runtime is collocated within the GlassFish application server, and the NetBeans IDE, and a subset of the components, all preinstalled in one easy to install bundle. In particular, the NetBeans IDE provides an integrated environment in which the integration architect may work, often in a graphical way. For example, message transformations are handled through a graphical mapping interface between the input and output message parameters. A graphical editor for BPEL is also provided which allows for easily defining complex business logics. ESB also solves common problems and patterns, such as fault handling (retry, alerting, etc), integration patterns, etc. This is done through the mediation of the communication between components. It has been claimed that throughout OpenESB, configuration is preferred over coding, thus resulting in faster development, easier maintenance and better reusability. From an architectural point of view, one of the central concepts in OpenESB is that of “message based integration”. Messages are sent to services. Each service has a proper interface (typically described by a WSDL) that defines which message a service can receive and will respond to. Services are typically exposed by components that plug into the core runtime. A service engine (SE) is a component that exposes a service of which it implements the business logic. Examples of service engines in OpenESB are the BPEL SE (orchestration), the IEP SE (complex event processing), and the EE SE (for business logic in Java the form of EJBs).
9 https://open-esb.dev.java.net/
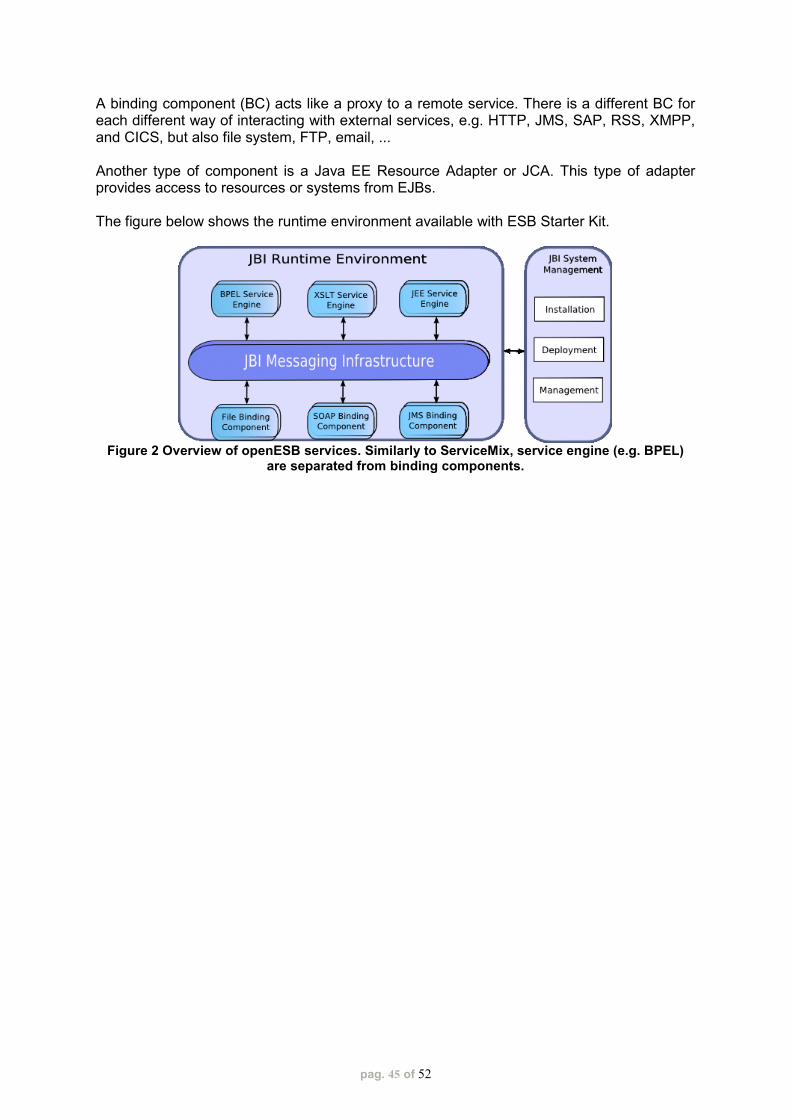
pag. 45 of 52
A binding component (BC) acts like a proxy to a remote service. There is a different BC for each different way of interacting with external services, e.g. HTTP, JMS, SAP, RSS, XMPP, and CICS, but also file system, FTP, email, ... Another type of component is a Java EE Resource Adapter or JCA. This type of adapter provides access to resources or systems from EJBs. The figure below shows the runtime environment available with ESB Starter Kit.
Figure 2 Overview of openESB services. Similarly to ServiceMix, service engine (e.g. BPEL)
are separated from binding components.

pag. 46 of 52
6. ARGO EDSS Implementation Roadmap
_______________________________
The functional specifications so far detailed show that ARGO EDSS is a complex subsystem of ARGOMARINE, which needs to be strongly interconnected to the other platform components in order to receive data, orchestrate workflows and provide users with information useful for optimal management of resources and effective response to marine pollution events. For this reason, ARGO EDSS can fully show its potential only when integrated with other ARGOMARINE subsystems. However, in accordance with the project timeline, it has been planned to follow a roadmap towards the full implementation of ARGO EDSS that could also provide preliminary results and mock up at an earlier stage of the project. In particular, after studying the models and methods for the provision of decision support services, it has been chosen to start implementing an ARGO EDSS prototype endowed with graphical user interfaces but based on simplified models and providing a subset of the foreseen functionalities. Such first prototype may serve as a core ARGO EDSS implementation to be extended and refined to lead to the final full-fledged version expected for month 30 (according to the project GANTT, see Annex I, “Description of Work”).
The roadmap that is being followed for the implementation of a) Environmental Risk Analysis Models and b) the Resource Management Service is detailed below.
a) Environmental Risk Analysis Models
Preliminary analysis of models for risk analysis. State of the art of methods
and implementation tools for risk analysis and for the generation of dynamic
risk maps were studied.
Development of methods for numerical simulation in a rapid prototyping
environment. Using simulated data, regarding the density of ship traffic, as
input numerical simulations using various risk models were run. Matlab was
chosen as developing framework to quickly lead to prototypes. Such
prototypes were used to select a first list of the most promising models for risk
assessment. Matlab code, in addition, may be later ported to other
programming frameworks suitable for production use.
Design of the graphical front-end and integration issues with web map
servers. Methods for provdiing the user with dynamic risk maps in an easy-
navigable and easy-to-use web framework were studied. In particular, it has
been chosen to integrate the computed dynamic risk map as a layer in a web
application powered by a web map server and Openlayer script library.
Early prototype of Dynamic Risk Map. Using the already designed framework,
a first prototype of dynamic risk map was implemented. The prototype uses
simulated AIS data and buoys monitoring coverage information for building a
map showing the density of ship traffic versus the strength of monitoring
resources. A simplified model assuming isotropic influence areas for both
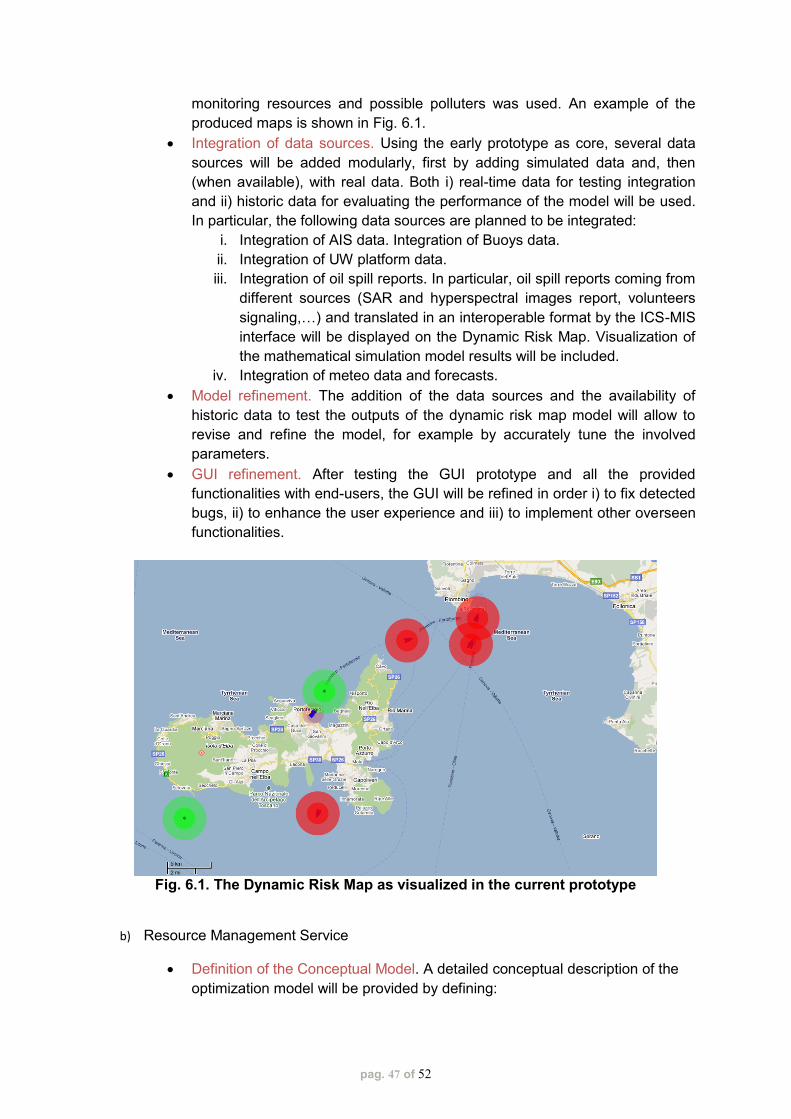
pag. 47 of 52
monitoring resources and possible polluters was used. An example of the
produced maps is shown in Fig. 6.1.
Integration of data sources. Using the early prototype as core, several data
sources will be added modularly, first by adding simulated data and, then
(when available), with real data. Both i) real-time data for testing integration
and ii) historic data for evaluating the performance of the model will be used.
In particular, the following data sources are planned to be integrated:
i. Integration of AIS data. Integration of Buoys data.
ii. Integration of UW platform data.
iii. Integration of oil spill reports. In particular, oil spill reports coming from
different sources (SAR and hyperspectral images report, volunteers
signaling,…) and translated in an interoperable format by the ICS-MIS
interface will be displayed on the Dynamic Risk Map. Visualization of
the mathematical simulation model results will be included.
iv. Integration of meteo data and forecasts.
Model refinement. The addition of the data sources and the availability of
historic data to test the outputs of the dynamic risk map model will allow to
revise and refine the model, for example by accurately tune the involved
parameters.
GUI refinement. After testing the GUI prototype and all the provided
functionalities with end-users, the GUI will be refined in order i) to fix detected
bugs, ii) to enhance the user experience and iii) to implement other overseen
functionalities.
Fig. 6.1. The Dynamic Risk Map as visualized in the current prototype
b) Resource Management Service
Definition of the Conceptual Model. A detailed conceptual description of the
optimization model will be provided by defining:
pag. 48 of 52
i. the resources with their structural characterization, in terms of data
collected, and peculiarities about their management (e.g., data
acquisition rate, location, …)
ii. the objectives of the model in terms of information to be acquired and
area to be monitored
iii. the constraints, dependent on physical and structural properties of the
resources and on limitations of their usage by the system
iv. the decision variables, related to the situation at hand to be monitored,
i.e. how to cover an area and how to get the information needed.
Creation of the Analytical Model. The conceptual model will be, then,
translated into an analytical model by choosing the most suitable encoding
formalism. In this regard, according to the complexity of the optimization
problem modelled, simple an encoding strategy based on a tree-like structure
where branches correspond to different choices for the allocation of
resources, or more complex approaches based on constraint-programming or
inferential reasoning on a base of complex rules will be evaluated.
Implementation. Finally, the analytical model will be implemented and tested
for making the final refinements.
pag. 49 of 52
7. Bibliography _______________________________
Cocco M., Colantonio S., D'Acunto M., Martinelli M., Moroni D., Pieri G., Salvetti O., Tampucci M. Geomatrix model as new tool for improving oil spill surveillance. Accepted to: CICC-ITOE - International Conference on Ocean Engineering (Macau, China, 6 Marzo 2011).
Cortes U., Sanchez-Marrè M.,Ceccaroni L., R-Roda I. and Poch M., 2000. “Artificial Intelligence and Environmental Decision Support Systems”, Applied Intelligence, 12, 77–91.
M.S. Eide, Ø. Endresen, P.O. Brett, J.L. Ervik, K. Røang, “Intelligent ship traffic monitoring for oil spill prevention: Risk based decision support buildings on AIS,” Marine Pollution Bulletin, vol. 54, pp.145-148, 2007.
Fedra K., 1998. “Integrated risk assessment and management: overview and state-of-the-art”, Journal of Hazardous Materials, 61, 5–22.
Fedra K., 2000. Environmental Decision Support Systems: A Conceptual Framework and Application Examples. Ph.D. Thesis, University of Geneva, 368 pp.
Fedra K. and Winkelbauer L., 2002. “A Hybrid Expert System, GIS, and Simulation Modeling for Environmental and Technological Risk Management”, Computer-Aided Civil and Infrastructure Engineering, 17, 131–146.
A. Jernelöv, “How to defend against future oil spills”, Nature 466, pp. 182-183, July 2010
S. Kaplan, “The words of risk analysis,” Risk Analysis, vol. 17, no. 2, pp. 407-417, March 1997.
Mansfield, R.M. and Moohan, J.A.J. “The evaluation of land remediation methods”, Land Contamination & Reclamation, 10 (1), pp. 25-31, 2002
H. Mpimpas, P. Anagnostopoulos, and J. Ganoulis, “Modelling of toxicants distribution in Thermaikos Gulf,” in Proceedings of the Fifth International Conference on Hydroinformatics, Cardiff, UK, IWA Publishing, pp. 457-463, 2002.
A. Pownuk, “Numerical solutions of fuzzy Partial Differential Equations” in Fuzzy Partial Differential Equations and Relational Equations and its application in Computational Mechanics,” Nikravesh, Zadeh, Kroptkin, eds, Springer-Verlag, vol. 142, pp.308-347, 2004.
Rademakers T. and Dirksen J., 2008. Open-Source ESBs in Action: Example Implementations in Mule and ServiceMix. Publisher: Manning Publications Co., Greenwich, CT.
Rizzoli A.E. and Young W.J., 1997. “Delivering environmental decision support systems: software tools and techniques”, Environmental Modelling & Software, 12:2-3, 237-249.

pag. 50 of 52
Sullivan, T. 2002. Evaluation of Environmental Decision Support Tools. Environmental and Waste Technology Division, Brookhaven National Laboratory.
P. Szwed, J.R. van Dorp, J.R.W. Mererick, T.A. Mazzuchi, and A. Singh, “A Bayesian paired comparison approach for relative accident probability with covariate information,” European Journal of Operative Research, vol. 169, pp. 157-177, 2006.
van Dorp, J.R. Merrick, J.R.W.: “On a risk management analysis of oil spill risk using maritime transportation system simulation,” Annals of Operations Research, available on line 12 December 2009, http://www.seas.gwu.edu/~dorpjr/Publications/JournalPapers/ANOR2009-2.pdf. M West and J. Harrison, Bayesian Forecasting and Dynamic Models, Springer-Verlag, 1989.

pag. 51 of 52
List of abbreviations
ARGO EDSS ARGOMARINE Environmental Decision Support System
ARGO-G ARGO-Geomatrix
ARGOMARINE MIS Marine Information System
AUV Autonomous Underwater Vehicle
BPEL Business Process Execution Language
DSS Decision Support System
EAI Enterprise Application Integration
EDA Event Driven Architecture
EDSS Environmental Decision Support System
EJB Enterprise JavaBeans
EMSA European Maritime Safety Agency
ENVIS Environmental Information System
ESA European Space Agency
ESB Enterprise Service Bus
ETL Extract, Transform and Load
GIS Geographic Information System
GNSS Global Navigation Satellite System
GPL GNU General Public License
GSE GMES Service Element
GSM Global System for Mobile Communications
GUI Graphical User Interface
ICS Integrated Communication System
IDE Integrated development environment
IST Information Society Technologies
JBI Java Business Integration
JCA Java EE Connector Architecture
JDBC Java Database Connectivity
JMS Java Message Service
JMX Java Management Extensions
JNDI Java Naming and Directory Interface
JSP Java Server Pages
LGPL GNU Lesser General Public License
MDX MultiDimensional eXpressions Language
MIS Marine Information System
OLAP On-Line Analytical Processing
OMG Object Management Group
PC Production Centre
PU Production Unit
RMS Resource Management Service
SAR Synthetic Aperture Radar
SDI Spatial Data Infrastructure
SDSs Simulation Data Services
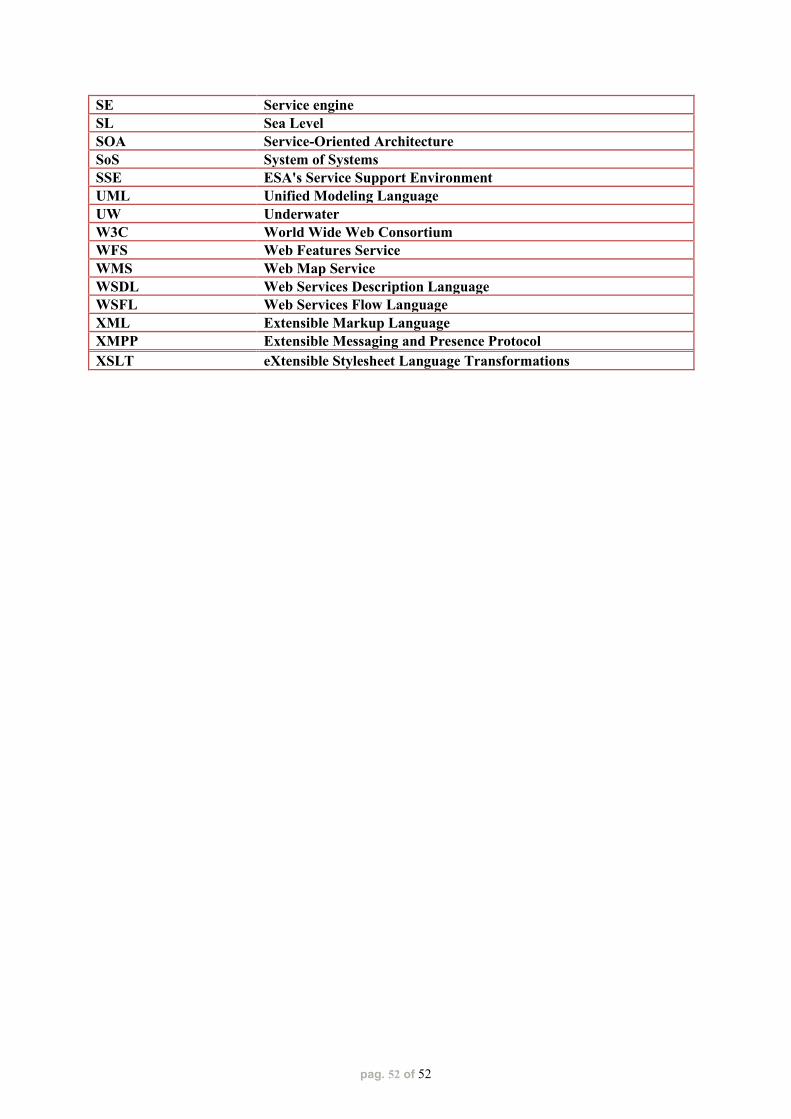
pag. 52 of 52
SE Service engine
SL Sea Level
SOA Service-Oriented Architecture
SoS System of Systems
SSE ESA's Service Support Environment
UML Unified Modeling Language
UW Underwater
W3C World Wide Web Consortium
WFS Web Features Service
WMS Web Map Service
WSDL Web Services Description Language
WSFL Web Services Flow Language
XML Extensible Markup Language
XMPP Extensible Messaging and Presence Protocol
XSLT eXtensible Stylesheet Language Transformations