model analyses and guidance (mag) web …mag.ncep.noaa.gov/docs/mag_users_manual.pdfmodel analyses...
TRANSCRIPT

MODEL ANALYSES AND GUIDANCE (MAG) WEB APPLICATION
MAG User’s Manual (Documentation Version 3.12)
September 2016
Prepared by: Systems Integration Branch/Software Development Team NCEP Central Operations NOAA

2
Table of Contents Introduction 3 Mag Home Page 4
Model Guidance Page 6 Model Guidance Parameter Page 10
Observations and Analyses 23
Upper Air (UAIR) 24 Skew-T 27 RTMA / RTMA-GUAM 32
Tropical Guidance 35

3
Introduction The Model Analysis and Guidance website displays GIF (Graphical Interchange Format) images of the output of NCEP’s weather prediction models; observational data in the form of SKEW-T and station plots; output from the Real Time Data Analysis model and hurricane model information when storms are active. The application runs in two environments:
1. The Weather and Climate Operational Supercomputer System (WCOSS) to consume gridded model data and produce images.
2. A public facing Web Server farm where web navigation code provides an organized interface
to the data and a set of bookmark able URLs that customers can use to directly access the latest images.
The Model Analyses and Guidance (MAG) website is available at http://mag.ncep.noaa.gov

4
MAG home page The MAG website’s Home page is shown in Figure 1. It presents the user with the choice of three categories: ● Model Guidance: Provides a path to view products created from the National Weather Service’s
(NWS) numerical model output including regional and global models.
● Observations and Analyses : Provides a path to view the Real-Time Mesoscale Analysis (RTMA) products, Upper Air(UAIR) Height Plots, and Upper Air Sounding Plots (Skew T plots)
● Tropical Guidance: Provides a path to view products created by the National Weather Service’s Tropical Cyclone models. These products are only available when tropical cyclones that meet stated criteria are active in the Atlantic or Pacific areas.
Site users can obtain a description for each category by hovering the mouse pointer over each selection. A text window appears further describing each category. The world map graphic displays a rectangle around each geographic area selected in the Model Guidance and Observations and Analyses pages. When a user clicks on the map, at the home page, a text box appears alerting the user to “Select Model Guidance, Observations and Analyses, or Tropical Guidance”. Users can access the following information by clicking the links below the world map or expanding the Website Information menu at the top right of the main page: ● Upcoming Changes – A list of changes, improvements and fixes to the site. These are most often
derived from requests and inquiries from our user community.
● Users Guide – This document.
● Frequently Asked Questions – A list of questions from our user community where issues are encountered that are outside the control of the web application programmer. These may be related to system configuration tips, or required software and browser plug-ins to quirks we have noted or that have been reported with a particular browser model or version.
● Product Description Document – A document describing the models themselves and the products, the combination of meteorological fields that comprise each product, and the geographic areas covered by each model.
A schedule of proposed changes and the latest news are available by clicking the link: “Check here for the latest news” near the top of the page, below the page title.

5
Figure 1: MAG home page

6
Model Guidance Page The user arrives at the Model Guidance page (Figure 2-1) by clicking on the ‘Model Guidance’ category from the home page (Figure 1). The Model Guidance page shows all currently available model areas and model types. To get a brief description of any of the model types or areas, hover the mouse pointer over the type or area name, and a tool tip will appear with the description. While hovering over an area or type, a box is shown on the world map, indicating the relevant area. Clicking either the Back or the Home Button returns to the MAG Home Page.
Figure 2-1: MAG Model Guidance page.

7
Clicking on an area name will turn the area name red, and the model types that include that area are shown in blue, while the model types that do not include that area are shown in light gray. Figure 2-2 shows how the Model Guidance page looks after the area, NAMER has been clicked. NAMER is red, and the relevant models (GFS, NAM, SREF, GEFS-SPAG, HAEFS, GEFS-MNSPRD, and RAP), are blue, while all other models are gray.
Figure 2-2: MAG Model Guidance page with Model Area NAMER selected.

8
If instead of clicking a model area, a model type is clicked, the model type will turn red. All of the model areas available for this model are shown in blue, while the model areas that are not available for this model are shown in light gray. Figure 2-3 shows how the Model Guidance page looks after the model type, GFS has been clicked. GRS is red, areas available for GFS (NAMER, SAMER, AFRICA, NPAC, EPAC, WNATL, ATLANTIC, POLAR, ALASKA, EUROPE, ASIA, SPAC, ARCTIC, and INDIA) are blue, and all other areas are gray
Figure 2-3: MAG Model Guidance page with Model Type GFS selected.

9
The 'Reset Selection(s)' button de-selects all model areas or model types that have been selected (clicked). All type and area links are then displayed in blue, the same as when the page is first shown. The model areas or types that are shown in gray are still clickable, but they reset the available choices. For example, if you click on model type GFS, the area link for PR is shown in gray, because the GFS model does not include that area. You can still click on PR, and then PR is then changed to red, and the model types available for that area are shown in blue: HRW-NMMB and HRW-ARW. (GFS will change to gray.) To move on to viewing products, click on the desired model type, and then click on an available model area (shown in blue). Or click on a model area, then a model type that is shown in blue. Once matching Model Area and Model Types are selected, the Model Guidance Parameter page for that model type and area is shown (see the next section). Note that when returning to the Model Guidance page, model area and model types that are shown in red indicate the previous choices.

10
Model Guidance Parameter Page After choosing the Model and Region from the Model Guidance page, the user is presented with the Model Guidance Parameter Page. Figure 3-1 shows the Model Guidance Parameter Page for the model, GFS, and the area, NAMER. Shown on the Model Guidance Parameter Page are: • A back button that returns to the Model Guidance Page. • A home button that returns to the MAG Home Page • The available model cycles. The cycles are displayed with the latest cycle as the default, displayed
on the right-most cell, and highlighted in red. To view the products from a previous cycle, click on the desired 'mm/dd/yyyy mm UTC' link. That link will turn red, and the page will show all the products generated for that cycle.
• The parameter names (or products) available for the selected Model and Area. • Radio buttons for selecting the desired image size (large, medium, or small). This choice is not
available for every model and area.
Figure 3-1: Parameter page for model GFS and region NAMER.
The available parameters are grouped into categories. Figure 3-1 shows four different categories: Precipitation Parameters, SFC-Layer Parameters, Upper Air Parameters, and Four Panel Charts. Click on one of the parameters to display the available forecast hours for that parameter. Figure 3-2 shows the Model Guidance Parameter page after precip_p01 has been selected. (Note that the term product refers to the same thing as parameter.)

11
Figure 3-2: Model Guidance Parameter Page with forecast hours for precip_p01.

12
The Model Guidance Parameter page adds the following additional information, once a parameter has been selected:
• A button labeled 'Open product description'. Click this button to display information on the parameter (product) that was selected. To close the product description, click the button again (which now says Close product description).
• A row with two 'TIME SELECT' options. These options are used to specify how to view forecast hour images: Single Time selection (one image), or Time Range Selection (user-specified start and ending times of a loop). This is a new feature that is described in detail in the next section.
• A table of forecast hours available for the selected parameter (product).
• Pre-defined loop links, 'Loop All', '1 Day', '2 Day', etc. Forecast hour and pre-defined looping links The table of forecast hours, and the pre-defined loops are shown as clickable links, or static text that is black or gray:
• A blue, clickable link indicates the image is available. Figure 3-2 shows forecast hours 001 through 213 are available, as well as 'Loop All', '1 Day', '2 Day', through '9 Day'.
• Black text indicates a forecast hour or predefined loop is valid for the model and area, but the model has not completed to the point of making the image for the forecast hour. The image should be available soon. Figure 3-2 shows forecast hours 216 - 240 are valid times for this product, but they are not yet available. Predefined loop '10 Day' is also not yet available, since images for day 10 have not been completed.
• Gray text indicates a forecast hour or predefined loop that is not valid for this product. Figure 3-2 shows forecast hour 000 is not valid for this product, as well as hours 252 - 3814, and loops '11 Day', '12 Day', through '16 Day.
Clicking on a pre-defined loop link will start the loop running. "Loop All" will loop all available images. "1 Day" will loop images from the first available forecast hour through one day. "2 Day" will loop from the first available forecast hour through the second day, etc. Clicking on a forecast hour link will either display the image for that hour, or select it for user-selected looping, depending on the Time Select mode, which is described in the next section. Some of the models are run more than once an hour, and the forecasts are presented as forecast hour : forecast minutes (hhh:mm). Figure 3-3 shows the forecast hours table for the HRRR model that produces 4 images per hour for some products. For the selected product in the figure, only one per hour is generated. The figure shows that forecast hours 001:00 through 008:00 are ready, while 009:00 through 015:00 are not yet completed. All of the 15, 30, and 45 minute forecast minutes are not valid.

13
Figure 3-3: HRRR Parameter page with available forecast hours & loops (once parameter is chosen) Time Select Modes The two TIME SELECT modes are used to specify how to view forecast hour images:
• Single Time Selection: provides the same functionality as the previous MAG version. When a forecast hour is clicked, the image for that forecast hour is displayed. This is the default mode.
• Time Range Selection: provides new functionality, where the user can select the looping time range, (the start and end forecast hour to use in the loop).
Since this is new feature, there is a (?) link next to 'TIME SELECT''. Click on the (?), and information on using the two modes is displayed. To close the help text, click (?) again, or click the Close button inside the help text. Single Time Selection Mode Figure 3-4 shows the Model Guidance Parameter Page with Cycles, Parameters, Time Select, Forecast Hour links, and pre-defined loops links, with the Time Select row circled. 'Single Time Selection' is displayed in red, indicating that the current Time Select mode is Single Time Selection. While in this mode, clicking on a forecast hour link displays the static image for that forecast hour.

14
Figure 3-4. Model Guidance Parameter Page, Single Time Selection mode.
Time Range Selection Mode When in Time Range Selection mode, clicking on the forecast hours sets the start and end hours, which will be used for looping. To set the Time Select mode to Time Range Selection, click the text 'Time Range Selection'. The text will turn red, and two additional buttons will appear: 'Clear', and 'Time Range Loop (____ - ____)' (See Figure 3-5). To set the start hour, click on a forecast hour, for example, 016. The 016 link turns red, and the 'Time Range Loop (____ - ____)' button changes to 'Time Range Loop (F016 - ____)' . This indicates a starting hour has been selected. Then select another forecast hour, for example, 058. The link 058 turns red, as well as all of the links between 016 and 058. The button changes to 'Time Range Loop (F016 - F058)' (see Figure 3.6). Clicking the Time Range Loop button will initiate an image looping page that starts at forecast hour 016 and ends with forecast hour 058.
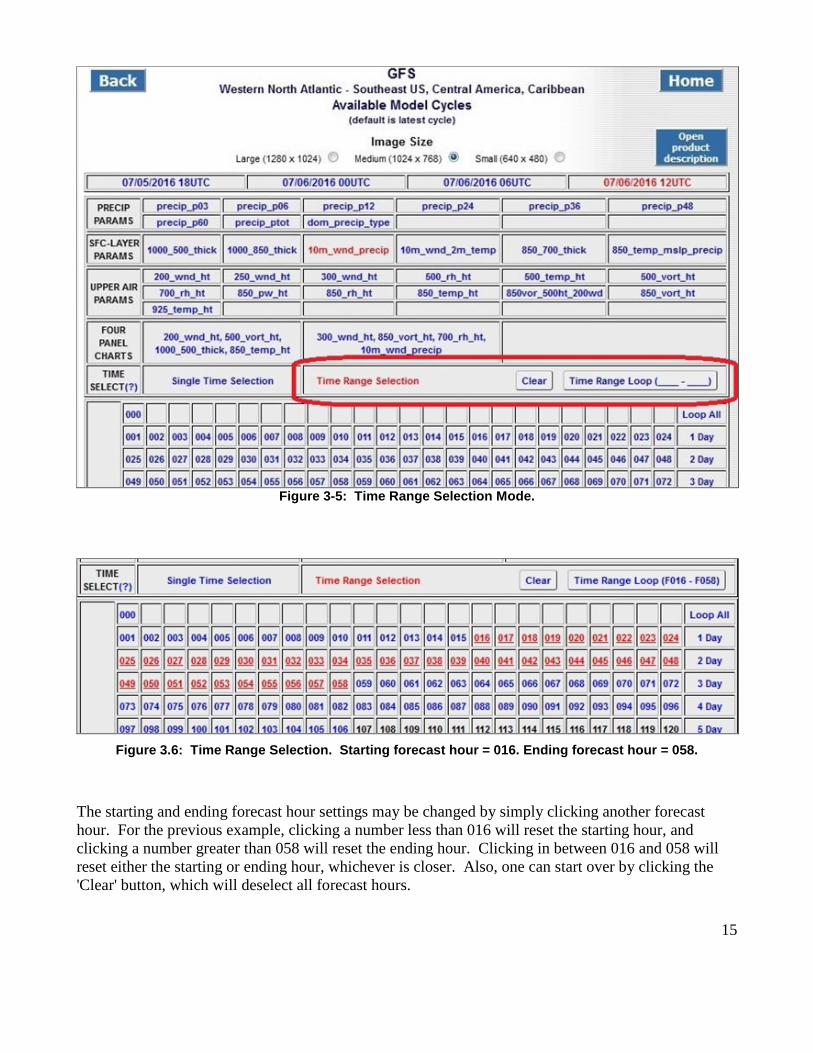
15
Figure 3-5: Time Range Selection Mode.
Figure 3.6: Time Range Selection. Starting forecast hour = 016. Ending forecast hour = 058.
The starting and ending forecast hour settings may be changed by simply clicking another forecast hour. For the previous example, clicking a number less than 016 will reset the starting hour, and clicking a number greater than 058 will reset the ending hour. Clicking in between 016 and 058 will reset either the starting or ending hour, whichever is closer. Also, one can start over by clicking the 'Clear' button, which will deselect all forecast hours.

16
While in Time Range Selection mode, the user can change to another product, and the software will keep the same loop range selections, if possible, i.e., if the new product has the same forecast hours available. Note: the pre-defined loops ('Loop All', '1 Day', etc) work the same in either Time Select mode. Single Image Graphics page Figure 4-1 shows the graphics page that is displayed when a forecast hour is clicked while in Single Time Selection Mode. In this example, forecast hour 009 was clicked. The Single Image Graphics page includes a Back button to return to the Model Guidance Parameter page, and a Home button to return to the MAG home page. The Next or Previous forecast hour image can be displayed by clicking the Next or Previous button. Shortcut keys may also be used: pressing the j key will display the previous image; pressing the k key will display the next image. Clicking the 'Zoom In' button will enlarge the image. Clicking the 'Zoom Out' button will reduce the image. Clicking the 'Normal button' will reset the image to the default size. Shortcut keys for zooming are p (zoom in), o (zoom out), and n (normal). If a product description is available then a blue “Open product description” button will be shown in the upper right hand section of the page. Click on the button to display a text box below the image. There will be a Close button along with the product description to click to close it. The static URL that can be used to bookmark and view the latest cycle of the image is provided just below the title of the page.

17
Figure 4-1: Graphics page for a selected forecast hour 009.
Four Panel Displays Some of the models and areas include four-panel displays. Four-panel products are located on the Model Guidance Parameter Page, located on a row labeled FOUR PANEL CHARTS (Figure 3-2 shows this). When a four-panel product is selected, then clicking on a forecast hour displays four images on the same page. Figure 4-2 shows forecast hour 009 for product 200_wnd_ht, 500_vort_ht, 1000_500_thick, 850_temp_ht. Next and Previous keys may be used, the same as for the single image display. Looping may also be started (described later).

18
The Back button returns to the Model Guidance Parameter page. The Home button returns to the MAG home page.
Figure 4-2: Four Panel Image Display.
19
Animation Pages
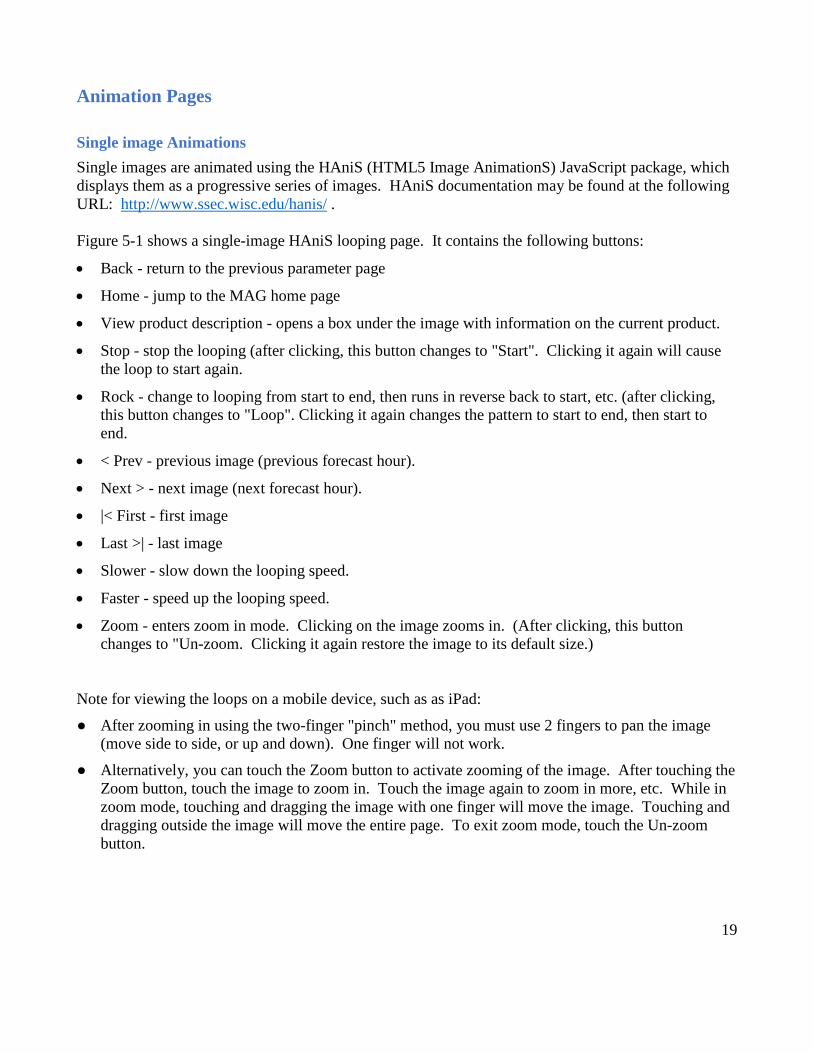
Single image Animations Single images are animated using the HAniS (HTML5 Image AnimationS) JavaScript package, which displays them as a progressive series of images. HAniS documentation may be found at the following URL: http://www.ssec.wisc.edu/hanis/ . Figure 5-1 shows a single-image HAniS looping page. It contains the following buttons:
• Back - return to the previous parameter page
• Home - jump to the MAG home page
• View product description - opens a box under the image with information on the current product.
• Stop - stop the looping (after clicking, this button changes to "Start". Clicking it again will cause the loop to start again.
• Rock - change to looping from start to end, then runs in reverse back to start, etc. (after clicking, this button changes to "Loop". Clicking it again changes the pattern to start to end, then start to end.
• < Prev - previous image (previous forecast hour).
• Next > - next image (next forecast hour).
• |< First - first image
• Last >| - last image
• Slower - slow down the looping speed.
• Faster - speed up the looping speed.
• Zoom - enters zoom in mode. Clicking on the image zooms in. (After clicking, this button changes to "Un-zoom. Clicking it again restore the image to its default size.)
Note for viewing the loops on a mobile device, such as as iPad:
● After zooming in using the two-finger "pinch" method, you must use 2 fingers to pan the image (move side to side, or up and down). One finger will not work.
● Alternatively, you can touch the Zoom button to activate zooming of the image. After touching the Zoom button, touch the image to zoom in. Touch the image again to zoom in more, etc. While in zoom mode, touching and dragging the image with one finger will move the image. Touching and dragging outside the image will move the entire page. To exit zoom mode, touch the Un-zoom button.

20
Figure 5-1: JavaScript Application to view the graphics in a loop

21
Four-Panel Image Animations The four-panel looping package was developed in-house, since HAniS can only loop one set of images. Users can start/stop the animation, step through one image at a time, jump to the first/last image, make the looping faster/slower, and reset to normal speed. Figure 4-2 shows a Four-Panel image looping page. It contains the following buttons:
• Back - return to the previous parameter page
• Home - jump to the MAG home page
• Stop - stop the looping (after clicking, this button changes to "Start". Clicking it again will cause the loop to start again. Shortcut key: spacebar.
• < Prev - previous image (previous forecast hour). Shortcut key: j or left arrow.
• Next > - next image (next forecast hour). Shortcut key: k or right arrow.
• |< First - first image. Shortcut key: <.
• Last >| - last image. Shortcut key: >
• Slower - slow down the looping speed. Shortcut key: o.
• Faster - speed up the looping speed. Shortcut key: p.
• Reset - returns looping to normal speed. Shortcut key: n. Note: Clicking or using shortcut keys for the following will stop animation: Stop, Prev, Next, First, Last.

22
Figure 5-2: Four-Panel Looping.

23
Observations and Analyses Users can choose the “Observations and Analyses” category from the MAG home page (Figure 1) to get to the Observations and Analyses page (Figure 6-1).
Figure 6-1: Observations and Analyses Page
The Observations and Analyses Page provides the user with three types for Obs/Analyses :
● UAIR (Upper Air)
● SKEWT (Skew-T plots)
● RTMA (Real Time Mesoscale Analysis)
● RTMA-GUAM (Real Time Mesoscale Analysis for the Guam region)

24
Upper Air (UAIR) When the user selects UAIR, the regions corresponding to Upper Air get highlighted in blue and the other regions are greyed out, as shown in Figure 6-2.
Figure 6-2: Observations and Analyses page for UAIR
To view the Upper Air Parameters, select a region of choice. Note: The user can also choose a region first, and the corresponding Obs/Analysis Type is highlighted in blue. The other types are “grayed out”.
25
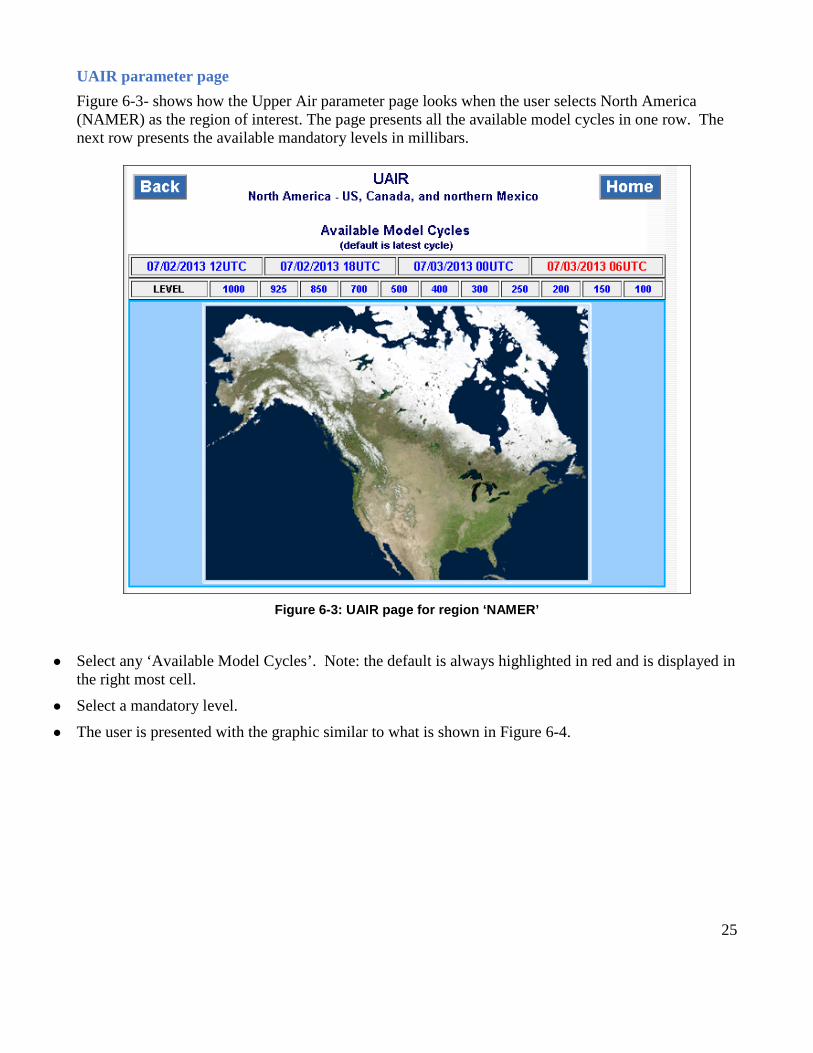
UAIR parameter page Figure 6-3- shows how the Upper Air parameter page looks when the user selects North America (NAMER) as the region of interest. The page presents all the available model cycles in one row. The next row presents the available mandatory levels in millibars.
Figure 6-3: UAIR page for region ‘NAMER’
● Select any ‘Available Model Cycles’. Note: the default is always highlighted in red and is displayed in the right most cell.
● Select a mandatory level.
● The user is presented with the graphic similar to what is shown in Figure 6-4.
26
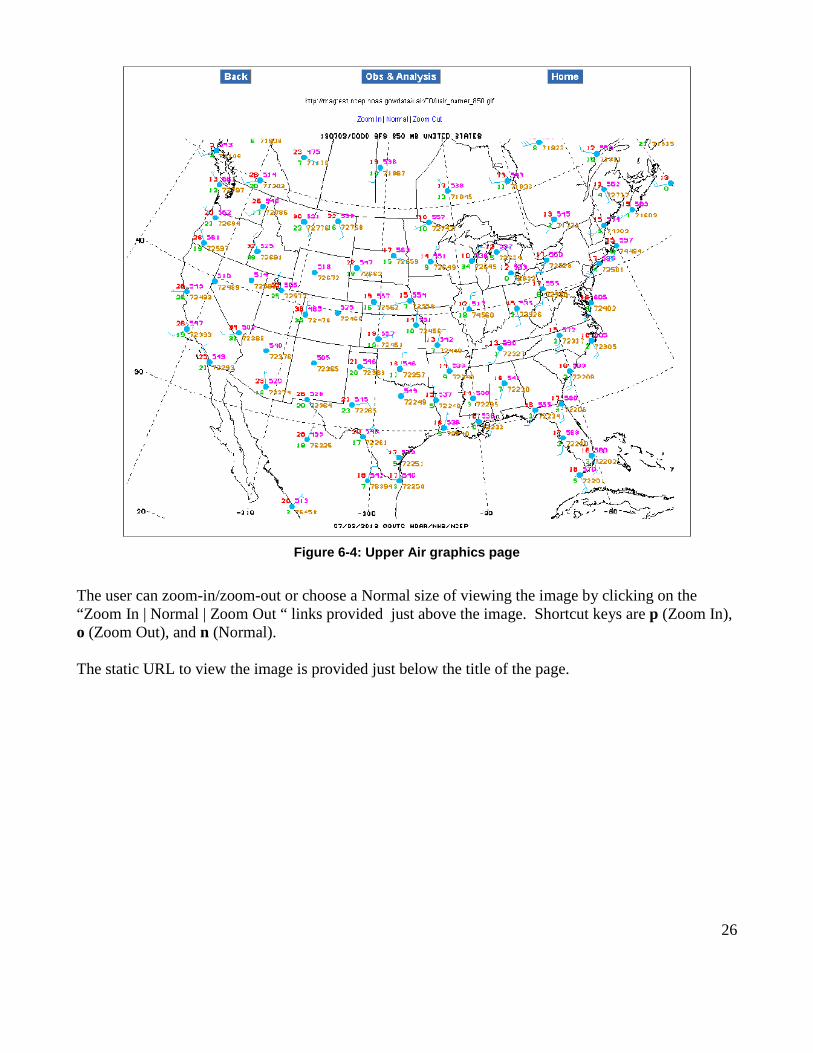
Figure 6-4: Upper Air graphics page
The user can zoom-in/zoom-out or choose a Normal size of viewing the image by clicking on the “Zoom In | Normal | Zoom Out “ links provided just above the image. Shortcut keys are p (Zoom In), o (Zoom Out), and n (Normal). The static URL to view the image is provided just below the title of the page.
27
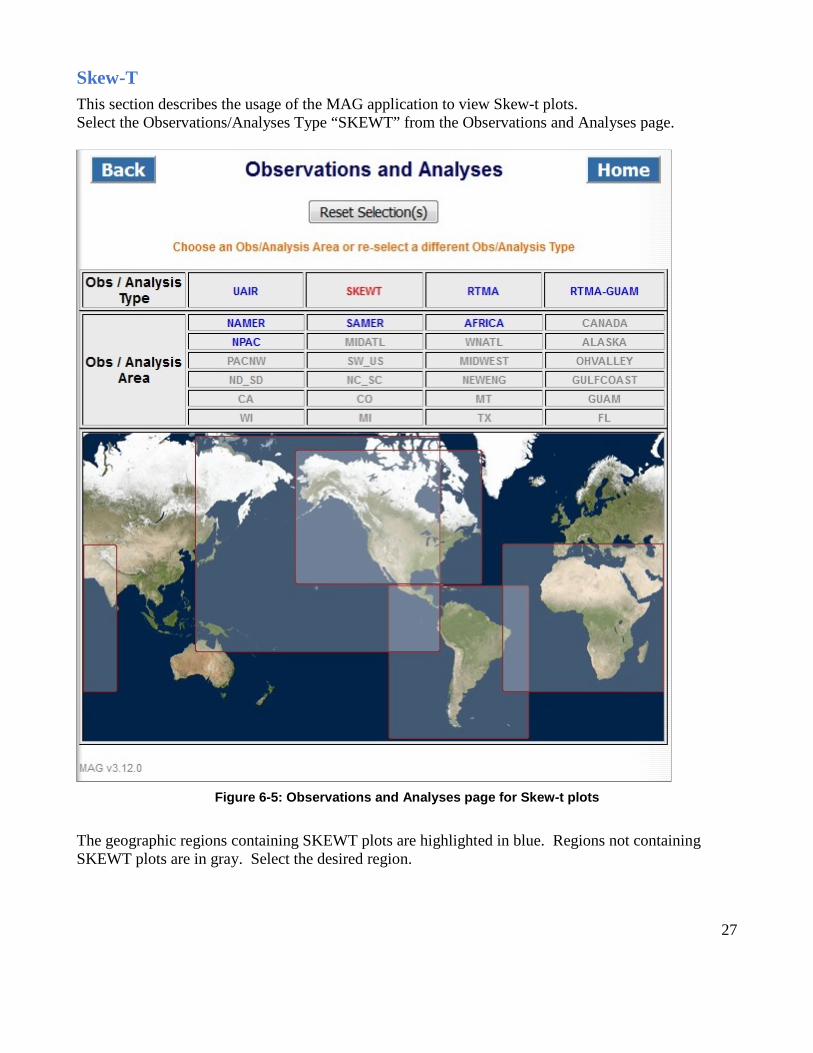
Skew-T This section describes the usage of the MAG application to view Skew-t plots. Select the Observations/Analyses Type “SKEWT” from the Observations and Analyses page.
Figure 6-5: Observations and Analyses page for Skew-t plots
The geographic regions containing SKEWT plots are highlighted in blue. Regions not containing SKEWT plots are in gray. Select the desired region.

28
Figure 6-6 shows the Skew-t page for region North America (NAMER). The page presents the available cycles, defaulting to the latest cycle, displayed in the right most cell and highlighted in red. Select the desired cycle, and the user is presented with the Skewt-T plot as shown in Figure 6-7.
Figure 6-6: Skew-T page for region “NAMER”

29
Figure 6-7: Skew-t plot
The user can click on the red dots, which represent various stations, to view the graphic. The user is presented with skew-t graphics as shown in Figure 6-8.

30
Figure 6-8: Skew-T graphics
Note: The display of Skew-T graphics available can be listed in a table rather than on a map. When the user chooses a desired cycle, click on the hypertext link “Display Table of Stations” to get a list of stations (as shown in Figure 6-9) instead of the regional map with red dots representing the various stations.

31
Figure 6-9: Station table for Skew-T graphics
The user can click on the station code to view the skew-T graphic.

32
RTMA/RTMA-GUAM When the user selects the ‘RTMA’ Obs/Analyses type from the Observations and Analyses page, the corresponding regions available for RTMA are highlighted in blue. The remaining regions are shown in gray. When the user selects a region of choice, the user is presented with the RTMA page as shown in Figure 6-10. RTMA-GUAM is another model type provided specifically for the Guam region. The user interface provided for the Guam region is the same the other regions for the RTMA model.
Figure 6-10: Observations and Analyses page for “RTMA”
33
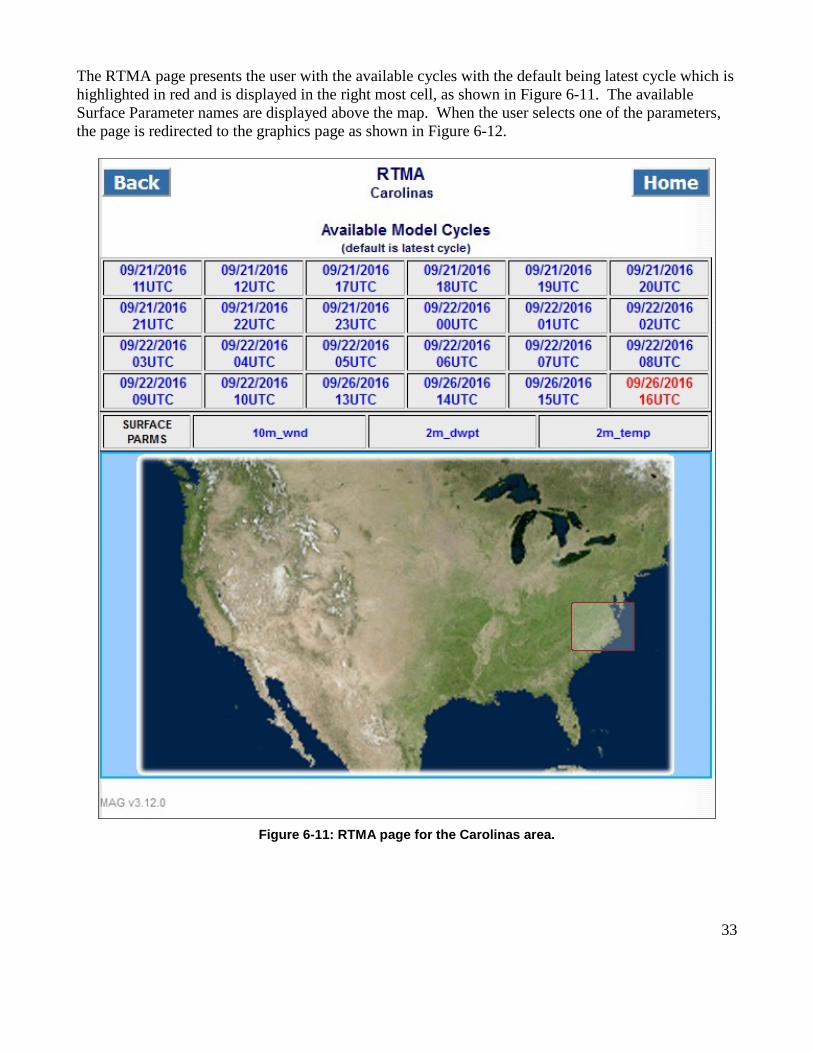
The RTMA page presents the user with the available cycles with the default being latest cycle which is highlighted in red and is displayed in the right most cell, as shown in Figure 6-11. The available Surface Parameter names are displayed above the map. When the user selects one of the parameters, the page is redirected to the graphics page as shown in Figure 6-12.
Figure 6-11: RTMA page for the Carolinas area.

34
Figure 6-12: RTMA graphics
The user can zoom-in/zoom-out or choose a Normal size of viewing the image by clicking on the “Zoom In | Normal | Zoom Out “ links provided just above the image. Shortcut keys are p (Zoom In), o (Zoom Out), and n (Normal). The static URL to view the image is provided just below the title of the page.
35
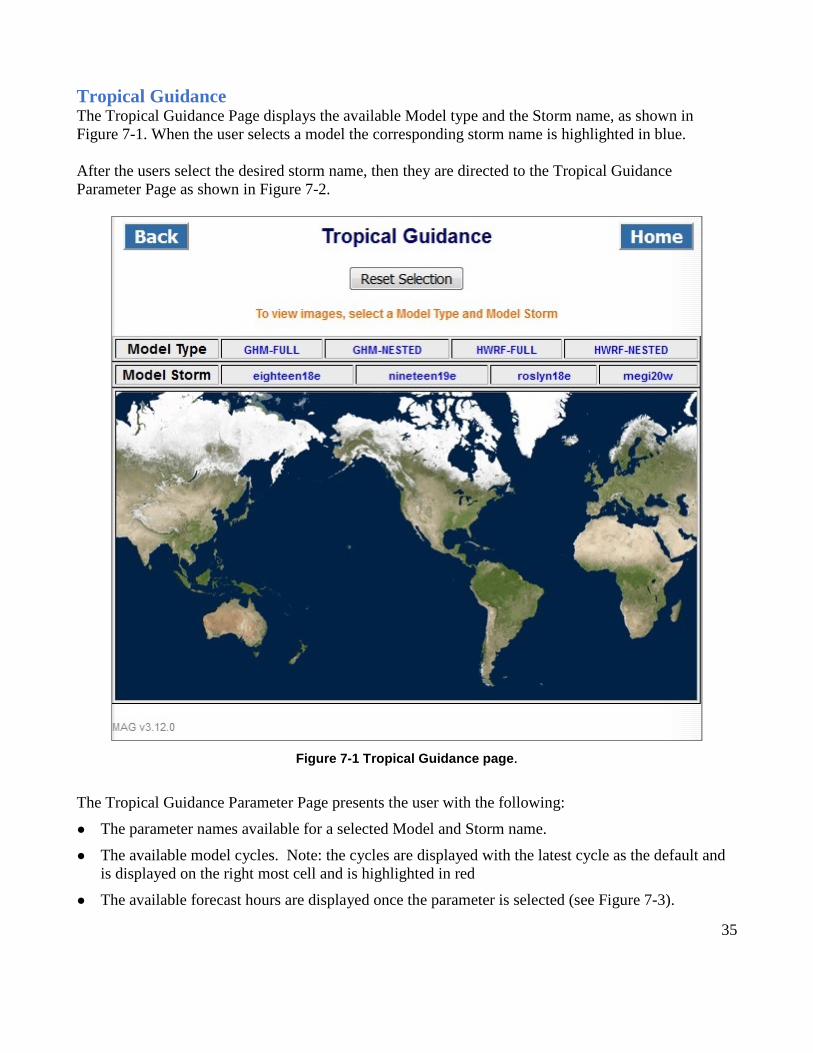
Tropical Guidance The Tropical Guidance Page displays the available Model type and the Storm name, as shown in Figure 7-1. When the user selects a model the corresponding storm name is highlighted in blue. After the users select the desired storm name, then they are directed to the Tropical Guidance Parameter Page as shown in Figure 7-2.
Figure 7-1 Tropical Guidance page.
The Tropical Guidance Parameter Page presents the user with the following:
● The parameter names available for a selected Model and Storm name.
● The available model cycles. Note: the cycles are displayed with the latest cycle as the default and is displayed on the right most cell and is highlighted in red
● The available forecast hours are displayed once the parameter is selected (see Figure 7-3).
36
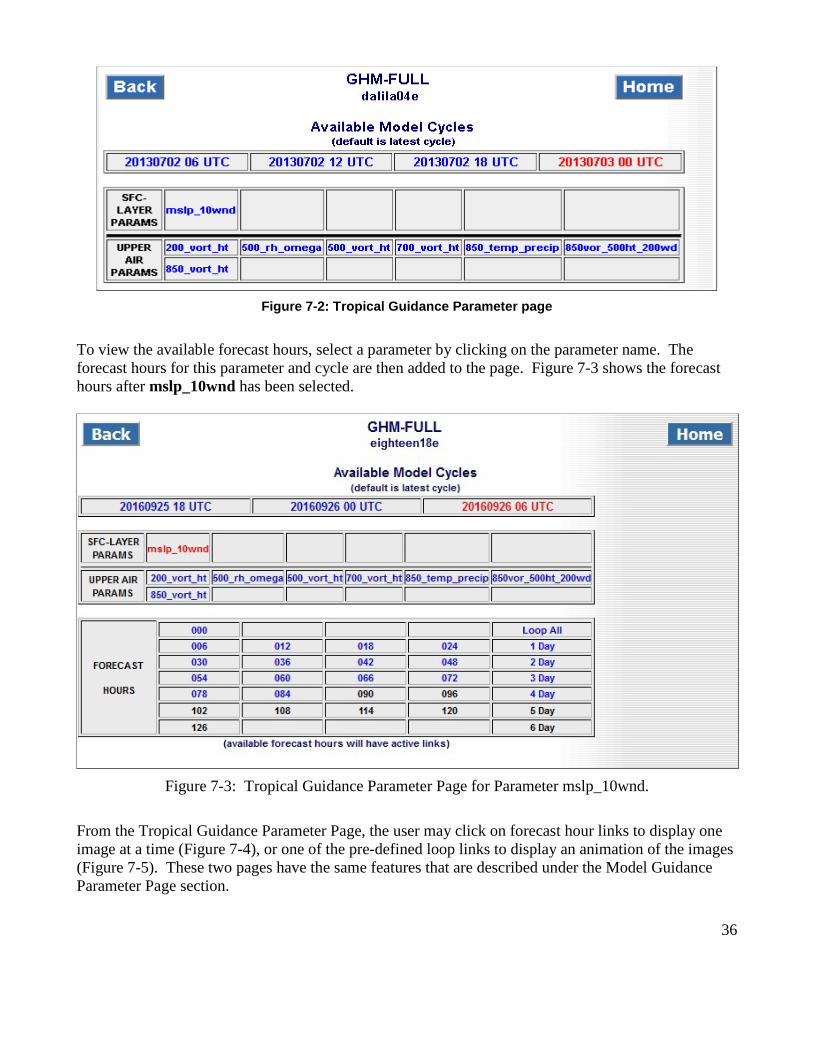
Figure 7-2: Tropical Guidance Parameter page
To view the available forecast hours, select a parameter by clicking on the parameter name. The forecast hours for this parameter and cycle are then added to the page. Figure 7-3 shows the forecast hours after mslp_10wnd has been selected.
Figure 7-3: Tropical Guidance Parameter Page for Parameter mslp_10wnd.
From the Tropical Guidance Parameter Page, the user may click on forecast hour links to display one image at a time (Figure 7-4), or one of the pre-defined loop links to display an animation of the images (Figure 7-5). These two pages have the same features that are described under the Model Guidance Parameter Page section.

37
Figure 7-4: Image page for Tropical Guidance parameter

38
Figure 7-5: JavaScript animation page for Tropical Guidance parameter
When there are no active storms a page will be displayed notifying the user that no storms are available at this time.