modal damping of a quad pendulum for a dvanced gravitational wave detectors
DESCRIPTION
Modal Damping of a Quad Pendulum for A dvanced Gravitational Wave Detectors. Brett Shapiro Nergis Mavalvala Kamal Youcef-Toumi ACC 2012 – Montreal June 27 Massachusetts Institute of Technology. Abstract. - PowerPoint PPT PresentationTRANSCRIPT

G1200694 - ACC 2012 - 27 June
Modal Damping of a Quad Pendulum for Advanced Gravitational Wave Detectors
Brett ShapiroNergis Mavalvala
Kamal Youcef-ToumiACC 2012 – Montreal
June 27
Massachusetts Institute of Technology

2
AbstractMotivation: Observe gravitational waves from astrophysical
sources (supernovae, pulsars, black hole mergers, etc) using the LIGO observatories.
Problem: Multi-DOF isolation systems enhance ground motion at high Q resonances. Damped using active feedback. This control introduces additional noise. Optimal control required achieve adequate trade-off.
Solution: Modal damping to simplify and decouple optimization of each mode’s damping. Also permits real-time tuning.
G1200694 - ACC 2012 - 27 June
3
Outline
1. LIGO and gravitational waves2. Seismic (vibration) isolation3. Competing damping control goals4. Method of modal damping5. Optimization of modal damping6. Results
G1200694 - ACC 2012 - 27 June
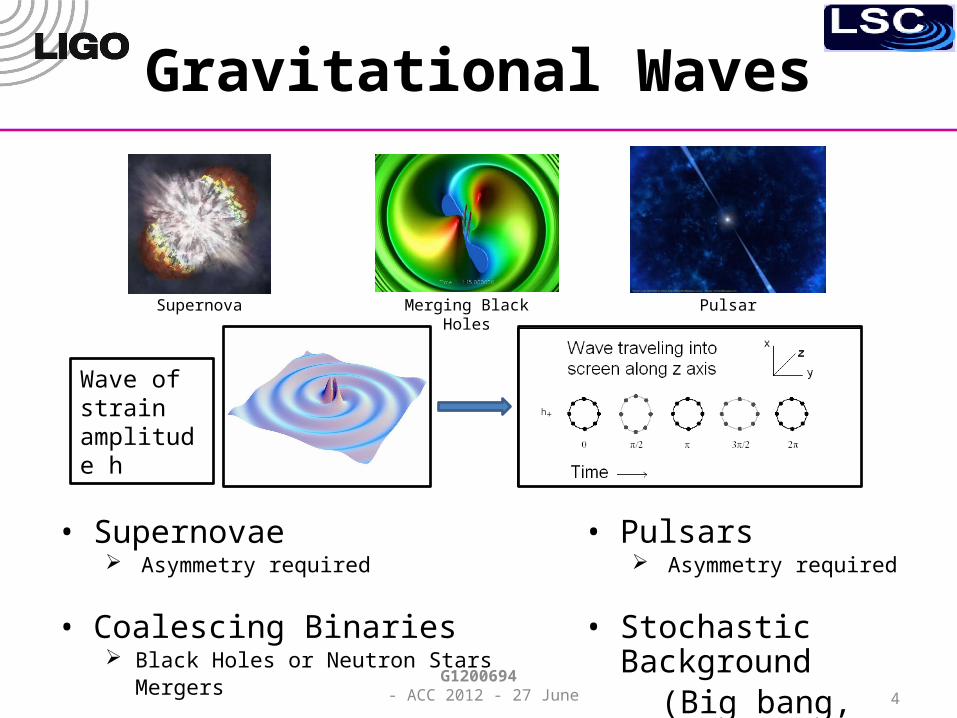
PulsarSupernova Merging Black Holes
• Supernovae Asymmetry required
• Coalescing Binaries Black Holes or Neutron Stars
Mergers
• Pulsars Asymmetry required
• Stochastic Background (Big bang, etc.)
Gravitational Waves
Wave of strain amplitude h
4G1200694
- ACC 2012 - 27 June
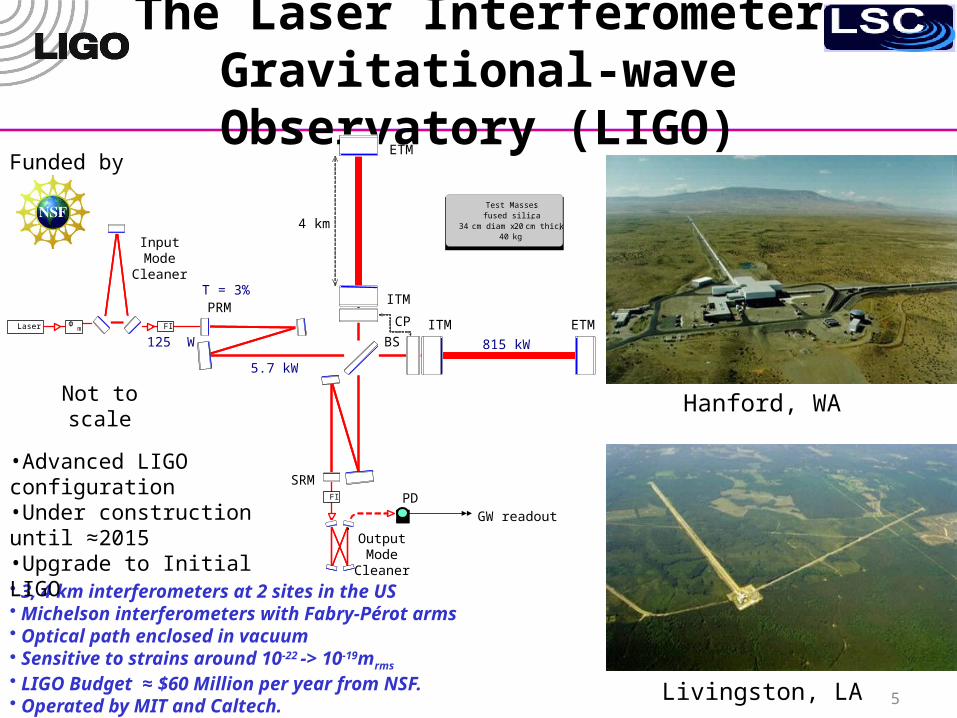
The Laser InterferometerGravitational-wave Observatory (LIGO)
Livingston, LA
Hanford, WA
• 3, 4 km interferometers at 2 sites in the US• Michelson interferometers with Fabry-Pérot arms• Optical path enclosed in vacuum• Sensitive to strains around 10-22 -> 10-19mrms• LIGO Budget ≈ $60 Million per year from NSF. • Operated by MIT and Caltech.
Funded by
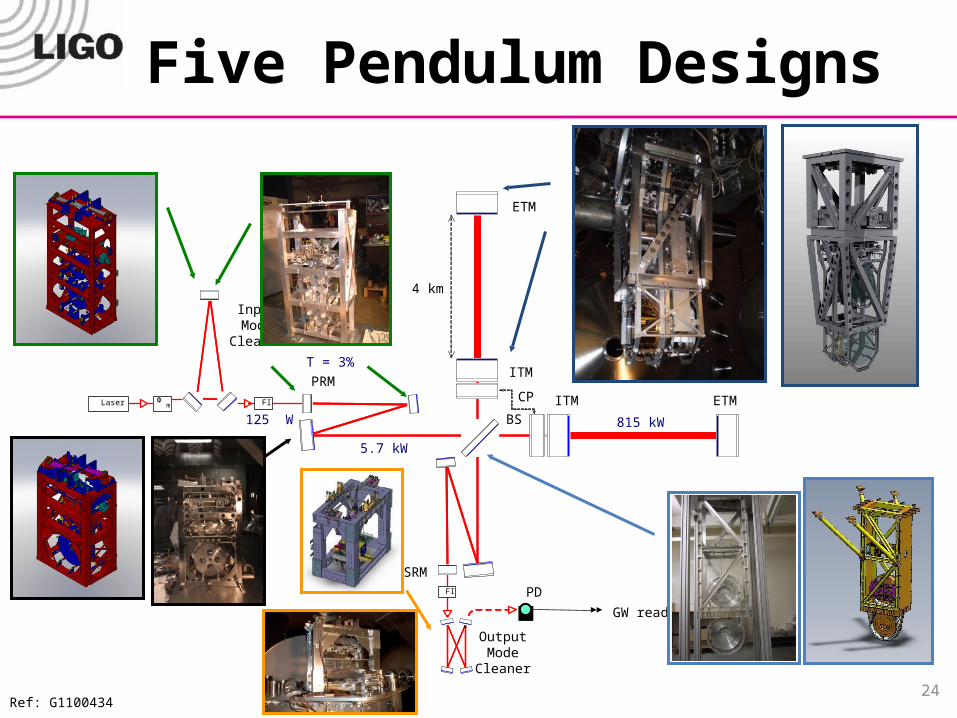
FI
Test Masses:fused silica,
34 cm diam x 20 cm thick,40 kg
SRM
ITM
ETM
InputMode
Cleaner
OutputMode
Cleaner
PRM
BS
4 km
T = 3%
Laser Φ m
PDGW readout
FI
ITM ETM125 W
5.7 kW
815 kW
CP
Not to scale
5
•Advanced LIGO configuration•Under construction until ≈2015•Upgrade to Initial LIGO

If we put LIGO in Cambridge, MA
LIGO spans 16 km2. Cambridge, MA covers 16.65 km2 (wikipedia http://en.wikipedia.org/wiki/Cambridge,_Massachusetts). 6
Kenmore Square
MIT
Harvard
MGH
Porter Square

7
LIGO Scientific CollaborationAustralian Consortiumfor InterferometricGravitational AstronomyThe Univ. of AdelaideAndrews UniversityThe Australian National Univ.The University of BirminghamCalifornia Inst. of TechnologyCardiff UniversityCarleton CollegeCharles Sturt Univ.Columbia UniversityCSU FullertonEmbry Riddle Aeronautical Univ.Eötvös Loránd UniversityUniversity of FloridaGerman/British Collaboration forthe Detection of Gravitational WavesUniversity of GlasgowGoddard Space Flight CenterLeibniz Universität HannoverHobart & William Smith CollegesInst. of Applied Physics of the Russian Academy of SciencesPolish Academy of SciencesIndia Inter-University Centrefor Astronomy and AstrophysicsLouisiana State UniversityLouisiana Tech UniversityLoyola University New OrleansUniversity of MarylandMax Planck Institute for Gravitational Physics
University of MichiganUniversity of MinnesotaThe University of MississippiMassachusetts Inst. of TechnologyMonash UniversityMontana State UniversityMoscow State UniversityNational Astronomical Observatory of JapanNorthwestern UniversityUniversity of OregonPennsylvania State UniversityRochester Inst. of TechnologyRutherford Appleton LabUniversity of RochesterSan Jose State UniversityUniv. of Sannio at Benevento, and Univ. of SalernoUniversity of SheffieldUniversity of SouthamptonSoutheastern Louisiana Univ.Southern Univ. and A&M CollegeStanford UniversityUniversity of StrathclydeSyracuse UniversityUniv. of Texas at AustinUniv. of Texas at BrownsvilleTrinity UniversityTsinghua UniversityUniversitat de les Illes BalearsUniv. of Massachusetts AmherstUniversity of Western AustraliaUniv. of Wisconsin-MilwaukeeWashington State UniversityUniversity of Washington
ACC 2012 - 27 June 8
100
101
10210
-2110
-2010-1910-18
10-1710-1610-15
10-1410-1310-12
10-11
10-10
10-9
10-810-710-6
Frequency (Hz)
Dis
plac
emen
t Sen
sitiv
ity (m
/ H
z)
Advanced LIGO Goal
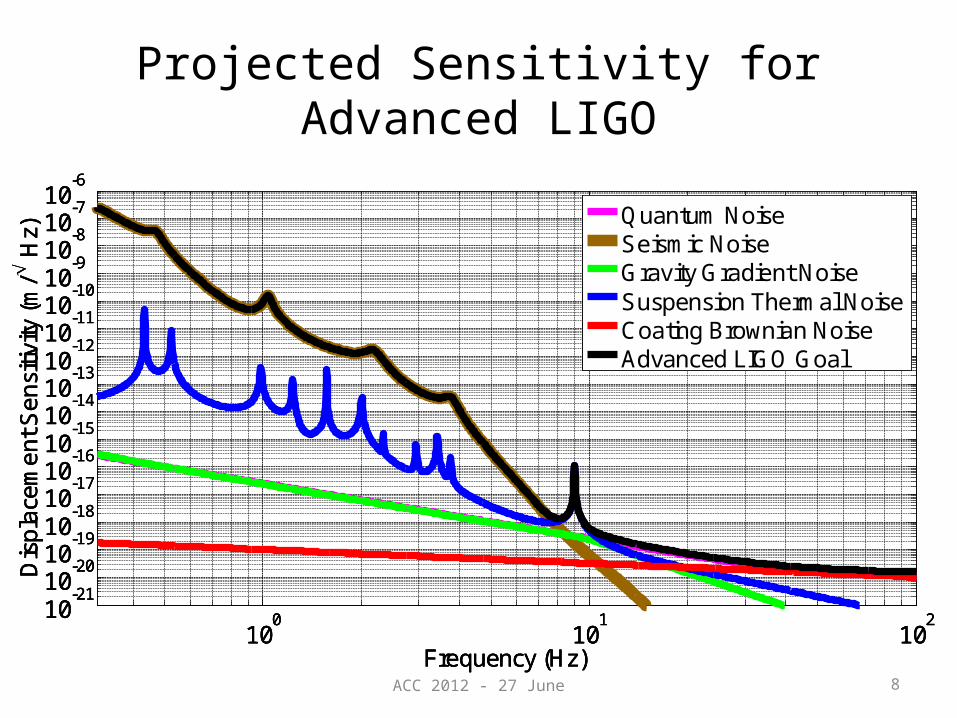
Projected Sensitivity for Advanced LIGO
100
101
10210
-2110
-2010-1910-18
10-1710-1610-15
10-1410-1310-12
10-11
10-10
10-9
10-810-710-6
Frequency (Hz)
Dis
plac
emen
t Sen
sitiv
ity (m
/ H
z)
Quantum NoiseSeismic NoiseGravity Gradient NoiseSuspension Thermal NoiseCoating Brownian NoiseAdvanced LIGO Goal
100
101
10210
-2110
-2010-1910-18
10-1710-1610-15
10-1410-1310-12
10-11
10-10
10-9
10-810-710-6
Frequency (Hz)
Dis
plac
emen
t Sen
sitiv
ity (m
/ H
z)
Quantum NoiseSeismic NoiseGravity Gradient NoiseSuspension Thermal NoiseCoating Brownian NoiseAdvanced LIGO Goal

ACC 2012 - 27 June 9
Suspensions and Seismic Isolation
active isolation platform (2 stages
of isolation)
hydraulic external pre-isolator (HEPI) (one
stage of isolation)
quadruple pendulum (four stages of isolation) with
monolithic silica final stage
Advanced LIGO test mass isolation
Ref: LIGO-G1000469-v1; Kissel PhD thesis
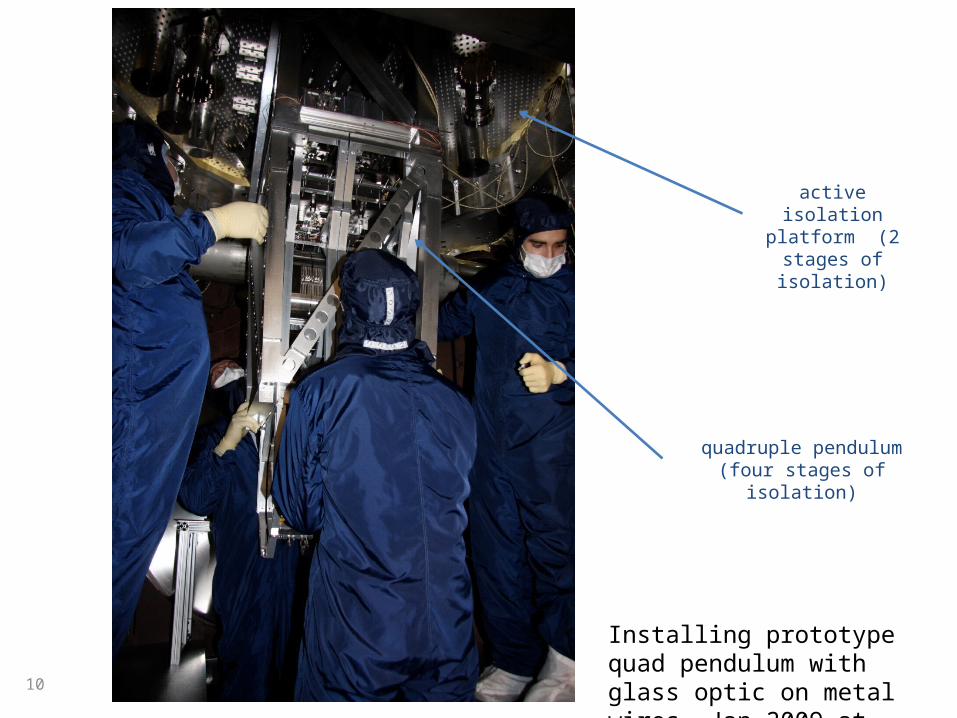
quadruple pendulum (four stages of isolation)
active isolation platform (2 stages
of isolation)
Installing prototype quad pendulum with glass optic on metal wires, Jan 2009 at MIT.10
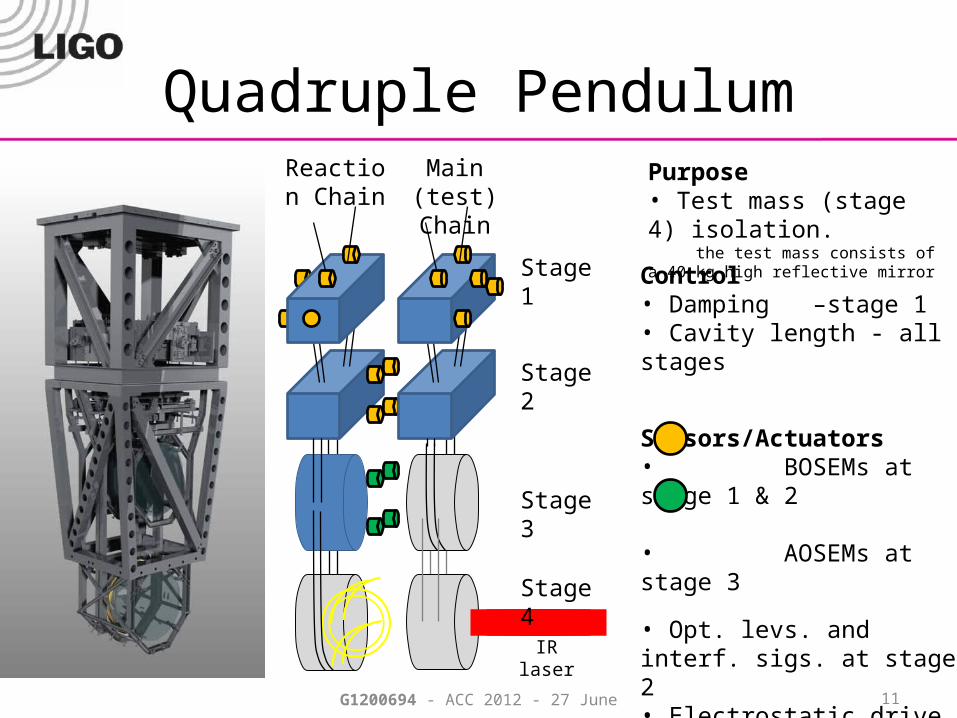
Quadruple PendulumMain (test)
ChainReaction
Chain
Control• Damping –stage 1• Cavity length - all stages
Sensors/Actuators• BOSEMs at stage 1 & 2
• AOSEMs at stage 3
• Opt. levs. and interf. sigs. at stage 2• Electrostatic drive (ESD) at stage 4
Purpose• Test mass (stage 4) isolation. the test mass consists of a 40 kg high reflective mirror
Stage 1
Stage 2
Stage 3
Stage 4
11G1200694 - ACC 2012 - 27 June
IR laser
12
10-1 100 101 10210-15
10-13
10-11
10-9
10-7
10-5
10-3
10-1
101
103
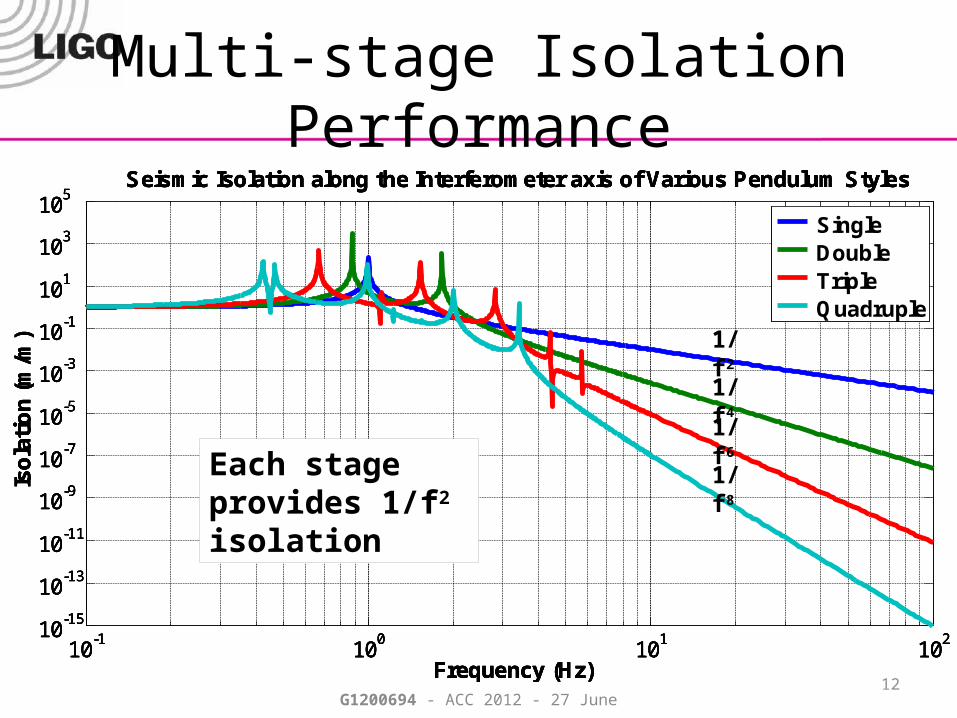
105 Seismic Isolation along the Interferometer axis of Various Pendulum Styles
Isol
atio
n (m
/m)
Frequency (Hz)
Single
Multi-stage Isolation Performance
10-1 100 101 10210-15
10-13
10-11
10-9
10-7
10-5
10-3
10-1
101
103
105 Seismic Isolation along the Interferometer axis of Various Pendulum Styles
Isol
atio
n (m
/m)
Frequency (Hz)
Single Double
10-1 100 101 10210-15
10-13
10-11
10-9
10-7
10-5
10-3
10-1
101
103
105 Seismic Isolation along the Interferometer axis of Various Pendulum Styles
Isol
atio
n (m
/m)
Frequency (Hz)
Single Double Triple
10-1 100 101 10210-15
10-13
10-11
10-9
10-7
10-5
10-3
10-1
101
103
105 Seismic Isolation along the Interferometer axis of Various Pendulum Styles
Isol
atio
n (m
/m)
Frequency (Hz)
Single Double Triple Quadruple
Each stage provides 1/f2 isolation
1/f2
1/f4
1/f6
1/f8
G1200694 - ACC 2012 - 27 June
10-2 10-1 100 101 10210-16
10-14
10-12
10-10
10-8
10-6
10-4
Frequency (Hz)
Dis
plac
emen
t (m H
z)
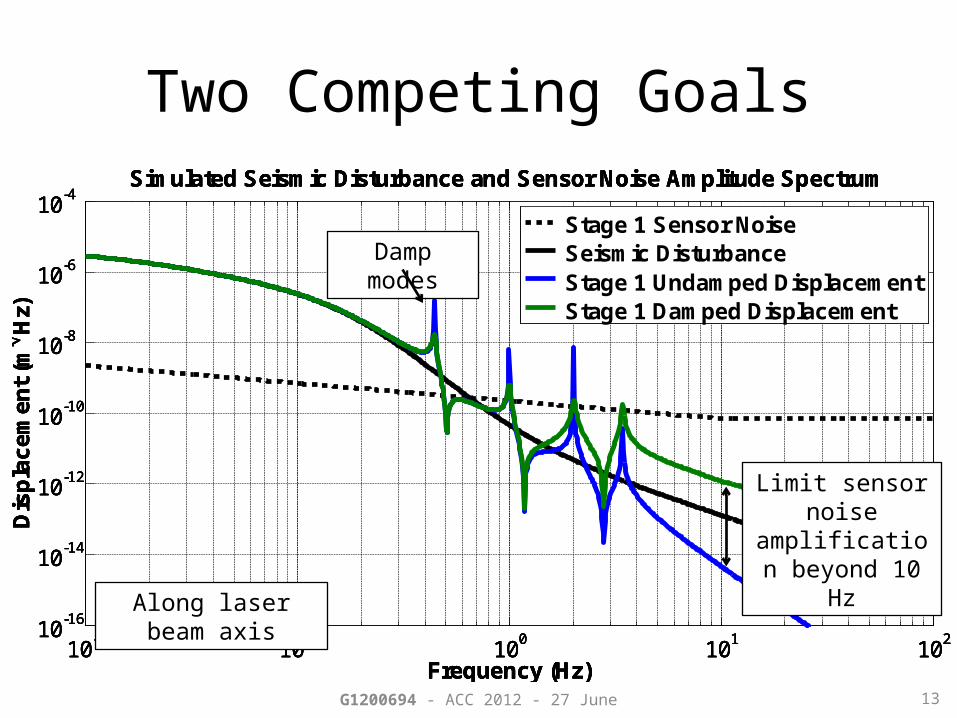
Simulated Seismic Disturbance and Sensor Noise Amplitude Spectrum
Seismic Disturbance
10-2 10-1 100 101 10210-16
10-14
10-12
10-10
10-8
10-6
10-4
Frequency (Hz)
Dis
plac
emen
t (m H
z)
Simulated Seismic Disturbance and Sensor Noise Amplitude Spectrum
Seismic Disturbance Stage 1 Undamped Displacement
10-2 10-1 100 101 10210-16
10-14
10-12
10-10
10-8
10-6
10-4
Frequency (Hz)
Dis
plac
emen
t (m H
z)
Simulated Seismic Disturbance and Sensor Noise Amplitude Spectrum
Stage 1 Sensor Noise Seismic Disturbance Stage 1 Undamped Displacement
Two Competing Goals
13
10-2 10-1 100 101 10210-16
10-14
10-12
10-10
10-8
10-6
10-4
Frequency (Hz)
Dis
plac
emen
t (m H
z)
Simulated Seismic Disturbance and Sensor Noise Amplitude Spectrum
Stage 1 Sensor Noise Seismic Disturbance Stage 1 Undamped Displacement Stage 1 Damped Displacement
Damp modes
Limit sensor noise amplification beyond 10 Hz
G1200694 - ACC 2012 - 27 June
Along laser beam axis
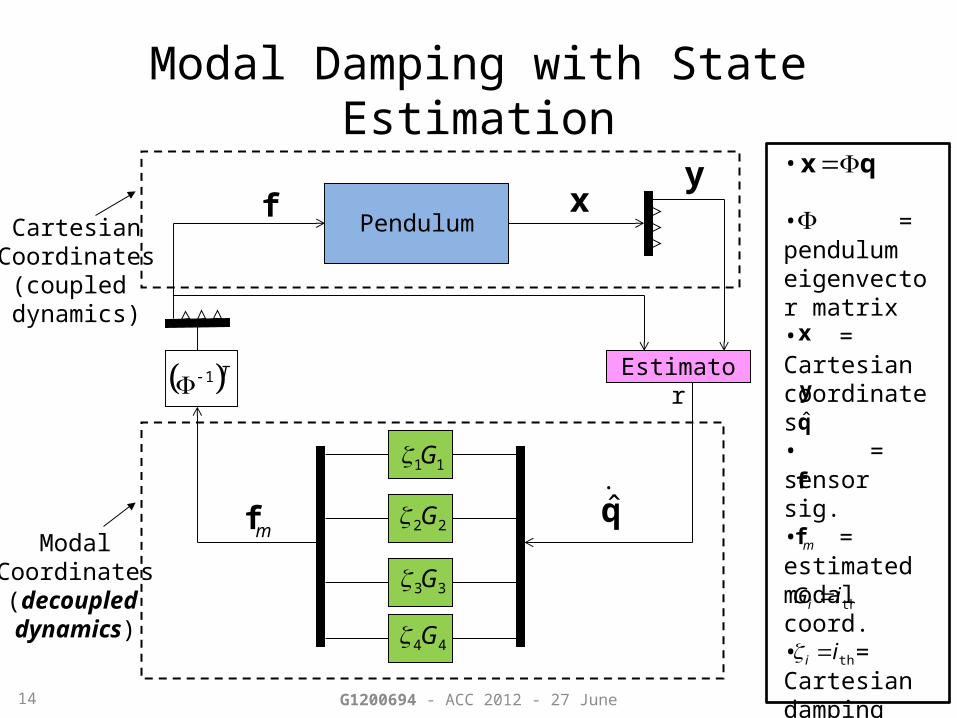
Modal Damping with State Estimation
xf
mf
T1
CartesianCoordinates
(coupled dynamics)
ModalCoordinates(decoupled dynamics)
Estimator
q̂
Pendulum
•
• = pendulumeigenvector matrix• = Cartesian coordinates• = sensor sig.• = estimated modal coord.• = Cartesian damping forces• = modal damping forces• mode damping filter• mode damping gain
qx
mf
f
q̂
x
thii
thiGi
11G
22G
33G
44G
y
y
14 G1200694 - ACC 2012 - 27 June
-100-50
050
100150
Bode Diagram
Mag
nitu
de (d
B)
1 Hz modal plant: P
10-2
10-1
100
101
102
-360-315-270-225-180-135-90-45
04590
Pha
se (d
eg)
Frequency (Hz)
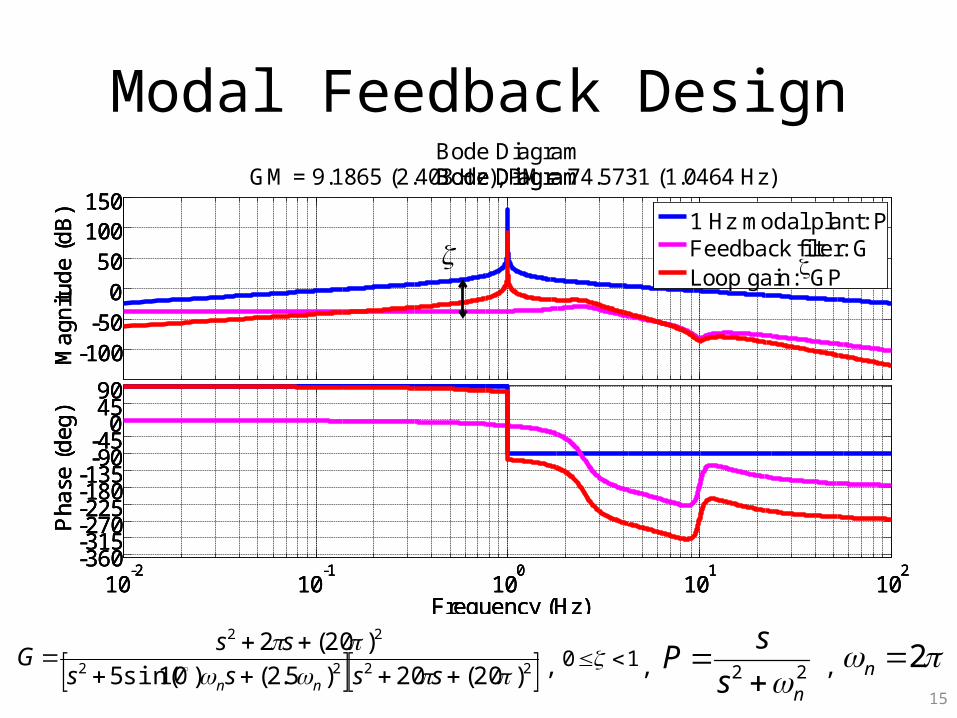
Modal Feedback Design
22ns
sP
15
2n10 ,,,
-100-50
050
100150
Bode Diagram
Mag
nitu
de (d
B)
1 Hz modal plant: PFeedback filter: G
10-2
10-1
100
101
102
-360-315-270-225-180-135-90-45
04590
Pha
se (d
eg)
Frequency (Hz)
-100-50
050
100150
Bode DiagramGM = 9.1865 (2.403 Hz), PM = 74.5731 (1.0464 Hz)
Mag
nitu
de (d
B)
1 Hz modal plant: PFeedback filter: GLoop gain: GP
10-2
10-1
100
101
102
-360-315-270-225-180-135-90-45
04590
Pha
se (d
eg)
Frequency (Hz)
2222
22
)20(20)5.2()10sin(5)20(2
ssss
ssGnn
16
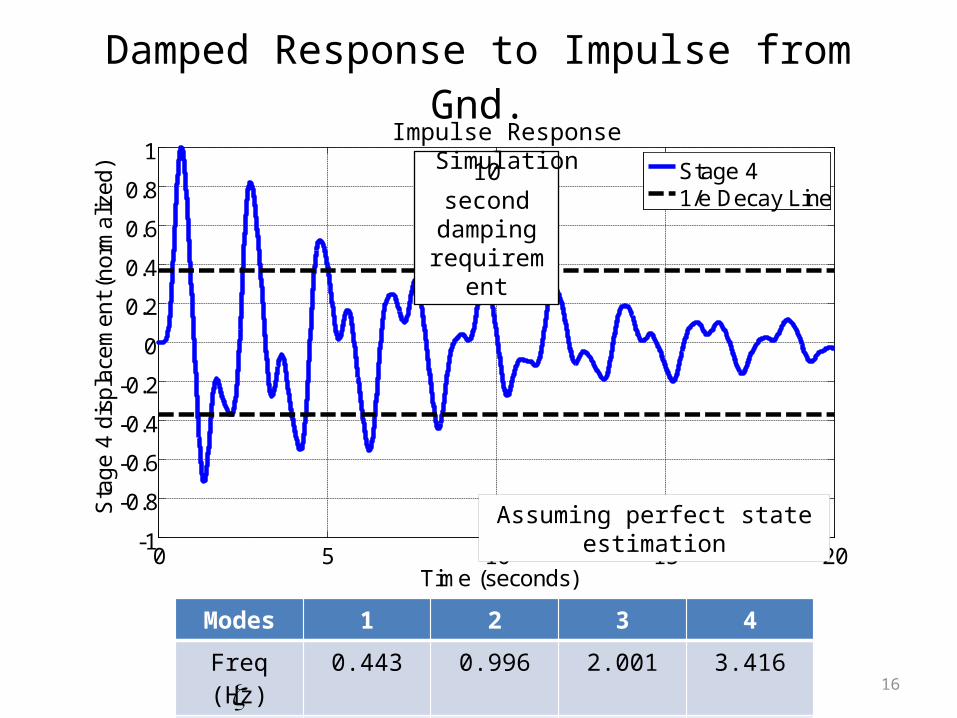
0 5 10 15 20-1
-0.8
-0.6
-0.4
-0.2
0
0.2
0.4
0.6
0.8
1
Time (seconds)
Sta
ge 4
dis
plac
emen
t (no
rmal
ized
)
Stage 41/e Decay Line
Modes 1 2 3 4
Freq (Hz) 0.443 0.996 2.001 3.416
0.040 0.018 0.009 0.001
Damped Response to Impulse from Gnd.
Assuming perfect state estimation
10 second damping
requirement
Impulse Response Simulation
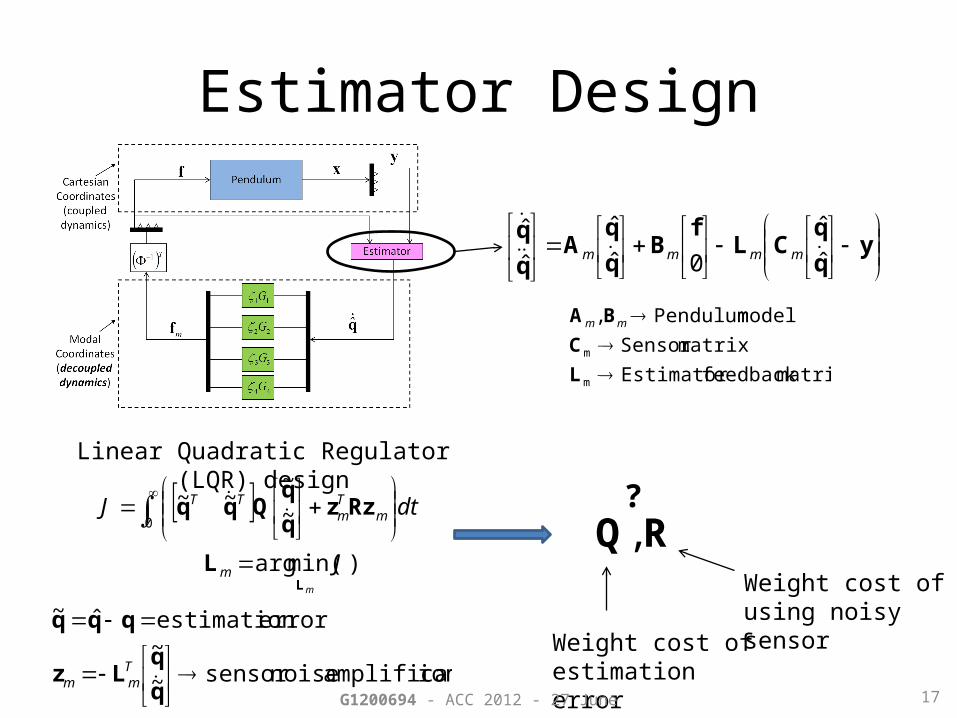
Estimator Design
y
CLf
Bqq
Aqq
ˆˆ
0ˆˆ
ˆˆ
mmmm
matrixfeedback Estimator matrixSensor
model Pendulum ,
m
m
LC
BA mm
m
J
dtJ
m
mTm
TT
LL
Rzzqq
Qqq
)min(arg
~~
~~0
ionamplificat noisesensor ~~
error estimation ˆ~
Lz
qqq
Tmm
RQ ,
Weight cost of estimation error
Weight cost of using noisy sensor
?
17G1200694 - ACC 2012 - 27 June
Linear Quadratic Regulator (LQR) design

Choosing Q and R: Not Unique
18
n
n
n
n
Tn
Tn
T
q
mm
qqq
~~...
~
0
...00
~~...~1
1
2
21
11
mR
RR
0...
0
2
1
R
R is still to be determined
Q
amplitude response impulse velocity modal
mode of mass modal 1
i
i
m
im
m
J
dtJ
m
mTm
TT
LL
Rzzqq
Qqq
)min(arg
~~
~~0
G1200694 - ACC 2012 - 27 June
19
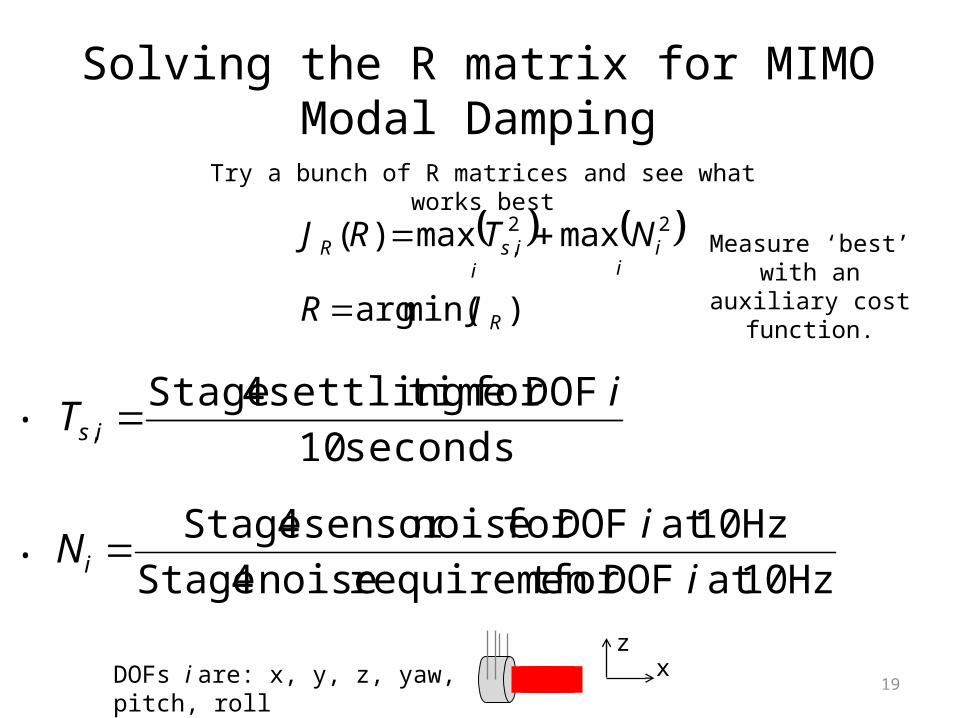
Solving the R matrix for MIMO Modal Damping
)min(arg
maxmax)( 22,
R
ii
iisR
JR
NTRJ
seconds 10 DOFfor timesettling 4 Stage
,iT is
Hz 10at DOFfor t requiremen noise 4 StageHz 10at DOFfor noisesensor 4 Stage
iiN i
DOFs i are: x, y, z, yaw, pitch, roll
•
•
xz
Try a bunch of R matrices and see what works best
Measure ‘best’ with an auxiliary cost
function.

20
Modal Estimation Cost
10-10 10-9 10-8 10-7 10-6 10-5 10-410-4
10-3
10-2
10-1
100
101
102
103
R
Cos
t Val
ues
x Estimator Cost vs. R
Settling Cost, max(Ts2)
Sensor Noise Cost, max(N2)Total Cost, J
R
8109 R
G1200694 - ACC 2012 - 27 June
(x is the laser axis)
21
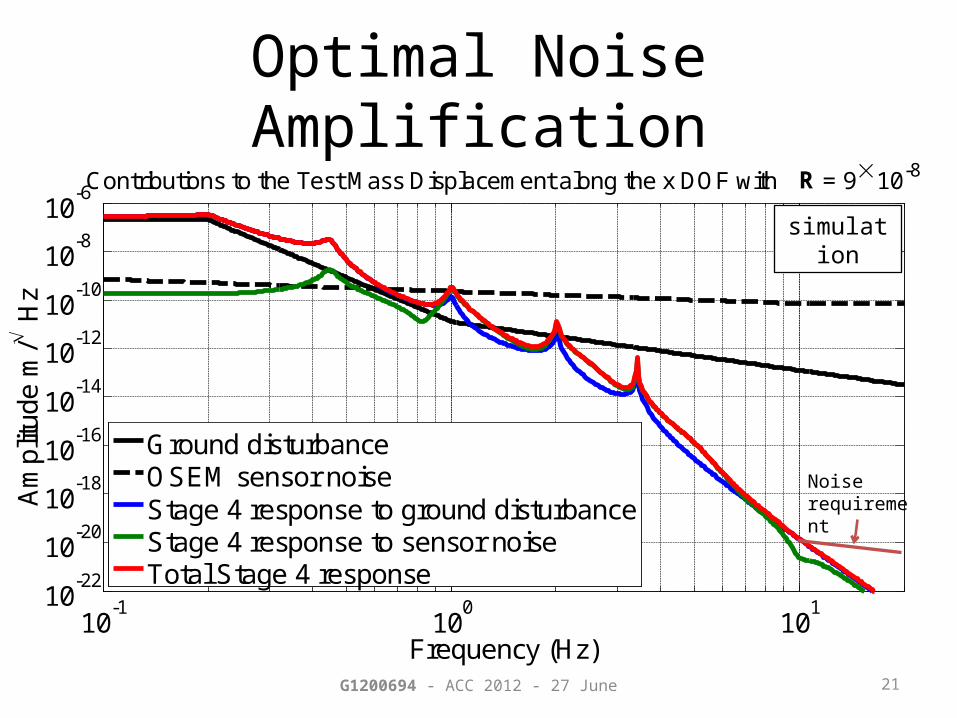
Optimal Noise Amplification
10-1 100 10110-22
10-20
10-18
10-16
10-14
10-12
10-10
10-8
10-6Contributions to the Test Mass Displacement along the x DOF with R = 9 10-8
Am
plitu
de m
/ H
z
Frequency (Hz)
Ground disturbanceOSEM sensor noiseStage 4 response to ground disturbanceStage 4 response to sensor noiseTotal Stage 4 response
Noise requirement
simulation
G1200694 - ACC 2012 - 27 June
22
Conclusions
• Modal damping provides an intuitive way to optimize a highly coupled, many DOF system, with strict noise performance.
• Real-time or adaptive tuning possible by adjusting gains on each mode.
• Future work to involve implementation on a true Advanced LIGO interferometer.
G1200694 - ACC 2012 - 27 June
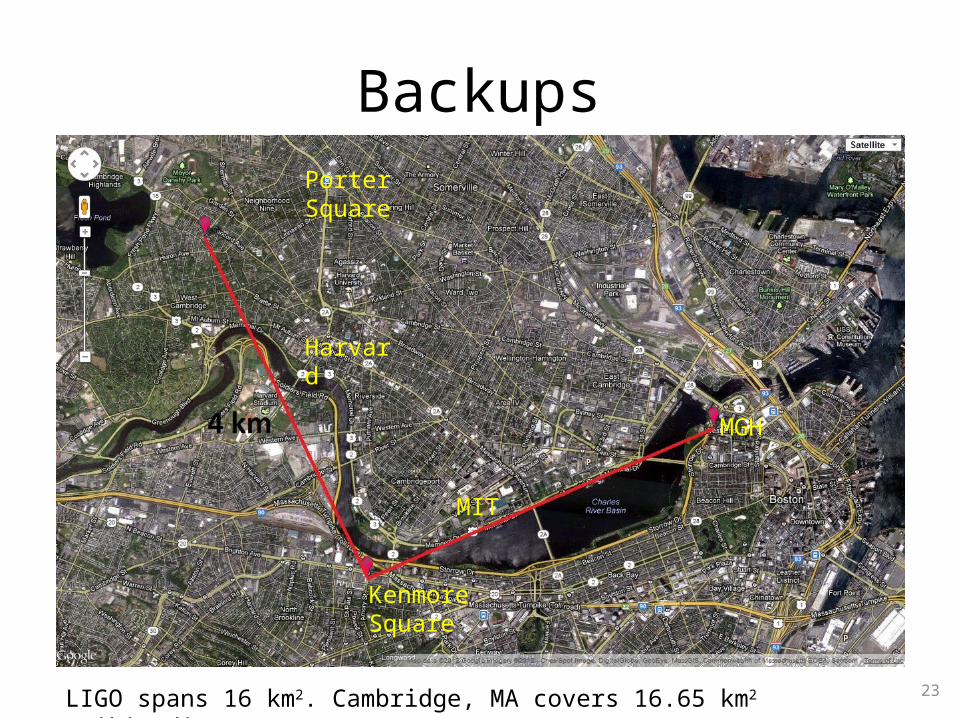
Backups
LIGO spans 16 km2. Cambridge, MA covers 16.65 km2 (wikipedia http://en.wikipedia.org/wiki/Cambridge,_Massachusetts). 23
Kenmore Square
MIT
Harvard
MGH
Porter Square
FI
Test Masses :fused silica ,
34 cm diam x 20 cm thick ,40 kg
SRM
ITM
ETM
OutputMode
Cleaner
PRM
BS
4 km
T = 3%
Laser Φ
InputMode
Cleaner
m
PDGW readout
FI
ITM ETM125 W
5.7 kW
815 kW
CP
24
Five Pendulum Designs
Ref: G1100434
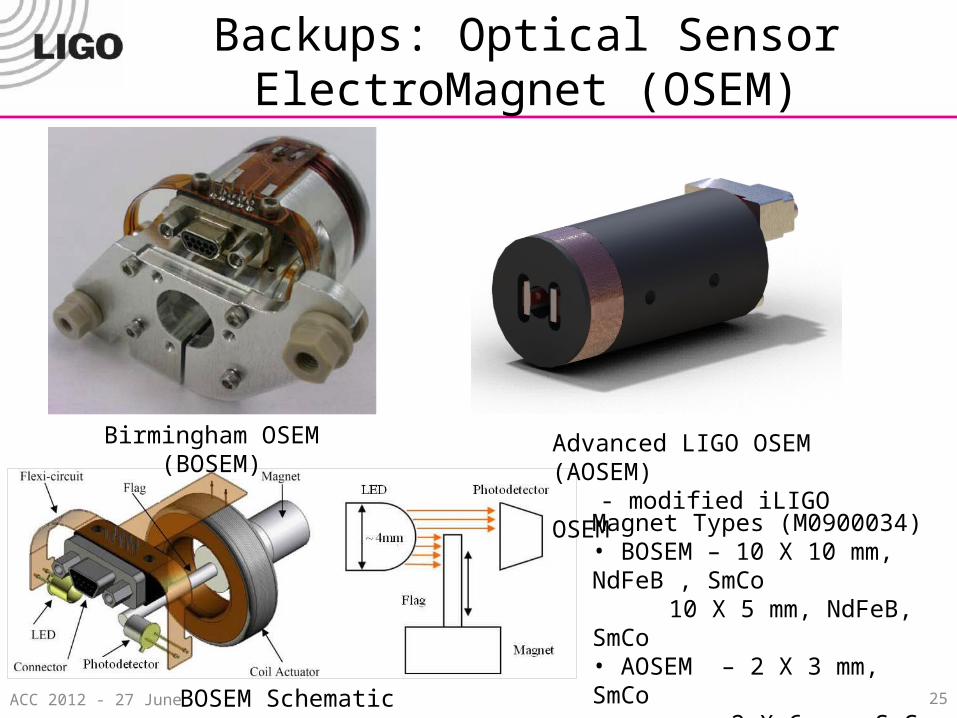
Backups: Optical Sensor ElectroMagnet (OSEM)
Birmingham OSEM (BOSEM) Advanced LIGO OSEM (AOSEM)- modified iLIGO OSEM
BOSEM SchematicACC 2012 - 27 June 25
Magnet Types (M0900034)• BOSEM – 10 X 10 mm, NdFeB , SmCo
10 X 5 mm, NdFeB, SmCo• AOSEM – 2 X 3 mm, SmCo
2 X 6 mm, SmCo 2 X 0.5 mm, SmCo
ACC 2012 - 27 June 26
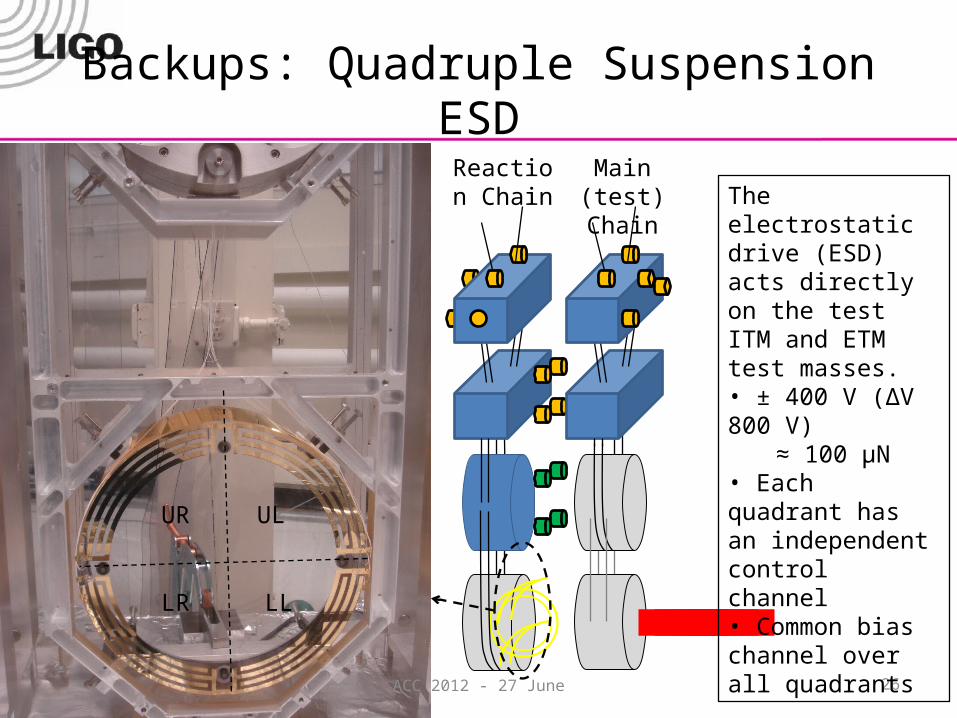
Backups: Quadruple Suspension ESDMain (test)
ChainReaction
Chain The electrostatic drive (ESD) acts directly on the test ITM and ETM test masses.• ± 400 V (ΔV 800 V)
≈ 100 μN• Each quadrant has an independent control channel• Common bias channel over all quadrants
ULUR
LLLR

ACC 2012 - 27 June
Backups: Quadruple SuspensionMIT
monolithic quad in BSC
June 2010
27/33