mobility on the labour market
TRANSCRIPT

Mobility on the labour market
Research Randstad Holding 2015Brussels 13 August 2015
2 Mobility on the labour market Research Randstad Holding 2015
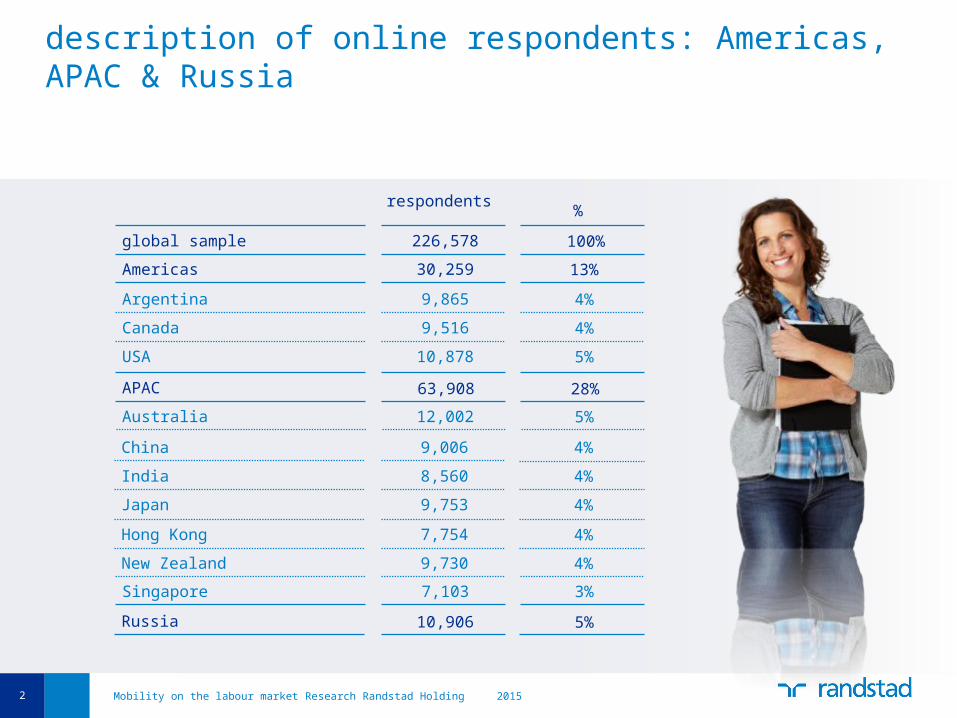
description of online respondents: Americas, APAC & Russia
global sample
Americas
Argentina
Canada
USA
APAC
Australia
respondents
226,578
30,259
9,865
9,516
10,878
12,002
%
13%
4%
4%
5%
5%
100%
China
India
Japan
Hong Kong
New Zealand
9,006
8,560
9,753
7,754
9,730
4%
4%
4%
4%
4%
Singapore 7,103 3%
Russia
63,908 28%
10,906 5%

3 Mobility on the labour market Research Randstad Holding 2015
description of online respondents: Europe
global sample
Europe
Belgium
France
Germany
Italy
respondents
226,578
121,505
17,428
12,759
9,006
8,911
%
54%
8%
6%
4%
4%
100%
Netherlands
Poland
Spain
Sweden
16,703
9,005
11,500
9,505
7%
4%
5%
4%
Switzerland 8,859 4%
UK 10,728 5%
Hungary 7,101 3%

4 Mobility on the labour market Research Randstad Holding 2015
significant differences in turnover rates between countries: highest turnover rate in Russia lowest in Japan, highest number of potential leavers in India lowest in Belgium
did you or would you change employers in the past 12 months?
ArgentinaCanadaSwitzerlandFranceGermanyBelgiumSpainItalyNetherlandsJapan
PolandChina
IndiaSingaporeUSAHong KongNew ZealandAustraliaUKSweden
RussiaHungary
leaversglobal 18
19
18
18
17
16
16
16
15
15
15
14
14
13
13
13
11
9
9
9
8
7
10
CanadaFranceSwedenUSASwitzerlandSpainNetherlandsGermanyJapanBelgium
AustraliaItaly
SingaporeRussiaHong KongArgentinaHungaryPolandUKNew Zealand
IndiaChina
potential leavers
global 21
37
32
30
25
24
22
22
21
21
20
18
18
18
17
17
17
16
16
15
14
13
16

5 Mobility on the labour market Research Randstad Holding 2015
leavers:lack of career prospects main driver to leave employer before low compensation; work-life balance issues and disinterest in job are nextwhat factors contributed to your decision to change employers? (top 3)
29
28
20
20
19
17
16
14
14
12
leavers’ factors
lack of career growth opportunities
compensation too low
work-life balance issues
not feeling interested in my job
lack of recognition/rewards
poor leadership
lack of financial stability
commuting time is too long
insufficient flexible working arrangements
poor relationship with direct manager chan
ged
did you change employers in the past 12 months?
18%
% changed voluntarily:
% made redundant:
13%
5%
note: top 10 factors are shown

6 Mobility on the labour market Research Randstad Holding 2015
smaller differences in lay off rates between countries
highest in Spain, lowest in Japan
Hong KongArgentinaIndiaNew ZealandLuxembourgUKChinaRussiaSingaporeJapan
GermanyHungary
PolandItalySwedenUSA
BelgiumCanadaFranceSwitzerland
SpainThe Netherlands
global 5
10
7
7
7
6
6
6
6
6
6
5
5
5
5
5
4
4
3
3
3
2
4
Australia 6

7 Mobility on the labour market Research Randstad Holding 2015
significant differences in stayers rates between countries
highest in Japan, lowest in India and China
AustraliaNew ZealandUKArgentinaPolandHungaryHong KongRussiaChinaSingapore
SwedenUSA
BelgiumThe NetherlandsGermanyItalySpainFranceSwitzerlandCanada
JapanLuxembourg
global
India
61
77
74
72
69
69
67
66
66
65
63
62
62
60
60
60
59
55
55
54
51
51
58
41

8 Mobility on the labour market Research Randstad Holding 2015
top 3 drivers for leavers by country
what factors contributed to your decision to change employers?
global top 3
lack of career prospects2.3.
1.salary too lowwork-life balance issues
NetherlandsGermanySwedenSwitzerlandUKHungaryItalyPolandSpainRussia
BelgiumFrance
USAAustraliaNew ZealandIndiaChinaHong KongJapanSingapore
ArgentinaCanada
driver 1 driver 2 driver 3salary too lowlack of career prospectslack of career prospectslack of career prospectslack of career prospectslack of career prospectslack of career prospectslack of career prospectslack of recognitionlack of career prospectslack of career prospectslack of recognitiondisinterest in jobsalary too lowdisinterest in jobdisinterest in jobsalary too lowsalary too lowlack of career prospectssalary too lowsalary too lowsalary too low
lack of career prospectssalary too lowsalary too lowwork-life balance issueswork-life balance issueswork-life balance issuessalary too lowsalary too lowwork-life balance issuespoor leadershiplack of recognitionsalary too lowlack of career prospectslack of recognitionpoor leadershipsalary too lowlack of career prospectslack of recognitionsalary too lowlack of career prospectslack of career prospectslack of career prospects
lack of recognitiondisinterest in jobpoor leadershipdisinterest in jobpoor leadershipsalary too lowlack of financial stabilitywork-life balance issuespoor relationship with colleaguessalary too lowdisinterest in joblack of career prospectslack of recognitionlack of career prospectssalary too lowlack of recognitionpoor leadershiplack of career prospectslack of recognitionwork-life balance issueswork-life balance issueslack of financial stability
9 Mobility on the labour market Research Randstad Holding 2015
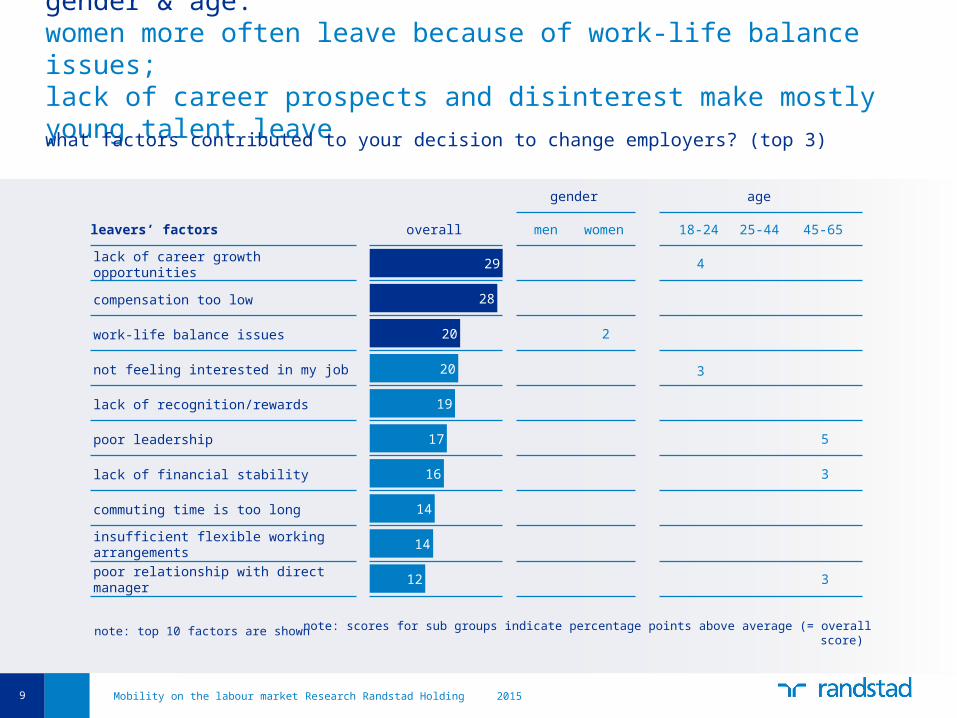
leavers’ factors overall
gender
men women
29
28
20 2
20
19
17
16
14
14
12
gender & age:women more often leave because of work-life balance issues;lack of career prospects and disinterest make mostly young talent leave
age
18-24 25-44 45-65
4
3
5
3
3
note: scores for sub groups indicate percentage points above average (= overall score)
lack of career growth opportunities
compensation too low
work-life balance issues
not feeling interested in my job
lack of recognition/rewards
poor leadership
lack of financial stability
commuting time is too long
insufficient flexible working arrangements
poor relationship with direct manager
note: top 10 factors are shown
what factors contributed to your decision to change employers? (top 3)

10 Mobility on the labour market Research Randstad Holding 2015
leavers’ factors
job level
production office manager
3
note: scores for sub groups indicate percentage points above average (= overall score)
education
secondary and lower
bachelormaster
and higher
3
2
2
3
lack of career growth opportunities
compensation too low
work-life balance issues
not feeling interested in my job
lack of recognition/rewards
poor leadership
lack of financial stability
commuting time is too long
insufficient flexible working arrangements
poor relationship with direct manager
overall
29
28
20
20
19
17
16
14
14
12
note: top 10 factors are shown
education & job level:higher educated people more often quit because they lack career prospects; lower educated more affected by lack of flexible work optionswhat factors contributed to your decision to change employers? (top 3)

11 Mobility on the labour market Research Randstad Holding 2015
what factors would contribute to your decision to look for another employer? (top 3)
37
37
22
22
19
18
15
13
12
12
potential leavers’ factors
compensation too low
lack of career growth opportunities
lack of recognition/rewards
not feeling interested in my job
work-life balance issues
lack of financial stability
poor leadership
insufficient employee benefits
insufficient flexible working arrangements
insufficient training opportunities
would you change employers in the next 12 months?
wou
ld c
han
ge
21%
note: top 10 factors are shown
potential leavers:low salary and lack of career prospects considered main drivers to look for another employer; lack of recognition and disinterest are next
12 Mobility on the labour market Research Randstad Holding 2015
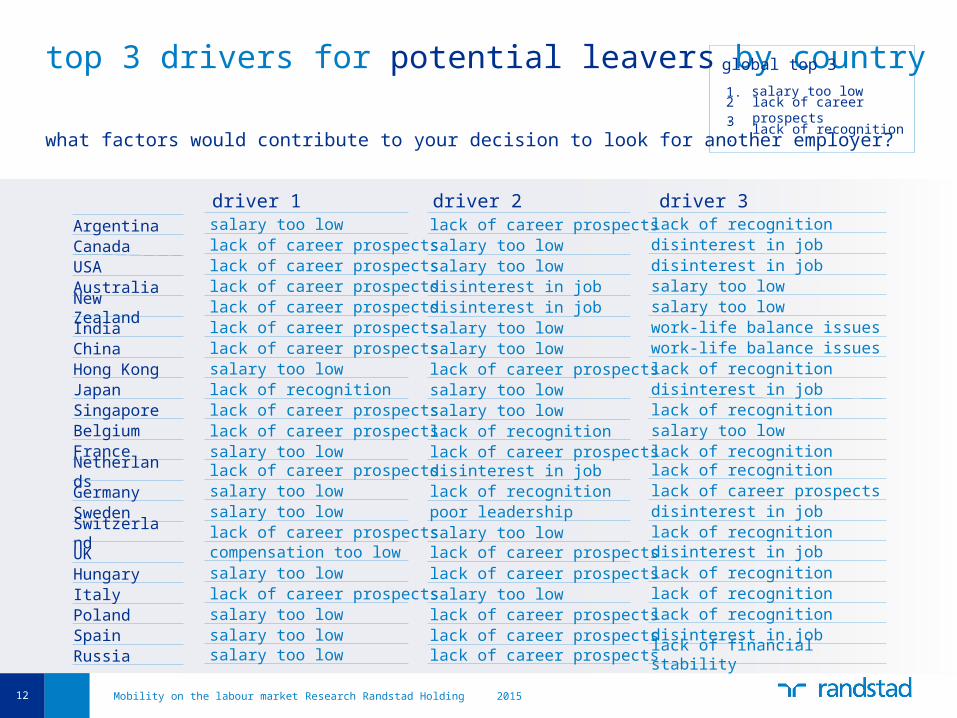
top 3 drivers for potential leavers by countryglobal top 3
salary too low2.3.
1.lack of career prospectslack of recognition
NetherlandsGermanySwedenSwitzerlandUKHungaryItalyPolandSpainRussia
BelgiumFrance
USAAustraliaNew ZealandIndiaChinaHong KongJapanSingapore
ArgentinaCanada
driver 1 driver 2 driver 3salary too lowlack of career prospectslack of career prospectslack of career prospectslack of career prospectslack of career prospectslack of career prospectssalary too lowlack of recognitionlack of career prospectslack of career prospectssalary too lowlack of career prospectssalary too lowsalary too lowlack of career prospectscompensation too low salary too lowlack of career prospectssalary too lowsalary too lowsalary too low
lack of career prospectssalary too lowsalary too lowdisinterest in jobdisinterest in jobsalary too lowsalary too lowlack of career prospectssalary too lowsalary too lowlack of recognitionlack of career prospectsdisinterest in joblack of recognitionpoor leadershipsalary too lowlack of career prospectslack of career prospectssalary too lowlack of career prospectslack of career prospectslack of career prospects
lack of recognitiondisinterest in jobdisinterest in jobsalary too lowsalary too lowwork-life balance issueswork-life balance issueslack of recognitiondisinterest in joblack of recognitionsalary too lowlack of recognitionlack of recognitionlack of career prospectsdisinterest in joblack of recognitiondisinterest in joblack of recognitionlack of recognitionlack of recognitiondisinterest in joblack of financial stability
what factors would contribute to your decision to look for another employer?

13 Mobility on the labour market Research Randstad Holding 2015
potential leavers’ factors overall
gender
men women
37
37
22
22
19
18
15
13
12
12
age
18-24 25-44 45-65
3
3
6
4
4
4
2
2
note: scores for sub groups indicate percentage points above average (= overall score)
compensation too low
lack of career growth opportunities
lack of recognition/rewards
not feeling interested in my job
work-life balance issues
lack of financial stability
poor leadership
insufficient employee benefits
insufficient flexible working arrangements
insufficient training opportunities
note: top 10 factors are shown
gender & age:people aged 45+ more often see low salary as a reason to leave; people aged <25 more often consider lack of career prospects and disinterestwhat factors would contribute to your decision to look for another employer? (top 3)

14 Mobility on the labour market Research Randstad Holding 2015
potential leavers’ factors
job level
production office manager
2
4
4
note: scores for sub groups indicate percentage points above average (= overall score)
education
secondary and lower
bachelormaster
and higher
2
2
3
compensation too low
lack of career growth opportunities
lack of recognition/rewards
not feeling interested in my job
work-life balance issues
lack of financial stability
poor leadership
insufficient employee benefits
insufficient flexible working arrangements
insufficient training opportunities
overall
37
37
22
22
19
18
15
13
12
12
note: top 10 factors are shown
education & job level:production workers more often see disinterest in job as a reason to quit; office workers point more often at lack of career prospectswhat factors would contribute to your decision to look for another employer? (top 3)

15 Mobility on the labour market Research Randstad Holding 2015
top 3 drivers for stayers by country global top 3
good work-life balance2.3.
1.competitive salaryflexible work options
NetherlandsGermanySwedenSwitzerlandUKHungaryItalyPolandSpainRussia
BelgiumFrance
USAAustraliaNew ZealandIndiaChinaHong KongJapanSingapore
ArgentinaCanada
driver 1 driver 2 driver 3good work-life balancegood work-life balancegood work-life balancegood work-life balancegood work-life balancegood work-life balancegood work-life balancecompetitive salarygood work-life balancegood work-life balancegood work-life balancegood work-life balancegood work-life balancegood work-life balancegood work-life balancegood work-life balancegood work-life balancegood work-life balancegood work-life balancegood work-life balancegood work-life balancecompetitive salary
flexible work optionscompetitive salarycompetitive salaryflexible work optionsflexible work optionscompetitive salarycompetitive salarygood work-life balanceinteresting jobscompetitive salaryflexible work optionscompetitive salaryflexible work optionsflexible work optionsflexible work optionsflexible work optionscompetitive salaryflexible work optionsrecognition for workcompetitive salaryflexible work optionsinteresting jobs
recognition for workflexible work optionsflexible work optionscompetitive salaryrecognition for workcareer prospectscareer prospectsstrong relationship with managerstrong relationship with managerfinancially healthyrecognition for workrecognition for workrecognition for workrecognition for workinteresting jobsrecognition for workflexible work optionsstrong relationship with managerfinancially healthyinteresting jobsrecognition for workfinancially healthy
what factors make you stay with your current employer? (top 3)

16 Mobility on the labour market Research Randstad Holding 2015
stayers’ factors overall
gender
men women
46 4
32 2
29 4
27 3
24
21
20
19
16
13
age
18-24 25-44 45-65
4
3
2
4
8 2
2
4
note: scores for sub groups indicate percentage points above average (= overall score)
good work-life balance
competitive salary
flexible working arrangements
I feel recognized for my work
financially healthy
career growth opportunities
interesting jobs
strong relationship with direct manager
pleasant company culture
opportunities to develop my skills
note: top 10 factors are shown
what factors make you stay with your current employer? (top 3)
gender & age:balance and flexible working options major drivers to stay mostly among female employees and workforce aged 45+, career growth among the <25

17 Mobility on the labour market Research Randstad Holding 2015
stayers’ factors
job level
production office manager
3
3
2
2
5
note: scores for sub groups indicate percentage points above average (= overall score)
education
secondary and lower
bachelormaster
and higher
2
2
4
3
2
good work-life balance
competitive salary
flexible working arrangements
I feel recognized for my work
financially healthy
career growth opportunities
interesting jobs
strong relationship with direct manager
pleasant company culture
opportunities to develop my skills
overall
46
32
29
27
24
21
20
19
16
13
note: top 10 factors are shown
education & job level:financial health and job content drive mostly production workers; good balance and flexible work options mostly drive office workers to staywhat factors make you stay with your current employer? (top 3)
4

18 Mobility on the labour market Research Randstad Holding 2015
Questions:
Jan DenysDirector External Communication and Public Affairs
+32 495 599415
@denysjan