mobility and bioavailability of heavy metals in selected
TRANSCRIPT
Retrospective Theses and Dissertations Iowa State University Capstones, Theses andDissertations
2000
Mobility and bioavailability of heavy metals inselected soils of Iowa and NigeriaMonday Ochu MbilaIowa State University
Follow this and additional works at: https://lib.dr.iastate.edu/rtd
Part of the Agricultural Science Commons, Agriculture Commons, Agronomy and CropSciences Commons, Environmental Sciences Commons, and the Soil Science Commons
This Dissertation is brought to you for free and open access by the Iowa State University Capstones, Theses and Dissertations at Iowa State UniversityDigital Repository. It has been accepted for inclusion in Retrospective Theses and Dissertations by an authorized administrator of Iowa State UniversityDigital Repository. For more information, please contact [email protected].
Recommended CitationMbila, Monday Ochu, "Mobility and bioavailability of heavy metals in selected soils of Iowa and Nigeria " (2000). Retrospective Thesesand Dissertations. 12705.https://lib.dr.iastate.edu/rtd/12705
INFORMATION TO USERS
This manuscript has been raproducad from the microfilm mastar. UMI films
tha taxt diractly from tha original or copy submittad. Thus, soma thasis and
dissartation copias ara in typawritar taca, whila othars may ba from any type of
computar printar.
Tha quality of thia raproduction la dapandant upon ttia quality of tha
copy submittad. Broken or indistinct print, colored or poor quality illustrations
and photographs, print blaadthrough, substandard margins, and improper
alignnient can adversely affM reproduction.
In the unlikely event that the author dkJ not serKl UMI a complete manuscript
and there are missing pages, these will be noted. Also, if unauthorized
copyright material had to be removed, a note will indicate tha deletion.
Oversize materials (e.g., maps, drawings, charts) are reproduced by
sectioning the original, beginning at the upper left-hand comer and continuing
from left to right in equal sections with small overiaps.
Photographs included in the original manuscript have been reproduced
xerographically in this copy. Higher quality 6" x 9" black and v ite
photographic prints ara available for any photographs or illustrations appearing
in this copy for an additkmal charge. Contact UMI directly to order.
Bell & Howell Information and Laaming 300 North Zaab Road, Ann Arbor, Ml 48106-1346 USA
800-521-0600

Mobility and bioavailability of heavy metals in selected soils of Iowa and Nigeria
by
Monday Ochu Mbila
A dissertation submitted to the graduate faculty
in partial fulfillment of the requirements for the degree of
DOCTOR OF PHILOSOPHY
Major; Soil Science (Soil Morphology and Genesis)
Major Professor; Michael L. Thompson
Iowa State University
Ames, Iowa
2000
Copyright ® Monday Ochu Mbila, 2000. All rights reserved.
UMI Number 9977344
UMI UMI Microfomi9977344
Copyright 2000 by Bell & Howell Infomiation and Learning Company.
All rights reserved. This microform edition is protected against unauthorized copying under Title 17. United States Code.
Bell & Howell Information and Leaming Company 300 Nofth Zeeb Road
P.O. Box 1346 Ann Arbor. Ml 48106-1346
n
Graduate College Iowa State University
This is to certify that the Doctoral dissertation of
Monday Ochu Mbila
has met the dissertation requirements of Iowa State University
'rofessor Major Professor
|0f prr\ctr«im For the Major Program
Signature was redacted for privacy.
Signature was redacted for privacy.
Signature was redacted for privacy.
iii
TABLE OF CONTENTS
LIST OF FIGURES vi
LIST OF TABLES viii
ACKNOWLEDGEMENT ix
ABSTRACT x
CHAPTER 1. GENERAL INTRODUCTION 1 DISSERTATION ORGANIZATION 4 REFERENCES 4
CHAPTER 2. EFFECTS OF LONG TERM SEWAGE SLUDGE USE ON HUMID TROPICAL NIGERIAN ULTISOLS; I. MORPHOLOGICAL AND CHEMICAL PROPERTIES OF SOILS 8
ABSTRACT 8 INTRODUCTION 9 MATERIALS AND METHODS 11
Site Description and fieldwork 11 The UNN Sewage Sludge 14 Laboratory Analyses 16 Soil Micromoiphological Analyses 16 Clay Mineralogical Analyses 18
RESULTS AND DISCUSSIONS 18 Morphology, Mineralogy and Classification of the Control Soil 18 EfTects of Sewage Sludge-Amendment on Soil 24
Chemical Properties 24 Morphologic^ Properties 29
Micromorphological Characteristics of the Control Soil 31 Ap horizon 31 Bt horizons 33 Micromorphological Characteristics of the Sewage Sludge-Amended soils 35
Assessing the Effects of Sludge-Amendment on Mineral Weathering Processes 36 CONCLUSIONS 41 ACKNOWLEDGMENTS 42 REFERENCES 42
CHAPTER 3. LONG-TERM EFFECTS OF SEWAGE SLUDGE USE ON A HUMID TROPICAL NIGERIAN ULTISOL: N. FATE OF TRACE METALS IN SOMS 47
ABSTRACT 47 INTRODUCTION 48
iv
Literature Review 49 MATERIALS AND METHODS 53
Soils S3 The UNN Sewage Sludge 54 Total Metals and Routine Soil Analyses 56 Sequential Fractionation of Trace Metals in Soils 57 DTPA Extraction of Soils 59
RESULTS AND DISCUSSION 60 Extractability of Metals from Sewage Sludge 60 Distribution of Trace Metals in the Control Soil Profile 62 Estimating Trace Metal Enrichment and Distribution in Sludge-Amended soils 64 Potential Mobility and Bioavailability of Trace Metals in soil 74
Zn 74 Cu 76 Pb and Ni 80
Conclusion 80 REFERENCES 83
CHAPTER 4. MINE SOIL GENESIS AND MICROENVIRONMENT INVESTIGATIONOF Pb AT THE MINES OF SPAIN 89
ABSTRACT 89 INTRODUCTION 90 MATERL^LS AND METHODS 93
Environment of the Research Site 93 Soils and Soil Sample Collection 95 Sample Pretreatment and Characterization 97 Sequential Chemical Extractions 98 Mineralogical Analyses 101 Thin Section Preparation and Light Microscopy 101 Polished Thin-Section Prq)aration and Scanning Electron Microscope/Energy-Dispersive X-ray Analyzer Analyses 102
RESULTS AND DISCUSSION 103 Pedon Properties and Classification 103 Mine Soil Genesis and Pb Distribution in Soils 115 Morphological and Mineralogical Aspects of Mine Soils 119 Microenvironment of Pb in Mine Soils 120 Study One (Subsurface Soil) 127 Study Two (Surface Soil) 131
REFERENCES 140
CHAPTER 5. PREDICTING THE BIOAVAILABILITY OF HEAVY METALS IN SOILS AT THE MINES OF SPAIN 144
ABSTRACT 144 INTRODUCTION 145 MATERLVLS AND METHODS 148
V
Research Area 148 Sampling Techniques 149 Sample Preparation and Plant Tissue Analysis 151 Sample Preparation and Total Metal Analyses of Soil 153
RESULTS AND DISCUSSION 156 Plant Metal Uptake Study 168
Zn Uptake 161 Pb Uptake 164
Pb and Zn Partitioning and Bioavailability in Soil 168 Predicting Zn uptake from its Chemical Forms 169 Predicting Pb uptake from its Chemical Forms 171
CONCLUSION 174 ACKNOWLEDGMENTS 174 REFERENCES 175
CHAPTER 6. GENERAL CONCLUSIONS 182
APPENDDC A ADDITIONAL INFORMATION FOR CHAPTER 2 186
APPENDIX B ADDITIONAL INFORMATION FOR CHAPTER 3 205
APPENDDC C ADDITIONAL INFORMATION FOR CHAPTER 4 230
APPENDDC D ADDITIONAL INFORMATION FOR CHAPTER 5 242

vi
LIST OF nCURES
Figure 2.1 Map showing location of the study site and neighboring cities 13 Figure 2.2 Soil pore space, clay coating of pore, quartz grains, soil micromass 22 Figure 2.3 Mean annual rainfall Eastern Nigeria 23 Figure 2.4 X-ray diffractogram of oriented clay sample from pedon 1 25 Figure 2.5 Microstructure of the Apl horizon (pedon 1 0-5 cm) 32 Figure 2.6 Microstructiuv of Bt3 horizon (pedon 1 80-110 cm) 34 Figure 2.7 Black subrounded sesquiooxide nodules 37 Figure 2.8 Rounded compact micropeds in the Apl of sludge-amended soil 38
Figure 3.1 Extractability of metals in UNN sewage sludge 61 Figure 3.2 CBD extractable Fe203 63 Figure 3.3 Organic C distribution in three soil profiles 65 Figure 3.4 Metal distribution in soil profile 1 66 Figure 3.5 Metal distribution in soil profile 2 68 Figure 3.6 Metal distribution in soil profile 3 69 Figure 3.7 Metal enrichment of soil profile 2 71 Figure 3.8 Metal enrichment of soil profile 3 72 Figure 3.9 Sequential extraction of ^ in the three soil profiles 75 Figure 3.10 Sequential extraction of Cu in the three soil profiles 78 Figure 3.11 Sequential extraction of Pb in the three soil profiles 81 Figure 3.12 Sequential extraction of Ni in the three soil profiles 82
Figure 4.1 Location map of Mines of Spain and the surrounding areas 94 Figure 4.2 Schematic representation of the hillslope of the study site 96 Figure 4.3 Clay coating of pore 107 Figure 4.4a XRD patterns for the clay fraction of the three soil profiles 109 Figure 4.4b XRD patterns for the sand fraction of the three soil profiles 110 Figure 4.5 Clay coating of pores and grains in pedon 3 114 Figure 4.6 Pb dstribution in the three pedons 116 Figure 4.7 Sketch of strategraphy of the mine soils at the Mines of Spain 117 Figure 4.8 Stages of Mine soil genesis and the distribution of Pb in the profile 118 Figure 4.9 Soil fabric of pedon 1 121 Figure 4.10 Soil fabric of pedon 2 122 Figure 4.11 Soil fabric of pedon 3 123 Figure 4.12 Embedded clay cutans 124 Figure 4.13 Relative amounts of Pb in fractions of soils from the three pedons 126 Figure 4.14 Backscattered electron image of Fe oxide nodule in soil thin section 128 Figure 4.15 Backscattered electron image ofMn oxide nodule in soil thin section 129 Figure 4.16 Backscattered electron image of Fe and Mn oxide nodule 130 Figure 4.17 Backscattered electron image of Fe oxide nodule in soil thin section 132 Figure 4.18 Light petrographic micrograph of soil thin section 133
vii
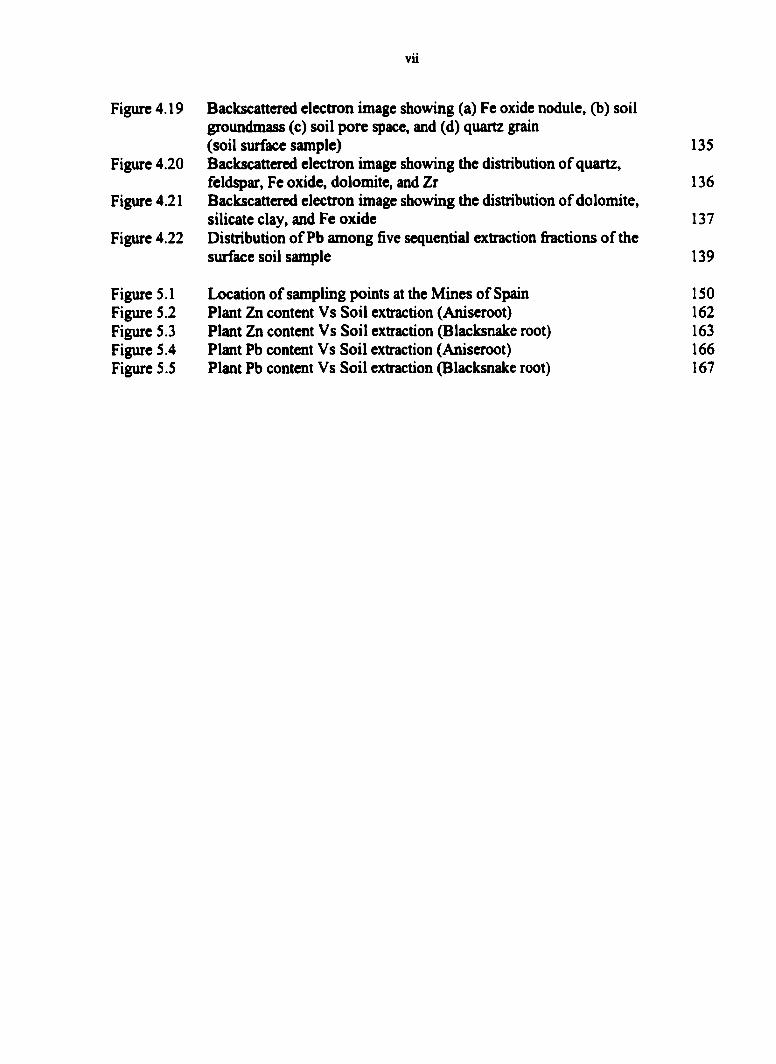
Figure 4.19 Backscanered electron image showing (a) Fe oxide nodule, (b) soil groundmass (c) soil pore space, and (d) quartz grain (soil surface sample) 135
Figure 4.20 Backscattered electron image showing the distribution of quartz, feldspar, Fe oxide, dolomite, and Zr 136
Figure 4.21 Backscattered electron image showing the distribution of dolomite, silicate clay, and Fe oxide 137
Figure 4.22 Distribution of Pb among five sequential extraction fiactions of the surface soil sample 139
Figure 5.1 Location of sampling points at the Mines of Spain 150 Figiu«5.2 Plant Zn content Vs Soil extraction (Aniseroot) 162 Figure 5.3 Plant Zn content Vs Soil extraction (Blacksnake root) 163 Figure 5.4 Plant Pb content Vs Soil extraction (Aniseroot) 166 Figure 5.5 Plant Pb content Vs Soil extraction (Blacksnake root) 167
viii
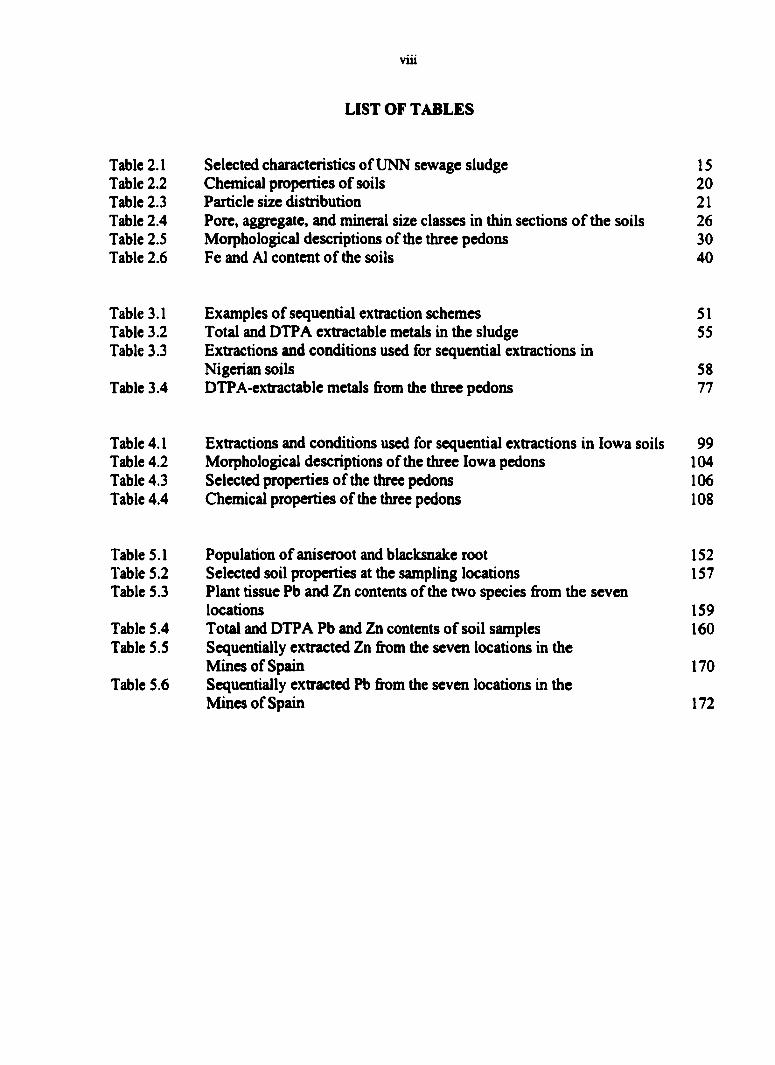
LIST OF TABLES
Tabic 2.1 Selected characteristics of UNN sewage sludge 15 Table 2.2 Chemical properties of soils 20 Table 2.3 Particle size distribution 21 Table 2.4 Pore, aggregate, and mineral size classes in thin sections of the soils 26 Table 2.5 Morphological descriptions of the three pedons 30 Table 2.6 Fe and A1 content of the soils 40
Table 3.1 Examples of sequential extraction schemes 51 Table 3.2 Total and DTPA extractable metals in the sludge 55 Table 3.3 Extractions and conditions used for sequential extractions in
Nigerian soils 58 Table 3.4 DTPA-extractable metals from the three pedons 77
Table 4.1 Extractions and conditions used for sequential extractions in Iowa soils 99 Table 4.2 Morphological descriptions of the three Iowa pedons 104 Table 4.3 Selected properties of the three pedons 106 Table 4.4 Chemical properties of the three pedons 108
Table 5.1 Population of aniseroot and blacksnake root 152 Table 5.2 Selected soil properties at the sampling locations 157 Table 5.3 Plant tissue Pb and Zn contents of the two species from the seven
locations 159 Table 5.4 Total and DTPA Pb and Zn contents of soil samples 160 Table 5.5 Sequentially extracted Zn fix)m the seven locations in the
Mines of Spain 170 Table 5.6 Sequentially extracted Pb from the seven locations in the
Mines of Spain 172
ix
ACKNOWLEDGMENTS
I am deeply indebted to Dr. M.L. Thompson for his guidance and support during the
course of this research and my entire Ph.D program. I am also indebted to Dr. J. Sandor, Dr.
K. Windom, Dr. D. Laird, and Dr. L. Burras for accepting to serve, and being very
resourceful in my program of study committee.
Special thanks are extended to the Rockefeller Foundation for fimding the part of he
research that was carried out in Nigeria under the African Dissertation Intemship Program,
and to Dr. J. S.C. Mbagwu for coordinating the part of the research done there. I also want to
thank the other members of staff in the 5oil Science Department, University of Nigeria
Nsukka, especially. Dr. F.O.R. Akamigbo, Dr. C. Igwe, Dr. I. Unamba-Oparah, Dr. C. Mba,
Mr. C. Onyirioha, and Mr. A.P. Odo for their individual contributions and encouragement
during the fieldwork.
I wish to express my gratitude to many others whose contributions in one way or
another helped to complete this research successfully. Included here are Iowa Agricultural
and Home Economics Experiment Station for funding part of the research, L. Moran for
assisting in the field and offering suggestions during writing, P. Flemming, L. Schultz, M.
Lauterbach, and Dr. Y. Sui for assisting in the laboratory, the 1997 and 1999 Soil Mineralogy
(Agron SSSL) class for including some of my samples in their class. Dr. L. Hundal and Dr.
A. Carmo for their insightful comments to aid this project.
Finally, I must thank my family without whose patience, support, and encouragement
my Ph.D program would have been much more difficult to complete. This dissertation is
dedicated to them.

X
ABSTRACT
Environmental pollution due to release of heavy metals fix)m various sources is a
widespread problem throughout the world. This research was conducted to investigate the
behavior of heavy metals released to soils from sewage-sludge application and ore mining.
The distribution, chemical forms, bioavailability and microenvironment of Zn, Cu, Pb, and
Ni in sewage-sludge-amended Ultisols from southeasten Nigeria, and Pb and Zn in Alfisols
of an abandoned mine in northeast Iowa, were investigated using field studies and
microanalytical techniques to complement standard bulk analytical methods. After 37 years
of sludge amendment, the soil chemical properties had changed enough to warrant a
reclassification of the Nigerian soil from an Ultisol to an Alfisol. High contents of Zn and Cu
and low contents of Pb and Ni in the amended soil compared to a control soil reflected the
concentrations of the metals in the sludge. Enrichment of Zn and Cu down the profile
indicated that metals had moved from the zone of incorporation. At the abandoned Pb and Zn
mine in Iowa, mining influenced pedogenesis in the immediate mining areas and resulted in
redistribution of Pb in the soils. Pb was localized mainly in Fe oxide nodules and in residual
fractions. The native vegetation had taken up more Pb and Zn at the contaminated site than at
the control site. DTP A, total metal content and sequential extractions were strongly
correlated with plant uptake of Zn, but none of the extractions showed a conclusive linear
relationship with plant uptake of Pb. Pedological approaches offers great possibilities for
assessing heavy metal problems in soils.

xi
uptake of Pb. Pedological approaches offers great possibilities for assessing heavy metal
problems in soils.
1
CHAPTER 1. GENERAL INTRODUCTION
Pollution of the natural environment due to release of heavy metals from various
sources is a widespread problem throughout the world (Alloway, 1990; Kabata-Pendias and
Pendias, 1984; Davies, 1992). The group of metals collectively referred to as heavy metals
includes all metals with a specific gravity of less than 5 g cm ' (Harmsen, 1977), that
excludes alkaline and alkaline earth metals. This study concentrated on Pb, Zn, Cu, Ni.
The concern over heavy metal pollution of soils is based on many reasons. First, as a
result of human activity, heavy metals may accumulate in the soil environment to a point
where their levels are toxic to plants. Second, their off-site movement either to surface water
or to groundwater has the potential for contamination of drinking water resources. Thirdly,
heavy metals might accumulate in the food chain and affect the health of people who eat food
grown on metal-contaminated soils.
In terrestrial ecosystems, heavy metals are released from soil parent materials under
the influence of chemical weathering (Alloway, 1990). Other input sources to the
environment include mining and smelting (Davies and Wixon, 198S; Asami et al, 1981;
Dickson et al., 1996). Some heavy metals reach the soil of arable land and growing crop
plants either directly in the form of fertilizers to supplement crop nutrition or indirectly
through other amendments and agrochemicals used for varied purposes (Sauerbeck et al.,
1987; Gimeno-Garcia, 1996). Heavy metals originating from these sources ultimately reach
the soil surface where their further fate is governed by pedogenic processes, e.g., additions of
organic matter, transfers, transforaiations, and removals by leaching (Srivastava and Gupta,
1996; and Simonson, 19S9).
2
Heavy metals in soils occur in a variety of physico-chemical forms, including metals
that are (i) free or complexed ions in soil solution; (ii) adsorbed at the surfaces of clays, Fe
and Mn oxyhydroxides or organic matter that are easily exchangeable; (iii) present in the
structure of secondary minerals such as phosphates, sulfides or carbonates that are
specifically adsorbed; (iv) those occluded in soil oxide material; and (v) those present in the
crystal structures of primary minerals. Identifying the chemical forms in which the metals are
retained in the soil is essential for predicting their potential mobility to water sources and the
food chain. Sequential extraction technique, have been used to extract the different forms of
the metals in soils near mining areas (Shintu et al., 1994; and Harmsen, 1977) and sewage-
sludge-amended soils (Lake et al., 1984; van Valin and Morse, 1982; Berti and Jacobs,
1996).
The chemical forms of heavy metals in the soil depend on the source of
contamination as well as on the soil environment (e.g., pH, redox potential, presence of
organic matter, and colloidal clay particles). For example, a lowering of the pH of the soil
may increase the solubility of heavy metals. Water logging of soils, followed by reduction,
may increase solubility of Fe and Mn and hence all metals associated with ferric or manganic
oxides under aerobic conditions (McBride, 1994). Also, microbial decomposition of organic
materials added to a soil may result in the release of organic compounds that may complex
with and dissolve heavy metals and hence increase the availability of these metals to plants
and possibly the amounts that reach the groundwater. Therefore, the chemical forms of the
metals in contaminated soils play a significant role in their transport and bioavailability to
both native and agronomic plants. Knowledge of pedogenesis of the heavy-metal-

3
contaminated soils is important to understand the fate of heav7 metals in the environment
since the distribution of heavy metals in a soil profile is governed by pedogenic processes.
However, the flow of heavy metals through the various components of the
environment is quite complicated. For instance, industrial activities including ore mining,
metal processing and burning of fossil fuel generate wastes containing heavy metals that end
up in the atmosphere, water and soil, and to which living organisms are exposed. Heavy
metals present in the wastes of plants and animals, including their dead bodies, are recycled
back into the soil. As a result of this complicated biogeochemical cycle of trace metals in the
environment, an integrated approach of investigations involving simultaneous consideration
of the chemical and the physical microenvironment of the heavy metal contaminants in the
soil is essential for estimating their bioavailability. Such an approach needs to emphasize the
characterization of pedological feamres, determination of their elemental composition,
morphology and genesis, as well as establishing the nature of their association with heavy
metals in the soil. Because the association of heavy metals with a variety of soil components
has a direct effect on bioavailability and mobility, determination of how much metal in a
contaminated soil is associated with a particular soil component is essential.
In this research project, we investigated the behavior (distribution, chemical forms,
bioavailability, and the microenvironment) of heavy metals (Pb, Zn, Cu, and Ni) in soils. The
soil samples were collected from a sewage-sludge-amended farm and from an abandoned Pb
and Zn mine. The behavior of the heavy metals were studied through chemical extractions,
developing enrichment factor models, calculating bioavailability indices, and performing
micromorphological as well as microchemical analyses. We then related the behavior and
environment of the heavy metals to pedogenesis.
4
DISSERTATION ORGANIZATION
The dissertation is presented in six chapters, addressing specific aspects of metal
contamination of soil-plant systems. Chapter 1 is the general introduction, consisting of a
brief literature review and a description of the organization of the dissertation. Chapters 2 to
4 are journal papers each of which is comprised of an abstract, a brief introduction of the
specific aspect, materials and methods adopted, a presentation of the results, its discussion
and a conclusion.. Chapters 2 and 3 focus on samples from Nsukka, Nigeria, and deal with
heavy metal contamination of soils through agricultural practices (sewage sludge use).
Chapter 2 deals specifically with changes in physical and morphological properties of the
Nigerian soils as a function of sewage-sludge amendment. Chapter 3 describes the fate of
trace metals in the soils due to long-term sewage sludge amendment. Chapters 4 and S focus
on samples from the Mines of Spain, Iowa, USA, and deal with heavy metal contamination
of soils caused by Pb and Zn ore mining. Chapter 4 describes the genesis of the mine soils
and the microenvironment of Pb in the soil. Chapter 5 describes the use of soil extractants to
predict the bioavailability of Zn and Pb in the mine soils. Chapter 6 consists of general
conclusions of the various studies, and it is followed by the appendix section.
REFERENCES
Alloway, B.J., 1990. Heavy metals in soils. John Wiley and Sons. Inc. New York.
Asami, T. 1981. Tlie Ichi and Maruyama River basins; Soil pollution by Cd, Zn, Pb, and Cu
discharged from Ikuno Mine. p. 125-136. In K. Kitagishi, and I. Yamane (eds.) Heavy
metal pollution in soils of Japan. Japan Scientific Society's Press. Tolcyo.

Berti, W.R., and L.W. Jacobs. 1996. Chemistry and soil toxicity of soil trace elements from
repeated sewage sludge applications. J. Environ. Qual. 25:1025-1032.
Chester, R and M. J. Hughes. 1967. A chemical technique for the separation of ferro-
manganese minerals, carbonate minerals and adsorbed trace elements from pelagic
sediments.
Davies, B.E. and E.G. Wixon. 1985. J. Soil Sci. 36:551-570.
Davies, B.E. 1992. Trace metals in the environment: Retrospect and prospect, p. 1-18. In
Adriano, D. C. (ed.) Biogeochemistry of trace metals. Advances in Trace Substances
Research. Lewis Publishers. London.
Dickson, N.M., S.A. Watmough, and A.P Turner. 1996. Ecological impact of 100 years of
metal processing at Prescot, northwest England. Environmental Reviews 4: 18-24.
Gimeno, G.E., V. Andreu, and R. Boluda. 1996. Heavy metals incidence in the application of
inorganic fertilizers and pesticides to rice fanning soils. Environmental Pollution 92:
19-25.
Harmsen, K. 1977. Behavior of heavy metals in soils. Center for Agricultural Publishing and
Documentation, Wageningen.
Kabata-Pendias, A., and H. Pendias. 1984. Trace elements in soils and plants. CRC Press,
Inc. Boca Raton, Florida.
Lake, D.L., P.W.W. Kirk, and J.N. Lester. 1984. Fractionation, characterization and
speciation of heavy metals in sewage sludge and sludge amended soils: A review. J.
Environ. Qual. 13:175-183.
McBride, M.B., 1994. Environmental chemistry of soils. Oxford University Press. New
York.
McLaren, R. and P. V. Crawford. 1973. Studies of soil copper I. The fractionation of copper
in soils. J. Soil Sci. 24:172-181.
Sauerbeck, D., H. Barth, and P. Hermite. 1987. Effects of agricultural practices on the
physical, chemical and biological properties of soils, p. 181-210. /n Barth, H. (ed.)
Use of sewage sludge and agricultural wastes. Part 11. Scientific basis for soil
protection in the European Coniniunity. Elsevier Applied Science Publishers.
Barking, Essex.
Schintu, M., A. Kudo, G. Sarritzu and A. Contu. 1991. Heavy metal distribution and
mobilization in sediment from a drinking water reservoir near a mining area. Water
Air Soil Pollut. 57: 329-338.
Shuman, L.M. 1979. Zn, Mn, and Cu in soil fractions. Soil Sci. 127:10-17
Shuman, L.M. 1985. Fractionation method for soil microelements. Soil Sci. 140:11-22.
Simonson, R.W. 1959. Outline of generalised theory of soil genesis. Soil Sci. Soc. Am. J.
23:152-156.
Sposito, G., L. J. Lund, A. C. Chang. 1982. Trace metal chemistry in arid-zone field soils
amended with sewage sludge: I. Fractionation of Ni, Cu, Zn, Cd and Pb in solid
phases. Soil Sci. Soc. of Amer. J. 46:260-264.
Srivastava, P.C., and V.C Gupta. 1996. Trace elements in crop production. Science
Publishers Inc., NH.
Stover, R.C., L. E. Sommersand, D. J. Silviera. 1976. Evaluation of metals in wastewater
sludge. Journal of Water Pollution Control Federation, 48 2165-2175.
Tessier, A., P. G. C. Campbell, M. Bisson. 1979. Sequential extraction procedure for the
speciation of particulate trace metals. Anal. Chem. 51:844-8S 1.
7
van Valin, R., and J.W. Morse. 1982. An investigation of methods commonly used for the
selective removal and characterization of trace metals in sediments. Mar. Chem.
11:535-564.
8
CHAPTER 2. EFFECTS OF LONG TERM SEWAGE SLUDGE USE ON HUMID TROPICAL NIGERIAN ULTISOLS: I. MORPHOLOGICAL AND CHEMICAL
PROPERTIES OF SOILS
A paper to be submined to Soil Science Society of America Journal
M. O. Mbila, M. L. Thompson,* J.S.C. Mbagwu, and D. Laird.
ABSTRACT
Sewage sludge application to agricultural lands is one way to address the high demand and
low supply of commercial fertilizers in Nigeria. This study was conducted to determine the
changes in morphological and chemical properties of sewage sludge-amended soils and to
relate the changes to pedogenic processes over time. Two sites on a 5-ha sewage farm and
one control site were selected for the study. The soil at the control site was an Nsukka sandy
loam (coarse-loarny, mixed, isohyperthermic Rhodic ICandiustult). Sewage-sludge-
amendment increased the exchangeable bases, total soil C and N, and the cation exchange
capacity of the amended soils compared to the control soil. Sewage-sludge-amendment also
promoted greater aggregate development, but the high Fe and A1 content and ferrolytic
weathering in the soils complicate assessment of the effects of sewage sludge amendment on
the morphological and chemical properties of the soils. After more than 37 years of sewage
sludge amendment, the chemistry of the subsurface horizons has changed enough to warrant
a reclassification in Soil Taxonomy at the soil order level. The sludge-amended soils were
converted from Ultisols to Alfisols.

9
INTRODUCTION
The disproportionate increase in human population relative to food production has put
tremendous pressure on agricultural lands in Nigeria to produce more food. Use of
commercial fertilizers to boost food production is a common practice in such developing
regions. High demand and low supply of fertilizers make their cost unaffordable and create
the need for alternative ways of improving soil fertility at lower cost. Sewage sludge
application to agricultural land is one way to address such needs.
The application of sewage sludge to croplands has been shown to improve soil
physical properties and nutrient status, thus increasing crop production (Pagliai et al., 1981;
Mbagwu and Piccolo, 1990). In addition, sewage-sludge amendments of soils provide a
feasible disposal alternative as available land for landfills decreases and air quality
considerations restrict incineration. However, sewage sludge use may add significant levels
of salts, organic pollutants, and heavy metals such as Zn, Cu, Ni, and Pb to soils (Srikanth
and Reddy, 1991; Sridhar and Bammeke, 1986; Cabrera et al., 1994). This recognition has,
more than anything else, increased research on sewage sludge use worldwide (Emmerich et
al., 1982; Baxter et al., 1983; Lerch et al., 1990). The result is that several countries now
have guidelines for sewage sludge use that are based on the sludge content of heavy metals
and toxic organics, as well as on the chemical properties of the soil being amended.
Numerous excellent studies are available on the effects of sewage sludge use on soils.
However, an overwhelming majority of such studies have been done in temperate or
subtropical regions, with both arid and humid tropical regions receiving very little anention.
Under temperate conditions, pedogenic processes have been shown to bring about little depth
differentiation in the total contents of trace elements in soils (Swaine and Mitchell, 1960) due
10
to less intense weathering. Therefore, both trace and native metals from sludge in those soils
may be expected to be less mobile. Tropical regions are different due to a combination of
extreme climatic conditions, luxuriant vegetative growth, and soil properties associated wath
intense weathering, leaching and erosion. As a result of these conditions, considerable
weathering of the major constituent minerals of the parent material has taken place, and the
nature of accessory minerals, or secondary minerals formed, influence the behavior of both
trace and native elements from sludge. Typically, minerals in these soils are kaolinite and Fe
and A1 oxides, i.e., minerals that retain few exchangeable cations, and have a low cation
exchange capacity (CEC). Also, the high temperatures result in relatively rapid
decomposition of organic matter. Therefore the extent to which applied sewage sludge
affects the characteristics of these soils depends on the interaction of these factors.
Furthermore, studies on the use of sewage sludge have most commonly focussed on
chemical problems. For instance, Baxter et al. (1983), Emmerich et al. (1982), Lerch et al.,
(1990), and Darmody et al. (1983) showed increases in total soil Zn, Cu, Ni, Cd, Pb, and Hg
after cumulative sludge addition. Dowdy et al. (1984) found that cadmium and zinc applied
in sewage sludge over 14 years had moved out of the surface zone of incorporation and were
concentrated in clay coatings in the B horizon of a fme, illitic, mesic Aerie Ochraqualf. Other
studies report the extent to which trace metals from sewage sludge can move in the soil
(Williams et al., 1984). None of these studies addressed the effects of sludge on the physical
and morphological properties of soils, and knowledge of these changes is limited. One of the
few studies that adopted a morphological approach was that of Pagliai et al. (1983). They
observed porosity changes after incorporation of pig slurry and sewage sludge to a Vertic
Xerochrept and a Typic Psammaquent. Using point-counting techniques with light

11
microscope, the authors measured larger but fewer pores in the upper part of the control soils,
and smaller but more total pores in the treated soil. Increase in total porosity of the treated
soils was attributed to reduction of elongated pores (cracks) in the treated soils by the organic
amendments. Understanding such morphological changes in sewage-sludge-amended soil
properties is required to accurately evaluate the effects of sewage sludge on soils.
The objective of this study was to monitor changes in the chemical, physical and
morphological properties of sewage sludge-amended soils as a function of sewage sludge
amendment and to relate these changes to pedogenic processes. Monitoring these changes
will provide a better understanding of soil genesis in newly disturbed soil systems. Besides, it
will provide background information essential to understand the fate of trace metals
introduced by sewage sludge application. Detailed information on the forms and profile
distribution of total and extractable trace metals with depth for these soils, and the pedogenic
processes that might play a role in their redistribution and availability for plant uptake are
presented in the next chapter.
MATERIALS AND METHODS
Site Description and Fieldwork
This study was conducted at the University of Nigeria, Nsukka (UNN) sewage farms.
The UNN sewage farm is comprised of several small parcels of land covering about S ha,
whose source of fertility is sludge generated from the university sewage treatment plant. The
farms are located around the UNN Sewage Treatment Facility, north of the university
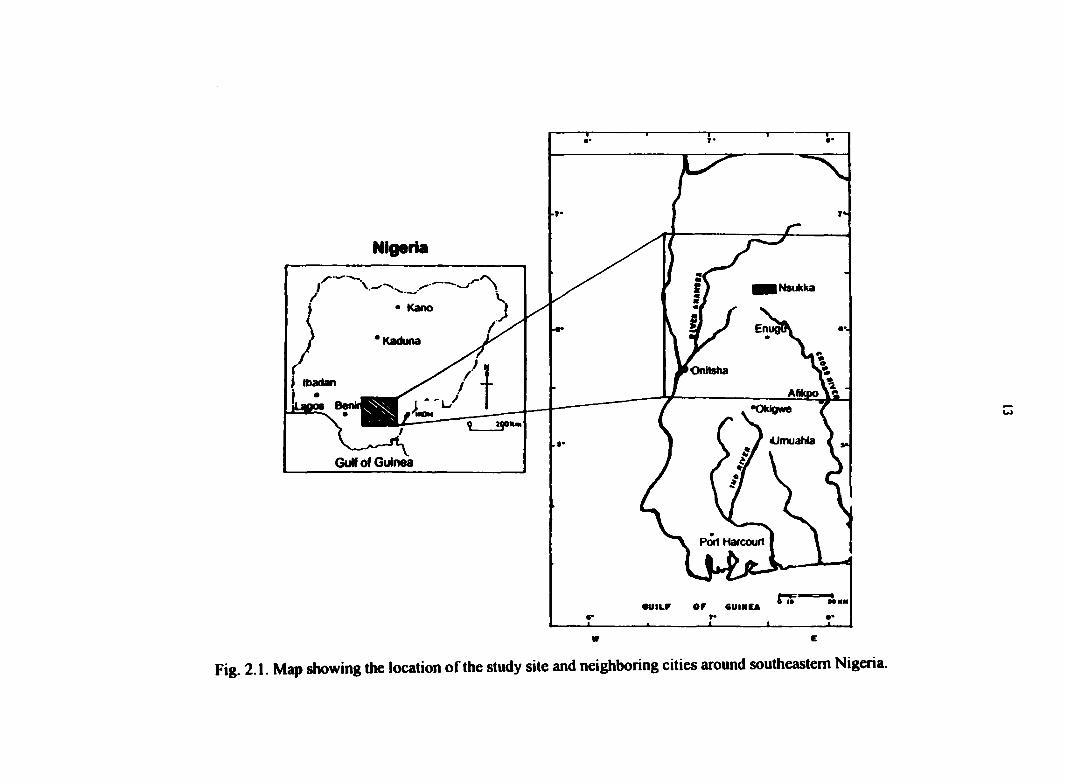
campus. The UNN campus is located in the city of Nsukka, approximately between latitude
6' and T N and longitude T and 8° E (Fig. 2.1).
12
The geological fonnation of Nsukka is the sedimentary basin -one of the two broad
geological formations in Nigeria that covers most of the southeastern region of the country
(Ola, 1983). The sedimentary basin is underlain by the most recent sedimentary rocks of the
Cretaceous age. The parent material is unconsolidated sandstone material that varies in
composition from quartz arenites through feldspathic sandstones to arkoses. The Nsukka area
lies on a plateau that is characterized by residual hills that are separated by wide, flat-
bottomed dry valleys. The study area lies in one of the valleys, and it is bounded by residual
hills on three sides. The micro-topography of the area is generally flat (< 0.5% slope).
Nigeria is in the subhumid tropics with distinct wet and dry seasons. The wet season
is between April and October, and the dry season is between November and March. The
rainfall in Nsukka area averages 1600 mm/year and is bimodally distributed with peaks in
July and September (Agbola, 1979). The main crops grown at the sludge sites are vegetables
(tomatoes, Lycospersicum spp.; pepper, Capiscum annuum; Amaranthus, Amaranthus spp.),
cereals (maize, Zea mays), and root crops (e.g., cassava, Manihot esculenta). Cultivation in
the sewage sludge-amended soils is an all-year-round event, whereas the control soil is
cultivated once a year. Cultivation involves spreading the dried, anaerobically digested
sewage sludge on the soil surface and plowing in the sewage sludge with traditional hoes, to
raise beds for growing the vegetables. Sometimes this is done under heavy rains that can
potentially accelerate leaching of soil constituents. Tillage extends the sludge-soil layer (20
to 30 cm) below the surface of the soil.
Nigeria
Nsukka
• Kano
Em Kaduna
Onitsha f Ibadan
GuW Of Guinea
Pod Harcouft
or •UILF
c w
Fig. 2.1. Map showing the location of the study site and neighboring cities around southeastern Nigeria.

14
Soils were sampled at 2 sewage-sludge-amended sites as well as at a site where
sludge had not been applied. All three soils were believed to be similar in terms of parent
material, topography and cultivation history. For each of the sites, a pit was dug and
described according to the methods of the Soil Survey Staff (1993). Horizons of the profiles
were delineated and then sampled into small plastic bags to be transported to the laboratory
for analyses.
The UNN Sewage Sludge
The processing of the sludge in the University of Nigeria, Nsukka, sewage treatment
plant is minimal, comprising filtering and holding the sludge for anaerobic digestion, ai^er
which it is dried and applied to land. At the sewage farms, there were no records of the rate
of sewage-sludge application. However, farmers have been using the sludge since the
inception of the sewage sludge facility (about 37 years ago). The application rate in 1997 was
estimated by mapping a 1-m' quadrant on the ground, collecting all the sewage sludge within
the quadrant, and weighing it to calculate the rate in kg/ha. At three different locations on the
farms, 2 kg/m^, 1.6 kg/m^ and 0.8 kg/m" were recovered from the soil surface. Therefore, the
average of 1.5 kg/m^ (15 tons/ha) was estimated to be the sewage sludge application rate for
each of the three plant-growing seasons per year. Samples of the sewage sludge were taken at
the time of one application to determine the physical and chemical properties of the sludge
by using the techniques outlined below for soil samples. Selected characteristics of the dried
sludge are presented in Table 2.1.

15
Table 2.1. Selected characteristics of UNN sewage sludge.
Characteristic Value
pH 5.4 Total C(g kg-') 356
Total N (g kg"') 21
Nutrient Analysis (cmol(+)kg ')
Ca 30.5 Mg 3.1 Na 0.7 K 1.6 Exchangeable acidity (cmol(+)kg'') 3.1
Cation exchange capacity (cmol(+)kg'') 39
Base saturation (%) 92

16
Laboratory Analyses
The sludge samples as well as bulk soil samples were air dried, crushed with a
wooden rolling pin, and passed through a #10-mesh sieve. Particle size distribution was
determined by the hydrometer method after dispersion of soil with Na hexametaphosphate
and sand sieving (Gee and Bauder, 1986). Soil pH was measured in 0.1 M KCl and in
distilled water with a soil:liquid ratio of 1:1. Exchangeable bases were extracted with 1 M
NH4OAC at pH 7.0 (Thomas, 1982). The extracts were analyzed for Ca, Mg, K, and Na by
inductively coupled Ar plasma atomic emission spectroscopy. Exchangeable acidity (H^ +
Al^*) was determined by the 1 A/ KCl method. Exchangeable FT" was calculated by
subtracting the titrated A1 from exchangeable acidity (Thomas, 1982). Cation exchange
capacity (CEC) was calculated from the sum of Ca^", Mg^*, K", and Na" plus exchangeable
acidity. Total C and N were determined by dry combustion by using a LECO-CHN analyser
(Nelson and Sommers, 1982). Free Fe and Mn oxide contents of the samples were
determined by the citrate-bicarbonate-dithionite (CBD) extraction of Jackson et al. (1994)
and determined by atomic absorption spectroscopy. Total Fe and Al were determined by
digesting the samples with 16 M HNO3 at 100°C for 16 hours and analyzing the filtrate with
the ICP-AES.
Soil Micromorphological Analyses
Undisturbed soil samples from both the control soil and sludge-amended soils were
air dried at room temperature rather than oven drying to minimize the development of
artificial cracks in the samples that could be confused with the natural porosity of the soil.

17
Samples were subsequently impregnated with polyester resin and made into thin sections
following the procedures of Murphy (1986). Polished thin sections were described using the
guidelines for soil thin section description (Bullock et al., 1985).
Micromorphometric analyses of microstructure and porosity were carried out by point
counting of features under the light microscope (Eswaran, 1968). Point counting is based on
the principle that the number of points counted for a component is proportional to its area and
thus to its volume. The point-counting exercise was carried out using a micrometer in the
image plane of the microscope eyepiece. The image of the micrometer appears superposed on
the image of the object. Each thin section was subdivided into 5 x 5-mm quadrants so that
observations can be evenly spread across the thin sections. Soil components counted were
micropores (<50 nm in diameter), macropores (>50 ^m in diameter), microaggregates (<200
^m in diameter), macroaggregates (>200 ^m in diameter), and minerals present. The soil
components at each of the 100 regularly spaced observations were identified and counted
(see raw point counting data in Appendix A3). When several fields were counted (about 1000
points per thin section), the frequency of each constituent was expressed as a percentage of
the total number of points counted. Magnification used during counting was x20.
It is acknowledged that because several repeated point counting on a thin section is
likely to give slightly different result each time, there is the need to determine the statistical
error of the point counting. The standard deviations shown in Appendix A3 may be
considered more as the variability within the thin sections, since the calculations were based
on many 5x3 nun quadrants of only one thin section for each soil horizon. However,
published results of several authors show that within-sample variation in point counting is
generally larger than standard error (Murphy and Banfield, 1978; Hill, 1970). In general.
18
however, interpretations of standard and relative deviations of point counting must be done
with caution because in natural soil material, the different components are not
homogeneously distributed in the thin section, and the distribution pattern could be of
dimensions that far exceed the size of thin sections.
Clay Mineralogical Analyses
The mineralogy of the clay fraction was determined by x-ray diffraction PCRD)
analysis using CuKa radiation with a Siemens D5000 diffractometer The samples to be
analysed were treated with sodium acetate to remove carbonates, and with hydrogen peroxide
to remove organic matter. Then the samples were dispersed in sodium carbonate and
fractionated to obtain <2 ^m clay. The <2 |im clay fraction was saturated with a cation (Mg
or K) and freeze-dried. Oriented samples were then prepared by plating the clay onto ceramic
tiles by using a vacuum filtration apparatus. The Mg-saturated samples were equilibrated
with glycerol, and the K-saturated samples were heated to SSO^C and 550°C before x-ray
analysis. During the XRD analysis, all samples were continuously scanned from 2 to 60°26
at a scanning rate of 4®20 per minute. The scans were then compared with documented
patterns published by the International Center for Diffraction Data for identification.
RESULTS AND DISCUSSION
Morphology, Mineralogy and Classification of the Control Soil
The goal of the study was to compare pedons for which soil-forming factors other
than those altered by agricultural land use (sewage sludge amendment) were similar. The
sampling sites were adjacent to one another on nearly level sites, and the soils were well to

19
moderately-well drained with no evidence of significant erosion. Both the sludge-amended
and the control soils had been under constant cultivation for at least 37 years and are assumed
to have had a similar degree of development and the same absolute age. Because of these
similarities, characteristics of the control soil (pedon 1) were assumed to be the initial
characteristics of the soils of the study area before sewage sludge amendment of the soils.
Pedon 1 was a deep and uniform reddish brown (2.5YR 3/4), well-drained soil profile
that developed on false-bedded sandstone. All soil horizons were very strongly acid (pH 4.6-
4.9) and contained small amounts of total C that decreased in concentration with depth
(Table 2.2). Base saturation was less than 52% in all horizons and less than 35% at 125 cm
below the siuface of the argillic horizon. Cation exchange capacity (by summation) was 2.59
cmol (+) kg'' or less in all the horizons. Exchangeable A1 and H in the control soil were low
in the surface horizon (0.61 and 0.50 cmol (+) kg"', respectively), but they increased in the
subsurface horizons with lower pH values.
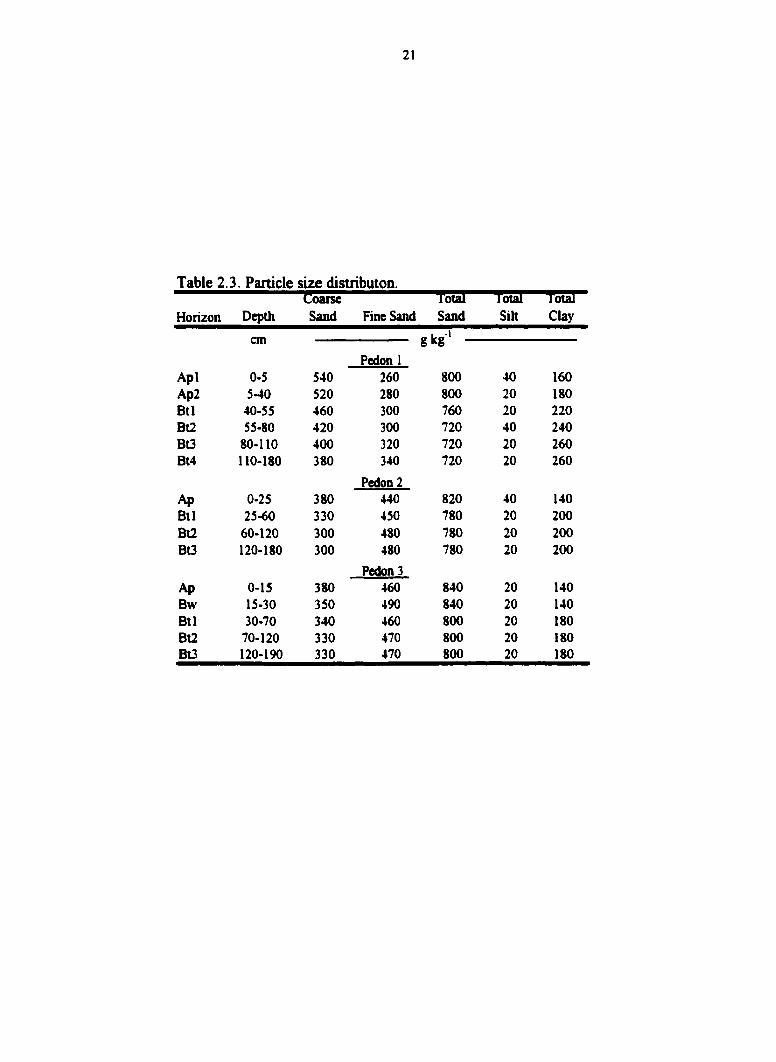
The surface horizon of pedon 1 was sandy loam (140-160 g clay kg"' soil), whereas
the subsurface horizons were sandy clay loam (180-260 g clay kg"' soil) (Table 2.3).
Evidence of clay translocation in the field was not very strong because of the small amounts
of the translocated clay. However, micromorphological observations of undisturbed thin
sections of pedon 1 showed patchy thin coatings of clay minerals with iron oxides, mainly on
sand grain faces and around pores (Fig. 2.2). The presence of cutans, together with increase
in clay content of the B horizons relative to the overlying eluvial horizons, qualifies pedon 1
to have an argillic horizon (Soil Survey Staff, 1998).
The soil moisture regime, estimated from the annual rainfall and monthly
evaporation (Fig. 2.3) was ustic. Mean annual temperature of soils in the study area is greater

Table 2.2. Chemical properties of the soils. Base Ca Al
pil Toul C ToUl N Kxchangcable bases Exchangeable acidity CKC saturation saturation. saturat
Horizon Depth Ca MR K Na Al H Sum
s k> ' 1 cnvkl /'4-) lev 1 cm B
Pedon 1 VIIHJI KG
Apt 05 4.9 122 1 10 063 032 003 0 21 061 050 2 29 52 27 27
Ap2 5-40 4.6 69 090 035 0.06 0.08 0.07 1 27 0.46 228 24 15 56 Btl 40-55 4.6 60 0.90 020 005 0.09 0.03 1 88 0.33 2.59 14 8 73 Bl2 55-80 46 3 5 1.00 014 004 010 005 1 63 044 2.40 14 6 68 Bl3 80-110 4.6 3.1 080 016 006 009 0 05 1 54 0 26 2 16 16 7 71 Bl4 110-180 4.8 1.9 0.60 008 003 0 10 005 086 055 1.67 15 5 52
I'cdon 2
Ap 0-25 48 13 0 1.70 224 0 81 035 0.45 024 0.10 4 20 92 53 6 BlI 25-60 45 47 1 30 1 38 076 0.28 045 096 0.30 4.14 69 33 23 Bf2 60-120 4 1 1.8 090 098 0 55 024 0.42 072 0.30 3 22 68 31 22 Bt3 120-180 4.1 1.1 080 0.76 036 0.14 033 062 030 2.52 63 30 25
Pedon 3
Ap 0-15 3,7 149 1 50 0.91 0 21 024 025 1 39 071 3.72 43 25 37
Bw 15-30 37 43 100 035 009 0 12 0 18 1 87 1 12 3 73 20 9 50
BlI 30-70 42 12 0.80 076 0 27 0 16 0 16 086 051 272 49 28 32 Bt2 70-120 5.0 09 080 096 029 O i l 0.17 0.29 0.20 2 02 76 48 14 Bt3 120-190 52 0.6 070 092 044 0.17 0 17 0 14 0 10 1.93 87 48 7
21
Table 2.3. Particle size distributon. Coarse Total Total Total
Horizon Dq)th Sand Fine Sand Sand Silt Clay
win g Kg
Pedon 1 Apl 0-5 540 260 800 40 160 Ap2 5-40 520 280 800 20 180 Btl 40-55 460 300 760 20 220 Bt2 55-80 420 300 720 40 240 BG 80-110 400 320 720 20 260 Bt4 110-180 380 340 720 20 260
Pedon2 Ap 0-25 380 440 820 40 140 Btl 25-60 330 450 780 20 200 Bt2 60-120 300 480 780 20 200 Bt3 120-180 300 480 780 20 200
Pedon3 Ap 0-15 380 460 840 20 140 Bw 15-30 350 490 840 20 140 Btl 30-70 340 460 800 20 180 Bt2 70-120 330 470 800 20 180 Bt3 120-190 330 470 800 20 180

22
Fig. 2.2(i). (a) soil pore space, (b) clay coating of the pore, and (c) quartz grains, (d) soil micromass, (Pedon 1, Bt3. 80-110 cm). PPL.
Fig. 2.2(ii). Same as photomicrograpgh above, XPL.

BB Abo«e 4064 nm
W 3S56-4064 mm
MB 30«l-3SS6fflffl
M 2540-3041 mm
^^3 22W-2S40 mm
G59 2032-22M mm CD 177t 2032 mm
I 1 Betow 1778 mm
80
1 Enugu 2 NsuKka 9 Onilsha 4 AwKa s Udi • Oooja
7 AbakiliM
t OO'kwi 9 Alikpo w UgeD 11 Obubro 12 Ikom
tl Owerri 14 Umuahia ts Ahoflria It Aba IT Arochukii 14 Ikoi Ekpene
KHomtiers
1* Ytnfgoa 20 RDrlHorcourl 21 Uyo 22 Calabai 23 Opobo 24 Oon
Fig. 2.3. Mean annual rainfall Eastern Nigeria (after Lekwa and Whiteside, 1986).

24
than 22°C to about 50 cm depth, and there is a difference of less than 5°C between mean dry
and mean wet season soil temperatures. These characteristics indicate an isohyperthermic soil
temperature regime (Soil Survey Staff, 1998).
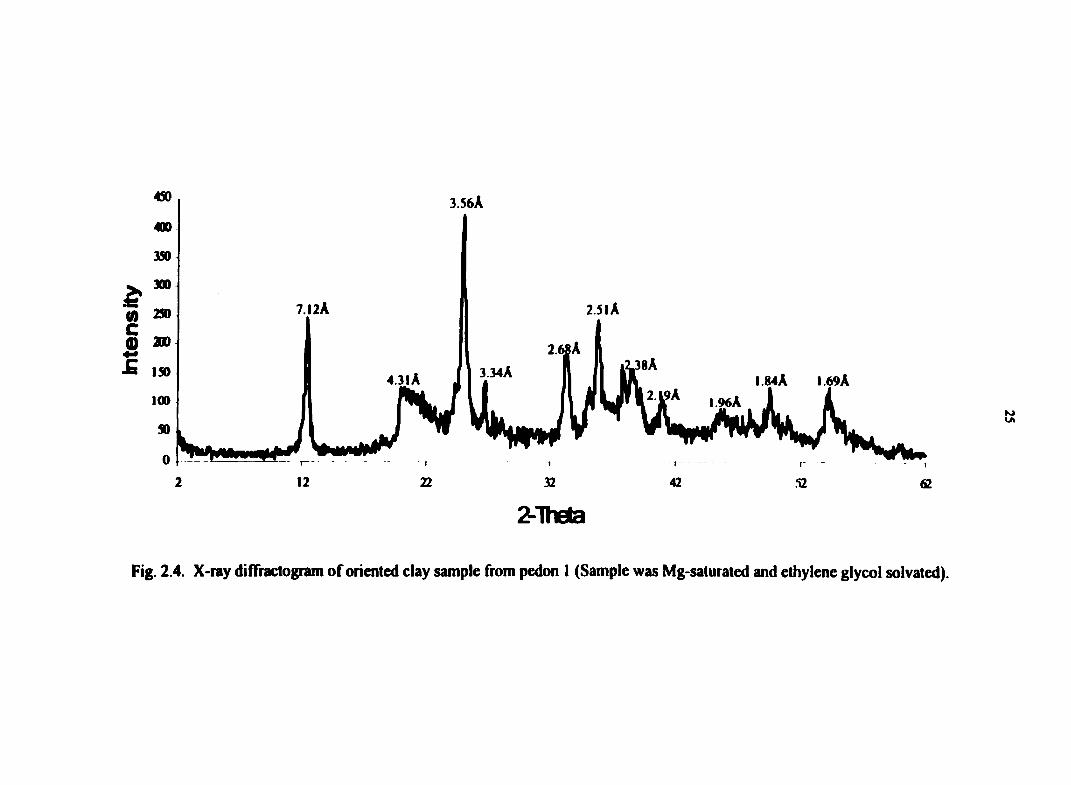
Mineralogy of the <2 ^m clay fraction of all the horizons of pedon 1 was the same
and included quartz, kaolinite, and hematite (Fig. 2.4). X-ray diffraction peaks at 4.31 A, and
3.34A indicated the presence of quartz in the soils. Peaks at 7.12 A, 3.56 A and 2.38A
indicate presence of kaolinite, whereas peaks at 2.68A, 2.51 A, 2.19A, 1.84A, and 1.69A
indicate that Fe oxide was present as hematite. Kaolinite was the most abundant type of clay
mineral present in the soil. The strong reddish brown color of the soils (hue of 2.5YR),
however, is a result of the common occurrence of hematite. The XRD patterns (Fig. 2.4) as
well as micromorphometric determinations (point counting) on thin sections (Table 2.4)
showed that quartz was the main primary mineral in the soil. The dominance of quartz,
kaolinite, and crystalline Fe oxides is characteristic of most tropical soils due to deep
weathering. On the basis of the morphological, chemical and mineralogical properties, the
control soil (pedon 1), was classified as a fine-loamy, kaolinitic, isohyperthermic Rhodic
Kandiustult (Soil Survey Staff, 1998).
Effects of Sewage-Sludge-Amendment on Soil
Chemical Properties
The total soil C, assumed to be entirely organic C for these soils, ranged from 1.90 to
12.20 g kg'' in control pedon, fit)m 1.10 to 13.0 g kg'' in pedon 2, and from 0.6 to 14.90 g kg'
in pedon 3, but concentrations at the soil surface decreased with soil depth in all soils (Table
4» 3.56A
400
350
300
M 250 7.I2A 2.51A
c S 200
£ ISO ,38A 3.34A 4.31A I.84A I.69A
100 I.96A
2 12 22 32 42 52 62
2-lhela
Fig. 2.4. X-ray difTractogram of oriented clay sample from pedon 1 (Sample was Mg-saturated and ethylene glycol solvated).
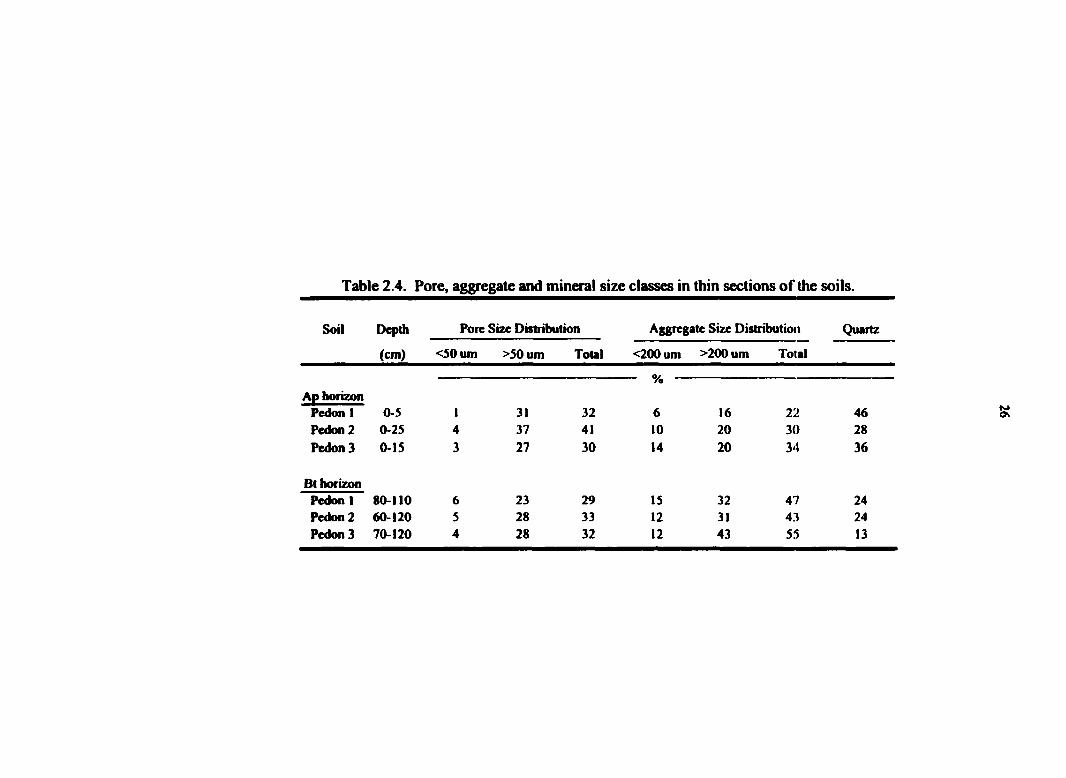
Table 2.4. Pore, aggregate and mineral size classes in thin sections of the soils.
Soil Dq>th Pore Size Distribution Aggregate Size Distribution Quartz
(cm) <50 um >50 um Total <200 um >200 um Total
% Ap horizon
Pedon 1 0-5 1 31 32 6 16 22 46 Pedon2 0-25 4 37 41 10 20 30 28 Pedon 3 0-15 3 27 30 14 20 34 36
Bthorizon Pedon! 80-110 6 23 29 15 32 47 24 Pedon 2 60-120 5 28 33 12 31 43 24 Pedon 3 70-120 4 28 32 12 43 55 13

27
2.2). Although the absolute concentrations of organic C were about the same in the near-
surface horizons of the three soils, the thickness of the sludge-amended Ap horizons was 3-S
times that of the surface horizon in the control soil. Calculated organic C accumulation in the
three soil profiles showed that a total mass of organic C of 23.9 metric tons/ha (pedon 1),
39.0 metric tons/ha (pedon 2), and 32.0 metric tons/ha (pedon 3) is contained in the top 20-
cm of the three soils (Appendix A4). Therefore, the total mass of organic C increased greatly
as a result of sludge amendment.
The distribution of total N in the soil profiles followed the same trend (i.e., decreased
with depth) as total carbon. When compared to the control soil (0.6-1.1 g kg"'), the total N
content of the sewage sludge amended soils had increased to 0.8-1.7 and 0.7-1.S g kg ' for
pedons 2 and 3 respectively, and there were greater differences in the Ap horizons (Table
2.2). The C/N ratios of all the soils ranged from 1-11 and without exception, higher ratios in
the soil surface decreased with soil depth. As expected, these ranges of C/N ratios are lower
than the C/N ratio in the sewage sludge (17), but they are comparable to ratios reported for
some southeastern Nigerian soils (Unamba-Oparah, 1983; Singh and Balasubramanian,
1982), and for some rain forest soils in Sudan-Zambesi savannahs (Sys, 1978). The similarity
in C/N ratios of the control and sludge-amended soils is probably an indication that the rate
of sludge decomposition in the sludge-amended soils is approximately the rate of sludge
addition.
The soil cation exchange capacity (CEC) values ranged from 1.67 to 2.59 cmol (+)
kg ' in the control soil, from 2.52 to 4.20 cmol (+) kg'' in pedon 2, and from 1.93 to 3.72
cmol (+) kg*' in pedon 3. Without exception, CEC of the soils decreased in value with depth
(Table 2.2). The CEC was higher in the sewage-sludge-amended soils, but several reasons
28
could have been responsible for this. As in most tropical soils, the capacity of the soils to
adsorb cations depends on the clay content, the organic matter content, the abundance of
sesquioxides and the pH. Given that the clay CEC (CEC/%clay) of the soils (1-3 cmol (+) kg"
' clay) is within the range defined for low-activity clays (<16 cmol (+) kg ' clay), it can be
assumed that differences in CEC between the soils may not be due only to clay content.
Sludge-amendment greatly increased the total mass of organic matter, thus increasing the
CEC of those soils. Since all the soils generally have low pHs, the influence of pH on the
CEC of the soil is expected to be uniform. For instance, at the low pHs of the soils, and with
the high concentrations of Fe and Al, formation of Fe - and Al-hydroxy polymers that are
positively charged is to be expected, and the hydroxy polymers could neutralize some
negative charge sites on clay and organic matter by strong adsorption mechanisms, thereby
reducing the CEC.
Calcium dominated the cation exchange complex in both the control and sewage-
sludge-amended soils and was more concentrated in the surface horizon than in the
subsurface horizons (Table 2.2). Calcium saturation was much higher, especially, in the
sludge-amended soils (25-53%) than in the control (5-27%). Values of exchangeable Ca
(30.5 cmol (+) kg"' dry matter) and Ca saturation in the sludge (78%) were both high,
suggesting that this is a source of the Ca in the sludge-amended soils.
Concentrations of the other basic cations (Mg, K, and Na) in all soils were fairly low,
but similar to the trend of Ca. Exchangeable Mg, K, and Na were all higher in the sewage-
sludge-amended soils than in the control soil. With the exception of Mg in pedon 3, they
decreased with soil depth. Exchangeable Mg comprised about 1-14% of the total CEC in the
control pedon, and about 2-19% of the total CEC in the sludge-amended pedons.
29
Exchangeable K and Na concentrations in the sludge-amended soils were more than twice
those in the control soil. Exchangeable Mg, K, and Na were more uniformly distributed down
the profile than was exchangeable Ca, which was more concentrated in the soil surface.
The most interesting result of sewage-sludge amendment on soil chemical properties
with respect to soil classification was that sewage-sludge amendment increased exchangeable
cations enough to warrant change of the taxonomic classification of the soils at the order
level. Alfisols differ from Ultisols in having higher base saturation (> 35%) at the base of the
argillic horizon (125 cm below the top of the argillic). Consequently, the sewage-sludge-
amended soils were converted from fine-loamy, kaolinitic, isohyperthermic Rhodic
Kandiustults to fine-loamy, kaolinitic, isohyperthermic Rhodic Kandiustalfs.
Morphological Properties
Major genetic horizons were present in all three pedons (Table 2.5), but the degree of
horizon differentiation was slightly less in the sludge-amended soils, probably due to
disturbance by constant plowing and faunal activities that follow sludge application. A thin
Ap horizon, as found in the control pedon (5 cm), is typical of unamended, and usually, less
intensively cultivated soils in the area. The Ap horizons of the sludge-amended soils (15-25
cm) were thicker than that of the control soil (5 cm) due to intensive cultivation and
mechanical mixing of surface horizons with horizons below the Ap by plowing in the sludge.
The A horizon of the control soil was redder in hue than those of the sludge-amended
soils. Modification of soil color due to repeated addition of the UNN sludge is to be expected
since the sewage sludge was very dark brown to black (lOYR 2/1 and 2/2). The effects of
color modification have been shown to be important in soils since it influences the soil
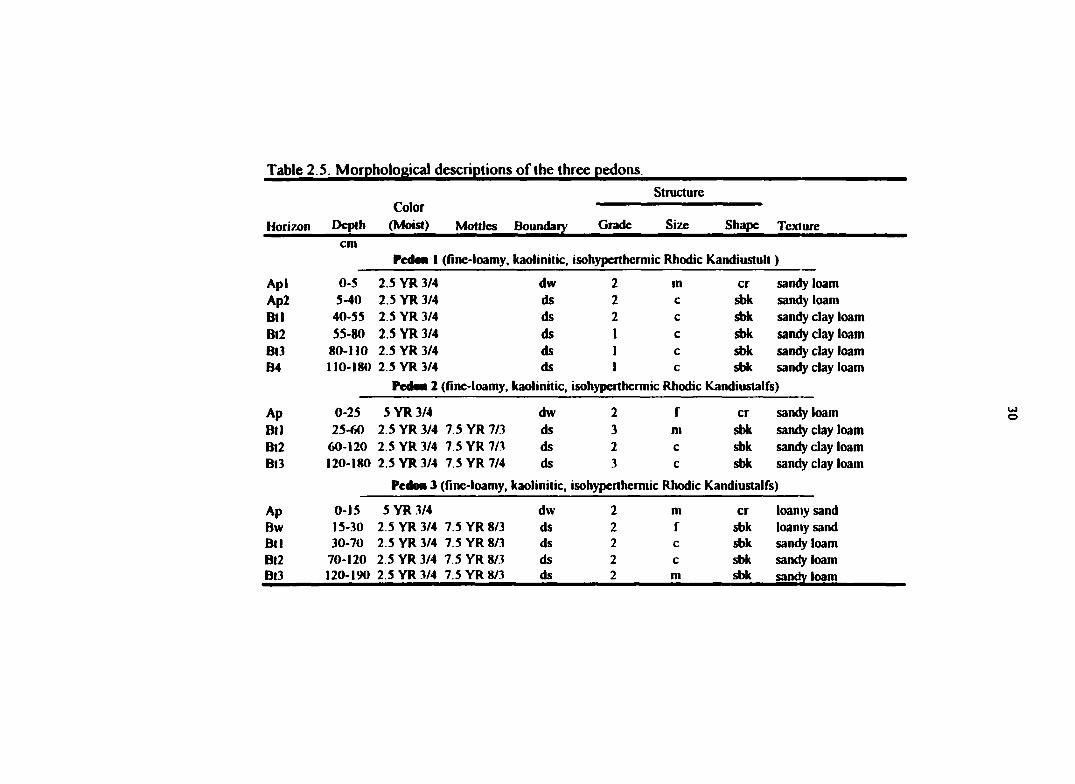
Table 2.5. Morphological descriptions of the three pedons.
Structure Color
Horizon Depth (MoisI) Mottles Boundaiy Grade Size Shape Texluie cm
Pedoa 1 (fine-loamy, kaolinitic, isohypeithermic Rhodic Kandiustull)
Apl 0-5 2.5 YR 3/4 dw 2 in cr sandy loam Ap2 5-40 2.5 YR 3/4 ds 2 c sbk sandy loam Btl 40-55 2 5 YR 3/4 ds 2 c sbk sandy clay loam Bt2 55-80 2.5 YR 3/4 ds 1 c sbk sandy clay loam Bt3 80-110 2 5 YR 3/4 ds 1 c sbk sandy clay loam B4 110-180 2.5 YR 3/4 ds 1 c sbk sandy clay loam
Pedoa 2 (fine-loamy, kaolinitic, isohyperthermic Rhodic Kandiustalfs)
Ap 0-25 SYR 3/4 dw 2 f cr sandy loam Ell 25-60 2.5 YR 3/4 7.5 YR 7/3 ds 3 m sbk sandy clay loam Bt2 60-120 2.5 YR 3/4 7.5 YR 7/3 ds 2 c sbk sandy clay loam Bl3 120-180 2.5 YR 3/4 7.5 YR 7/4 ds 3 c sbk sandy clay loam
Pedoa 3 (fine-loamy, kaolinitic, isohyperthermic Rhodic Kandiustalfs)
Ap 0-15 5 YR3/4 dw 2 in cr loamy sand Bw 15-30 2.5 YR 3/4 7.5 YR 8/3 ds 2 f sbk loamy sand Btl 30-70 2.5 YR 3/4 7.5 YR 8/3 ds 2 c sbk sandy loam Bl2 70-120 2.5 YR 3/4 7.5 YR 8/3 ds 2 c sbk sandy loam Bt3 120-190 2.5 YR 3/4 7.5 YR 8/3 ds 2 m sbk sandy loam

31
albedo (Brady, 1974). Darker surface soils absorb heat more readily than lighter-colored
surface soils. In a tropical climate characterized by very high temperatures and sunshine
intensity, soil color becomes very important with respect to evaporation and specific heat
relationships, because, a dark-colored soil warms up more quickly than a lighter-colored soil.
Micromorphological Characteristics of the Control Soil
Ap horizon
Light microscopic observations demonstrated that the epipedon of the control soil had
a complex microstructure that was dominantly intergrain microaggregate structure and
single-grain structure (Bullock et al., 1985). The microaggregates were spheroidal, irregular,
and mainly of medium size (200-300 um), but few coarse microaggregates (500-600 um)
were present. Figure 2.5 is a micrograph showing the microstructure and pore size
distribution of the Ap horizon of pedon 1. The pores were essentially of the complex packing
type that occurred between single grains and microaggregates. Very few channels occurred
between the aggregate units. Total porosity determined by point counting was 25-30 % of the
thin section.
Groundmass was very homogenous with mainly a chitonic tending locally to enaulic
related distribution pattern. The basic mineral component of the soil was quartz (27-46% of
the slides) and was the only mineral that was identified on thin sections. The fine material
(micromass) was very homogenous, reddish brown in color, and mainly clay size materials
containing optically opaque or nearly opaque Fe oxides. The reddish colors resulted from
high amounts of Fe oxide in the soils. However, where the Fe oxides were not opaque, they
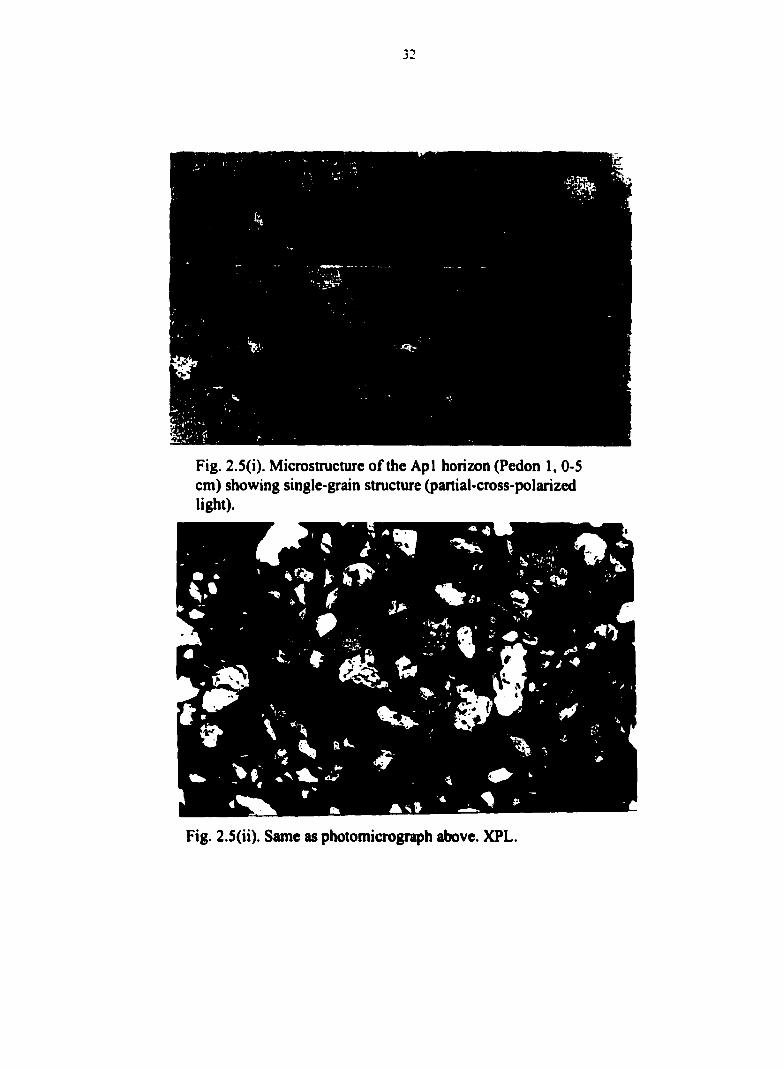
32
Fig. 2.5(i). Microstructure of the Apl horizon (Pedon 1, 0-5 cm) showing single-grain structure (partial-cross-polarized light).
Fig. 2.5(ii). Same as photomicrograph above. XPL.

33
were predominantly isotropic, which usually indicates short- range crystallinity. The 6-fabric
of the fine materials was undifferentiated and characterized by an absence of interference
colors in the fine mass due to masking by sesquioxides. Many coarse undecomposed plant
tissue fragments (150-250 ^m width, ~1 mm length) were present, whereas fine organic
materials may have been incorporated in the micromass. Rounded, reddish black, amorphous
impregnative nodules (0.5-0.7 mm diameter) with sharp boundaries were common and
probably consisted of Fe oxides with or without organic matter.
Bt HorizoDs
The Bt horizons had a complex microstructure, comprised of intergrain
microaggregate structure and locally subangular (2-4 mm) blocks that parted into strongly
developed granules (200-300 |im diameter) (Fig. 2.6). Pores were essentially complex
packing voids between the granules and grains, with very few channels (20-30 |im diameter)
between aggregates or within peds. Total porosity was 23-28% of the slide. The
microstructure consisted of compact micropeds (about 50 - 200 in diameter)
corresponding to the so-called pseudo-sands (Guedez and Langhor, 1978; Embrechts and
Stoops, 1987). The development of strong micropeds in the Bt horizons correspond to high
Feo in the soil (Table 2.6), suggesting that free Fe oxide was acting as a cementing agent in
the B horizons and was probably partly responsible for the development of the microped
structure.
The groundmass of the Bt horizons was very homogenous with quartz (13-24% of
thin section and 98% of all minerals) as the main basic mineral component, with some
feldspars (2%). The arrangements of the coarse mineral grains with pockets of aggregates in
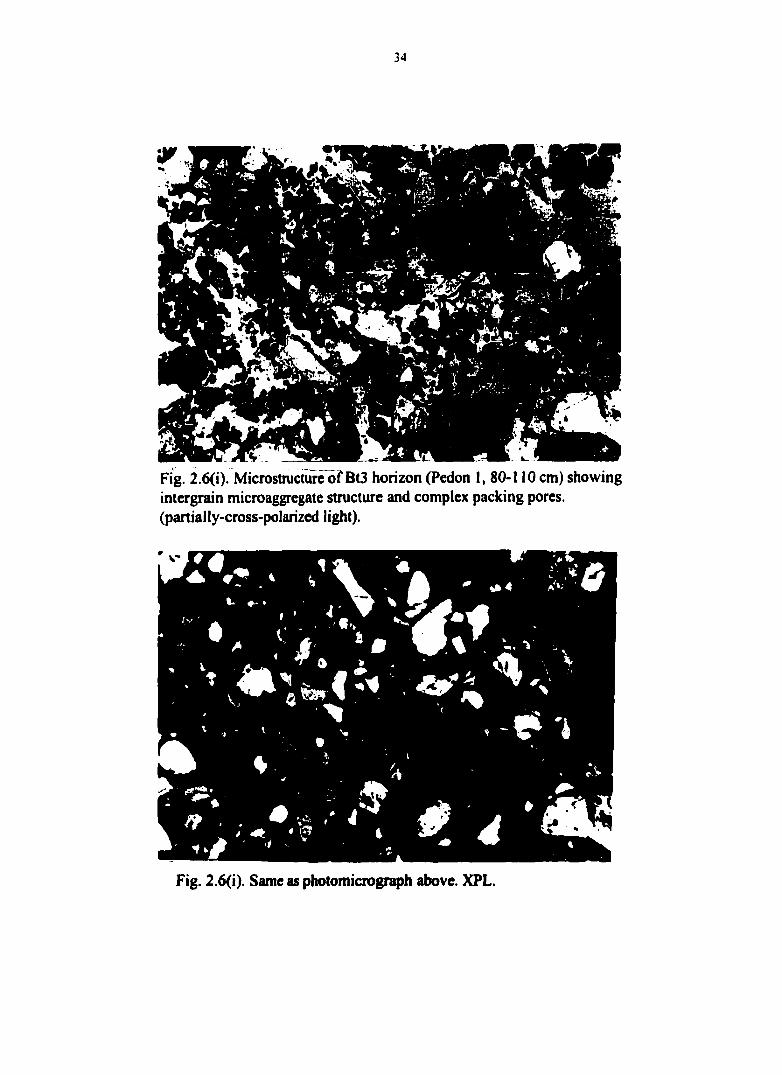
Fig. 2.6(i). Microstructurc of Bt3 horizon (Pedon 1, 80-110 cm) showing intcrgrain microaggregate structiire and complex packing pores, (partially-cross-polarized light).
Fig. 2.6(i). Same as photomicrograph above. XPL.
35
the Bt horizons, form packing voids with fme materials that either bridge or occupy the
intergranular spaces and can be described as a chitonic tending locally to enaulic and open
porphyric related distribution pattern. The fine material was very homogenous, reddish
brown, and mainly clay-size materials containing optically amorphous Fe oxides. As in the
surface horizon, the reddish colors resulted from high amounts of Fe oxide in the soils. The
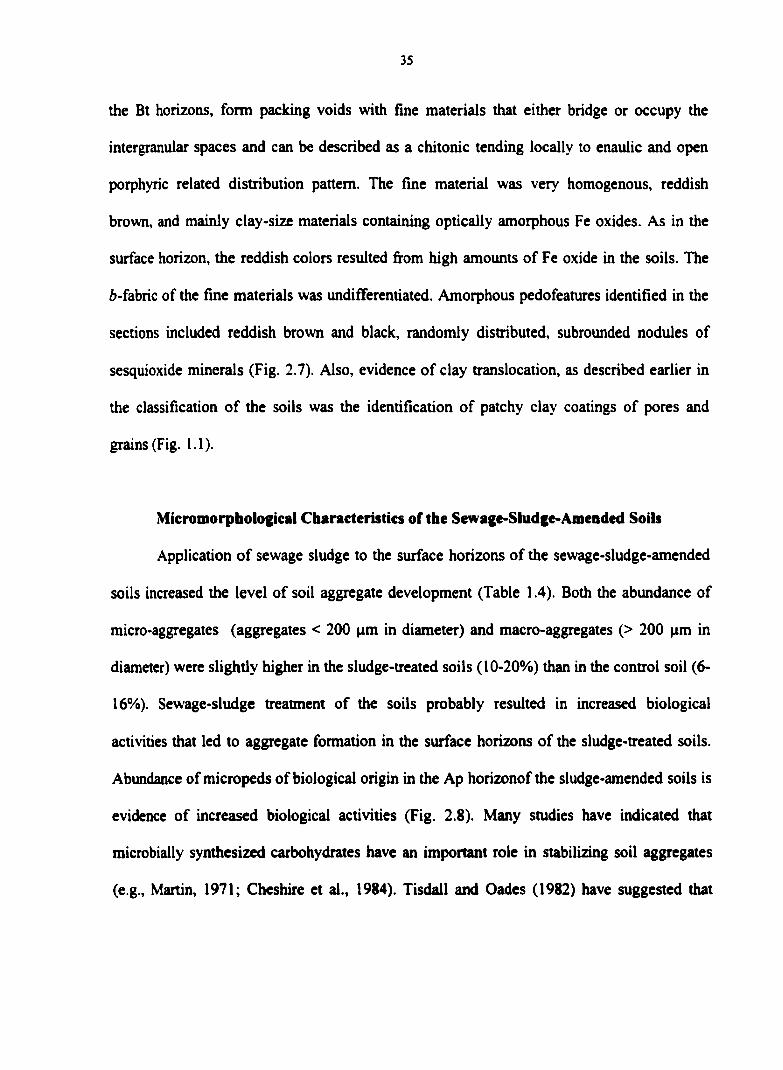
6-fabric of the fine materials was undifferentiated. Amorphous pedofeatures identified in the
sections included reddish brown and black, randomly distributed, subrounded nodules of
sesquioxide minerals (Fig. 2.7). Also, evidence of clay translocation, as described earlier in
the classification of the soils was the identification of patchy clay coatings of pores and
grains (Fig. 1.1).
Micromorphological Characteristics of the Scwage-Sludgc-Amcndcd Soils
Application of sewage sludge to the surface horizons of the sewage-sludge-amended
soils increased the level of soil aggregate development (Table 1.4). Both the abundance of
micro-aggregates (aggregates < 200 ^m in diameter) and macro-aggregates (> 200 ^m in
diameter) were slightly higher in the sludge-treated soils (10-20%) than in the control soil (6-
16%). Sewage-sludge ti-eatment of the soils probably resulted in increased biological
activities that led to aggregate formation in the surface horizons of the sludge-treated soils.
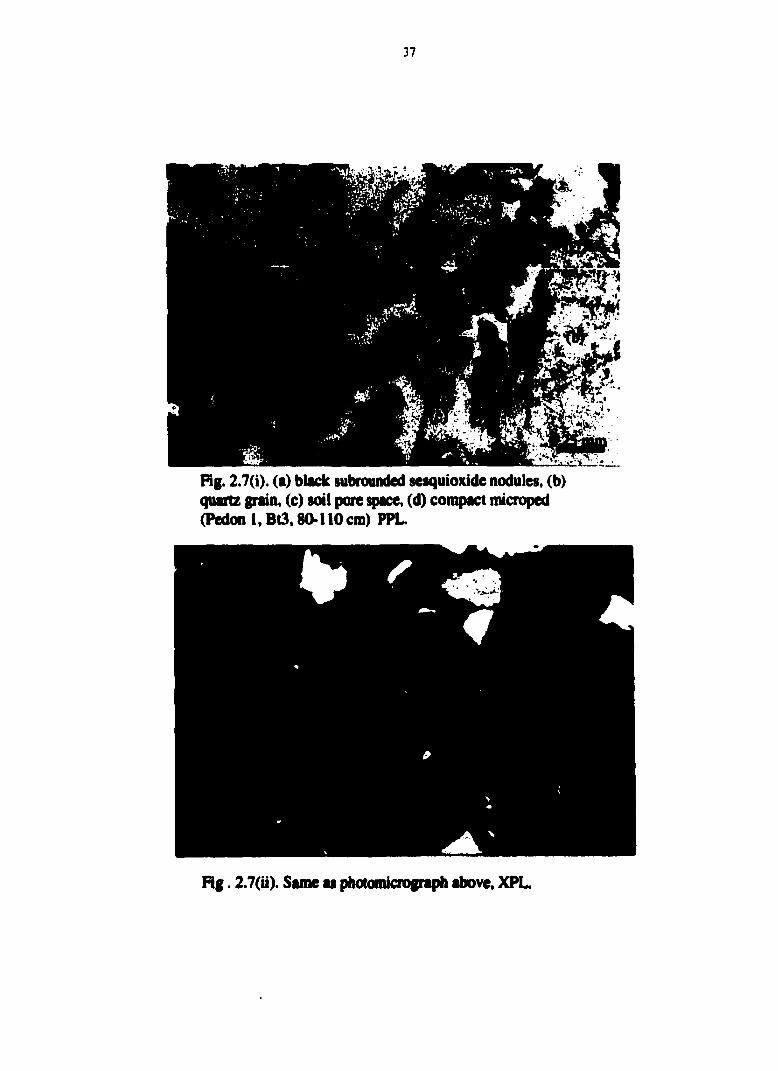
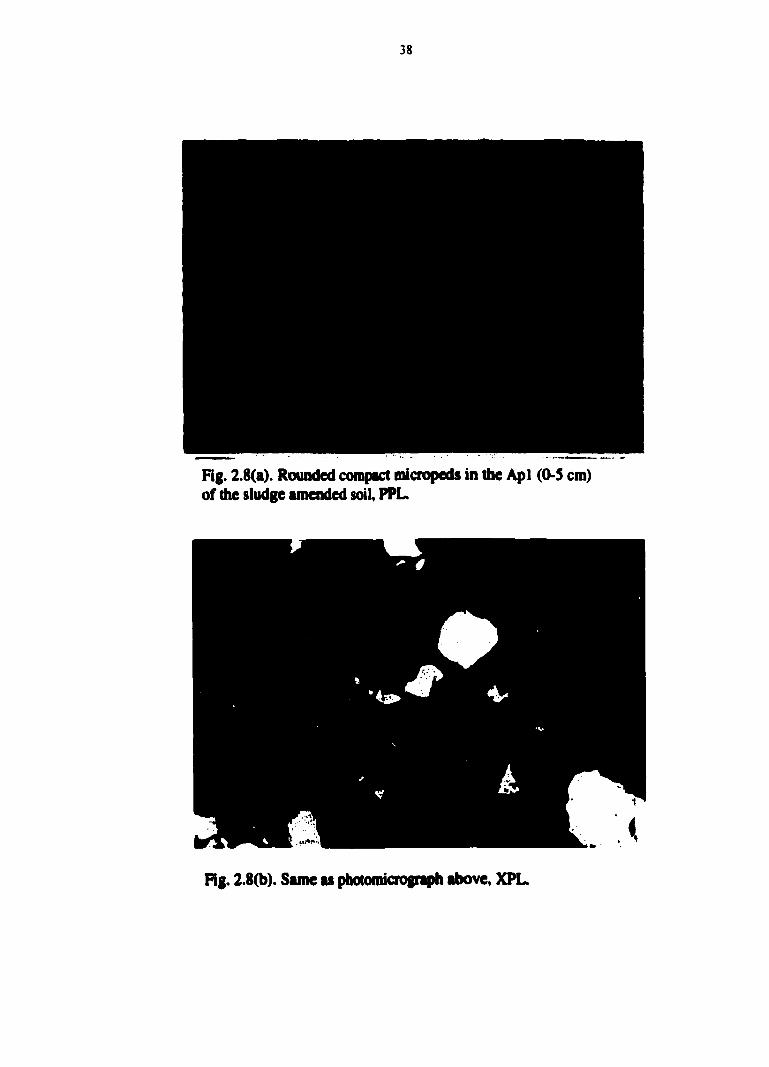
Abundance of micropeds of biological origin in the Ap horizonof the sludge-amended soils is
evidence of increased biological activities (Fig. 2.8). Many studies have indicated that
microbially synthesized carbohydrates have an important role in stabilizing soil aggregates
(e.g., Martin, 1971; Cheshire et al., 1984). Tisdall and Oades (1982) have suggested that

36
polysaccharides are effective in stabilizing the macroaggregates (>2S0 ^m) of soils with low
organic carbon content.
Because porosity of both the surface and subsurface horizons were mainly packing
voids, pore size distribution (micro and macropores) rather than pore type distribution was
considered more useful for comparing porosity of the control and the sludge-amended soils.
Pores were classified as micropores (<50 ^m diameter) and macropores (>50 ^m diameter).
Total porosity of the Ap horizons ranged from 30-40% for all the soils (Table 2.4).
Micropores were more abundant in the sludge-amended soils (3-4%) than in the control soil
(1%). The increase in micropores in the sludge-amended soils correlates with the fmding that
sewage sludge improved aggregate formation in the amended soils. Increase in micro|X)res
due to improved soil aggregation could result in reduced macroporosity. Increase in
micropores in the sludge-amended soils suggests an increased water-retention capacity of the
soils.
Assessing the EfTects of Sludge Amendment on Mineral Weathering Processes
The high ratio of precipitation to evaporation in the research area permits drainage
and transport of solutes in the soils. Among the major elements. Si may be partially or totally
leached while Fe and A1 residually concentrates within the profile as oxides and hydroxides
(Table 2.6). This is the process of ferralitization. High concentrations of Fe and A1 and the
low pH of the soils permit Fe and A1 ions and precipitated oxyhydroxides to block
complexation and cation exchange sites on organic matter and clay, thereby accelerating the
leaching of cations. This complicates the assessment of the impacts of sewage sludge
amendment on the chemistry of the soils.
37
i'XiKtCiii'\ .
ia-iOkl.
Hg. 2.7(i). (a) black subrounded sesquioxide nodules, (b) quartz grain, (c) soil pore space, (d) compact microped (Pedon 1, Bt3,80-110 cm) PPL
%• E Fig. 2.7(ii). Same as photomicrograph above, XPL
38
Fig. 2.8(a). Rounded compact micropeds in the Apl (0-S cm) of the sludge amended soil, PPL
Fig. 2.8(b). Same as photomicrograph above, XPL
39
The lower amounts of total Fe (19-31 g Fe kg"' soil) and free Fe oxides in the sludge-
amended soils compared to the control soil (28-42 g Fe kg'* soil) suggest the occurrence of
lower redox conditions in the sludge-amended soils (Table 2.6). This is corroborated by the
presence of redoximorphic features in all subsurface horizons of the sludge-amended soils
(Table 2.5). The ratio of free Fe oxides to total Fe (Feo/Fer) within the soil profile indicates
the distribution of free Fe oxides in relation to the total Fe in the soil. The Feo/Fer
distribution ratio was not uniform with soil depth in all the soils. In pedon 1, the maximum
Feo/Fer occurred deep within the Bt horizon. But in the sludge-amended soils, this value was
greatest at the top of the Bt horizon. If all other factors were constant, the difference suggests
that there has been some mobilization of Fe in the upper horizons of the sludge-amended
soils and redeposition in deeper horizons.
The trend of pH and exchangeable acidity in the sludge-amended soils also suggest
the presence of a perched water table during some periods of the year (Table 2.2). The pH
values of the control soil (4.6-4.9) were higher than those of the sludge-amended soils (3.7-
4.8), except in the lower Bt horizons of pedon 3, where higher pHs occurred (5.0-5.2).
Exchangeable acidity values of the control soil (1.11-2.10 cmol(+) kg'') were higher than
those of pedon 2 (0.34-1.26 cmol(+) kg"') and the lower part of pedon 3 (0.25-1.37 cmol(+)
kg'' soil). We hypothesize that during periods of temporary saturation, reducing conditions
led to the production of soluble Fe^", which displaced exchangeable cations (Ca, Mg, K and
Na) from the exchange sites of organic matter and clay minerals.
[OM-i-clay]Ca'* + FeiOH)^ + e" [OM+clay]Fe'* + CaiOH\ + OH'

40
Table 2.6. Fe and Al content of the soils .
Horizon Depth AIT FCT FCD Fep/clay FCD/Fct
ctn g k g '
Pedon 1
Apl 0-5 28 28 19 0.12 0.68 Ap2 5-40 31 30 22 0.12 0.73 Btl 40-55 41 36 26 0.12 0.73 Bt2 55-80 44 40 29 0.12 0.74 Bt3 80-110 48 42 34 0.13 0.83 Bt4 110-180 46 40 31 0.12 0.77
Pedon 2
Ap 0-25 26 21 15 0.11 0.72 Btl 25-60 36 27 21 0.11 0.77 Bt2 60-120 34 29 25 0.12 0.85 Bt3 120-180 35 31 24 0.12 0.78
Pedon 3
Ap 0-15 22 19 13 0.09 0.70 Bw 15-30 29 22 16 0.11 0.73 Btl 30-70 32 25 20 0.11 0.82 Bt2 70-120 30 26 20 0.11 0.77 Bt3 120-190 31 26 21 0.12 0.78
FCT - Toul Fe (extracted with HNO))I Feo " Fe extracted with CBD; AIT • Total Al (extrcted with HNO])

41
Ultimately, the exchangeable cations were leached out of the temporarily saturated
horizons and deposited in deeper horizons. When the near-surface horizons drained,
oxidizing conditions led to the production of FT (via the oxidation of Fe^"^ to Fe^") decreasing
the pH as follows:
Fe^" + 3H2O < > Fe(OH)3 + 3tr + e
The tT replaced Fe^"^ on the exchange sites as follows:
[OM^clay]Fe^* + 3//jO [OM +c/qv]3//* + Fe(OH), + e"
producing H-saturated clay that eventually corroded kaolinite and feldspars and released
more Al^^. These processes are similar to the process of ferrolysis described by Brinkmann
(1979) and tend to complicate assessment of the effects of sludge-amendment on both the
morphological and chemical properties of the soils. In particular, this could potentially have
significant effects on the distribution of both native and trace metals in the sludge-amended
soils.
CONCLUSIONS
A typical pedon of the study site had a thin, sandy loam surface horizon and a dark
reddish brown, sandy clay loam argillic horizon. It was classified as a fme-loamy, kaolinitic,
isohyperthermic Rhodic Kandiustult. The soils are highly weathered and contain high
amounts of Fe and A1 but low exchangeable bases, low pH and low CEC. Due to the low

42
fertility status of the soils, domestic sewage sludge was regularly applied to the soils.
Sewage-sludge amendment increased the exchangeable bases, total soil C and N, and the
cation exchange capacity of the amended soils compared to the control soil in spite of
minimal return of residues to the sewage-sludge-amended soils. The biological activities
resulted in better aggregate formation in the treated soils, which, together with the
aggregation effects of Fe oxide in the Bt horizons, restricted water movement that led to
ferrolytic weathering. The high Fe and A1 contents of the soils seem to influence the impact
of sewage-sludge-amendment on the soils, perhaps by blociung cation complexation sites of
organic matter or cation exchange sites of clay minerals, thereby promoting the leaching of
cations in the soil profile. After more than 37 years of sewage sludge amendment, the
chemistry of the subsurface horizons has changed enough to warrant a reclassification in Soil
Taxonomy at the soil order level.
ACKNOWLEDGEMENTS
The authors thank the Rockefeller Foundation for their financial support to carry out
this research under the African Dissertation Program.
REFERENCES
Abgoola, S.A. 1979. An agricultural atlas of Nigeria. Oxford University Press. New York.
Baxter, J.C., M. Agtiilar, and K. Brown. 1983. Heavy metals and persistent organics at a
sewage sludge disposal site. J. Environ. Qual. 12:311-316.
Brady, N. 1974. The nature and properties of soils. MacMillan Publishing Co. Inc. NY.
Brinkmann, R. 1979. Ferrolysis, a soil-fonning process in hydromorphic conditions. Agric.
Res. Rep. 887. Pudoc, Wageningen.
Bullock, P., N. Fedoroff, A. Jongerius, G. Stoops and T. Tursina. 1985. Handbook for soil
thin section description. Waine Research Publications, Wolverhampton, U.K.
Cabrera, C., E. Orthega, C. Gallego, M L. Lorenzo, C. Asensio, M.C. Lopez. 1994. Lead
concentration in farmlands in southern Spain: Influence of the use of sewage sludge
as fertilizer. Bull. Environ. Contam. Toxicology 53:32-38.
Cheshire, M.V., C.P. Sparling, and C.M Mundie. 1984. Influence of soil type, crop and air
drying on residual carbohydrate content and aggregate stability after treatment with
periodate and tetraborate. Plant Soil 76:339-347.
Darmody, R.G., J.E. Foss, M. Mcintosh, and D.C. Wolf. 1983. Municipal sewage sludge
compost-amended soils: Some spatiotemporal treatment effects. J. Environ. Qual.
12:231-236.
Dowdy, R.H., J.J. Latterell, T.D. Hinsely, R.B. Grossman and D.L. Sullivan. 1984. Trace
metal movement in a silt loam soil following 14 years of aimual sewage sludge
applications. Agron. Abst. p.26.
Embrechts, J., and G. Stoops. 1987. Microscopic identification and quantitative
determination of microstructure and potentially mobile clay in a humid tropical
environment, p. 157-164. In FedorofT, N., L.M. Bresson, and M. A. Courty (ed.) Soil
Micromorphology. Proc. 7'*' Int. Work. Meet. Soil Micromorph. AFES. Paris.
Emmerich, W.E., L.J. Lund, A.L. Page, and A.C. Chang. 1982. Movement of heavy metals in
sewage sludge-treated soils. J. Environ. Qual. 11:174-178.

44
Eswaran, H. 1968. Point-count analysis as applied to soil micromoiphology. Pedologie
18:238-252.
Gee, G.W., and J.W. Bauder. 1986. Particle size analysis, p. 383-412. In Klute, A. (ed.)
Methods of soil analysis. Part 1. 2nd ed. Book Series No 5. ASA and SSSA, Madison,
Wisconsin.
Guedez, E., and R. Langhor. 1978. Some characteristics of pseudosilt in a soil toposequence
of the Llanos orientales (Venezuela). Pedologie 28:118-131.
Hill, I.D. 1970. Quantitative micromorphological evidence of clay movement, p. 33-42. In
Micromorphological techniques and applications. Soil Survey Techn. Monograph no.
2. Wageninigen, Netherlands.
Jackson, M.L., C.H. Lim, and L.W. Zelany. 1994. Oxides, hydroxides, and aluminosilicates.
p. 101-150. In Klute, A. (ed.) Methods of soil analysis. Part 1. 2nd ed. Book Series
No. 5. ASA and SSSA, Madison, Wisconsin.
Lekwa, G., and E.P. Whiteside. 1986. Coastal plain soils of southeastem Nigeria. I.
Morphology, classification, and genetic relationships. Soil Sci. Soc. Am. J. 50:154-
160.
Lerch, R.N., K.A. Barbahck, D.G. Westfall, R.H. Follett, T.M. McBride, W.F. Owen. 1990.
Sustainable rates of sewage sludge for dryland winter wheat production. I. Soil
nitrogen and heavy metals. J. Prod. Agric. 3:60-65.
Martin, J.P. 1971. Decomposition and binding action of polysaccharides in soil. Soil Biol.
Biochem. 3: 33-41.
45
Mbagwu, J.S.C. and Piccolo. 1990. Carbon, nitrogen and phosphorus concentrations in
aggregates of organic waste amended soils. Biological Wastes 31:97-l 11.
Murphy, C.F., and C.F. Banfield. 1978. Pore space variability in a sub-surface horizon of two
soils. J. Soil Sci. 29:158-166.
Murphy, C.P. 1986. Thin section preparation of soils and sediments. AB Academic
Publishers, Britain.
Nelson, D.W., and L.E. Sonuners, 1982. Total carbon, organic carbon and organic matter, p.
539-577. In Page, A.L., R.H. Miller, D.R. Keeney. (ed.) Methods of soil analysis. Part
2.2nd ed. Agron. Monogr. 9. ASA and SSSA. Madison, Wisconsin.
Ola, S.A. 1983. Tropical soils of Nigeria in engineering practice. A. A. Balkema, Rotterdam.
Pagliai, M., G. Guide, M. La Marca, M. Giachetti, and G. Lucamante. 1981. Effects of
sewage sludge and composts on soil porosity and aggregation. J. Environ. Qual. 10:
556-61.
Pagliai, M., E.B.A. Bisdom, and S. Ledin. 1983. Changes in surface structure (crusting) af^er
application of sewage sludge and pig slurry to cultivated agricultural soils in northem
Italy. Geoderma 30:35-53.
Singh, L., and V. Balasubramanian. 1982. Effect of continuous use of fertilizers, lime and
micronutrients on soil properties at Mokwa, Nigeria. J. Indian Soc. Soil Sci. 30:306-
311.
Soil Survey Staff. 1998. Keys to Soil Taxonomy. 8"* edition. SMSS Technical Monograph
Pocahontas Press Inc., Blacksburg, Virginia.
46
Soil Survey Staff. 1993. Soil survey manual. 2"'' ed. USDA-SCS Agric Handb. 18. U.S. Gov.
Printing Office, Washington, DC.
Sridhar, M.K.C. and A.O. Bammeke. 1986. Heavy metal contents of some solid wastes in
Ibadan, Nigeria. Water, Air, Soil Pollution 29:51-56.
Srikanth, R. and S.R.P Reddy. 1991. Lead, cadmium and chromium levels in vegetables
grown in urban sewage sludge in India. Food Chemistry 40:229-234.
Swaine, D.J. and R.L.Mitchell. 1960. Trace element distribution in soil profiles. J. Soil Sci.
11:347-368.
Sys, C. 1978. Influence of ecological conditions on the nutrition status of tropical soils.
Pedologie 26:179-190.
Thomas, W.G. 1982. Exchangeable cations, p. 159-166. In Page, A.L., R.H. Miller, D.R.
Keeney. (ed.) Methods of soil analysis. Part 2. 2nd ed. Agron. Monogr. 9. ASA and
SSSA, Madison, Wisconsin.
Tisdall, J.M., and J.M. Oades. 1982. Organic matter and water stable aggregates in soils. J.
Soil Sci. 33:141-163.
Unamba-Oparah, 1.1982. Comparison of the C and N contents and their relationships to
other soil properties in some important soils of southeastern Nigeria. Beitrage zur
Tropischen Landwirtscaft und verterinarmedizin 20:167-176.
Willams, D.E., J. Vlams, A.H. Pukite, and J.E. Corey. 1984. Metal movement in sludge
treated soils after six years of sludge addition: 1. Cd, Cu, Pb, and Zn. Soil Sci.
137:351-359.
47
CHAPTER 3. LONG TERM EFFECTS OF SEWAGE SLUDGE USE ON HUMID TROPICAL NIGERIAN ULTISOLS: II. THE DISTRIBUTION AND MOVEMENT
OF HEAVY METALS IN SOILS
A paper to be submitted to Soil Science Society of America Journal
M. 0. Mbila, M.L. Thompson* J.S.C. Mbagwu and D.A. Laird
ABSTRACT
Use of metal-enriched sewage sludge as soil fertilizer may result in trace metal
contamination of soils. This study was conducted to evaluate the effects of long-term sewage
sludge application on trace metal (Zn, Cu, Pb, and Ni) distribution and bioavailability in
Nigerian soils. Total metal analyses, sequential chemical fractionation and DTPA extractions
were carried out on samples of control and sludge-amended soils (a Rhodic Kandiustult and
two Rhodic Kandiustalfs from Nigeria). Soil enrichment factors (EF) were calculated for
each metal. The sewage sludge contained high levels of Zn and Cu but low levels of Pb and
Ni. The control soil contained low levels of all metals. Compared with the control soil, the
sewage sludge-amended soils showed elevated levels of Zn and Cu, reflecting the trace metal
composition of the sewage sludge. Zinc and Cu in the sewage sludge-amended soils were
strongly enriched in both the topsoil and at all depths in the profile, indicating that they had
moved from the zone of sewage-sludge application. Both sequential extraction and DTPA
analyses indicated that the sludge-amended soils contained more readily extractable metal
ions than the unamended soil.

48
INTRODUCTION
Trace metal pollution due to sewage sludge application on agricultural lands is a
global problem (Juste and Mench, 1992; Page 1974). It has generated enormous interest in
the chemistry of trace metals in soils (Kabata-Pendias and Pendias, 1984; Alloway, 1990).
Sewage sludge often contains trace metals, and when it is used as soil fertilizer without
regulation, the practice may result in trace metal contamination of soils. Metal contamination
of soil may increase the concentration of metals in the plants grown on the soil and could
affect the growth of plants or the health of animals using them as food.
The accumulation and potential for movement of trace metals in soils treated with
sewage sludge have been well investigated, especially for temperate soils (Emmerich et al.,
1982a; Baxter et al., 1983; Lerch et al., 1990). Trace metal content of sludges and the forms
of metal present in them have also been well reported by several authors who found large
variations among sludges (Stover et al., 1976; Sommers, 1977; Berrow and Webber, 1972;
Page, 1974). Most authors have reported that sewage sludge application to soils increased
their heavy metal content and that the rate of metal increase was consistent with sewage
sludge rate. However, majority of the studies (e.g., Williams et al., 1980; Willams et al.,
1984; Baxter et al., 1983, have concluded that most metal movement within the soil profile
were only within a few centimeters below the zone of sewage sludge incorporation. While
this conclusion might be true for temperate-region soils, many factors make it questionable
for soils in humid, tropical conditions.
49
Literature Review
Very limited information exists that specifically addresses the fate of trace metals
under truly humid tropical settings, their accumulation in the soil due to sewage sludge
application, and the methodology of investigating such concerns. Application of wastes to
soils is a very common practice in Nigeria and has raised some general concerns regarding
the increasing concentrations of heavy metals in soils. For instance, Sridhar and Bammeke
(1986) acknowledged the increasing deterioration of natural waters, soils, and air by solid
waste dumping. Ntekim et al. (1993) also reported increased concentration of heavy metals in
the sediments of the Southeastern Calabar River due to direct discharge of industrial and
urban wastes into the river. Other than these general concerns of trace metals in Nigerian
soils, no detailed study has been conducted to understand the fate of these metals when
incorporated with sewage sludge in Nigeria's highly weathered tropical soils.
Many trace metal studies on temperate soils have concluded that sludge-borne metals
remained in the zone of sewage sludge incorporation (Emmerich et al., 1982a; Enunerich et
al., 1982b) or moved only a few centimeters from the zone of incorporation (Williams et al.,
1980; Lucia et al., 1982; Willams et al., 1984; Juste and Mench, 1992). The very high
rainfall, low cation exchange capacity, and commonly low pH of the soils of humid tropical
ecosystems provide optimum conditions for metal transport. On the other hand, intense
weathering and leaching of the parent materials of such soils result in residual accumulation
of oxides and hydroxides of Fe and Al in the soil, which have been shown to specifically
adsorb some trace metals (Kalbasi et al., 1978). Therefore, conclusions about trace metal
studies of temperate soils may not be broadly applicable to humid tropical soils.

50
In addition to concerns about metal mobility, little is known about the bioavailabilty
of metals in waste-amended, tropical soils. It is the bioavailability, not the absolute
concentration, of heavy metals in soil that influences their concentration in plants (Srikanth
and Reddy, 1991). For instance, Chukuma (1993) used a plant-to-soil (P/S) ratio as an index
of bioaccumulation of metals (zinc, lead and cadmiimi) in a Nigerian soil. He observed that
the total metal concentrations in the leaves of Nauclea popeeguinei and Imperata cylinderica
did not reflect concentrations of the elements in the soil, suggesting a gap between
bioavailable forms and total soil concentrations of the elements. Similar observations have
been made by other researchers (Mathews, 1984). Therefore plant availability of metals is
dependent more on the physico-chemical forms in the soil than on the total soil
concentrations of the elements. Identif>'ing the chemical forms in which the metals are
retained in the soil then becomes essential for predicting their potential mobility to water
sources and the food chain.
Heavy metals in soils occur in a variety of physico-chemical forms. These forms are
(i) free or complexed ions in soil solution; (ii) adsorbed at the surfaces of clays, Fe and Mn
oxyhydroxides or organic matter that are easily exchangeable; (iii) present in the structure of
secondary minerals such as phosphates, sulfides or carbonates that are specifically adsorbed;
(iv) those occluded in soil oxide material; and (v) those present in the crystal structures of
primary minerals. Sequential extraction techniques have been commonly used to extract the
different forms of the metals in soils in general (Shuman, 1985; Shuman, 1991), and sewage-
sludge amended soils in particular (Lake et al., 1984; and van Valin and Morse, 1982; Berti
and Jacobs, 1996). Tessier et al. (1979), Stover et al. (1976), Sposito et al. (1982) and
Shuman (1985) have described the use and development of this technique. A typical
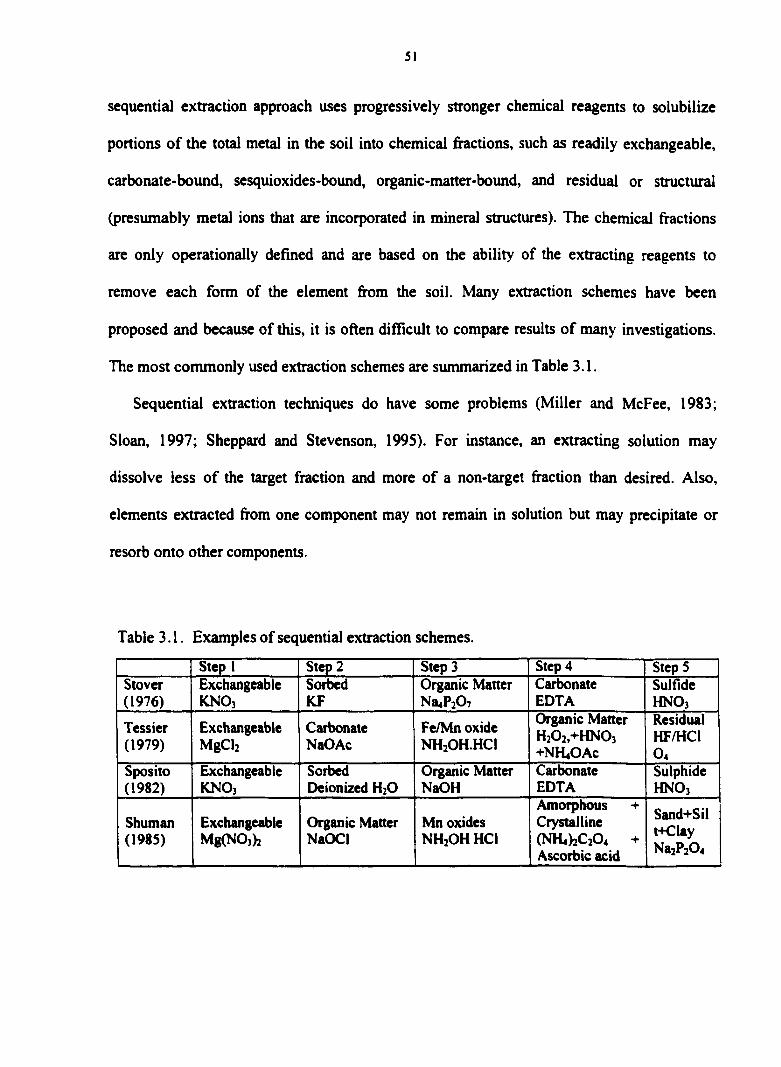
51
sequential extraction approach uses progressively stronger chemical reagents to solubilize
portions of the total metal in the soil into chemical fractions, such as readily exchangeable,
carbonate-bound, sesquioxides-bound, organic-matter-bound, and residual or structural
(presumably metal ions that are incorporated in mineral structures). The chemical fractions
are only operationally defmed and are based on the ability of the extracting reagents to
remove each form of the element from the soil. Many extraction schemes have been
proposed and because of this, it is often difficult to compare results of many investigations.
The most commonly used extraction schemes are summarized in Table 3.1.
Sequential extraction techniques do have some problems (Miller and McFee, 1983;
Sloan, 1997; Sheppard and Stevenson, 199S). For instance, an extracting solution may
dissolve less of the target fraction and more of a non-target fraction than desired. Also,
elements extracted from one component may not remain in solution but may precipitate or
resorb onto other components.
Table 3.1. Examples of sequential extraction schemes.
Step I Step 2 Step 3 Step 4 Step S Stover (1976)
Exchangeable KNO3
Sorbed KF
Organic Matter Na4P207
Carbonate EDTA
Sulfide HNO3
Tessier (1979)
Exchangeable MgCI:
Carbonate NaOAc
Fe/Mn oxide NH2OH.HCI
Organic Maner H202,+HN03 +NH4OAC
Residual HF/HCI O4
Sposito (1982)
Exchangeable KNO3
Sorbed Deionized H20
Organic Matter NaOH
Carbonate EDTA
Sulphide HNO3
Shuman (1985)
Exchangeable Mg(N0j)2
Organic Matter NaOCI
Mn oxides NH2OH HCI
Amorphous + Crystalline (NH4)2C204 + Ascorbic acid
Sand+Sil t+Clay Na2P204
52
An extraction procedure itself may cause a shif^ in elemental distribution so that the solids
remaining after the extraction, rather than the reagent used, determine the element
concentrations in the extracting solution. These problems suggest that interpretations of
sequential extraction data must be done cautiously. However, in spite of the problems, each
step of a well-thought-out sequential extraction scheme will remove a different soil fraction
from either the step before or after it. Also, refinements in the selection and sequence of
extractants (Miller et al., 1986; Shuman, 1985) have been ways to address the problems.
In addition to sequential extraction of metals, the DTPA extraction has been used in
bioavailability studies. The DTPA extraction was originally used as a soil test for Zn, Cu, Fe
and Mn and to identify soils requiring fertilizer supplementation (Lindsay and Norvell,
1978). Some studies have strongly correlated DTPA-extractable metals to plant-available
metals, and thus, predicted metal uptake by plants (Lindsay and Cox, 198S; Kelling et al.,
1977). Lindsay and Norvell (1978) reported that 8% of 445 soils from Colorado and Florida
had <0.2 mg DTPA-extractable Cu kg'' soil and that these soils produced crops with very
low Cu. Based on this observation, they proposed a critical level of approximately 0.2 mg Cu
kg ' soil. This critical level suggests that Cu concentrations below this level may result in Cu
deficiency. For Zn, a critical value of 0.6-0.8 mg kg'' was proposed. Lindsay and Cox (1985)
showed a positive correlation between the Zn and Cu concentrations of maize, original
wheat, and pot grown wheat (from tropical regions). The DTPA-extractable metals were
between r = 0.38 and r = 0.73 (n = 1966 to 3538) for Zn, and r = 0.11 and r = 0.52 for Cu in
the same soil samples. In the United States, Kelling et al. (1977) reported r-values of 0.18 to
0.64 for Zn in rye, sorghum-sudan, and com stover, and r = 0.20 to 0.59 for Cu in the same

53
plants. Therefore the DTPA-extractable metals can be useful as a predictor of metal
concentrations in plants.
This study was initiated to evaluate the effects of long-term sewage-sludge
application on trace metal distribution and movement in soils amended with sewage sludge.
A quantitative measure of heavy metal pollution was devised by using calculated enrichment
factors (Sinex and Helz, 1981; Rule, 1986), and sequential extraction was used to determine
the chemical forms of the metals in the soils. The objectives were: (i) to measure the
distribution of Pb, Zn, Cu, and Ni in sewage-sludge-amended soil; (ii) to determine whether
levels of trace metals in the sludge-amended soils exceeded natural levels, (iii) to determine
the relative bioavailability of the metals, (iv) to assess the degree to which applied metals
may have moved in the soil, and (v) to relate soil concentration of trace metals to soil
chemical and physical properties.
MATERIALS AND METHODS
Soik
This study was conducted with samples from the University of Nigeria (UNN)
sewage farms. The UNN sewage farms consist of small farms whose source of soil fertility is
sewage sludge. The morphology and some characteristics of the soils and their classifications
have been described in a companion paper (previous chapter in this thesis).
Two soil profiles representative of the sewage farms and one control soil profile
representative of an adjacent farm that does not use sewage sludge were studied. The site and
pedon descriptions of the three soils are presented in Appendix A2. Pedon 1 was the control
soil that had not been amended with sewage sludge. Pedons 2 and 3 were sewage-sludge-
54
amended soils, and they had received an estimated 45 t/ha/year of sewage sludge for about 37
years. The three pedon sites were adjacent to one another and had the same history. The
control soil profile was used in the study as a means to establish the geochemical behavior of
Zn, Pb, Cu, and Ni in uncontaminated soils in the area. Therefore, the total content and
distribution of metals in the control soil profile were assumed to be the initial content and
distribution of metals in the soils of the site before sewage sludge amendment. The pH,
organic C content, particle size distribution, and total native metals of the soils are reported
in the previous chapter. The range of properties of the soils is reflected in the classification of
the soils: Pedon 1 (fine-loamy, kaolinitic, isohyperthermic Rhodic Kandiustult); Pedon 2
(fme-loamy, kaolinitic, isohyperthermic Rhodic Kandiustalfs); Pedon 3 (fme-loamy,
kaolinitic, isohyperthermic Rhodic Kandiustalfs).
The UNN Sewage Sludge
The applied sludge is of domestic origin, collected from the residential and
administrative areas of the University of Nigeria, Nsukka, and processed by the university
sewage treatment plant. The processing of the sewage sludge and some of the characteristics
of the sludge have been reported in chapter 1. No records were available on the frequency or
rate of sewage sludge application. We estimated the application rate in 1997 by mapping 1
m^ on the ground and collecting all the dry sewage sludge that had been recently applied
within the marked area, weighing it to calculate the rate per ha. The sludge application rate
was estimated to be IS dry tons/ha during each plant-growing season. If it is assumed that
sewage sludge was applied at that rate, three times per year for thirty-seven years, the total
sludge application would have been 166S tons. The concentrations of Zn, Cu, Pb, and Ni in
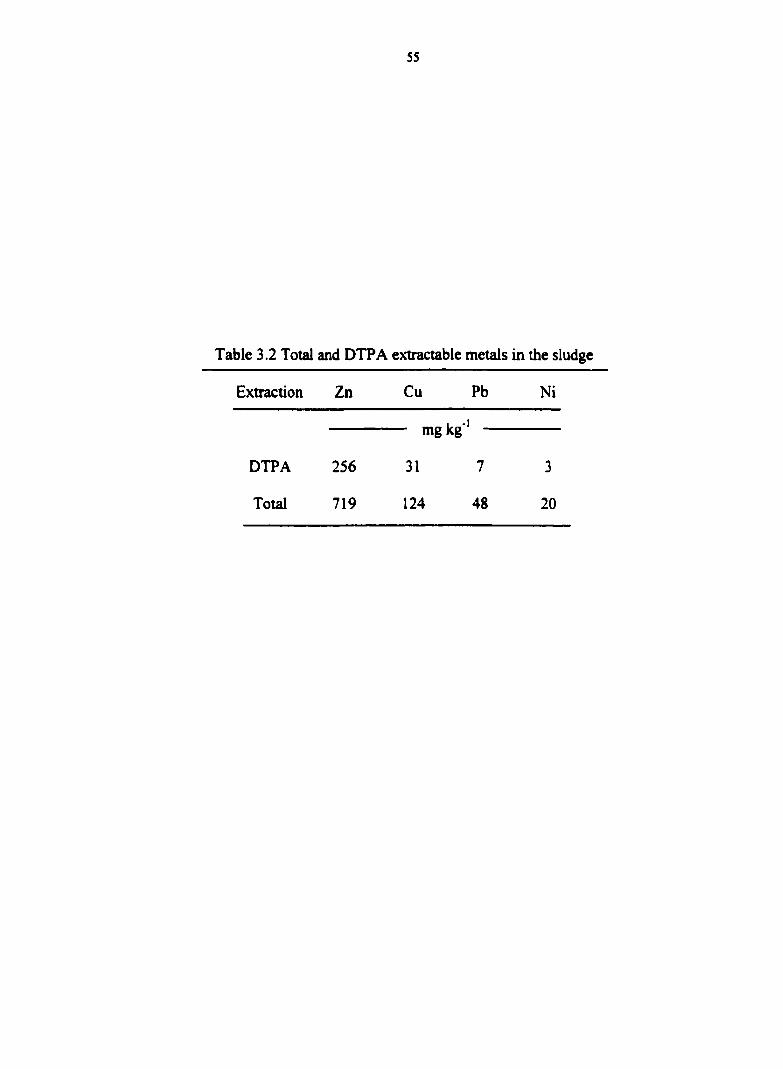
55
Table 3.2 Total and DTPA extractable metals in the sludge
Extraction Zn Cu Pb Ni
mgkg '
DTPA 256 31 7 3
Total 719 124 48 20

56
the UNN sewage sludge in 1997 are presented in Table 3.2. If the metal concentrations are
assumed to have been constatnt over 37 years, the cumulative inputs of Zn and Cu were 1310
kg ha'' and 210 kg*' respectively. A rough trace-metal mass balance calculation showing
recoveries of Zn and Cu at all depths in the sewage-sludge-amended soils, is shown in
Appendix B3.
Total Metals and Routine Soil Analyses
The sewage sludge and soil samples were air-dried at room temperature for about a
week and ground to pass a 10-mesh sieve. Moisture content was determined by drying
subsamples at 10S°C until constant weight. Total Zn, Pb. Cu and Ni were solubilized
according to the method of Miller and McFee (1983) by digesting 4 g of soil with 20 ml of
concentrated U^ce-metal-grade HNO3 at 100®C for 16 hours using an A1 digesting block with
reflux cover. After the digestion, 5 ml of 30% H2O2 were added to oxidize resistant organic
matter, and the solution was allowed to cool. After cooling, the solution was filtered through
Whatman #42 filter paper into a 50-ml volumetric flask. The volumetric flasks were then
diluted to volume with distilled water. Metals were determined by inductively coupled Ar
plasma atomic emission spectroscopy (ICAP-AES). All samples were run in triplicate to
monitor the precision of our determinations, and coefficients of variation for the metals were
7-22% Pb, 5-9% Zn, 3-4% Cu, 3-4% Ni. In addition, a laboratory soil reference material
(OSS) was included in each run as a quality-control standard. The ICAP-AES was chosen
over the atomic absorption spectrometry (AAS) for determining the trace metals because of
better detection limits and the advantage of determining all the metals in one single run. To
correct for spectral interferences in the samples (due to their high content of Fe, A1 and P),

57
we quantified the total Fe, Al, and P content of the samples and calculated a correction factor
according to the manufacttirer's guidelines to adjust the values of the contents of the metals.
An example of the spectral interference correction is shown in Appendix B6.
Free Fe and Mn oxide contents of the samples were extracted by the citrate-
bicarbonate-dithionite (CBD) extraction of Jackson et al. (1994) and determined by atomic
absorption spectroscopy.
Sequential Fractionation of Trace Metals in Soils
Sequential extraction was used to fractionate heavy metals in the soil samples. The
fractions, essentially those defined by Tessier et al. (1979), are as follows: exchangeable,
weakly-bound, sesquioxide-bound, organic matter-bound, and residual. We modified the
method of Tessier et al. (1979) by using Mg(N03)2 to extract exchangeable metals (Shuman,
1985) and by using the citrate-bicarbonate-dithionite extraction method (Jackson et al., 1986)
to extract sesquioxide-bound metals. The solutions and conditions used for the extractions
are shown in Table 3.3.
Magnesium nitrate was intended to remove exchangeable metal cations by flooding
the soil with Mg^* We used MgCNOs): instead of MgCb because of concerns that the
chloride ion can complex metals (Doner, 1978). Sodium acetate (NaOAc) (1 M at pH S) was
used to extract weakly bound metals. The combined action of Na-citrate, Na-bicarbonate, and
Na-dithionite (CBD) was used for extracting metals bound to sesquioxides. Sodium
dithionite reduces Fe and Mn to their ferrous and manganous forms, respectively, dissolving
the solid phase oxides. Sodium citrate complexes the soluble metals and prevents
precipitation of FeS, while Na-bicarbonate buffers the pH of the system. The concern of
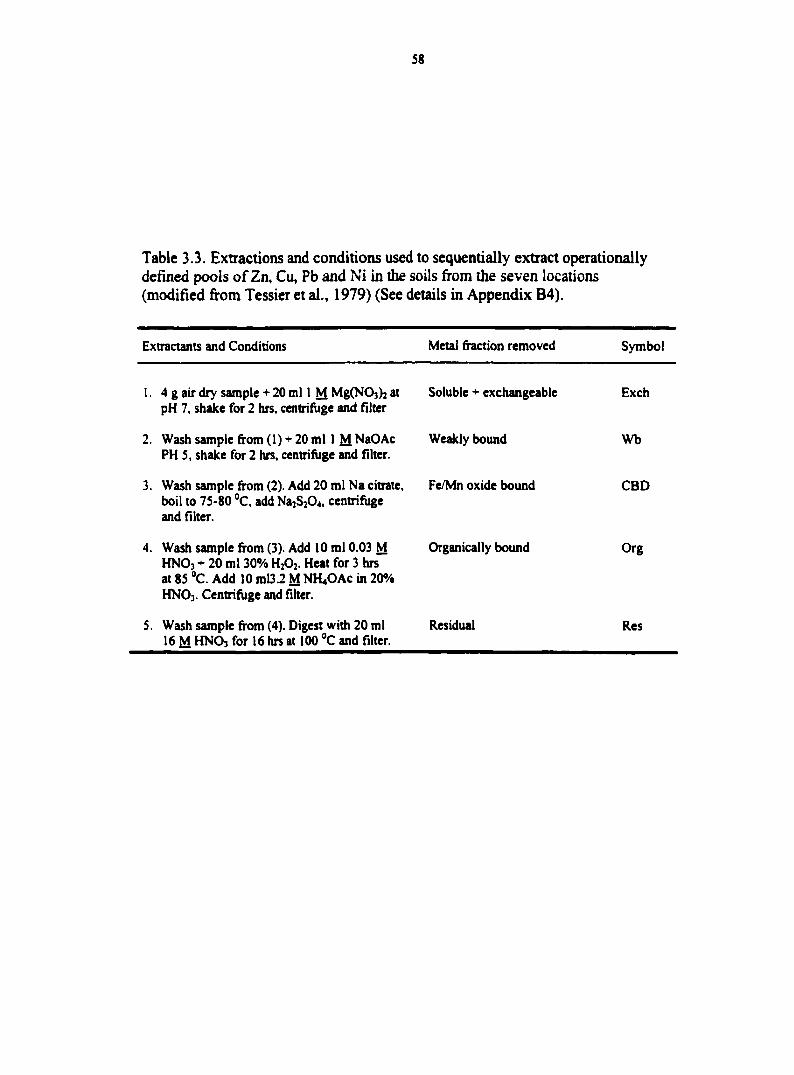
S8
Table 3.3. Extractions and conditions used to sequentially extract operationally defined pools of Zn, Cu, Pb and Ni in the soils from the seven locations (modified from Tessier et al., 1979) (See details in Appendix B4).
Extractants and Conditions
1. 4 g air dry sample + 20 ml 1 M MgCNOs): at pH 7, sh^e for 2 hrs, centrifuge and fliter
2. Wash sample from (1) + 20 ml I M NaOAc PH 5, shake for 2 hrs, centrifuge and filter.
3. Wash sample from (2). Add 20 ml Na citrate, boil to 75-80 "C, add NaiS304, centrifuge and filter.
4. Wash sample from (3). Add 10 ml 0.03 M HNOj + 20 ml 30% HjOj. Heat for 3 hrs at 85 °C. Add 10 ml3.2 M NH4OAC in 20% HNOj. Centrifuge and filter.
5. Wash sample from (4). Digest with 20 ml 16 M HNO] for 16 hrs at 100 "C and filter.
Metal fraction removed Symbol
Soluble exchangeable Exch
Weakly bound Wb
Fe/Mn oxide bound CBD
Organically bound Org
Residual Res

59
Shuman (1985) that Na dithionite is sometimes contaminated with Zn was addressed by
canying blanks that received exactly the same treatment as the soil samples. The blanks were
used to prepare standard solutions for ICP analyses. In that way, the effect of any Zn added
to the soil samples with the dithionite was cancelled by adding the same amount of Zn to the
standards. Hydrogen peroxide (H2O2) was used to oxidize organic matter, thereby liberating
metals that might be bound by the organic matter. Concentrated HNO3 was used to dissolve
the primary and secondary minerals in the soil, thereby liberating metals that may have been
held in mineral crystal structures. After each step of the extraction, the soil samples were
rinsed with distilled and deionized water, centrifuged, and the water discarded. Laboratory
protocols, such as replicating some samples and including a reference soil sample with each
set of analyses, were used to check the reliability of our method. The sums of the sequentially
solubilized metal fractions were correlated to the total metal released in the 16 M HNO3
digest. Nevertheless, the sum of the sequential fractions and HNO3 digest were not equal
probably due to metal losses resulting from washing the sample following each extraction,
and possible reprecipitation of dissolved minerals during the sequence of extractions. The
raw data for these extractions are shown in Appendix B4.
DTPA Extraction of Soib
DTPA-extractable metals were determined for the samples. The DTPA solution
comprises 0.005 M DTPA (diethylenetriamine pentacetic acid), 0.01 M TEA (triethanol
amine), and 0.01 M CaCh, adjusted to pH 7.3 (Lindsay and Norvell, 1969). An aliquot of 20
ml of the solution was added to 10 g of soil in 125-ml conical flasks and covered with a cap.
The mixture was shaken on a mechanical shaker for 2 hours and then filtered into a 25-ml
60
volumetric flask with Whatman #42 filter paper. The extractable metals were determined by
ICP-AES as described in the sequential extraction section.
RESULTS AND DISCUSSION
Extractability of Metals from Sewage Sludge
Levels of Zn and Cu in the UNN sewage sludge were relatively high compared to the
levels of Pb and Ni (Table 3.2). However, those concentrations were still very low with
respect to current United States Environmental Protection Agency (USEPA) regulations, and
the sludge would be considered suitable for land application. (USEPA, 1993). The low
concentrations of the metals, especially Pb and Ni in the sludge, were expected due to the
domestic origin of the sludge.
The DTPA extraction recovered between 32% and 25% of the total Zn and Cu
respectively in the sludge, while only 15% of total Pb and Ni were DTPA extractable (Table
3.2). Sequential chemical fractionation of the sludge showed that extractable Zn was equally
distributed among exchangeable, weakly bound, oxide, and organic fractions (Fig. 3.1).
About 80% of Cu was predominantly in the organic fraction. Lead was distributed mainly in
the organic fraction (about 40%) and in the oxide and residual fractions. Nickel was
primarily either in the oxide fraction or the residual fraction. Thus the distribution of the
metals in the sludge was different for each metal, and it is not clear to what extent their
occurence in the sludge could influence their behavior after incorporation in soils.
However, repeated sampling of this sludge has not been done in order to determine
any variations in the distribution of forms of the metals over time. Some reports (e.g., Sposito
et al. 1982; Berti and Jacobs, 1998) have shown wide variations in trace metal contents of

'a3pn|s aSeMSs MMH ui s|e)3Ui jo i(}i|iqe|3eJ)X3 '|'£ 'Sij
P!S3)|B
3JOO apixoH
qyvvD M3X3B
MaMiHiiiiiiiiiiiiiiiiiiiiiiiiiiiiiiiiiiiiiiiiiiiiiiiiiiiiiiiiiiiiiiiiiiiiiniw
iiiiiiiiiiiiiiiiiiiiiiiiiiiiiiiiiiiiimimmiiii
!N
"D
qd
"Z
%00l %08 %09 %0P %0Z %0
suoiiDCJj |e3!ui9q3

62
sludges when sampled at different seasons. Temporal differences may exist in the
composition of UNN sludge too, but to a lesser degree because of the domestic nature of the
sludge. However, this characterization is the first of its kind for the UNN sludge, and future
research is needed to periodically sample and characterize it in order to monitor variations in
trace metal behavior.
DistributioD of Trace Metals in the Control Soil Profile
Morphological, chemical, and mineralogical properties of these soils were discussed
in Chapter 1. Pedogenesis in these soils has led to the development of soil profiles having at
least three distinct soil horizons -a thin A horizon, an upper Bt and a lower Bt horizon with
various levels of Fe. The A horizon is usually a thin layer of sandy loam to loamy sand,
containing small to moderate amounts of organic matter at the top. The B horizons, which
may reach several meters in thickness, consist of an upper, less-ferruginous Bt-horizon, and a
lower, more-ferruginous Bt horizon.
Figure 3.2 shows the free Fe oxide distribution in the soils and indicates an increase
in free Fe oxide between the A horizon and the B horizons. Without exception, the highest
concentration of free Fe oxide was in the lower Bt horizons. As discussed in Chapter 1, there
is evidence that ferralitization and ferrolysis are major weathering processes in these soils,
but the extent to which these processes have influenced the distribution of trace metals from
sludge is not very clear. The basic soil characterization data presented in Chapter 1 (Table
2.2), show that the soils were strongly to very strongly acid (pH 3.9-5.3), contain low cation
exchange capacity (by summation) of 2.S9 cmol (+) kg'' or less, and base saturation of

63
% Fe203
30
60
90
120
150
, FYofile 1
.Profile 2
.Rofile3
180
Fig. 3.2. CBD extractable FeiOs
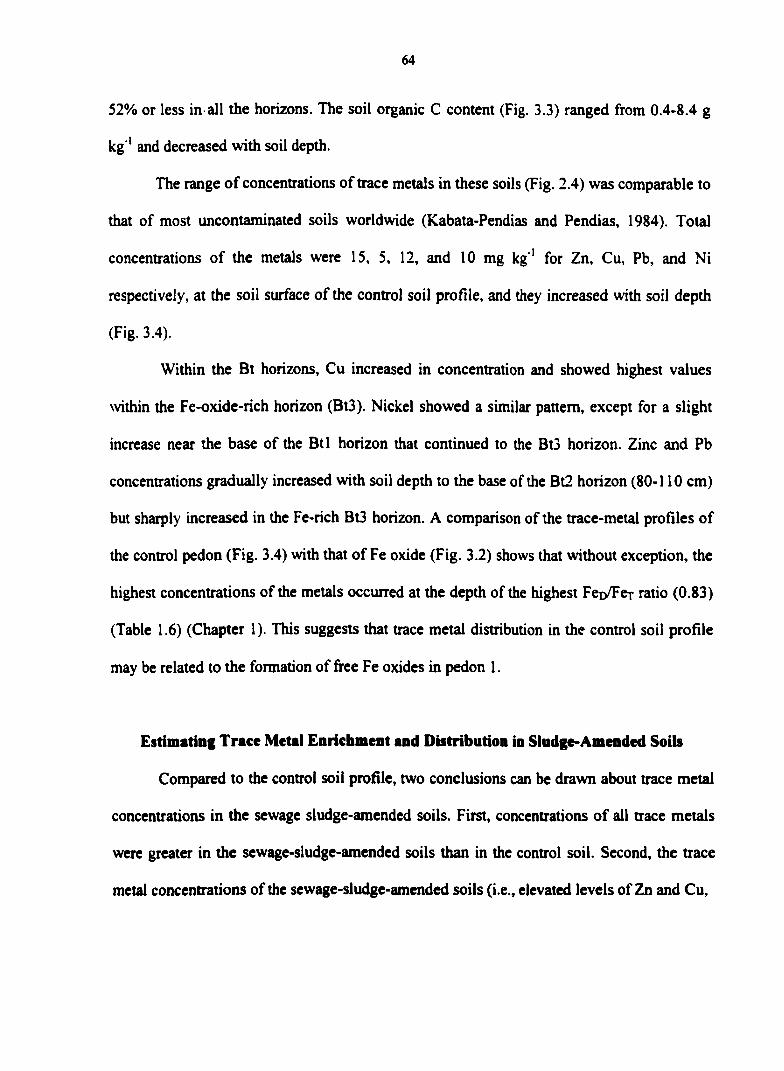
64
52% or less in all the horizons. The soil organic C content (Fig. 3.3) ranged from 0.4-8.4 g
kg ' and decreased with soil depth.
The range of concentrations of trace metals in these soils (Fig. 2.4) was comparable to
that of most uncontaminated soils worldwide (Kabata-Pendias and Pendias, 1984). Total
concentrations of the metals were 15, 5, 12, and 10 mg kg ' for Zn, Cu, Pb, and Ni
respectively, at the soil surface of the control soil profile, and they increased with soil depth
(Fig. 3.4).
Within the Bt horizons, Cu increased in concentration and showed highest values
within the Fe-oxide-rich horizon (BG). Nickel showed a similar pattern, except for a slight
increase near the base of the Btl horizon that continued to the Bt3 horizon. Zinc and Pb
concentrations gradually increased with soil depth to the base of the Bt2 horizon (80-110 cm)
but sharply increased in the Fe-rich Bt3 horizon. A comparison of the trace-metal profiles of
the control pedon (Fig. 3.4) with that of Fe oxide (Fig. 3.2) shows that without exception, the
highest concentrations of the metals occurred at the depth of the highest Feo/Fer ratio (0.83)
(Table 1.6) (Chapter 1). This suggests that trace metal distribution in the control soil profile
may be related to the formation of free Fe oxides in pedon 1.
Estimating Trace Metal Enrichment and Distribution in Sludge-Amended Soib
Compared to the control soil profile, two conclusions can be drawn about trace metal
concentrations in the sewage sludge-amended soils. First, concentrations of all trace metals
were greater in the sewage-sludge-amended soils than in the control soil. Second, the trace
metal concentrations of the sewage-sludge-amended soils (i.e., elevated levels of Zn and Cu,
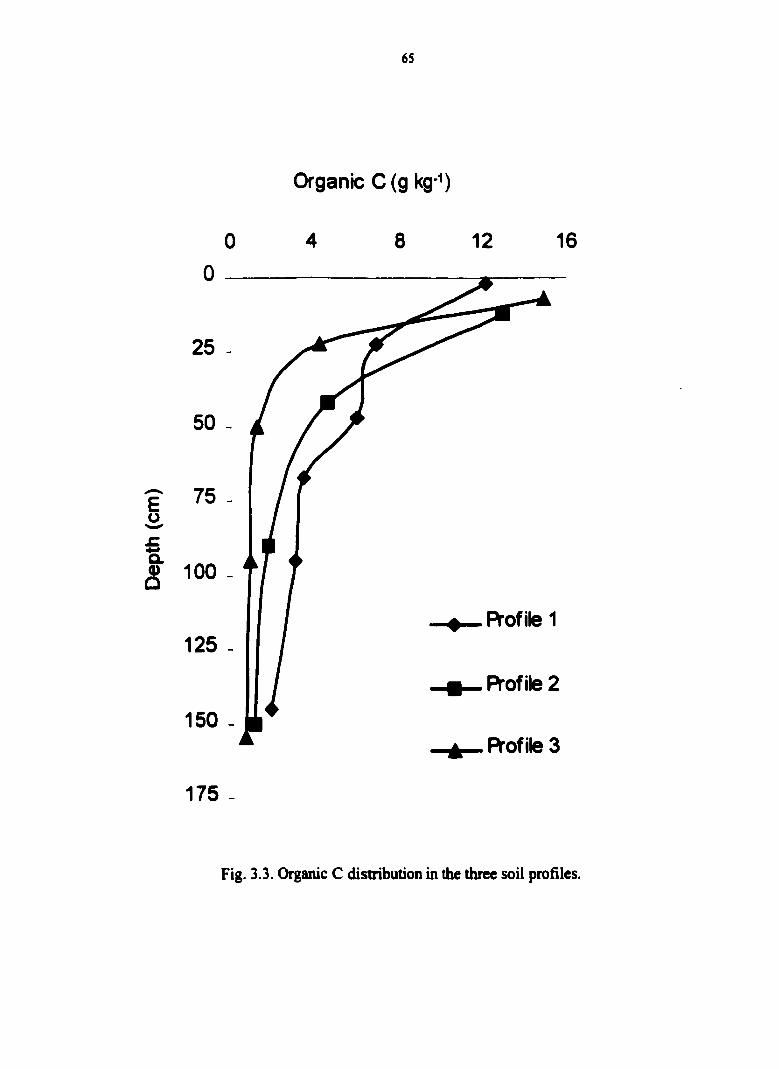
65
Organic C (g kg-^)
0 4 8 12 16
25 -
Q. 0) O
Profile 1 125 -
Profile 2
150 -Profile 3
175 -
Fig. 3.3. Organic C distribution in the three soil profiles.

66
Ap2
Bt1
Bt2
Bt3
Total metal concentration (mg kg'^)
0 10 20 30
0
Bt4
30
60
90
120
150
" 1
Zn
Pb
Cu
Ni
180
Fig 3.4. Metal distribution in soil profile 1 (control).
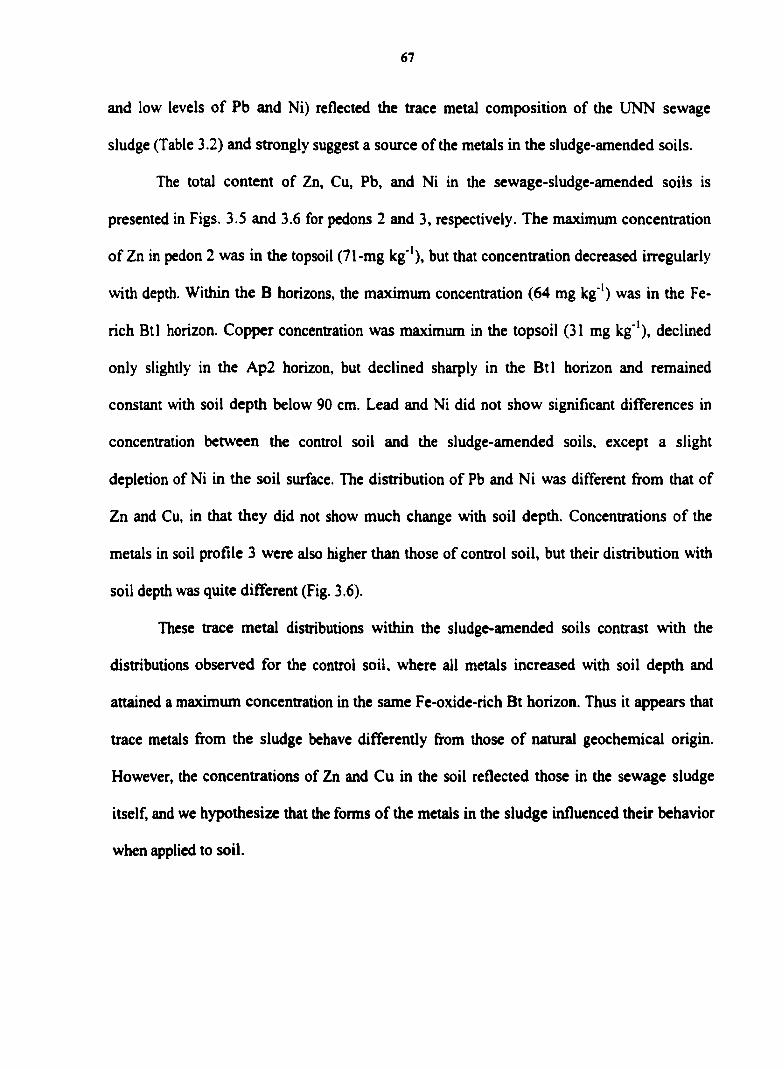
67
and low levels of Pb and Ni) reflected the trace metal composition of the UNN sewage
sludge (Table 3.2) and strongly suggest a source of the metals in the sludge-amended soils.
The total content of Zn, Cu, Pb, and Ni in the sewage-sludge-amended soils is
presented in Figs. 3.5 and 3.6 for pedons 2 and 3, respectively. The maximum concentration
of Zn in pedon 2 was in the topsoil (71-mg kg*'), but that concentration decreased irregularly
with depth. Within the B horizons, the maximum concentration (64 mg kg ') was in the Fe-
rich Btl horizon. Copper concentration was maximum in the topsoil (31 mg kg '), declined
only slightly in the Ap2 horizon, but declined sharply in the Btl horizon and remained
constant with soil depth below 90 cm. Lead and Ni did not show significant differences in
concentration between the control soil and the sludge-amended soils, except a slight
depletion of Ni in the soil surface. The distribution of Pb and Ni was different from that of
Zn and Cu, in that they did not show much change with soil depth. Concentrations of the
metals in soil profile 3 were also higher than those of control soil, but their distribution with
soil depth was quite different (Fig. 3.6).
These trace metal distributions within the sludge-amended soils contrast with the
distributions observed for the control soil, where all metals increased with soil depth and
attained a maximum concentration in the same Fe-oxide-rich Bt horizon. Thus it appears that
trace metals from the sludge behave differently from those of natural geochemical origin.
However, the concentrations of Zn and Cu in the soil reflected those in the sewage sludge
itself, and we hypothesize that the forms of the metals in the sludge influenced their behavior
when applied to soil.

68
Total metal concentration (mg kg'^)
0 20 40 60 80
Ap
Bt1
Bt2
30
60
90
Bt3
120
150
Zn
Pb
Cu
Ni
180
Fig. 3.5. Metal distribution in soil profile 2 (sludge-amended)

69
Total metal concentration (mg kg"^)
0 20 40 60
Ap1
Bw
Bt1
Bt2
Bt3
30
60
90
120
150
Zn
Pb
Cu
Ni
180
Fig. 3.6. Metal distribution in soil profile 3 (sludge-amended)

70
To estimate the degree of trace metal enrichment due to sewage sludge amendment, a
trace metal enrichment factor (EF) was calculated (Sinex and Helz, 1981; Rule, 1986;
Covelli and Fontolan, 1997). The EF assesses the trace-metal enrichment of soils with
respect to a control soil assumed to represent background levels of the metals. The EF was
calculated as
follows:
__ / Al^sludge - ammendedsoil Er =
(^X / Al) control soil
Where:
EF = Enrichment factor
X = metal concentration (mg kg ')
Al = Aluminum concentration in either control soil or sludge-amended soil (g kg'').
X/Al is the ratio of the concentration of the trace metal (Zn, Fb, Cu or Ni) to Al. Aluminum
was used as a normalization element because of its assumed low mobility in soils. An EF
value of unity denotes no enrichment or depletion relative to the control, whereas an EF>1
denotes enrichment relative to the control (Sinex and Helz, 1981; Covelli and Fontalan,
1997).
The EFs for Zn, Cu, Pb and Ni in the sewage-sludge-amended soils are presented in
Figs. 3.7 and 3.8 for pedons 2 and 3, respectively. The sludge-amended soils were enriched
with Zn and Cu but not with Pb or Ni. Enrichment factors of 1-S and 1-6 for Zn and Cu,
respectively, indicate that Zn and Cu were highly enriched in the sludge-amended soils over
the control soil. The EF was highest in the surface horizons and decreased with depth.
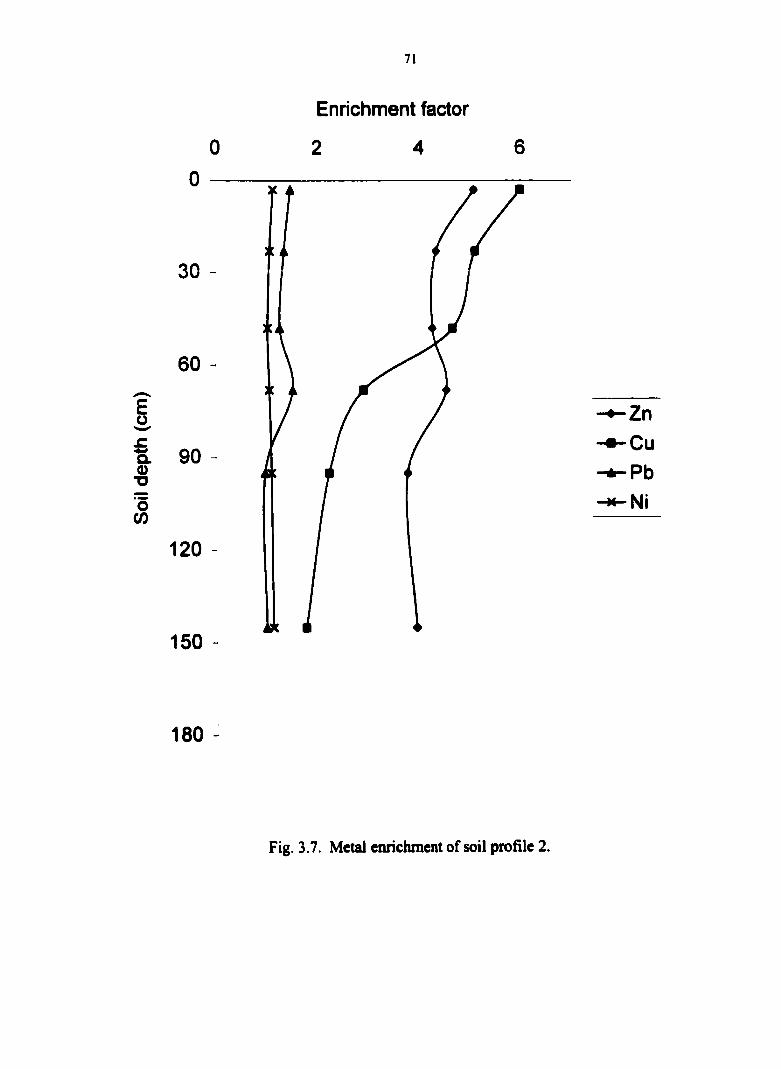
71
Enrichment factor
0 2 4 6
150 -
180 -
Fig. 3.7 Metal enrichment of soil profile 2.
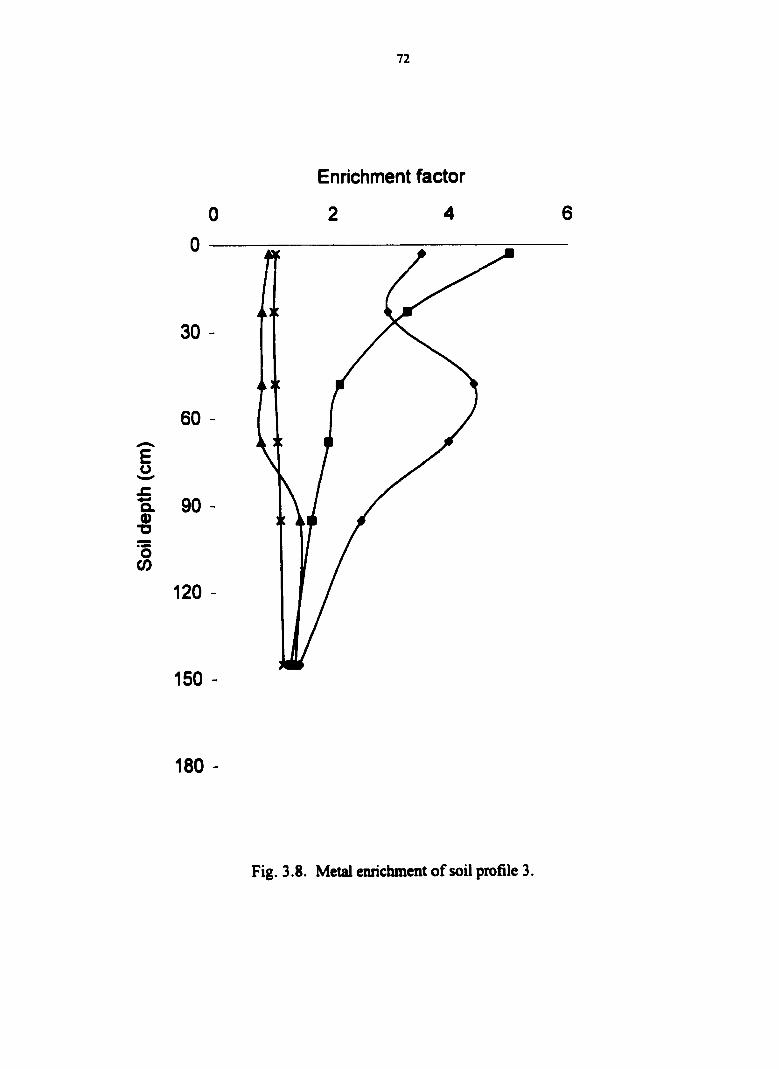
72
Enrichment factor
2 4
30
60
90
120
150
180
Fig. 3.8. Metal enrichment of soil profile 3.
73
due to the surface application of the sludge. Also, Zn and Cu are essential micronutrients to
plants and are recycled back to the soil pools of labile Zn and Cu in the upper soil horizons.
An EF>1 in the subsurface horizons indicates trace-metal levels above natural
geochemical levels of the soils (pedon I). Enrichment of Zn and Cu in the subsurface
horizons of the sludge-amended soils is indicative of the mobility of these metals within the
soil profile (Williams et al., 1984; Darmody et al., 1983; Dowdy et al., 1984). The mobility
of metals reported by these authors is not as pronounced as our observation. However, none
of these studies involved a long-term field study of over 30 years of sludge application like
ours with a very deep solum under a truly tropical setting. The high rainfall, low cation
exchange capacity, and commonly low pH of the soils of humid tropical ecosystems in
general, provide optimum conditions for metal transport. Also, these soils contain high
amounts of variable charge colloids (essentially due to Fe oxides). Because of the low pHs
(3.8-S.3) (Table 2.2), Fe oxide surfaces carry a net positive charge and provide limited sites
for adsorption of trace metals, thus promoting metal mobility. These conditons help to
explain the high metal mobility suggested by our data. Differences in degrees of enrichment
of the sludge-amended soils may be a function of the rate and number of applications of the
sewage sludge (Williams et al., 1984), but these data were not available at the time of
research. It may also be a function of the individual metal properties (Willams et al., 1984).
lA
Potential Mobility and Bioavailability of Trace Metals in Soil
Zinc
The distribution of Zn among the five sequentially extracted fractions (Fig. 3.9)
shows that about 94% of total Zn in the control soil was either in the residual, oxide or
organic fraction. Zinc in these fractions is likely to be less mobile than Zn in other forms. In
comparison to the control soil (pedon 1), the fraction of Zn in the residual, oxide or organic
fraction of the sludge-amended soils (pedons 2 and 3) decreased, but the exchangeable and
weakly bound Zn fractions increased six-fold in profile 2 and over four-fold in profile 3.
When this distribution of soil Zn is compared with Zn distribution in the sludge (residual 4%,
oxide 24%, organic 25%, and exchangeable+weakly-bound 47%), it is seen that the
distribution of Zn in the sludge-amended soils (organic 9-13%, residual 21-37%,
exchangeable+weakly-bound 26-36%) showed some similarities, especially in the
exchangeable and oxide-bound fractions. The spread of Zn forms into the five chemical
frractions in the control soil (exchangeable+weakly bound 6%, organic 15%, oxide 18%,
residual 61%) did not reflect the distribution of Zn in the sludge. (Fig. 3.1 and Fig. 3.9).
Exchangeable and weakly bound Zn fractions are likely to be readily available for
plant uptake and leaching (McLaren and Crawford, 1973; Mathews, 1983). Less than 7% of
the total Zn (profile average) in the control soil existed in the exchangeable and weakly
bound fractions, whereas 26-36% of Zn in the sludge-amended soils existed in the
exchangeable and weakly bound fractions. Lindsay (1972) has reported that the predominant
species of Zn below pH 7.7 is Zn^", and above this pH, the neutral species Zn(0H)2 is
predominant. Thus the large partitioning of Zn in the exchangeable fraction is probably due
to adsorption of Zn as a cation on soil exchange sites (e.g., soil clays and organic matter).
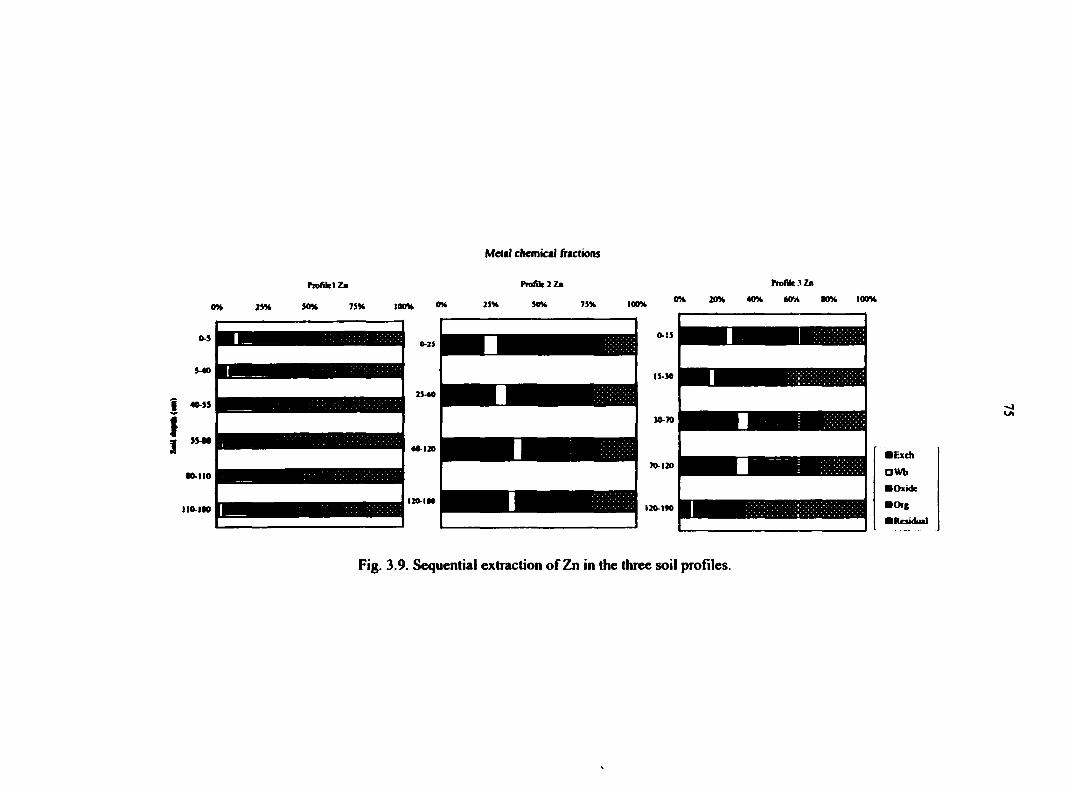
Metal chemical fmlions
rnfikl Zm ProiUc 2 Za Pnifile 3 Za
Fig. 3.9. Sequential extraction of Zn in the three soil profiles.
76
Besides, with the low pHs of these soils, is likely to be the predominant species, and
free Zn (Zn^"^ is both highly exchangeable and mobile. Nevertheless, the high proportion of
exchangeable and weakly bound Zn in the sewage-sludge-amended soils suggests that Zn in
the amended soils was present in chemical forms that were readily bioavailable for plant
uptake and leaching.
Zinc showed increases in DTPA extractability in the sludge-amended soils over the
control soil (Table 3.4). Going by the critical value of 0.6-0.8 mg DTPA-extractable Zn kg"'
soil suggested by Lindsay and Norvell (1978), some plants growing in the control soil will
probably be Zn deficient (0.2-0.9 mg Zn kg"' soil). But with DTPA-extractable Zn in the
range of II.3-18.8 mg Zn kg'' soil in pedon 2 and 0.7-8.1 mg Zn kg ' soil in pedon 3, the
plants will probably have high concentrations of Zn. Therefore, if it is assimied that Zn
extracted with DTPA is proportional to Zn that is plant available, then the potential for the
crops to encounter elevated concentrations of Zn may increase due to sewage-sludge-
amendment. The DTPA extracted less Zn than the HNO3 extraction, but DTPA-extractable
Zn was almost proportional to the total (HNOa-extractable) Zn concentration and their
distribution with soil depth was similar.
Copper
Copper in the control soil was predominantly in the residual fraction (75% of total Cu
content) (Fig. 3.10). However, the distribution of total Cu in the different chemical fractions
significantly differed from that of Zn. In the sewage-sludge-amended soils, Cu was
predominantly in the organic fraction (soil profile average of 52% and 42% of the total
content in profiles 2 and 3, respectively).
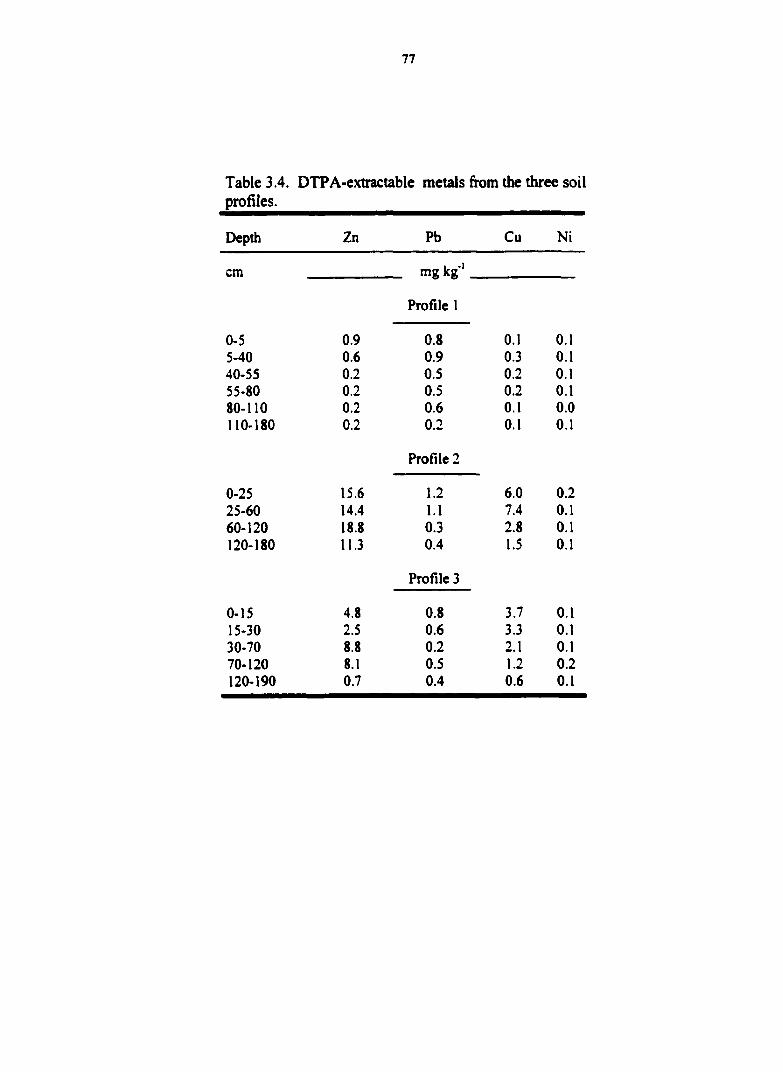
77
Table 3.4. DTPA-extractable metals from the three soil profiles.
Depth Zn Pb Cu Ni
cm mg kg'
Profile 1
0-5 0.9 0.8 0.1 0.1 5-40 0.6 0.9 0.3 0.1 40-55 0.2 0.5 0.2 0.1 55-80 0.2 0.5 0.2 0.1 80-110 0.2 0.6 0.1 0.0 110-180 0.2 0.2 0.1 0.1
Profile 2
0-25 15.6 1.2 6.0 0.2 25-60 14.4 1.1 7.4 0.1 60-120 18.8 0.3 2.8 0.1 120-180 11.3 0.4 1.5 0.1
Profile 3
0-15 4.8 0.8 3.7 0.1 15-30 2.5 0.6 3.3 0.1 30-70 8.8 0.2 2.1 0.1 70-120 8.1 0.5 1.2 0.2 120-190 0.7 0.4 0.6 0.1

Meul chemical fractions
40-35
30-70
70-120
120-190
Fig. 3.10. Sequential extraction of Cu in the three soil profiles.
79
The distribution of soil Cu into the different chemical fractions strongly reflects the
distribution of Cu in the UNN sewage sludge (Fig. 3.1). This supports our hypothesis that the
chemical forms of metals in sludge influence their behavior when applied to the soil. Our
finding of an overwhelming proportion of Cu in the organic fraction is in agreement with
many studies that have shown that Cu forms strong specific (covalent) bonds with electron-
rich flmctional groups in organic matter (McLaren and Crawford, 1973; Tyler and McBride,
1982). The association explains the high concentration of Cu in the organic fraction. The
practical implication of the association of Cu with organic matter with respect to Cu mobility
and bioavailability depends on the type of organic matter, since Cu strongly binds with both
soluble and insoluble organic matter in soils (Kabata-Pendias and Pendias, 1984). However,
significant increases in total and extractable Cu at all depths in the sludge-amended soils,
suggests that mobilization of Cu may be closely related to the leaching of soluble organic
compounds (e.g., humic and fiilvic acids) in these profiles (e.g., Tyler, 1981).
Copper showed increases in DTPA extractability in the sludge-amended soils over the
control soil (Table 3.4). Lindsay and Norvell (1978) proposed <0.2 mg DTPA-extractable Cu
kg'' soil as the critical Cu level in soils for some field crops. Based on this proposal, field
crops growing in the control soil will probably experience near optimum Cu levels (0.1-0.3
mg Cu kg ' soil), and those growing in the sewage-sludge-amended soils (0.6-7.4 mg Cu kg''
soil) will most likely experience high levels of Cu. Therefore, the sludge-treated soils had
greater plant-available Cu than the untreated soil. The DTPA extracted less Cu than the
HNO3 extraction, and Cu extracted by both methods were coirelated.
80
Lead and Nickel
Lead and Ni distributions in the five fractions were similar in all the soils. For Pb, 91-
97% of the total Pb existed in either the residual, organic or oxide fractions, and less than 6%
existed in the exchangeable fraction for all soils (Fig. 2.11). Similarly, 98% of the total Ni
content existed in either the residual, organic or oxide fractions, and less than 2% existed in
the exchangeable fraction for all soils (Fig. 2.12).
The total contents of Pb and Ni and their chemical partitioning into unreactive forms
in the UNN sewage sludge, the control soil, and the sludge-amended soils indicate that their
mobility and bioavailability are not a major concern for these soils. There were no significant
differences in the DTPA-extractable Pb and Ni between the control soil and the sludge-
amended soils (Table 2.4). Therefore, sewage-sludge-amendment did not increase the plant
availability of Pb and Ni, and plants growing in the treated soils are unlikely to be in danger
of Pb and Ni toxicity.
CONCLUSION
The soils of the study area contained low levels of Zn, Cu, Pb, and Ni. Long-term
amendment of the soils with domestic sewage sludge resulted in Zn and Cu enrichment in the
soils due to the high levels of Zn and Cu in the sewage sludge. Lead and Ni were not
enriched in the soils due to their low levels in the sewage sludge. High enrichment factors of
Zn and Cu at all depths of the sludge-amended soil profiles suggest that the metals had
moved from the zone of sludge incorporation (0-2S cm). Sequential extraction of Zn and Cu
in the sludge-amended soils showed that a large portion of the total Zn was associated with
the soil in exchangeable form. Copper, on the other hand, was mainly associated with soil
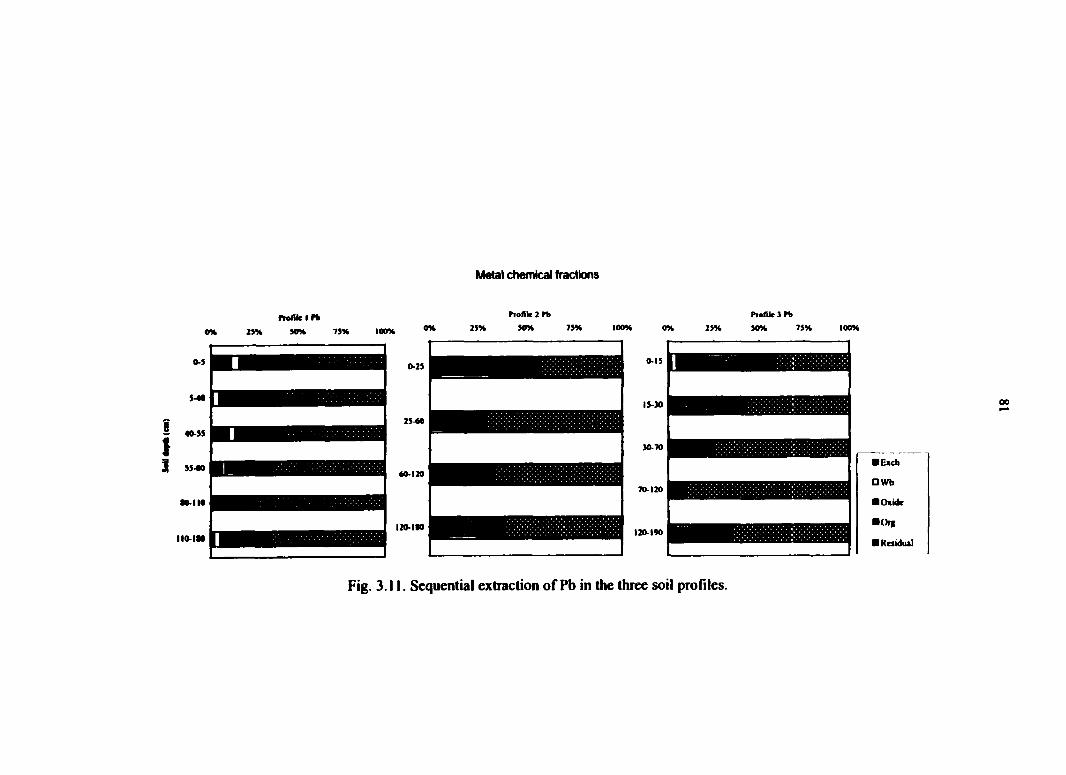
Metal chemical fractions
s-«o
40.5S
S5«l
W-IIO
IIO-IW
rrofik I n 2>H
ProfUcirb 30% 75%
0-25
25-«0
60-120
120-110
100% 0%
O.IS
15-30
30-70
120.190
Profile 3 n
Residual
Fig. 3.11. Sequential extraction of Pb in the three soil profiles
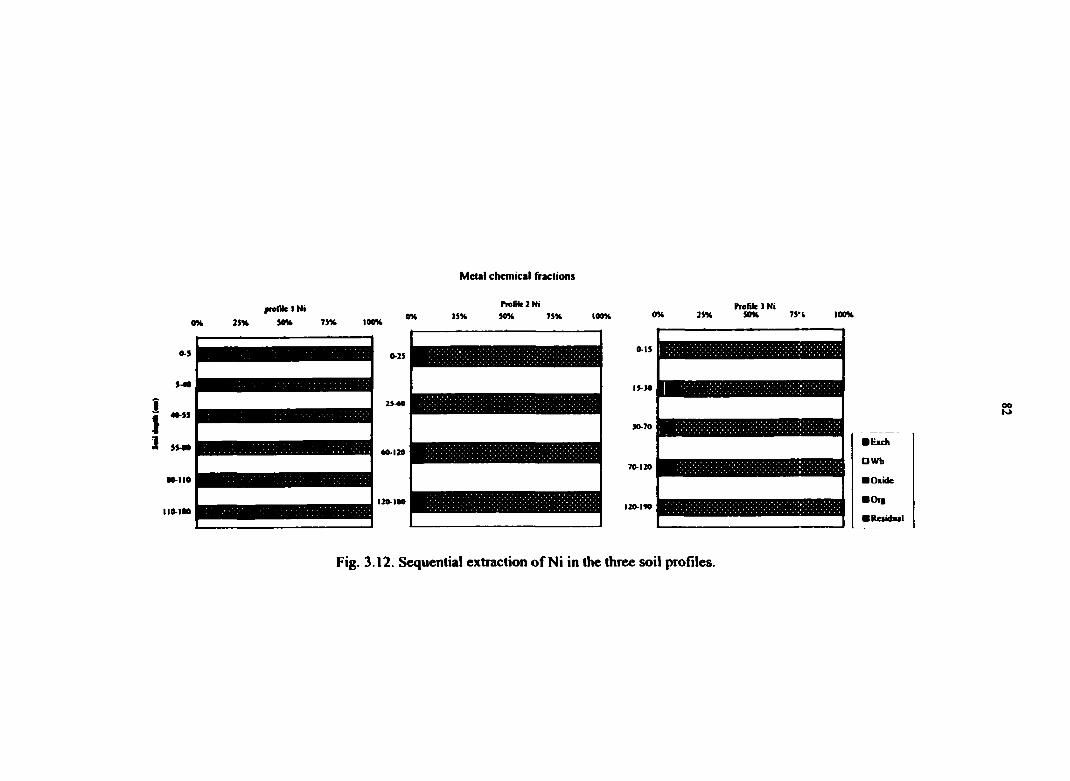
Melal chemical rraclions
hofUelNi OK 2SK SOK 7S*( lOOK
15-M
•Residual
Fig. 3.12. Sequential extraction of Ni in the three soil profiles.
83
organic matter. This finding suggests that in the sludge-amended soils, Zn and Cu are
potentially more mobile and potentially more bioavailable with respect to the unamended
soil. The DTPA extraction studies showed that the sewage-sludge-amended soils contained
higher DTPA-extractable Zn and Cu than the control soil. The application of sewage sludge
also increased the content of Zn and Cu extractable with milder reagents, such as dilute
Mg(N03)2 and NaOAc. This increase suggests that the sludge application provided metals in
labile chemical forms that could be more readily available to crop plants than in the
nonamended soils.
REFERENCES
Alloway, B.J. 1990. Heavy metals in soils. John Wiley and Sons. Inc. New York.
Baxter, J.C., M. Aguilar, and K. Brown. 1983. Heavy metals and persistent organics at a
sewage sludge disposal site. J. Environ. Qual. 12:311-316.
Berrow, M., and J. Webber. 1972. Trace elements in sewage sludges. J. Sci. Food Agric.
23:93-100.
Berti, W.R., and L.W. Jacobs. 1996. Chemistry and soil toxicity of soil trace elements from
repeated sewage sludge applications. J. Environ. Qual. 23:1025-1032.
Chukuma, C. 1993. Cadmium, lead and zinc from teirestial plants in Enyigba-Abakaliki lead
and zinc mine: Search for a monitoring plant species in trace element distribution.
Bull. Environ. Contam. Toxicol. 51:665-671.
Coveili, S., and G. Fontalan. 1997. Application of a normalization procedure in determining
regional geochemical baselines. Environ. Geol. 30:34-45.
84
Daitnody, R.G., J.E. Foss, M. Mcintosh, and D.C. Wolf. 1983. Municipal sewage sludge
compost-amended soils: Some spatiotemporal treatment effects. J. Environ. Qual.
12:231-236.
Doner, H.E. 1978. Chloride as a factor in mobilities of Ni (II), Cu (II), and Cd (II) in soil.
Soil Sci. Soc. Am. J. 42:882-885
Dowdy, R.H., J.J. Latterell, T.D. Hinsely, R.B. Grossman, and D.L. Sullivan. 1984. Trace
metal movement in a silt loam soil following 14 years of aimual sewage sludge
applications. Agron. Abst., p.26.
Emmerich, W.E., L.J. Lund, A.L. Page, and A.C. Chang. 1982a. Movement of heavy metals
in sewage sludge-treated soils. J. Environ. Qual. 11:174-178.
Emmerich, W.E., L.J. Lund, A.L. Page, and A.C. Chang. 1982b. Solid phase forms of heavy
metals in sewage sludge-treated soils. J. Environ. Qual. 11:178-181.
Jackson, M.L., C.H. Lim, and L.W. Zelazny .1986. Oxides, hydroxides, and aluminosilicates.
p. 101-150. 7/1 Klute, A. (ed.) Methods of soil analysis. Part 1. 2nd ed. Book Series
No. 5. ASA and SSSA, Madison, WI.
Juste, C., and M. Mench. 1992. Long-term application of sewage sludge and its effects on
metal uptake by crops, p. 159-193. In D.C. Adriano (ed.) Biogeochemistry of trace
metals. Advances in trace substances research. Lewis Publishers, London.
Kabata-Pendias, A., and H. Pendias. 1984. Trace elements in soils and plants. CRC Press,
Inc. Boca Raton, Florida.
Kalbasi, M., G.J. Racz, and L.A. Loewen-Rudgers. 1978. Mechanism of Zn adsorption by Fe
and A1 oxides. Soil Sci. 125:146-150.

Kelling, K.A., D.R. Keeney, L.M. Walsh, and J.A. Ryan. 1977. A field study of the
agricultural use of sewage sludge: III. Effect on uptake and extractability of sludge-
borne metals. J. Environ. Qual. 6:352-358.
Korte, N.E., J. Skopp, W.H. Fuller, E. Niebia, and B.A. Alesii. 1976. Trace element
movement in soils: Influence of soil physical and chemical properties. Soil Sci.
122:350-359.
Lake, D.L., P.W.W. Kirk, and J.N. Lester. 1984. Fractionation, characterization and
speciation of heavy metals in sewage sludge and sludge amended soils: A review. J.
Environ. Qual. 13:175-183.
Lerch, R.N., K.A. Barbarick, D.G. Westfall, R.H. Follett, T.M. McBride, W.F. Owen. 1990.
Sustainable rates of sewage sludge for dryland winter wheat production. 1. Soil
nitrogen and heavy metals. J. Prod. Agric. 3:60-65.
Lindsay, W.L. 1972. Inorganic phase equilibra of micronutrients in soils, p. 41-57. In J.J.
Mortvedt, P..M. Giordano, and W.L. Lindsay (ed.) Micronutrients in agricultiire. Soil
Sci. Soc. Am. Madison, Wis.
Lindsay, W.L., and F.R. Cox. 1985. Micronutrient soil testing for the tropics. Ferti Res.
7:169-199.
Lindsay, W.L., and W.A Norvell. 1978. Development of a DTPA soil test for Zn, Fe, Mn and
Cu. Soil Sci. Soc. Am. J. 42:421-428.
Mathews, P.J. 1984. Control of metal application rates from sewage sludge utilization in
agriculture. Critical Rev. Environ. Control 14:199-250.
McLaren, R.G., and D.V. Crawford. 1973. Studies of soil Cu 1. The fractionation of Cu in
soils. J. Soil Sci. 24:172-181.
Miller, W.P., D.C. Martens, and L.W. Zelazny. 1986. Effect of sequence in extraction of
trace metals from soils. Soil Sci. Soc. Am. J. 50:598-601
Miller, W.P., and W.W. McFee. 1983. Distribution of Cd, Zn, Cu, and Pb in soils of
industrial northwestern Indiana. J. Environ. Qual. 12:29-33.
Ntekira, E.E.U., S.J. Ekwere and E.E. Ukpong. 1993. Heavy metal distribution in sediments
from Calabar River, Southeastern Nigeria. Environ. Geol. 21: 237-241
Page, A.L. 1974. Fate and effects of trace elements in sewage sludge when applied to
agricultural lands. EPA Publication no. 670/2-74-005. Cincinnati.
Rule, J.H. 1986 Assessment of trace element geochemistry of Hampton Roads Harbor and
Lower Chesapeake Bay Area sediments. Environ. Geol. Water Sci. 8:209-219.
Schnitzer, M., and S.I.M. Skinner. 1966. Organo-metallic interactions in soils: 5. Stability
constants of Cu, Fe, and Zn- frilvic acid complexes. Soil Sci. 102:361-365.
Sheppard, M.I., and M. Stephenson. 1995. Critical evaluation of selective extraction methods
for soils and sediments, p. 69-100. In R. Prost (ed.) Third International Conference on
the biogeochemistry of trace elements: Contaminated soils. Paris, France. 15-19 May
1995. INRA Editions. Versailles, France.
Sommers, L.E. 1977. Chemical composition of sewage sludges and analysis of their potential
use as fertilizers. J. Environ. Qual. 6:225-232.
Shuman, L.M. 1985. Fractionation method for soil microelements. Soil Sci. 140:11-23.
Shuman, L.M. 1991. Chemical forms of micronutrients in soils, p 113-114. In J.J. Mortvedt
et al. (ed.) Micronutrients in agriculture. 2"** ed. SSSA Book Ser. 4. SSSA. Madison,
WI.
87
Sinex, S.A., and G.R. Helz. 1981. Regional geochemistry of trace elements in Chesapeake
Bay sediments. Environ Geol. 3:315-323.
Sloan, J.J., R.H. Dowdy, M.S. Dolan, and D.R. Linden. 1997. Long-term effects of biosolids
applications on heavy metal bioavailability in agricultural soils. J. Environ. Qual.
26:966-974.
Sposito, G., L.J. Lund and A. C. Chang. 1982. Trace metal chemistry in arid-zone field soils
amended with sewage sludge: I. Fractionation of Ni, Cu, Zn, Cd and Pb in solid
phases. Soil Sci. Soc. Am. J. 46:260-264.
Srikanth, R., and S.R.P Reddy. 1991. Lead, cadmium and chromium levels in vegetables
grown in urban sewage sludge in India. Food Chemistry 40:229-234.
Sridhar, M.K.C. and A.O. Bammeke. 1986. Heavy metal contents of some solid wastes in
Ibadan, Nigeria. Water, Air, Soil Pollut. 29: 51-56.
Stover, R.C., L.E. Sommers, and D.J. Silviera. 1976. Evaluation of metals in wastewater
sludge. J. Water Pollut. Control Fed. 48:2165-2175.
Tessier, A., P.G. Campbell, and M. Bisson. 1979. Sequential extraction procedure for the
speciation of particulate trace metals. Anal. Chem. 51:7:844-850.
Tyler, G. 1981. Leaching of metals from the A horizon of a spruce forest soil. Water Air Soil
Pollut. 15:353-369.
Tyler, L.D., and M.B. McBride. 1982. Mobility and extractability of Cd, Cu, Ni, and Zn in
organic and mineral soil columns. Soil Sci. 143:198-295.
U.S. Environmental Protection Agency. 1993. Clean water act. Section 503. Vol. 58. No. 32
USEPA, Washington, DC.

van Valin, R., and J.W. Morse. 1982. An investigation of methods commonly used for the
selective removal and characterization of trace metals in sediments. Mar. Chem.
11:535-564.
Williams, D.E., J. Vlamis, A.H. Pukite, and J.E. Corey. 1980. Trace element accumulation,
movement, and distribution in the soil profile from massive applications of sewage
sludge. Soil Sci. 129: 119-132.
Wiliams, D.E., J. Vlams, A.H. Pukite, and J.E. Corey. 1984. Metal movement in sludge
treated soils after six years of sludge addition: 1. Cd, Cu, Pb, and Zn. Soil Sci.
137:351-359.
89
CHAPTER 4. MINE SOIL GENESIS AND MICRO-ENVIRONMENT OF Pb AT THE MINES OF SPAIN
A paper to be submitted to Soil Science Society of America Journal
M. 0. Mbila, M. L. Thompson,* and E.W. Straszheim
ABSTRACT
The association of Pb with pedological features has a direct effect on its distribution and
bioavailability. This study was conducted to determine the distribution of Pb within mine soil
profiles and among different components of the soil fabric. The impact of Pb mining on the
pedogenesis in mine spoil and redistribution of Pb was investigated on a loess-covered
hillslope at the Mines of Spain, lA, using microanalytical techniques to complement standard
bulk analytical methods. Soil profile studies indicated that Pb mining influenced the
pedogenesis of the soils of the immediate mining areas and resulted in the redistribution of
Pb in the mine soil profiles. Sequential extraction studies indicated that Pb in the mine soils
was associated with secondary oxides as well as with soil organic matter by mechanisms that
are stronger than ion exchange reactions. Microanalytical studies indicated that, depending
on the level and environment of contamination, SEM/EDX analysis was effective in
localizing Pb in association with its microenvironment. The diversity of Pb phases in the
mine soils implies that Pb bioavailability, at least in the short term, depends on the particular
chemical and physical composition of the immediate environment rather than on the average
composition of the soil.
90
INTRODUCTION
Lead mining around the world has been the primary cause of Pb contamination of
soils (Asami et al., 1981; Alloway, 1990). Lead contamination of soils occurs in many ways,
including aerial fallout near Pb mining and smelting (Bauchauer, 1973; Alloway, 1990;
Dickson et al., 1996), polluted surface water along streams passing through mining areas
(Schintu et al., 1991), and dumping of mining waste on soil (Coker and Mathews, 1983). Pb
contamination of soils is of serious concern because Pb can accumulate in soil to a point
where it is toxic to plants, although such points are different for different plants (Will and
Suter II (1985). Also, movement of Pb from contaminated sites has the potential for
contamination of drinking water resources and accumulation in the food chain. Due to the
several pathways by which Pb contamination takes place, planning of management strategies
to deal with Pb contamination hazards requires pertinent information about the chemical,
physical and biological environment of Pb in contaminated soils.
Standard methods of determining soil contaminants involve mainly bulk
characterization of samples by using either total or selective chemical extraction methods.
Determination of total metal contents of bulk samples using strong acids provides
information about the maximum potential hazard of the contaminants in the bulk sample and
is useful in determining if further analysis is required. Selective extraction refers to either
single extractants (e.g. EDTA, DTP A, HCl, NaOH) or a set of extractions applied in an
ordered sequence to the same soil sample (sequential extractions, e.g., Tessier, et al., 1979;
Stover et al., 1976; Sposito et al., 1982; and Shuman, 198S). Sequential extraction partitions
the contaminants into chemical forms that are operationally defined and are based on the

91
ability of the extracting reagents to remove forms of an element from the soil. The problem
with bulk analyses in general is that they do not offer direct information about the association
of metals with pedological features such as root channels, organic matter, sesquioxide and
clay coatings on mineral grains and pore walls.
Association of Pb with soil solid phases has a direct effect on Pb bioavailability
(Davis et al., 1992). For example, Harmsen (1977) reported that unavailable (residual and
acid extractable) fractions of Pb were high (80-90?'^o) in soils along a river discharging waste
from a Pb mine due to association with Fe oxides or stable minerals such as sulfides. Davis et
al. (1993) showed that oxidation reaction on mineral surfaces resulted in encapsulation of the
primary mineral grain by a secondary reaction product that diminished Pb availability. A Pb
phase may be enclosed within an inert phase and thus present no surface area for chemical
reactions (Kennedy et al., 1996). Also, the phase association may indicate the alteration of
one phase to another as a rim on a grain or precipitation as cement (Link et al. 1994),
depending on the spatial relationships of the metal and the matrix associated with it. This
diversity of Pb phases in soils implies that Pb contamination at least in the short term must
depend on the particular chemical and physical composition of the immediate environment
rather than on the average composition of the soil. The idea is significant because each phase
has a different solubility and mobility under the same soil conditions. Therefore an
assessment of the Pb contamination hazard will require identifying the specific phases of Pb
in the soil.
A combination of light, electron and x-ray microscopy on physically undisturbed
samples of soil can help to localize Pb while preserving its microenvironment. Once
localized, the specific local environment of Pb can be accurately characterized in terms of its
92
Structure, chemistry and mineralogy using the techniques described by Bisdom et al. (1986).
Bisdom et al. (1986) prepared thin sections of undisturbed soil samples and used light
microscopy to identify both brown and black coatings on the walls of voids and on the
surfaces of mineral grains. With the aid of SEM-EDXA and SEM-WDXA, it was possible to
determine that the brown coatings contained the smallest amounts of heavy metals (including
Pb) and the black ones the largest amounts. Kennedy et al. (1996) identified specific Pb
phases on polished thin sections of soils based on backscattered electron intensity and
quantified the phases using energy dispersive spectrometry (EDS) or wavelength dispersive
spectrometry (WDS).
These techniques have not been well explored in soil pollution control studies, but
they could be used to determine if there is a preferential association between Pb and
pedological features such as Fe oxide concentrations, root channels, organic maner, clay
coatings and carbonates. These associations could be important because to the extent that
such features are mobile or immobile in soil, the Pb associated with them may be mobile or
immobile too.
The goal of this study was to investigate the genesis of the mine soils at the Mines of
Spain, Dubuque County, Iowa, and to determine the distribution and microenvironment of Pb
in the soils. The research integrates the use of both micro chemical analysis and
micromorphological techniques on undisturbed soil samples to complement standard
chemical approach on bulk samples.

93
MATERIALS AND METHODS
Environment of the Research Site
This investigation focuses on an abandoned Pb mining area, the Mines of Spain in
northeastern Iowa, which was a major source of Pb ore in the United States during the 1S''*
and 19''' centuries. The location of the Mines of Spain in relation to major roads and towns is
presented In Fig. 4.1. Early development of the district was spurred by the need for metallic
Pb used chiefly for making Pb shot. Mining at the Mines of Spain ceased over one hundred
years ago. But different sizes of pits (S-10 m) and mounds of spoil abandoned by the miners
still characterize the micro-topography of the old mine field. However, most of the pits have
either been partially or completely filled by materials that were washed firom the surrounding
slopes.
The lead ores that were mined at this site are classified as an Upper Mississippi
Valley type (MVT) deposit, which occurs in portions of northeast Iowa, southwest
Wisconsin, and northwest Illinois. Upper-Mississippi-Valley type deposits are metallic
hydrothermal ore deposits derived firom hot vapors escaping fi'om cooling igneous magmas
that formed in the Mississippi Valley region (Ludvigson and Dockal, 1984). Pb in the MVT
ore deposits, which occur in marine sedimentary rocks, was transported in solution by hot,
saline brines in open cracks within the relatively flat-lying Silurian dolomite bedrock. Sulfide
crystals present included galena, sphalerite, and pyrite. Geologic erosion and landscape
dissection lowered the water table, and consequently, the sulfides were oxidized and
dissolved. The Pb reprecipitated in oxide and carbonate minerals (Ludvigson and Dockal,
1984).
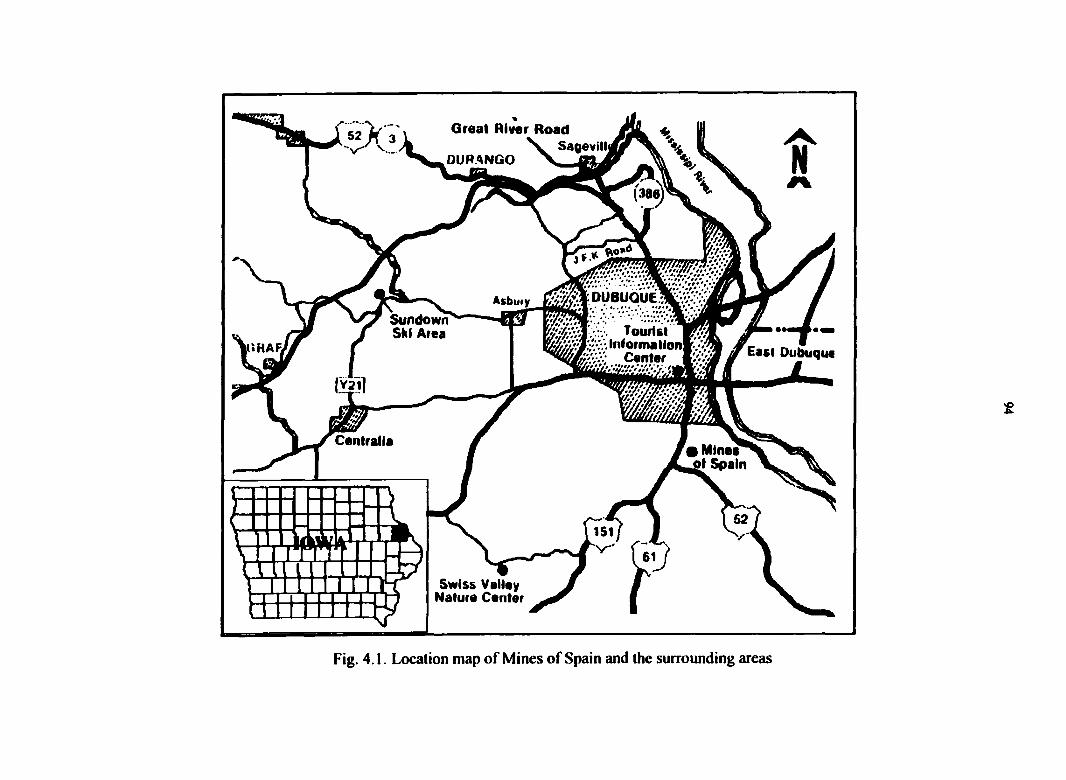
Great River Road SaQevill
DURANGO
DUBUQUEjfcv^ Asbuiy
Sundown Ski Area
v.*. Inlorma llonl''/V URAF. East Dubuque Center
Cantraiia Minaa
ot Spain
Swiss valley Nature Center
Fig. 4.1. Location map of Mines of Spain and the surrounding areas

95
The Mines of Spain area is in the physiographic region called the Paleozoic Plateau
(Prior, 1991), which was covered by loess about 13,000 years ago. Predominant vegetation in
the area is oak {Quercus spp.) and hickory (Carya spp), whereas anise root {Osmorhiza
longistylis) and black snakeroot {Sanicular marilandica) are the predominant ground-level
plants.
Soib and Soil Sample Collection
To investigate the impact of mining on the genesis and redistribution of Pb in the
soils of the area, soil samples were collected from three different sites within the abandoned
mining area. For each of the sites, a standard soil profile pit was dug, horizons of the soil
profiles were delineated, described, and sampled according to the methods of Soil Survey
Staff (1993). Both bulk and undisturbed soil samples were collected from the different
horizons along the soil profiles to determine the vertical changes of soil properties with
depth. Soil 1 was a reference soil located in an area where mining did not occur. Soil 2 was
located in mine pit, and soil 3 was located in mine spoil. All three soils where located within
a local area of about 100 m^. The soils developed in a loess mantle that covers dolomite-rich
bedrock. They occur on a side slope (34-37%), and they are mapped as Seaton silt loam
(USDA, 1985). A sketch showing the locations of the three sampled pedons and their
relationships to the landscape at the Mines of Spain is presented in Fig. 4.2. Another surface
horizon sample was collected from a mine pit with an environment similar to that of soil
profile 2 but in another part of the Mines of Spain. Detailed soil profile descriptions of the
soils are presented in Appendix C1.
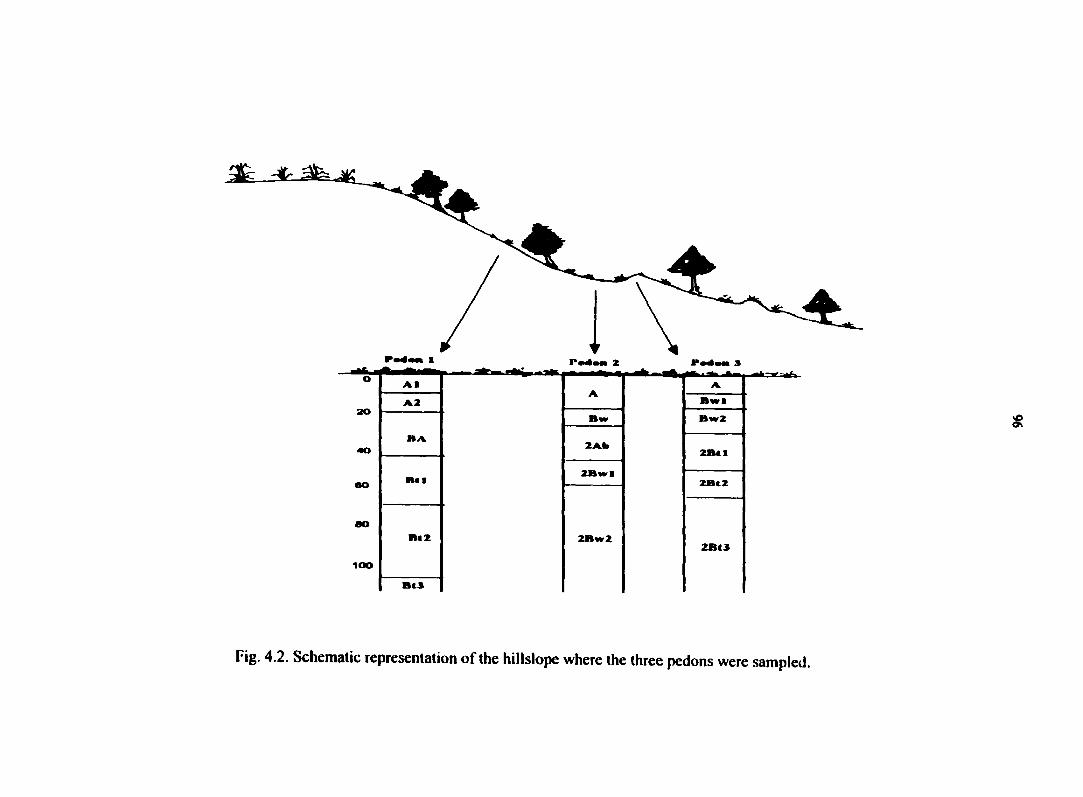
r.
Bwl A2 20
Bw
Btl ao
Fig. 4.2. Schematic representation of the hillslope where the three pedons were sampled.

97
Sample Prctreatmcnt and Characterization
The soil samples were air-dried at room temperature for about a week and ground to
pass a 10-mesh sieve. Moisture content was determined by drying separate sub samples at
105®C until they reached constant weight. Total Pb, Fe, and Mn were solubilized according
to the method of Miller and McFee (1983) by digesting 4 g of soil with 20 ml of concentrated
trace metal grade HNO3 at 100°C for 16 hours using an A1 digestion block with reflux cover.
After the digestion, 5 ml of 30% H2O2 were added to oxidize resistant organic matter, and the
solution was allowed to cool. After cooling, the solution was filtered through Whatman #42
filter paper into a SO-ml volumetric flask. The volumetric flasks were then diluted to volume
with distilled water. Blank samples that were treated exactly like the soil samples were used
to prepare the standard solutions in order to match the matrix of the standards with that of the
soil samples. Pb, Fe, and Mn were determined by inductively coupled Ar plasma atomic
emission spectroscopy (ICAP-AES). All samples were run in triplicate to monitor the
precision of our determinations. In addition, our Soil Testing Laboratory reference sample
was included in each run as a quality control reference material. The detection limit for Pb
was equivalent to 0.075 mg kg ' soil, but levels of Pb in the samples were much higher.
Measurements for the three replications yielded an average standard deviation of 0.7 mg Pb
kg*' soil for the samples with low Pb concentrations (pedon 1) (CV S%) and 11.5 mg Pb kg''
soil for the samples with very high Pb concentrations (pedons 2 and 3) (CV 4%). The raw
data for this analysis are included in Appendix C2.
Total C and N was determined by dry combustion using a Leco-CHN instrument
(Nelson and Sommers, 1982), while organic C was determined by the Mebius modification
of theWalkley and Black method (Nelson and Sommers, 1982). Particle size analysis of the

98
<2-nim fraction was detennined with the pipette method (Walter et al., 1978). Soil pH was
determined using a 1:1 soil/water ratio. Exchangeable bases were extracted with 1 M
NH4OAC, pH 7.0 (Thomas, 1982). The extracts were analyzed for Ca, Mg, K, and Na by
inductively coupled Ar plasma atomic emission spectroscopy (ICAP-AES). Exchangeable
acidity (tT + Al^"*) was determined by the 1 A/ KCl method. Exchangeable FT was calculated
by subtracting the titrated Al from exchangeable acidity (Thomas, 1982). Cation exchange
capacity (CEC) was calculated from the sum of Ca^"^, Mg^", K", and Na" plus exchangeable
acidity.
Sequential Chemical Extractions
To distinguish Pb phases, the soils were subjected to a five-step sequential extraction
procedure according to methods described by Tessier et al. (1979) and modified by Shuman
(1982) and Mehra and Jackson (1960). A summary of the steps involved in the procedure and
the reagents used is presented in Table 4.1. We used 1 M Mg(N03)2 to remove exchangeable
metals by flooding the soil with Mg ions and we used 1 M NaOAc (pH 5) to dissolve the
carbonates. A combined action of Na-citrate-bicarbonate-dithionite (CBD) was used for
extracting metals bound to Fe and Mn oxides. Sodium dithionite was employed to reduce Fe
and Mn to their ferrous and manganous forms, respectively, Na-citrate was used to complex
the metals and Na-bicarbonate was used to buffer the pH of the system. Hydrogen peroxide
(HjOi) was used to oxidize organic matter, thereby liberating the metals that were bound to
the organic matter. For the residual fraction determination, the use of HNO3 was intended to
dissolve any remaining primary and secondary minerals in the soil, thereby liberating the Pb
that may be held within mineral crystal structures. Although HNO3 does not completely
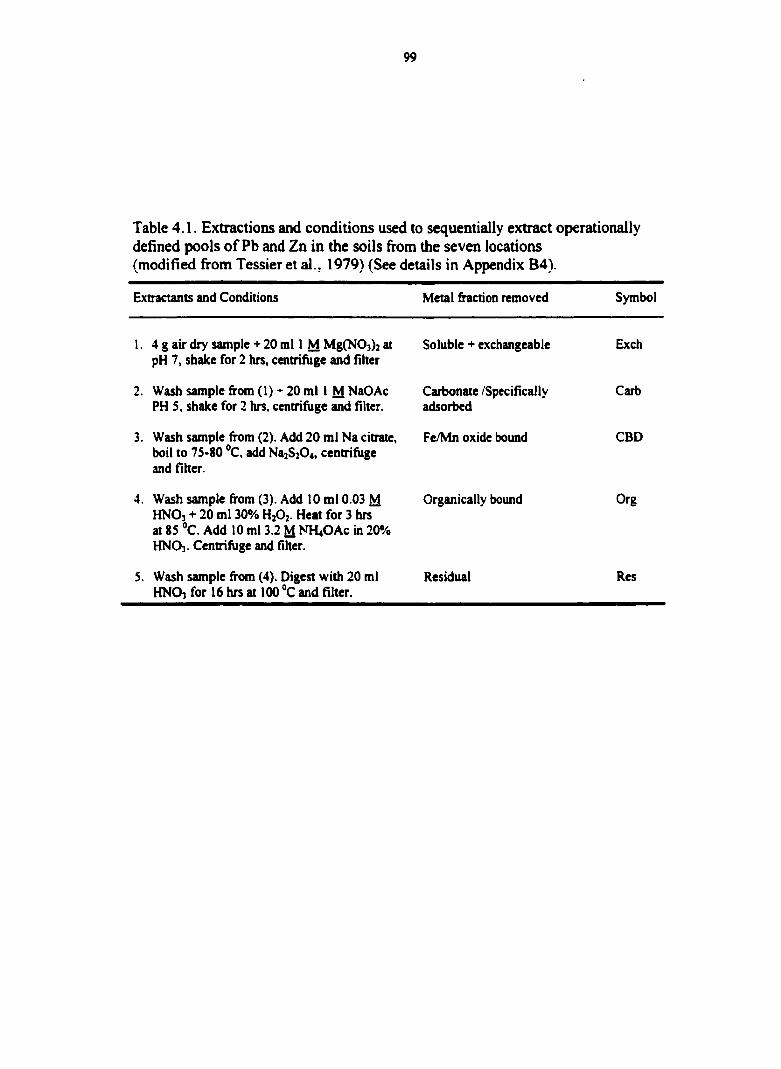
99
Table 4.1. Extractions and conditions used to sequentially extract operationally defined pools of Pb and Zn in the soils from the seven locations (modified from Tessier et al., 1979) (See details in Appendix B4).
Extractants and Conditions
1. 4 g air dry sample + 20 ml 1 M Mg(N03)2 at pH 7, shake for 2 hrs, centrifuge and filter
2. Wash sample from (1) 20 ml I M NaOAc PH S, shake for 2 hrs, centrifuge and filter.
3. Wash sample from (2). Add 20 ml Na citrate, boil to 7S-80 °C, add Na2S204, centrifuge and filter.
4. Wash sample from (3). Add 10 ml 0.03 M HNOj + 20 ml 30% HjOj- Heat for 3 hrs at 85 "C. Add 10 ml 3.2 M NH4OAC in 20% HNO]. Centrifuge and filter.
5. Wash sample from (4). Digest with 20 ml HNO] for 16 hrs at 100 "C and filter.
Metal fraction removed Symbol
Soluble + exchangeable Exch
Carbonate /Specifically Carb adsorbed
Fe/Mn oxide bound CBD
Organically bound Org
Residual Res

100
dissolve the sample since it does not attack the most resistant silicates (e.g. quartz and
feldspars), micas, amphiboles and sulphides are dissolved to a great extent.
After each step of the extraction, the soil was rinsed with 20 ml of distilled and deionized
water, centrifuged and the water was discarded.
There are shortcomings of sequential extraction techniques, such as problems
regarding the specificity of the extracting solutions for given forms of metals and the fact that
repeated determinations performed on one sample may introduce additive analytical errors
(Miller and McFee, 1983; Sheppard and Stephenson, 1995). Also there could be considerable
overlap in the extraction capabilities of the various extractants. We emphasize that since the
extraction techniques are only operationally defined, the extraction of a metal from a
particular soil fraction by a particular extractant gives only an approximation of a metal's
partitioning in the soil.
After extraction, samples were analyzed for Pb by inductively coupled plasma-atomic
emission specteroscopy (ICP-AES). Standard solutions for the ICP-AES analysis were made
up in the same reagent solutions as were used in each respective extraction step. Reagent
blanks were used to account for any reagent or procedural contamination, and they were
analyzed with every set of samples. A standard sample was included in every batch and was
run six times for quality control assessment. The average standard deviation for the chemical
fractions were 0.26 mg Pb kg ' soil (exchangeable), 0.23 mg kg"' CBD, 0.56 mg kg '
(organic), and 0.15 mg kg'' (residual). The complete sequential extraction procedure used is
included in Appendix B4.
101
Mincnilogical Analyses
The soil mineralogy was determined by x-ray diffraction (XRD) analysis. The XRD
analysis of the clay and sand fractions was performed using CuKa radiation with a Siemens
D5000 diffractometer. The samples to be analyzed were treated with Na acetate to remove
carbonates, and with hydrogen peroxide to remove organic matter. Then the samples were
fractionated to obtain <2 (im clay. The <2 ^m-clay fraction was satiirated with a cation (Mg
or K) and freeze-dried. Oriented samples were then prepared by plating the clay onto ceramic
tiles by using vacuum filtration apparatus. The Mg-saturated samples were equilibrated with
glycerol, and the K-saturated samples were heated to 350®C and 550°C before x-ray analysis.
Sample preparation for the fme sand fraction XRO analysis involved sprinkling a thin layer
of the sand fraction onto double-stick tape on a glass slide. During the XRD analysis,
samples were continuously scanned from 2 to 6O°20 at a scanning rate of 4''20 per minute.
The scans were then compared with documented patterns published by the International
Center for Diffraction Data.
Thin Scction Preparation and Light Microscopy
Soil thin sections were prepared according to the standard method of thin section
preparation (Murphy, 1989). Undisturbed soil samples from the sites were air dried and
vacuum-impregnated with Epotek epoxy resin to harden the samples. The hardened blocks
were cut into thin sections, polished, and bonded to glass slides. The bonded sections were
then polished down to about 30 ^m and used for micromorphological characterization of the
soil. Polished thin sections were described using the guidelines for soil thin section
description (Bullock et al. 1985). With a light microscope, pedological features such as root
102
channels, organic matter, sesquioxides and clay coatings on mineral grains and pore walls
were identified and described. Then small areas (e.g., 1 mm^) chosen to be further
investigated were selected and marked.
Polished Thin-Section Preparation and Scanning Electron Microscope/Energy
Dispersive X-ray Analyzer Analyses
Two different soil samples were to be further analyzed with EDX for this study. The
soil sample used for study one was a subsurface soil sample (Pedon 3, 65-93 cm) and the soil
sample used for study two was a surface-horizon sample (0-20 cm) of another mine pit
within the Mines of Spain Natural Area. The samples were prepared according to standard
thin section procedures, but they were not covered with cover glasses. The surfaces were
polished on the Ecomet IV Grinder/Polisher. The machine is equipped with a grinding-plate
to which a special fine grinding paper is fixed, and with alumina (0.3^m) slurry, a very fine
polishing is achieved.
The sections were examined in a Hitachi 2460N environmental scanning electron
microscope (ESEM), equipped with an Oxford Instruments energy-dispersive x-ray
spectrometry (EDX) unit. This instrument provides for observation of samples under high
vacuum (5-10 torr) or reduced vacuum (0-2 torr), and the residual atmosphere (He) allows
for observation of nonconductive samples, reducing the amount of specimen preparation
required. Available magnification ranges from 20X to 100,000x, and accelerating voltages of
I - 30 kV are possible with the unit. Suitable operating conditions for the samples were found
to be an accelerating voltage of 25 kV and an electron cunent of 0.1 ^A. This instrument also
provided backscattered electron images. Although quantitative analysis of the EDX results
103
was not a priority at this stage of the research, the manufacturers internal standard (PbF) was
occasionally used to attempt quantitative analysis. In general, two approaches were employed
in applying the SEM/EDX to the analysis of our samples. First, specific features were
selected and described under the light microscope and then examined for their elemental
content at single points, along lines, or over selected areas. Second, concentrations of a
particular element were sought by line scanning of the soil thin section. After the feature was
located, and elemental concentrations and associations were established, the feature can be
taken back to the light microscope for morphological description. The two samples used for
this study were chosen to represent different pedoenvironments (surface and subsurface
horizons). Wet chemical analyses revealed that the samples contained comparable
concentrations of Pb.
RESULTS AND DISCUSSION
Pcdon Properties and Classification
Reference Soil (Pedon 1^
Pedon 1, the reference soil (none-mine soil), was located at a point that was
topographically higher than the mine soils (pedons 2 and 3), and where the site could not
have been affected by either surface or subsurface drainage from the mine soils (Fig. 4.2).
The soil was a moderately well-drained silt loam that had a thin, dark gray A-horizon. The B
horizons contained few fme distinct black mottles (7.5YR 2/0), possibly of Mn oxides, and
very dark grayish brown (lOYR 3/2) to dark brown (lOYR 3/3) coatings of organic matter
and clay (Table 4.2 and Appendix CI).

Table 4.2. Field morphological descriptions of the three pedons.
Structure
Horizon Depth (cm) Color Mottles (Moist)
Boundary Grade Size Shape Texture
Pedon 1 (fine silty, smectitic, niesic Mollic Hapludalf)
A1 0-10 10YR 3/1 cw 2 f gr silt loam A2 10-20 10YR3.5/1 cw 2 m pi silt loam BA 20-43 10YR4/1 10YR3/2 as 2 m sbk silt loam Bt1 43-50 10YR4/3 7.5YR2/0 gs 3 m st)k silt toam Bt2 50-70 10YR4/3 7.5YR2/0 gs 3 m sbk silt k)am Bt3 70-106 10YR4/4 7 5YR2/0 2 m sbk silt team
Pedon 2 (fine loamy, smectitic, mesic Typic Eutrudept)
A 0-18 10YR 3/1 cw 2 m gr silty clay loam Bwl 18-26 10YR5/6 10YR6/8 aw 3 m sbk clay loam 2Ab 26-45 10YR3/2 10YR6/8 gs 3 m sbk clay k)am 2Bw1 45-59 10YR4/4 10YR5/8 cw 3 m sbk clay k>am 2Bw2 59-84 10YR4/4 10YR5/8 3 m sbk k>am
Pedon 3 (fine, smectitic, mesic Mollic Hapludalf)
A 0-10 10YR 3/1 ci 2 f gr clay loam Bwl 10-17 10YR5/4 7.5YR5/8 gs 3 m sbk clay team
Bw2 17-30 10YR4/4 7.5YR4/4 gs 3 m sbk clay k>am 2Bt1 30-49 10YR4/4 7.5YR5/6 gs 3 m sbk clay 2Bt2 49-65 10YR5/6 7 5YR5/8 cw 3 m sbk clay 2Bt3 65-93 10YR5/6 10YR5/3 2 m sbk clay

105
Particle size distributions of the horizons of the pedon (680-760 g silt kg'' soil)
suggests that the soil developed in the loess that covered the sedimentary bedrock of the area
(Table 4.3). Clay content in the surface horizon (150 g kg ' soil) increased with soil depth to
the base of the profile pit (240 g kg''). Micromorphological studies conducted on thin
sections of undisturbed soil samples revealed the presence of abundant clay coatings of pores
in the Bt horizons of the pedon (Fig. 4.3a and 4.3b). (See Appendix C4 for
micromorphological description). The presence of cutans indicates clay translocation within
the soil profile. This, together with increase in clay content of the B horizons relative to the
overlying eluvial horizon, qualifies pedon 1 to have an argillic horizon (Soil Survey Staff,
1998).
The soil contained high amounts of total C in the topsoil that decreased with depth
(Table 4.3). Base saturation was greater than 78% in all horizons. CEC (by summation),
which ranged from 6.5-16.0 cmol (+) kg'' soil, was dominated by exchangeable Ca and Mg
(Table 4.4). The soil was moderately to very strongly acid. Exchangeable acidity was low
near the soil surface, but increased with soil depth to a maximum at the base of the profile
pit.
The XRD patterns for the <2 ^m clay fraction of the horizons of the reference soil
consisted of peaks for smectite, vermiculite, mica, kaolinite, and quartz (Fig. 4.4a). XRD
patterns of the fine sand fraction for selected horizons in pedon 1 included peaks for quartz
and feldspars (Fig. 4.4b). Peaks at 3.20, 3.17 and 4.01 A indicate that plagioclase feldspar
may be present as albite. Decreases in XRD peak intensities with depth in the soil profiles
suggest that weathering may have been more intense deeper in the profile.
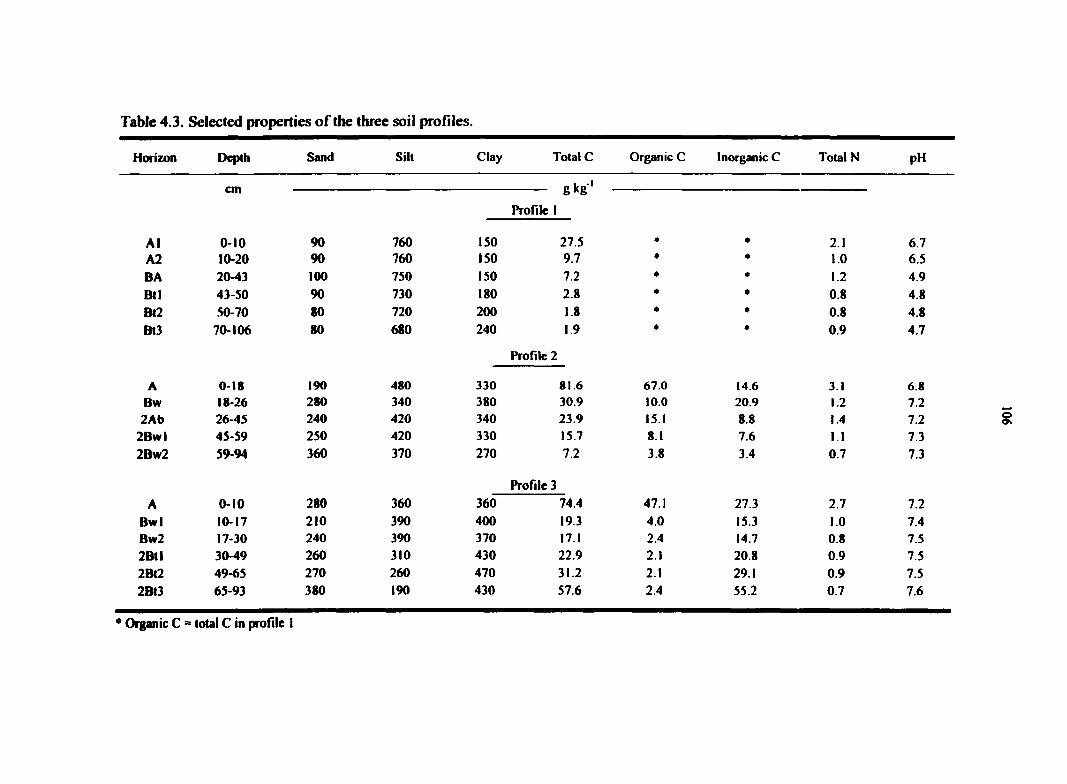
Table 4.3. Selected properties of the three soil profiles.
Horizon DqMh Sand Sill Clay Total C Organic C Inorganic C Total N pH
cm cm & ^6
Profile 1
A1 0-10 90 760 150 27.5 * • 2.1 6.7 A2 10-20 90 760 150 9.7 • • 1.0 6.5 BA 20-43 100 750 150 7.2 * • 1.2 4.9 Btl 43-50 90 730 180 2.8 * • 0.8 4.8 Bt2 .SO-70 80 720 200 1.8 * * 0.8 4.8 Bt3 70-106 80 680 240 1.9 * • 0.9 4.7
Profile 2
A 0-18 190 480 330 81.6 67.0 14.6 3.1 6.8 Bw 18-26 280 340 380 30.9 10.0 20.9 1.2 7.2 2Ab 26-45 240 420 340 23.9 15.1 8.8 1.4 7.2
2Bwl 45-59 250 420 330 15.7 8.1 7.6 1.1 7.3 2Bw2 59-94 360 370 270 7.2 3.8 3.4 0.7 7.3
Profile 3
A 0-10 280 360 360 74.4 47.1 27.3 2.7 7.2 Bwl 10-17 210 390 400 193 4.0 15.3 1.0 7.4 Bw2 17-30 240 390 370 17.1 2.4 14.7 0.8 7.5 2Btl 30-49 260 310 430 22.9 2.1 20.8 0.9 7.5 2Bt2 49-65 270 260 470 31.2 2.1 29.1 0.9 7.5 2Bt3 65-93 380 190 430 57.6 2.4 55.2 0.7 7.6
* Organic C = total C in profile I

107
Fig. 4.3(a). Clay coating of pore (Pedon 1, Al, 0-10 cm). PPL
Fig. 4 J(b). Same micrograph at above. XPL
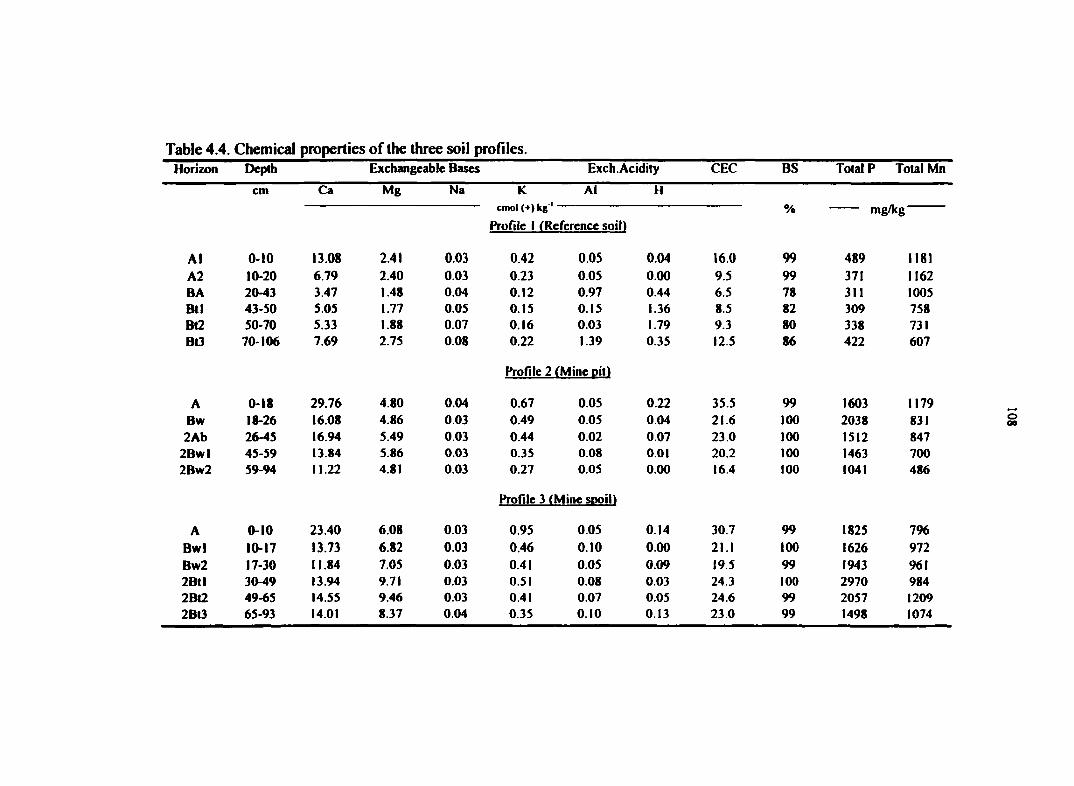
Table 4.4. Chemical properties of the three soil profiles. Horizon Depth Exchangeable Bases Exch.Acidity CEC as Total P Total Mn
cm Ca Mg Na K Al H % cmol (+) kg' % l»g/Kg
Profile 1 ^Reference soil)
Al 0-10 13.08 2.41 0.03 0.42 0.05 0.04 16.0 99 489 1181 A2 10-20 6.79 2.40 0.03 0.23 0.05 0.00 9.5 99 371 1162 BA 20-43 3.47 1.48 0.04 0.12 0.97 0.44 6.5 78 311 1005 Btl 43-50 5.05 1.77 0.05 0.15 0.15 1.36 8.5 82 309 758 Bl2 50-70 5.33 1.88 0.07 0.16 0.03 1.79 9.3 80 338 731 Bt3 70-106 7.69 2.75 0.08 0.22 1.39 0.35 12.5 86 422 607
Profile 2 fMine oil)
A 0-18 29.76 4.80 0.04 0.67 0.05 0.22 35.5 99 1603 1179 Bw 18-26 16.08 4.86 0.03 0.49 0.05 0.04 21.6 100 2038 831 2Ab 26-45 16.94 5.49 0.03 0.44 0.02 0.07 23.0 100 1512 847
2Bwl 45-59 13.84 5.86 0.03 0.35 0.08 0.01 20.2 100 1463 700 2Bw2 59-94 11.22 4.81 0.03 0.27 0.05 0.00 16.4 100 1041 486
Proflle 3 (Mine SDoih
A 0-10 23.40 6.08 0.03 0.95 0.05 0.14 30.7 99 1825 796 Bwl 10-17 13.73 6.82 0.03 0.46 0.10 0.00 21.1 100 1626 972 Bw2 17-30 11.84 7.05 0.03 0.41 0.05 0.09 19.5 99 1943 961 2BII 30-49 13.94 9.71 0.03 0.51 0.08 0.03 24.3 100 2970 984 2Bt2 49-65 14.55 9.46 0.03 0.41 0.07 0.05 24.6 99 2057 1209 2BI3 65-93 14.01 8.37 0.04 0.35 0.10 0.13 23.0 99 1498 1074

109
Site#1 0-10 cm
43-60 cm
70-106 cm
Site #2
26'46cm
69-94 cm
Site #3 0-10 cm
36-49 cm
66-93 cm
14 18 22 Degrees 26
Fig.4. 4a. XRD panems for the Mg-saturated, giycerol-solvated clay fraction of selected horizons from the three soil profiles.
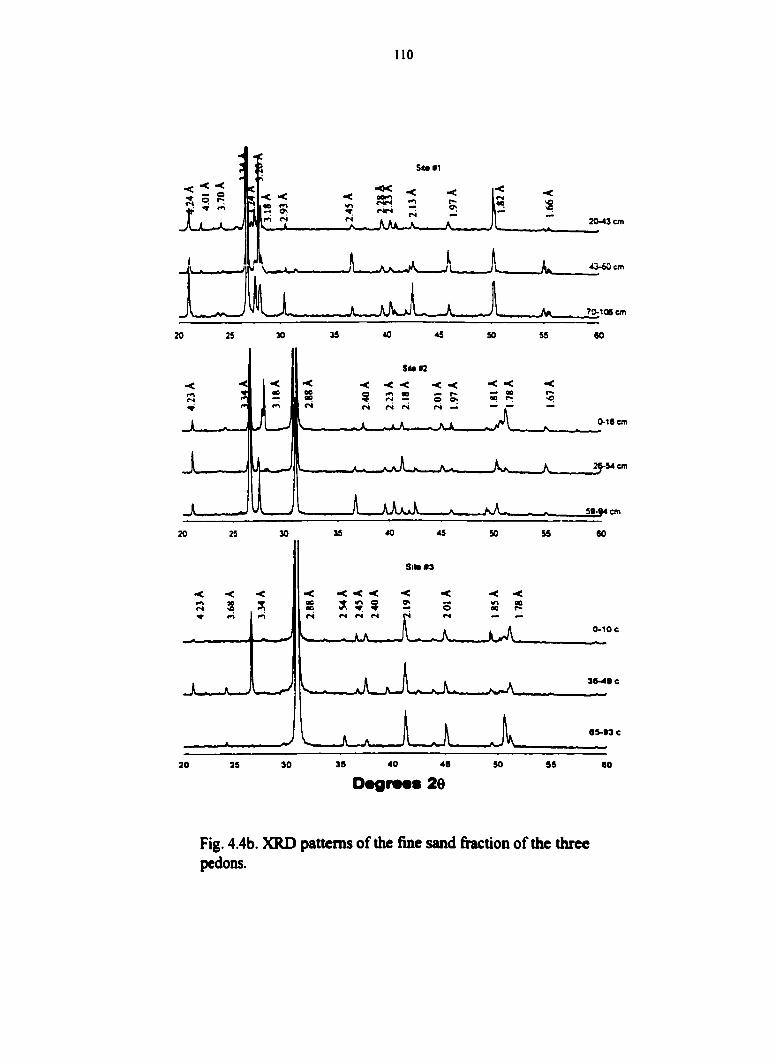
110
X 25 30
SM *1
M*—A_
35 40 SO 55
20-43 cm
43^ cm
M 70-106 cm
60
JL
X
SMI2
< ae
•< 00
£1: Jl
< 9
-< < m «e fM —
< -< — r* O 9"
< •< — 00 00
•< r-*
(S
X.
<N (N
. -A.
A-
A A A x t K » v A -
0-18 cm
26-54 011
59-94 cm
20 25 30 35 40 45 SO 60
< IS
•< •< •<
s 7: «s <s
-< < <
<N <S «
^ , A
-JL_A—
SlMM
< < -< •<
o w-k ae 00 r*o
L.
<N
xJl 0-10 e
Jl ft_ -1—/A_aX.
36-49 c
e5-93c
20 25 30 3S 40 46
••grMS 20
50 55 60
Fig. 4.4b. XRD patterns of the fine sand fraction of the three pedons.

I l l
Mean annual soil temperamre in the Dubuque area is 12°C OSU Weather Station,
1999), indicating a mesic soil temperature regime (Soil Survey Staff, 1998). On the basis of
regional climatic data, the soils are assumed to have an udic soil moisture regime. These
characteristics have been used to classify pedon 1 at the family level of Soil Taxonomy as
fine-silty, smectitic. mesic Mollic Hapludalf.
Although we did not encounter a paleosol within the 106 cm of loess in pedon 1,
investigations at nearby sites on the hillslope suggested that the loess buried a pre-
Wisconsinan soil that had developed in residuum of the underlying sedimentary bedrock. The
buried soil was similar to but probably thicker than Nordness silt loam (a loamy, mixed,
mesic lithic Hapludalf), with a high-clay B horizon (e.g., 35-40% clay) (Boeckman, 1985).
Mine Pit fl*edon 2)
Pedon 2 was located in a mine pit, and the microtopography makes it a depositional
environment (Fig. 4.2). Compared with the reference soil, the texture of the mine pit soil
suggests a different parent material. The high clay content (270-330 g kg"' soil) of the soil
indicates that it might have formed in materials that were excavated from the
paleosol/residuum. But the moderate amounts of silt (340-480 g kg'' soil) suggests that
materials from the slope above the pit may have washed into the pit as well, and the washed-
in materials were mixed with the excavated materials.
The subsurface horizons of the mine pit soil (pedon 2) contained brighter mottles
(lOYR 5/8-6/8) than pedon 1 (Table 4.2). These mottles are redoximorphic features
associated with short-duration saturation.

112
The total C, the organic C, and the inorganic C (difference between total and organic
C) contents of the pedon were highest at the soil surface, and they decreased with depth.
Similar to pedon 1, the CEC was dominated by exchangeable Ca and Mg. The high base
saturation (~ 100%), high pH, and high inorganic C of pedon 2 (Table 4.3) are consistent
with parent materials derived from excavated dolomite-rich shale.
Cycles of deposition of materials in the topographic position of pedon 2 might have
prevented clay movement within the profile, which requires enough time, a stable
environment as well as the right climatic conditions for clay dispersion, translocation, and
redeposition to occur. Consequently, the clay content (330-380 g kg ') increase with soil
depth was not sufficient for the B horizon to be considered an argillic horizon. Lack of a
sufficient increase in clay content with soil depth, absence of clay coatings on thin sections
from the profile, and evidence of soil structure development qualifies the soil to be
considered a cambic B horizon.
The mineralogy of the <2 ^m clay fraction of the mine pit soil profiles is similar to
that of the reference soil. The XRD patterns for the fine sand fraction of both surface and
subsurface horizons included peaks for quartz and feldspars. Peaks at 3.20, 3.17 and 4.01 A
indicate that plagioclase feldspar may be present as albite. Dolomite, as indicated by very
strong peaks at 2.88, 2.19, 2.01, and 1.78 A dominated the sand fraction mineralogy of all
horizons of the mine pit soil. In addition, quartz and feldspar were present. These
characteristics of pedon 2 and the climatic information described earlier lead to the
classification of pedon 2 as a fine-loamy, smectitic, mesic Typic Eutrudept.
113
Mine Spoil (Pcdon 3)
Pedon 3 was located in mine spoil (Fig. 4.2), and the soil profile developed in
materials that were excavated from the dolomite-rich shale in which the MVT ore deposits
occurred. Excavation of materials below the residuum brought dolomite to the soil surface at
the mine spoil site and led to the high pH and CEC compared to the reference soil. For the
same reason, the concentrations of the most prevalent exchangeable cations (Ca and Mg)
were much higher in the mine spoil soil (Table 4.3 and 4.4).
The clay content of the horizons, which ranged from 360 to 470 g kg ', generally
increased with soil depth. Micromorphological studies conducted on thin sections of the Bt
horizon of pedon 3 revealed that embedded clay bodies as well as thick clay cutans around
pores and grains (Fig. 4.S) (See appendix C3 for micromorphological description). The
irregular increase in clay with depth in the spoil probably does not reflect pedogenic
processes but the way the spoil was piled when excavated. Still in material 2, beginning at a
depth of 30 cm, there was evidence for illuvial clay coatings. Thus an argillic horizon was
identified in this pedon.
The XRD pattern for the <2 ^im clay fraction of the mine spoil soil profile consisted
of peaks for smectite, vermiculite, mica, kaolinite, and quartz (Fig. 4.4a and 4.4 b). But the
XRD pattern for the fine sand fraction mineralogy of all horizons of the mine spoil soil
profile was dominated by dolomite, as indicated by very strong peaks at 2.88, 2.19,2.01. and
1.78 A. Quartz, feldspar, and possibly maghemite were also present, but maghemite was
present in small concentrations as shown by a peak at 2.S3 A at 65-93 cm. Based on the
characteristics of the soil, the soil was classified as fine, smectitic, mesic Mollic Hapludalf.
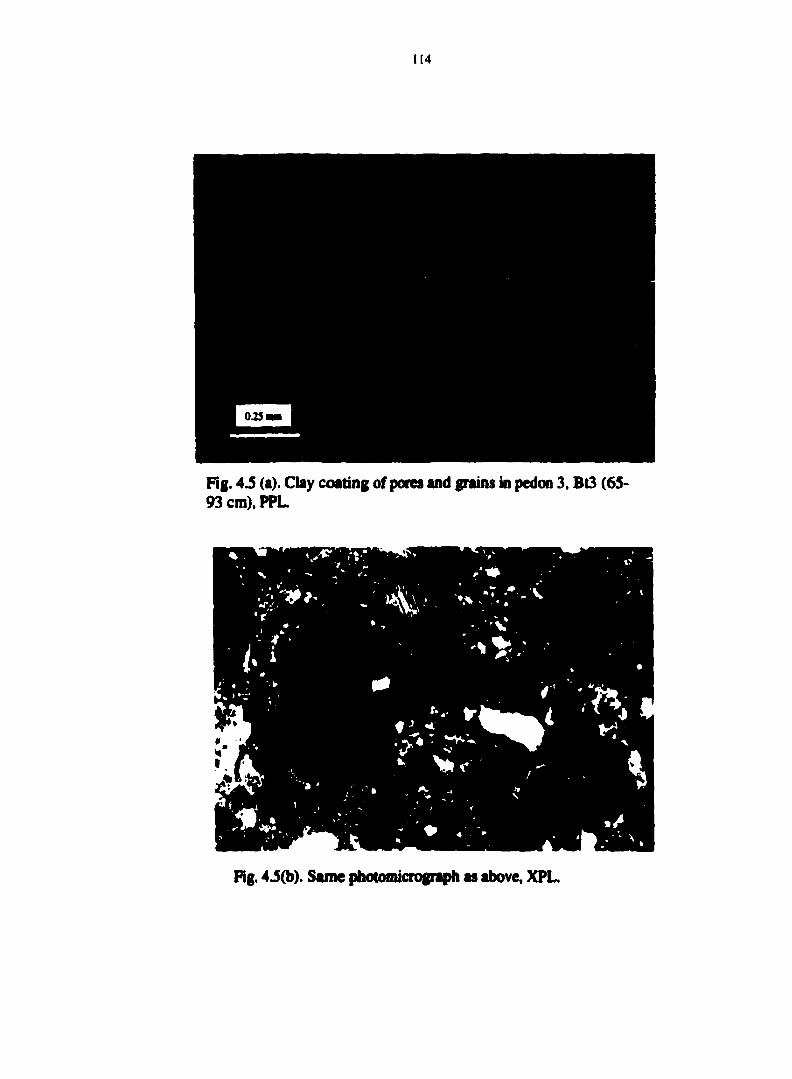
114
Rg. 4.5 (a). Clay coating of pores and grains in pedon 3, Bt3 (65-93 cm), PPL
Rg. 4 J(b). Same plioioniicrognq>h as above, XPL
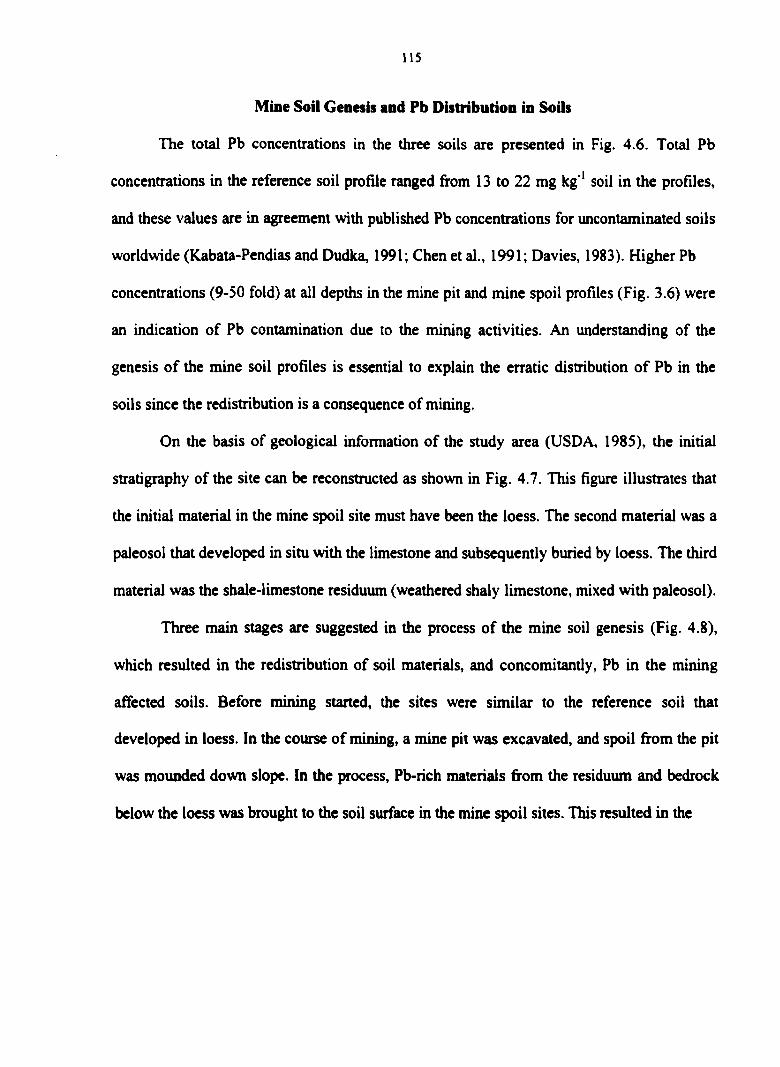
115
Mine Soil Genesis and Pb Distribution in Soils
The total Pb concentrations in the three soils are presented in Fig. 4.6. Total Pb
concentrations in the reference soil profile ranged from 13 to 22 mg kg ' soil in the profiles,
and these values are in agreement with published Pb concentrations for uncontaminated soils
worldwide (Kabata-Pendias and Dudka, 1991; Chen et al., 1991; Davies, 1983). Higher Pb
concentrations (9-50 fold) at all depths in the mine pit and mine spoil profiles (Fig. 3.6) were
an indication of Pb contamination due to the mining activities. An understanding of the
genesis of the mine soil profiles is essential to explain the erratic distribution of Pb in the
soils since the redistribution is a consequence of mining.
On the basis of geological information of the study area (USDA, 1985), the initial
stratigraphy of the site can be reconstructed as shown in Fig. 4.7. This figure illustrates that
the initial material in the mine spoil site must have been the loess. The second material was a
paleosol that developed in situ with the limestone and subsequently buried by loess. The third
material was the shale-limestone residuum (weathered shaly limestone, mixed with paleosol).
Three main stages are suggested in the process of the mine soil genesis (Fig. 4.8),
which resulted in the redistribution of soil materials, and concomitantly, Pb in the mining
affected soils. Before mining started, the sites were similar to the reference soil that
developed in loess. In the course of mining, a mine pit was excavated, and spoil from the pit
was mounded down slope. In the process, Pb-rich materials from the residuum and bedrock
below the loess was brought to the soil surface in the mine spoil sites. This resulted in the
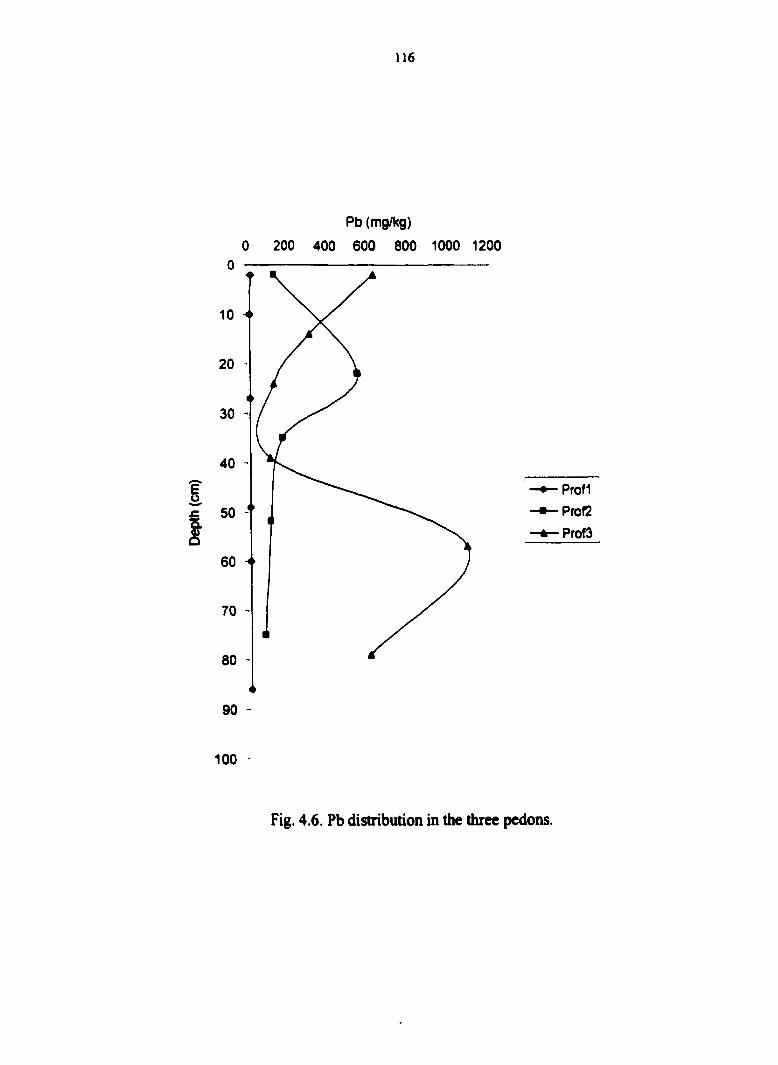
1)6
Pb (mg/kg)
0 200 400 600 800 1000 1200
60
Prof1
Prof2
•Prof3
90
100
Fig. 4.6. Pb distribution in the three pedons.
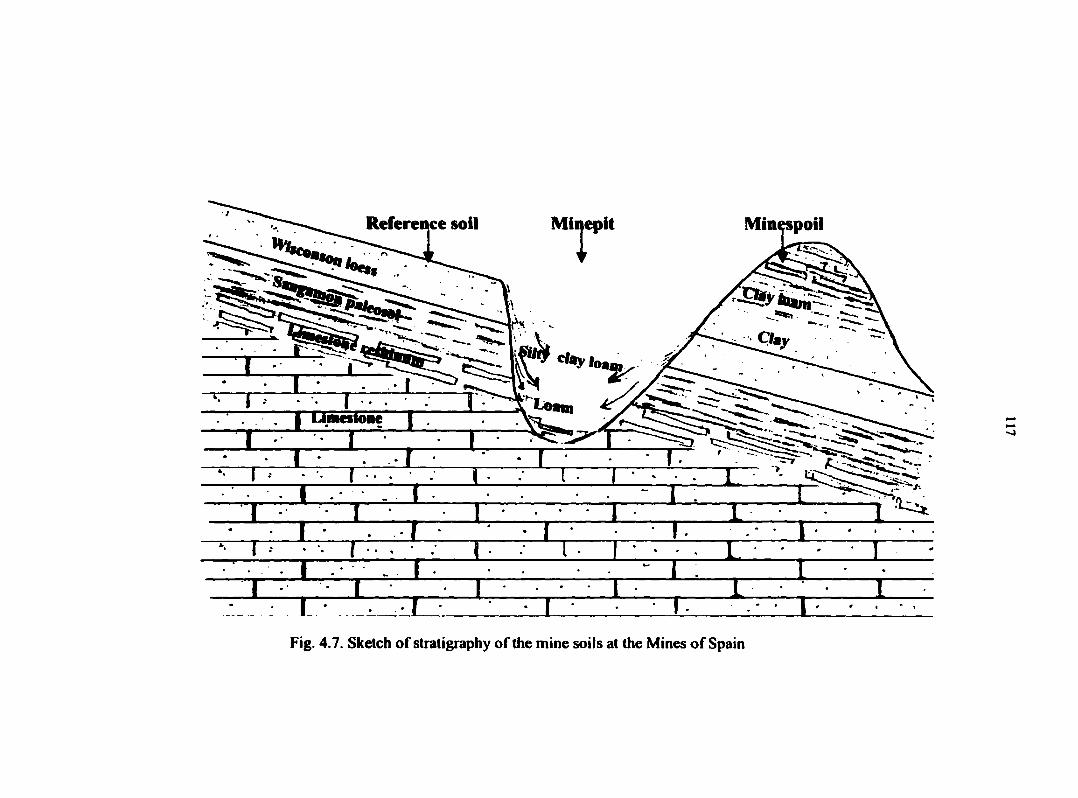
Reference soil
I UWCrtOBC I
Fig. 4.7. Sketch of stratigraphy of the mine soils at the Mines of Spain
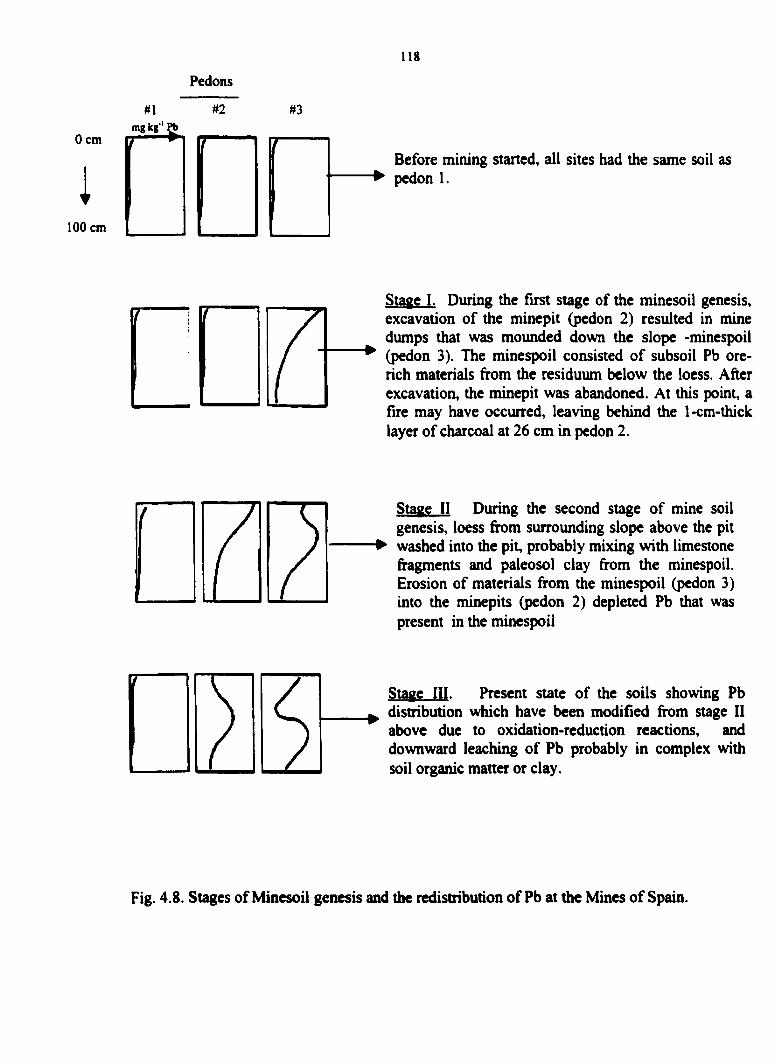
118
Pedons
mg kg ' Jb 0 cm li ^
i 100 cm
Before mining started, all sites had the same soil as ^ pedon 1.
Stage I. During the first stage of the minesoil genesis, excavation of the minepit (pedon 2) resulted in mine dumps that was mounded down the slope -minespoil (pedon 3). The minespoil consisted of subsoil Pb ore-rich materials from the residuum below the loess. After excavation, the minepit was abandoned. At this point, a fire may have occurred, leaving behind the 1-cm-thick layer of charcoal at 26 cm in pedon 2.
) V
Stage II During the second stage of mine soil genesis, loess from surrounding slope above the pit washed into the pit, probably mixing with limestone fragments and paleosol clay from the minespoil. Erosion of materials from the minespoil (pedon 3) into the minepits (pedon 2) depleted Pb that was present in the minespoil
Stage III. Present state of the soils showing Pb distribution which have been modified from stage II above due to oxidation-reduction reactions, and downward leaching of Pb probably in complex with soil organic matter or clay.
Fig. 4.8. Stages of Minesoil genesis and the redistribution of Pb at the Mines of Spain.
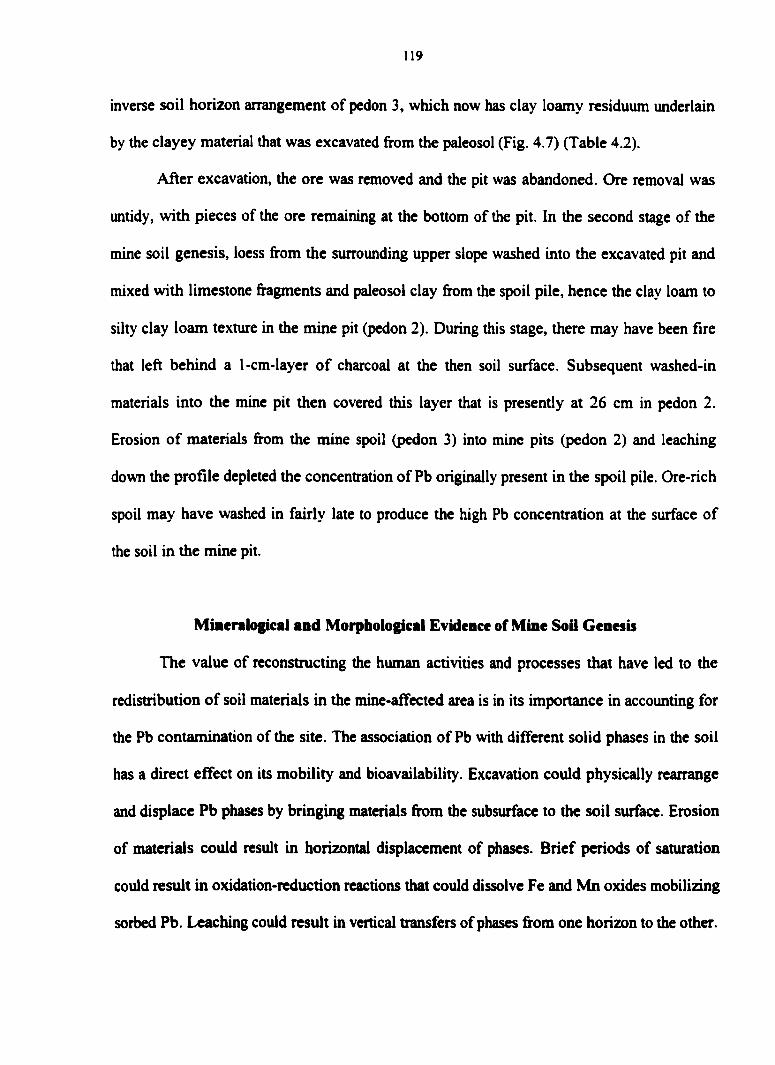
119
inverse soil horizon arrangement of pedon 3, which now has clay loamy residuum underlain
by the clayey material that was excavated from the paleosol (Fig. 4.7) (Table 4.2).
After excavation, the ore was removed and the pit was abandoned. Ore removal was
untidy, with pieces of the ore remaining at the bottom of the pit. In the second stage of the
mine soil genesis, loess from the surrounding upper slope washed into the excavated pit and
mixed with limestone fragments and paleosol clay from the spoil pile, hence the clay loam to
silty clay loam texture in the mine pit (pedon 2). During this stage, there may have been fire
that left behind a 1-cm-layer of charcoal at the then soil surface. Subsequent washed-in
materials into the mine pit then covered this layer that is presently at 26 cm in pedon 2.
Erosion of materials from the mine spoil (pedon 3) into mine pits (pedon 2) and leaching
down the profile depleted the concentration of Pb originally present in the spoil pile. Ore-rich
spoil may have washed in fairly late to produce the high Pb concentration at the surface of
the soil in the mine pit.
Mincralogical and Morphological Evidence of Mine Soil Genesis
The value of reconstructing the human activities and processes that have led to the
redistribution of soil materials in the mine-affected area is in its importance in accounting for
the Pb contamination of the site. The association of Pb with different solid phases in the soil
has a direct effect on its mobility and bioavailability. Excavation could physically rearrange
and displace Pb phases by bringing materials from the subsurface to the soil surface. Erosion
of materials could result in horizontal displacement of phases. Brief periods of saturation
could result in oxidation-reduction reactions that could dissolve Fe and Mn oxides mobilizing
sorbed Pb. Leaching could result in vertical transfers of phases from one horizon to the other.
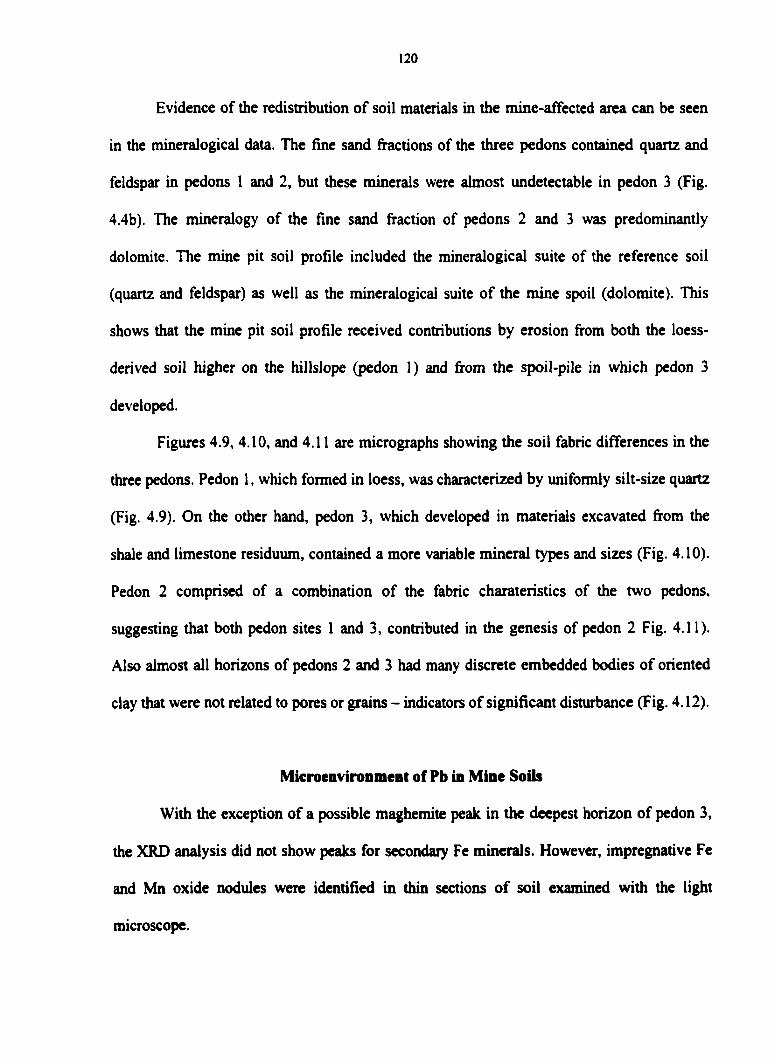
120
Evidence of the redistribution of soil materials in the mine-affected area can be seen
in the mineralogical data. The fine sand fractions of the three pedons contained quartz and
feldspar in pedons 1 and 2, but these minerals were almost undetectable in pedon 3 (Fig.
4.4b). The mineralogy of the fine sand fraction of pedons 2 and 3 was predominantly
dolomite. The mine pit soil profile included the mineralogical suite of the reference soil
(quartz and feldspar) as well as the mineralogical suite of the mine spoil (dolomite). This
shows that the mine pit soil profile received contributions by erosion from both the loess-
derived soil higher on the hillslope (pedon 1) and from the spoil-pile in which pedon 3
developed.
Figures 4.9, 4.10, and 4.11 are micrographs showing the soil fabric differences in the
three pedons. Pedon 1, which formed in loess, was characterized by uniformly silt-size quartz
(Fig. 4.9). On the other hand, pedon 3, which developed in materials excavated from the
shale and limestone residuum, contained a more variable mineral types and sizes (Fig. 4.10).
Pedon 2 comprised of a combination of the fabric charateristics of the two pedons,
suggesting that both pedon sites 1 and 3, contributed in the genesis of pedon 2 Fig. 4.11).
Also almost all horizons of pedons 2 and 3 had many discrete embedded bodies of oriented
clay that were not related to pores or grains - indicators of significant disturbance (Fig. 4.12).
Microcnvironmcnt of Pb in Mine Soib
With the exception of a possible maghemite peak in the deepest horizon of pedon 3,
the XRD analysis did not show peaks for secondary Fe minerals. However, impregnative Fe
and Mn oxide nodules were identified in thin sections of soil examined with the light
microscope.

Fig. 4.9. Fabric of pedon I showing unifonnly silt-size quartz mineralogy, (a) vughy microstructure of the A1 horizon (0-10 cm), PPL; (b) same as (a); XPL; (c) subangular blocky microstructure of the Bt horizon (70-106 cm), PPL; (d) same as (c), XPL.
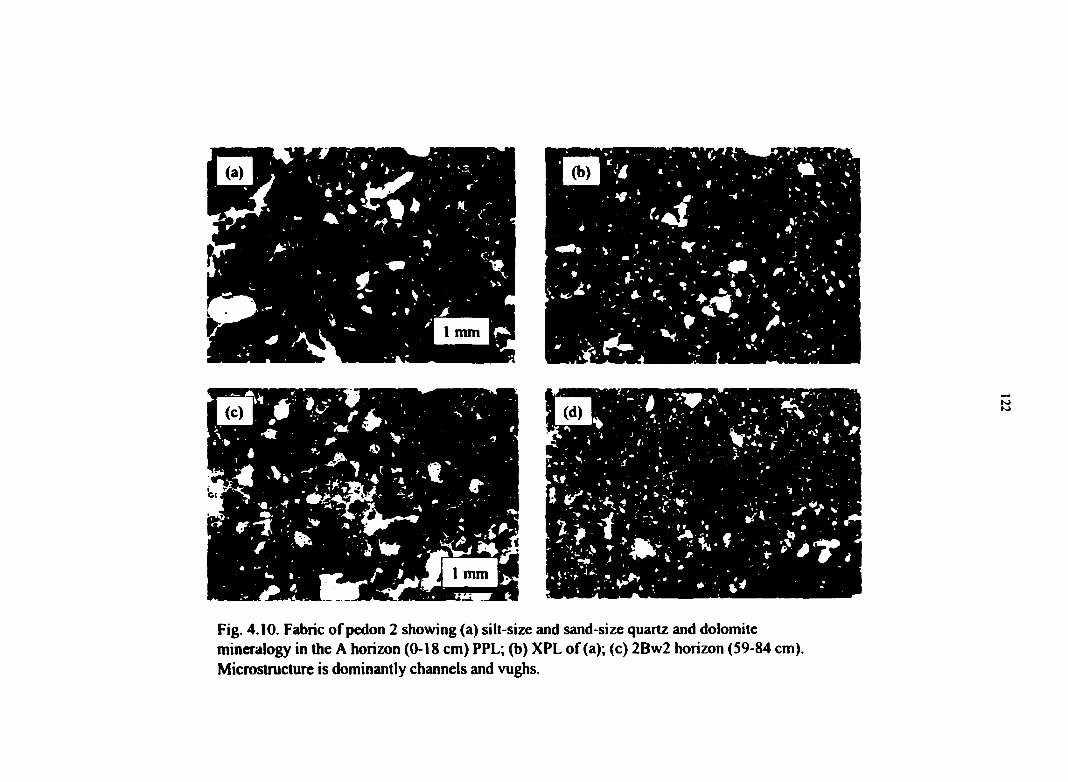
Fig. 4.10. Fabric of pedon 2 showing (a) silt-size and sand-size quartz and dolomite mineralogy in the A horizon (0-18 cm) PPL; (b) XPL of (a); (c) 2Bw2 horizon (59-84 cm). Microstructure is dominantly channels and vughs.
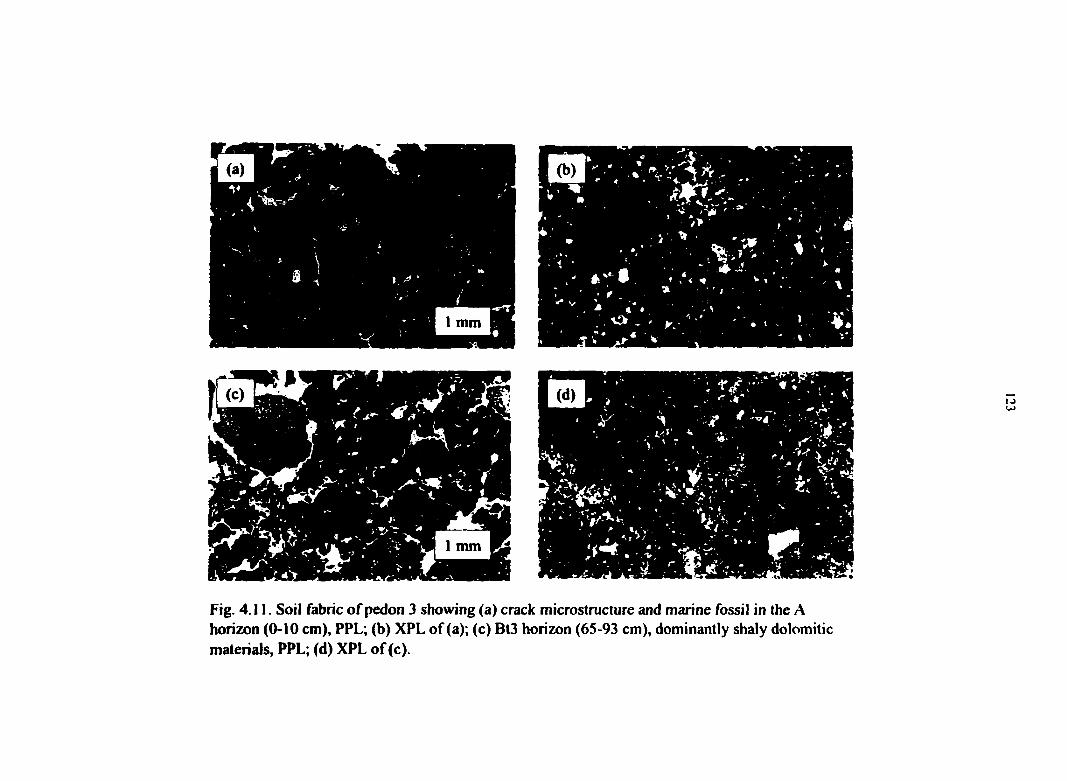
Fig. 4.11. Soil fabric of pedon 3 showing (a) crack microstructure and marine fossil in the A hori2X)n (0-10 cm), PPL; (b) XPL of (a); (c) Bt3 horizon (65-93 cm), dominantly shaly dolomitic materials, PPL; (d) XPL of (c).
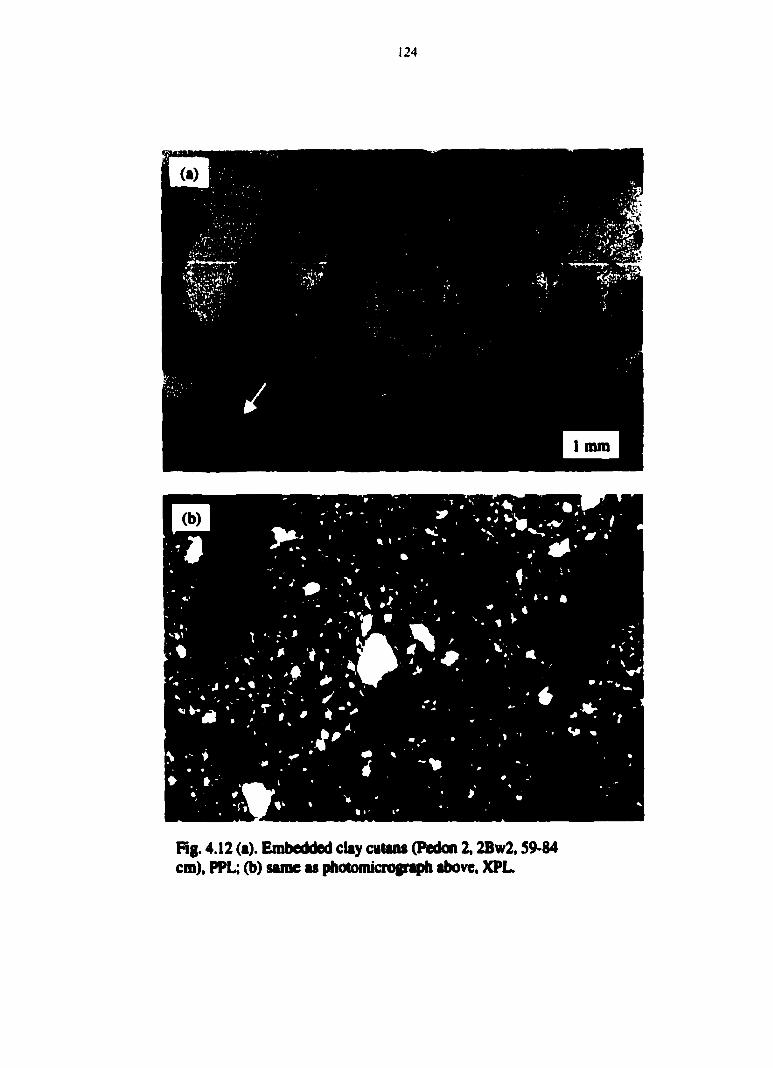
124
Fig. 4.12 (a). Embedded clay cutans (Pedon 2,2Bw2,59-84 cm), PPL; (b) same as photomicrograph above, XPL

125
This suggests that the Fe and Mn oxides were not well crystallized and that other minerals
were present in much higher concentrations. Sequential chemical fractionation of Pb in
selected horizons of the three soil profiles is presented in Fig. 4.13 as percentages of the total
Pb. Pb did not exist in the exchangeable fraction (<1%) in the soils, but it was largely held in
nonexchangeable forms (residual, oxide, and organically bound). Most of the Pb in the
reference soil (>50%) occurred in the residual flection. For the remaining portion, Fe and Mn
oxides had a dominant role in the retention of Pb in the soil surface horizons (Figs. 4.13a and
4.13b). Compared to the reference soil, the mine soil profiles (pedons 2 and 3) had a higher
percentage of total Pb in the H202-extractable fraction, especially in the A horizons with
higher organic matter content. Pb associated with the organic fraction of these soils would be
consistent with the high stability constant of Pb with humic acid (log K = 6.13; Schnitzer and
Khan, 1972) and with the tendency of Pb to precipitate fiilvic acids (Saar and Weber, 1980).
The oxide-bound Pb fraction decreased with depth, suggesting different pedoenvironments
(structure, drainage, Hh, pH) in the surface and subsurface horizons. Short periods of low
redox potential in the A horizons may have resulted in translocation of Fe and the
precipitation of Fe oxides in the surface horizons rather significant amounts of Fe oxides in
the surface horizons. Pb released by weathering and by mining activites may have
coprecipitated with the Fe oxides, accounting for the large partitioning. These results should
be considered tentative because of problems associated with metal fractionation schemes,
such as readsorption of the metals, possible precipitation of new solid phases during
extraction, and other problems of reagent specificity. However, the results, even with the
limitations of the method, illustrate that Pb in the studied soils is associated with Fe and Mn
oxides and soil organic matter and is not readily exchangeable.
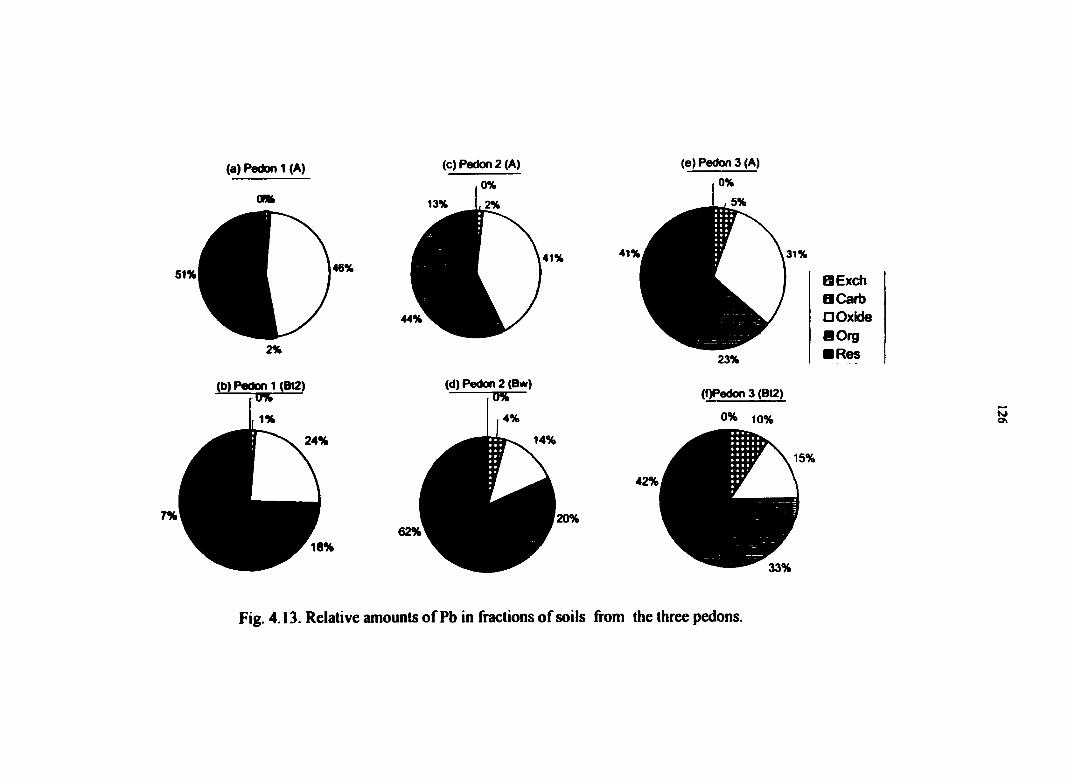
(a) Pedon 1 (A)
CM
51% 46%
2%
(b) Pedon 1 (Bt2)
1%
24%
7%\
18%
(c) Pedon 2 (A) (e) Pedon 3 (A)
44%
41%
(d) Pedon 2 {Bw) 0%
, 4%
62%
41% 31%
23%
(QPedon 3 (Bt2)
0% 10%
QExch BCarb •Oxide •Org • Res
42%
20%
15%
33%
Fig. 4.13. Relative amounts of Pb in fractions of soils from the three pedons.
127
Two separate studies were carried out to characterize further the nature of the association of
Pb with soil components in the mine-related soil. The case studies employed scanning
electron microscopy (SEM) and energy dispersive X-ray spectrometry (EDX) and are briefly
described below.
Study One (Subsurface Soil)
This study was conducted with soil samples from the BC horizon of pedon 3 (65-93
cm). On examination of the soil thin sections under the light microscope, specific soil
features such as Fe and Mn oxides, clay minerals and primary mineral grains, were selected.
The selected features were then identified on the polished blocks and taken to a scanning
electron microscope equipped with an energy-dispersive x-ray system for microanalysis. The
first results of the microanalysis did not indicate high concentrations of Pb in the selected
features. For a broader overview of the distribution of Pb in the thin section, the specimen
stage of the SEM was moved automatically under a stationary beam to identify
concentrations of at least Pb, S, P among other elements. By focusing on S and P in
determining the microenvironment of Pb, we hypothesized that some residual Pb in the mine
soils might still exist in its primary form, galena (PbS). Pb could also have occurred in
secondary minerals such as PbS04 (anglesite), PbCOj (cerrusite), or Pb(P04)2
(pyromorphite). A total of 16 spots across the entire polished block were probed and both a
back-scattered electron image (BSEI) and energy dispersive x-ray (EDX) elemental maps
were produced for each spot. Figures 4.14-4.17. show the occurrence of an Fe oxide nodule
(Fig. 4.14), a Mn oxide nodule (Fig. 4.15), dolomite grains (Fig. 4.16), and very small

Fig 4.14. (a) Backscattered electron image of a soil thin section showing Fe oxide nodule embedded in a clay matrix (Pedon 3,65-93 cm), (b) - (p) Elemental maps of the image indicating abundance of C, O, Na, Mg, Al, Si, P, Pb, CI, K, Ca, Ti, Mn, Fe, Zn..
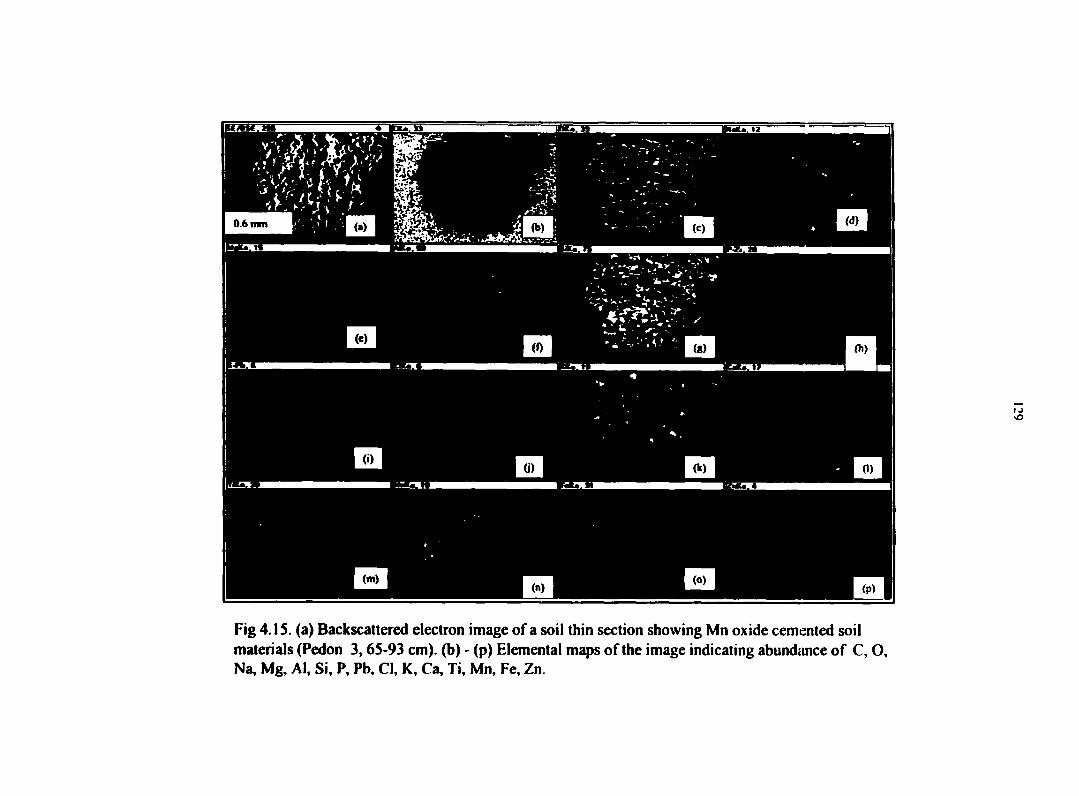
Fig 4.15. (a) Backscattered electron image of a soil thin section showing Mn oxide cemented soil materials (Pedon 3,65-93 cm), (b) - (p) Elemental maps of the image indicating abundiince of C, O, Na, Mg, Al, Si, P, Pb, CJ, K, Ca, Ti, Mn, Fe, Zn.
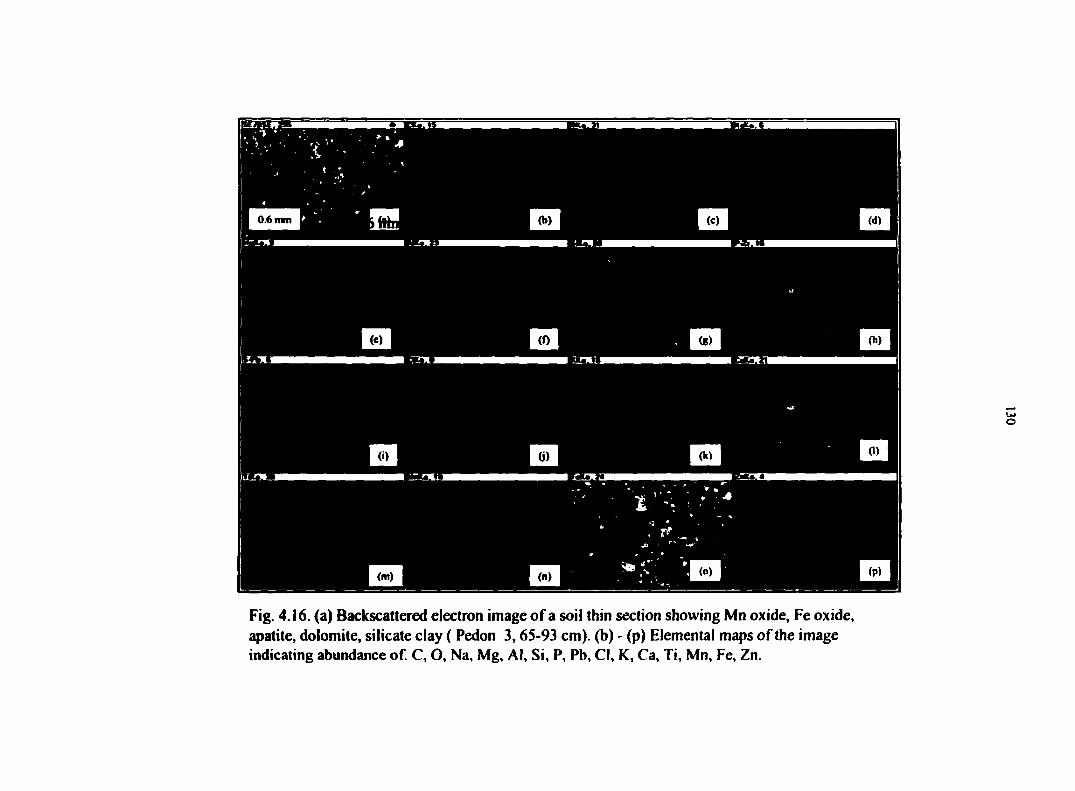
Fig. 4.16. (a) Backscattered electron image of a soil thin section showing Mn oxide, Fe oxide, apatite, dolomite, silicate clay ( Pedon 3,65-93 cm), (b) - (p) Elemental maps of the image indicating abundance of. C, O, Na, Mg, AI, Si, P, Pb, CI, K, Ca, Ti, Mn, Fe, Zn.
131
particles of apatite (Cas (PO4) 2) or hydroxyapatite (Caio(P04)6(OH)2) (Fig. 4.17). Lead was
barely detectable in the Fe oxide nodules (Figs. 4.14 and 4.15) and not detectable in the other
pedological features (Figs. 4.16 and 4.17).
Results of the wet chemical analysis of bulk samples revealed that the sample had a
total Pb content of 477 mg kg'' (--0.5% Pb), which is the value for the lower level of
detection of the instrument. However, sequential extraction of samples from that horizon
(Fig. 4.13) indicated that only 15% of the total Pb existed in the oxide fiction. Thus 85% of
the Pb was either in the residual fraction, organically bound fraction, or carbonate-bound
fraction. Although the total concentration of Pb in this horizon is well is well above that of
the control soil, there were no indications of discrete sulfide, sulfate, or phosphate mineral
segregations or grain-surface enrichments, as such concentrations would have been
immediately apparent. Although total Pb is high in the mine spoil, it appears to be uniformly
dispersed across the soil fabric at concentrations too low to be discerned by EDX. As will be
seen in the next study, similar or lower concentrations of Pb that are segregated in some
fashion are able to be detected by SEM-EDX and are therefore suitable for
microenvironment analysis.
Study Two (Surface Soil)
This study was conducted with samples collected from the soil surface horizon (0-20
cm) of another mine pit within the Mines of Spain Natural Area. Using the same strategy as
applied in study one (identification of pedological features with light microscopy),
pedological features such as Fe and Mn oxides, clay minerals and primary mineral grains
(Fig. 4.18) were selected in thin sections of the soils and taken to the SEM/EDX for
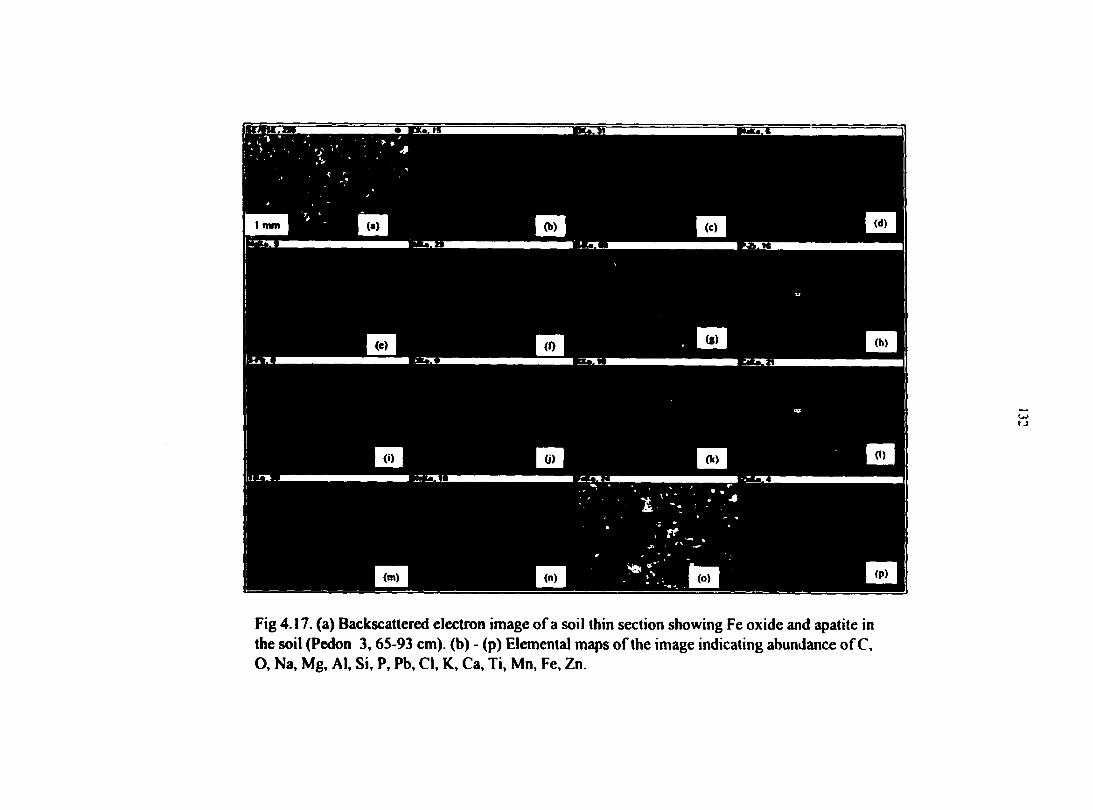
IKiWI.aj'' • MliU.H BiU.ih IF- t * —
Fig 4.17. (a) Backscattered electron image of a soil thin section showing Fe oxide and apatite in the soil (Pedon 3,65-93 cm), (b) - (p) Elemental maps of the image indicating abundance of C, O, Na, Mg, Al, Si, P, Pb, CI, K, Ca, Ti, Mn, Fe, Zn.

Hg. 4.18. light petrognphic miciograph of tlun section of soil showing (a) Fe oxide nodule (b) soil groundmass (c) soil pore sfMce, (d) quartz grain, (e) soil organic matter in soil surface san^>le.
134
microanalysis. By using EDX and scaiming the specimen, a distribution map of Pb in the
sample was produced. The elemental maps for Pb in the specimen and tlieir corresponding
SEM-backscattered images are presented in Figs. 4.19-4.21. Figure 4.19a is a backscattered
electron image showing the spatial arrangement of features such as Fe oxide nodules, quartz
grains, and soil pore spaces. Figure 4.19b is an elemental map indicating abundance of the
individual elements in the section. Comparison of Pb x-ray maps and the backscattered
electron image show at least three things: (1) Pb was localized in the region of an Fe oxide
nodule. (2) Within the nodule, there was a homogenous distribution of Pb. (3) There was a
closer association of Pb with Fe than with Mn or P.
Figure 4.20 is a backscattered electron image and elemental map of a thin section
showing the distribution of quartz, feldspar, Zr, Fe oxide, and dolomite grains in the soil. Pb
is clearly localized in the region of the Fe oxide nodule. However, a low signal: noise ratio is
apparent in the element dot maps. The scattered signals observed around the Fe oxide nodule
in the Pb map are not due to Pb, but represent the background (continuum) x-rays of the
system (Panessa-Warren, 1978).
Figure 4.21 is a backscattered electron image and elemental map of another thin
section showing the distribution of dolomite grains, clay minerals, possibly mica and
feldspar, and a large nodule of Fe oxide. These results all indicate a preferential association
of Pb with Fe oxide compared to the matrix or to other pedological features in the soil. But
the absence of any marked concentration of Pb at the nodule surface suggests co-
precipitation or co-deposition of Fe and Pb or their subsequent redistribution and
recrystallization.
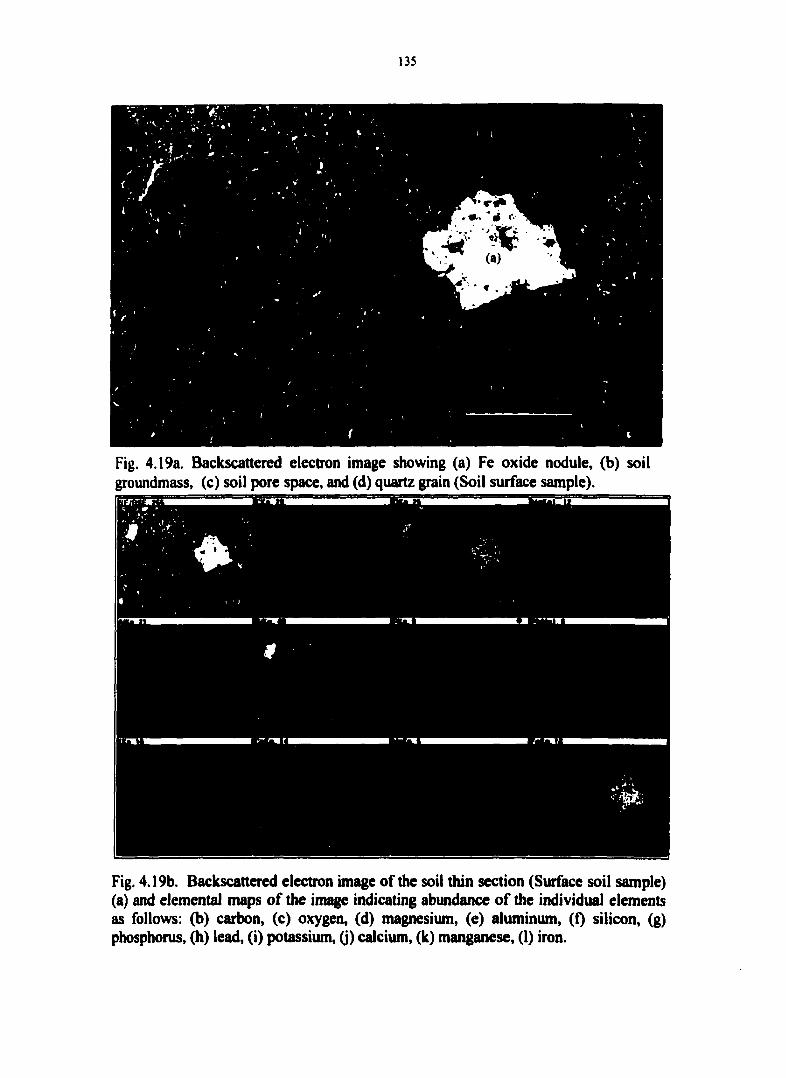
135
Fig. 4.19a. Backscattered electron image showing (a) Fe oxide nodule, (b) soil groundmass, (c) soil pore space, and (d) quartz grain (Soil surface sample).
•rrm: ^ . m ' • . .
t I# • , . J
Fig. 4.19b. Backscattered electron image of the soil thin section (Surface soil sample) (a) and elemental maps of the image indicating abundance of the individual elements as follows: (b) carbon, (c) oxygen, (d) magnesium, (e) aluminum, (f) silicon, (g) phosphorus, (h) lead, (i) potassium, (j) calcium, (k) manganese, (1) iron.

Fig. 4.20. (a) Backscattered electron image of a soil thin section showing the distribution ofquartz, feldspar, Fe oxide, dolomite, and Zr (surface soil sample), (b) - (I) Elemental maps of the image indicating abundance of O, Na, Mg, Al, Si, Zr, Pb, K, Ca, Ti, Mn, Fe.
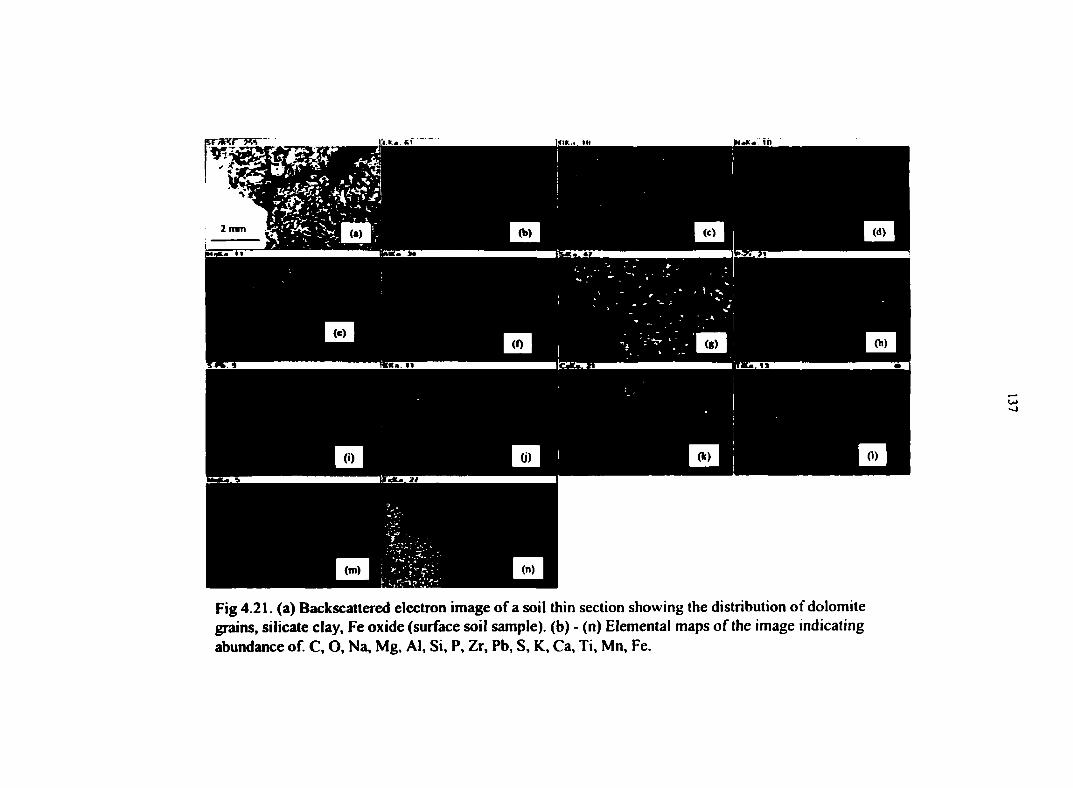
Fig 4.21. (a) Backscattered electron image of a soil thin section showing the distribution of dolomite grains, silicate clay, Fe oxide (surface soil sample), (b) - (n) Elemental maps of the image mdicating abundance of. C, O, Na, Mg, Al, Si, P, Zr, Pb, S, K, Ca, Ti, Mn, Fe.
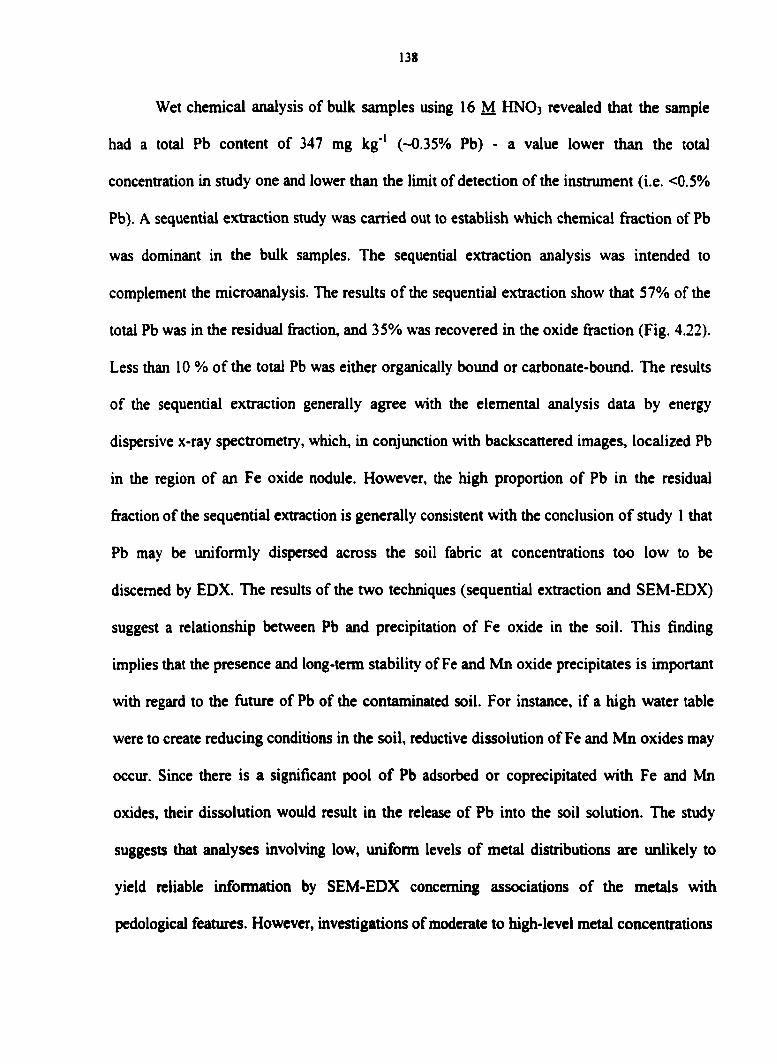
138
Wet chemical analysis of bulk samples using 16 M HNO3 revealed that the sample
had a total Pb content of 347 mg kg"' (~0.35% Pb) - a value lower than the total
concentration in study one and lower than the limit of detection of the instrument (i.e. <0.5%
Pb). A sequential extraction study was carried out to establish which chemical fraction of Pb
was dominant in the bulk samples. The sequential extraction analysis was intended to
complement the microanalysis. The results of the sequential extraction show that 57% of the
total Pb was in the residual fraction, and 35% was recovered in the oxide fraction (Fig. 4.22).
Less than 10 % of the total Pb was either organically bound or carbonate-boimd. The results
of the sequential extraction generally agree with the elemental analysis data by energy
dispersive x-ray spectrometry, which, in conjunction with backscattered images, localized Pb
in the region of an Fe oxide nodule. However, the high proportion of Pb in the residual
fraction of the sequential extraction is generally consistent with the conclusion of study 1 that
Pb may be uniformly dispersed across the soil fabric at concentrations too low to be
discerned by EDX. The results of the two techniques (sequential extraction and SEM-EDX)
suggest a relationship between Pb and precipitation of Fe oxide in the soil. This finding
implies that the presence and long-term stability of Fe and Mn oxide precipitates is important
with regard to the future of Pb of the contaminated soil. For instance, if a high water table
were to create reducing conditions in the soil, reductive dissolution of Fe and Mn oxides may
occur. Since there is a significant pool of Pb adsorbed or coprecipitated with Fe and Mn
oxides, their dissolution would result in the release of Pb into the soil solution. The study
suggests that analyses involving low, uniform levels of metal distributions are unlikely to
yield reliable information by SEM-EDX concerning associations of the metals with
pedological features. However, investigations of moderate to high-level metal concentrations

139
RmUMI 57%
Fig. 4.22. Distribution of Pb among five sequential extraction fractions of the surface soil sample 0-20 cm (study two).
140
in discrete segregations make the distribution of the metals so apparent that they can be
reasonably associated with pedological featiires in the soil.
REFERENCES
Alloway, B.J. 1990. Heavy metals in soils. John Wiley and Sons Inc. New York.
Amrhein, C., P.A. Mosher, and J.E. Strong. 1993. Colloid assisted transport of trace metals
in roadside soils receiving deicing salts. Soil Sci. Soc. Am. J. 57:1212-1217.
Asami, T., 1981. The Ichi and Maruyama River basins: Soil pollution by Cd, Zn, Pb, and Cu,
discharged from Ikuno Mine. p. 125-136. In K. Kitagishi, and I. Yamane (eds.)
Heavy-metal-pollution-in-soils-of-Japan. Japan Scientific Society's Press. Tokyo.
Bauchauer, M. 1973. Contamination of soil and vegetation near a Zn smelter by Zn, Cd, Cu,
and Pb. Environ. Sci. Technol. 7:131-135.
Bisdom, E.B.A., A. Boekestein, P. Curmi, P. Lagas, A.C. Letsch, J.P.G. Loch, R. Nauta, and
C.B. Wells. (1986). Submicroscopy and chemistry of heavy metal contaminated
precipitates from column experiments simulating conditions in a soil beneath a
landfill. Geoderma 30:1-20.
Chen, J., C. Zheng, F. Wei, Y. Wu, and D.C. Adriano. 1991. Baseline concentrations of
elements in soils of China. Water Air Soil Pollut. 57: 699-712.
Coker, E.G., and P.J. Mathews. 1983. Metals in sewage sludge and their potential effects in
agriculture. Water Sci. Technol. 15:209-225.
Davies, B.A. 1983. A graphical estimation of the normal Pb content of some British soils.
Geoderma 29:67-75
141
Davis, A., M.V. Ruby, and P.D. Bergstrom. 1992. Bioavailability of As and Pb in soils from
Butte, Montana, Mining District. Environ Sci. Technol. 26:461-468.
Davis, A., J.W. Drexler, M.V. Ruby, and A. Nicholson. 1993. Micromineralogy of mine
wastes in relation to Pb bioavailability, Butte, Montana. Environ Sci. Technol.
27:1415-1425.
Dickson, N.M., S.A. Watmough, and A.P Turner. 1996. Ecological impact of 100 years of
metal processing at Prescot, northwest England. Environmental Reviews 4: 18-24.
Farming, D.S., V.Z. Keramidas, and M.A. El-Desoki. 1989. Micas. In J.B. Dixon and S.B.
Weeds (eds.) Minerals in soil environments (2"*' edition). SSSA Book Series No I.
Soil Sci. Soc. Am. Madison, Wisconsin
Iowa State University Outlier Farms Weather Data. 1999. Agricultural and Biosystems
Engineering, College of Engineering, ISU
International Center for Diffraction Data. 1990. Powder diffraction file: Inorganic phases.
Search Manual (Hanawalt). ICDD. Park Lane, PA.
Kabata-Pendias, A., and S. Dudka. 1991. Baseline data for Cd and Pb in soils and smoke
cereals of Poland. Water Air Soil Pollut. 57:723-731.
Kaplan, D., D.B. Hunter, P.M. Bertsch, and D.C. Adriano. 1995. Application of synchotron
x-ray fluorescence spectroscopy and energy dispersive x-ray analysis to identify
contaminant metals on groundwater colloids. Environ. Sci. Technol. 28:1186-1189.
Keimedy, S.K., G.S. Casuccio, R.J. Lee, G.A. Slifka, and M.V. Ruby. 1996. Microbeam
analysis of heavy element phases in polished sections of particulate material - An
improved insight into origin and bioavailability, p. 317-328. In Morgan, J.H. (ed.)

Sampling environmental media. ASTM STP 1282. American Society for Testing and
materials.
Link, T.E., M.V. Ruby, A. Davis, and A.D. Nicholson. 1994. Soil Pb mineralogy by
microprobe: An interlaboratory comparison. Environ. Sci. Technol. 28:958-988.
Miller, W.P., and W.W. McFee. 1983. Distribution of Cd, Zn, Cu, and Pb in soils of
industrial northwestern Indiana. J. Environ. Qual. 12:29-33.
Nelson, D.W., and L.E. Sommers. 1982. Total carbon, organic carbon and organic matter, p.
539-577. In Page, A.L., R.H. Miller, D.R. Keeney. (ed.) Methods of soil analysis. Part
2. 2nd ed. Agron. Monogr. 9. ASA and SSSA, Madison.
Panessea-Warren, B.J. 1979. Identification and preservation of artifacts in biological X-ray
microanalysis, p. 691-702. In SEM: II. SEM Inc., AMF O'Hare, Chicago 111.
Saar, R.A., and J.W. Webber. 1980. Pb complexation by ftilvic acid: How it differs from
fulvic acid complexation of Cu and Cd. Geochim. Cosmochim. Acta 44:1381-1384.
Schintu, M., A. Kudo, G. Sarritzu and A. Contu. 1991. Heavy metal distribution and
mobilization in sediment from a drinking water reservoir near a mining area. Water
Air Soil Pollut. 57: 329-338.
Sheppard, M.I., and M. Stephenson. 1995. Critical evaluation of selective extraction methods
for soils and sediments, p. 69-100. In R. Prost (ed.) Third International Conference on the
biogeochemistry of trace elements: Contaminated soils. Paris, France. 15-19 May 1995.
INRA Editions. Versailles, France.
Shuman, L.M., 1985. Fractionation method for soil microelements. Soil Sci. 140:1:11-23.
143
Soil Survey Staff. 1993. Soil survey manual. 2"'' ed. USDA-SCS Agric. Handb. 18. U.S. Gov.
Print. Office, Washington DC.
Soil Survey Staff. 1998. Keys to Soil Taxonomy. S*** edition. U.S. Dept. Agric., Nat. Res.
Cons. Serv.
Sposito, G., L.J. Lund and A.. C. Chang. 1982. Trace metal chemistry in arid-zone field soils
amended with sewage sludge: I. Fractionation of Ni, Cu, Zn, Cd and Pb in solid
phases. Soil Sci. Soc. Am. J. 46:260-264.
Stover, R.C., L.E. Sommers, and D.J. Silviera, 1976. Evaluation of metals in wastewater
sludge. J. Water Pollul. Control Fed. 48:2165-2175.
Tessier, A., P.G.C Campbell, and M. Bisson. 1979. Sequential extraction procedure for the
speciation of particulate trace metals. Anal. Chem. 51:7:844-850.
Walters, N.F., G.R. Hallberg, and T. Fenton. 1978. Particle size analysis by Iowa State
University Soil Survey Laboratory, p. 61-90. In G.R. Hallberg (ed.) Standard
procedures for evaluation of Quaternary materials in Iowa. Iowa Geological Survey
Tech. Info. Series #8.
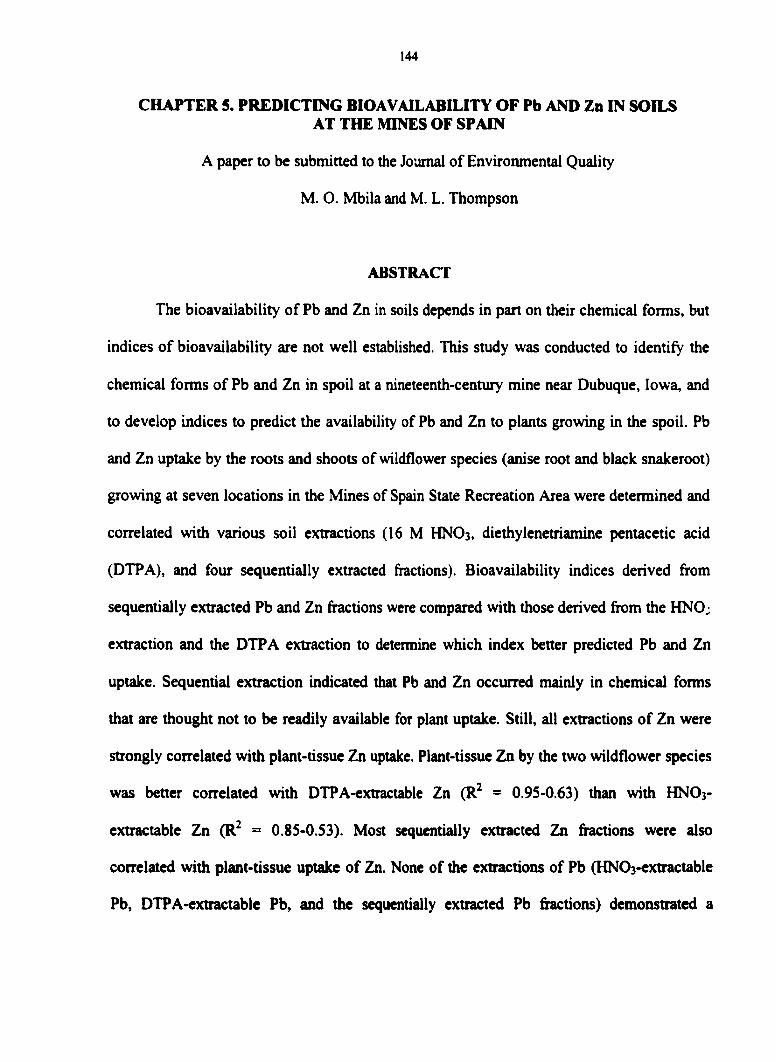
144
CHAPTER 5. PREDICTING BIOAVAILABILITY OF Pb AND Zn IN SOILS AT THE MINES OF SPAIN
A paper to be submitted to the Journal of Environmental Quality
M. O. Mbila and M. L. Thompson
ABSTRACT
The bioavailability of Pb and Zn in soils depends in part on their chemical forms, but
indices of bioavailability are not well established. This study was conducted to identify the
chemical forms of Pb and Zn in spoil at a nineteenth-century mine near Dubuque, Iowa, and
to develop indices to predict the availability of Pb and Zn to plants growing in the spoil. Pb
and Zn uptake by the roots and shoots of wildflower species (anise root and black snakeroot)
growing at seven locations in the Mines of Spain State Recreation Area were determined and
correlated with various soil extractions (16 M HNO3, diethylenetriamine pentacetic acid
(DTPA), and four sequentially extracted fractions). Bioavailability indices derived from
sequentially extracted Pb and Zn fractions were compared with those derived from the HNO;
extraction and the DTPA extraction to determine which index better predicted Pb and Zn
uptake. Sequential extraction indicated that Pb and Zn occurred mainly in chemical forms
that are thought not to be readily available for plant uptake. Still, all extractions of Zn were
strongly correlated with plant-tissue Zn uptake. Plant-tissue Zn by the two wildflower species
was better correlated with DTPA-extractable Zn (R^ = 0.95-0.63) than with HNO3-
extractable Zn (R~ = 0.8S-0.S3). Most sequentially extracted Zn fractions were also
correlated with plant-tissue uptake of Zn. None of the extractions of Pb (HNOs-extractable
Pb, DTPA-extractable Pb, and the sequentially extracted Pb fractions) demonstrated a
145
conclusive relationship with Pb uptake in the roots and shoots of the sampled species. Based
on higher correlation coefficients, the ease of analysis, as well as analytical detection
considerations, the DTPA index was preferred for predicting Zn uptake by these plants. None
of the soil extractions alone was a good predictor of Pb uptake by plants.
INTRODUCTION
Instances of heavy metal problems have been reported worldwide. Contamination of
soils near metal smelters (Buchauer, 1973), in agricultural soils (Srikanth and Reddy, 1991),
and along roadsides of motorways (Lagerwerff and Specht, 1970) have been reported. Much
of the concern about heavy metal contamination of soils is due to the potentially adverse
effects of these metals on living organisms in food chains leading to humans.
Heavy metal accumulation in soil can occur through metal mining and smelting
(Asami et al., 1981), aerial fallout (Dickson et al., 1996), or soil management practices
(Sauerbeck et al., 1987; Gimeno et al., 1996; Freedman and Hutchinson, 1981). The fate of
heavy metals originating from these sources is ultimately governed by pedogenic processes
(Srivastava and Gupta, 1996). The chemical forms of heavy metals in the soil depend on the
source of contamination as well as on the soil environment (e.g., pH, redox potential,
presence of organic matter, and colloidal clay particles). The chemical forms of the metals in
contaminated soils play a significant role in their transport and bioavailability to both native
and agronomic plants. Therefore, identifying the chemical forms in which these metals are
retained in the soil is required to predict their potential bioavailability and mobility to water
sources.
146
The Mines of Spain is a former mining district in northeastern Iowa that was a major
source of Pb and Zn in the United States during the 19'*' century. The ores were most actively
exploited from the 1820s through the Civil War, but some mining continued in the area as
late as 1914. The area is now managed by the State of Iowa Department of Natural Resources
as the Mines of Spain Recreation Area. Because much of the mine spoil has sat undisturbed
for at least a century, this site was chosen to predict the bioavailability of metals in minespoil
soils.
The ratios of metal concentrations in plants to total metal concentrations in the soil
have been used as a bioavailability index of trace metals in soils (Kabata-Pendias and
Pendias, 1984). The limitation of this index is that it implicitly assumes a linear relationship
between plant uptake and soil metal concentrations. However, linearity of metal uptake is not
always the case. Plants generally fall into three groups on the basis of their heavy-metal
uptake characteristics (Baker, 1981). Accumulators concentrate metals from either high or
low soil levels. Indicators show a linear relationship between tissue concentrations and the
soil concentrations. Excluders maintain tissue concentrations at low levels until, at higher soil
concentrations, the restrictive mechanism breaks down and unrestricted transport results.
Bioavailability of nutrients and metals in soils may not be strictly proportional to the
total concentration of the element in the soil. Therefore, bioavailability is ofren predicted
indirectly by using a soil extraction. Indirect indices measure the quantities of metals in soils
by either selective chemical extraction procedures (HOAc, CaCh, DTPA and EDTA
(Lindsey and Norvell, 1978; Gonsior et al., 1997; Echevarria et al., 1997; Page, 1974), or
several reagents in sequence (e.g., Tessier et al., 1979; Loneragan, 197S). A typical
sequential extraction approach uses progressively stronger chemical reagents to solubilize
147
portions of the total metal in the soil into readily exchangeable, carbonate-bound,
sesquioxides-bound, organic-matter-bound, and residual or structural (presumably metal ions
that are incorporated in mineral structures) (Tessier et al., 1979; Stover et al., 1976; Sposito
et al., 1982; and Shuman, 198S). These are operationally defined fractions that are based on
the ability of the extracting reagents to remove an element from its "form" in the soil.
However, questions regarding the specificity of the extracting solutions for given
forms of metals and the fact that repeated determinations performed on one sample may
introduce additive analytical errors have been raised about sequential extraction techniques
(Miller and McFee, 1983; Sheppard and Stephenson, 1998). Whereas the specificity of the
extracting solutions for a given metal form may never be completely known, a well-planned
sequence of extractants can at least minimize solubilization of multiple phases in one extract
(Miller et al., 1986). For instance, hydrogen peroxide (H2O2) used to oxidize organic matter
is also known to solubilize manganese oxides (Shuman, 1982). However, when used in a
sequence where manganese oxides are first solubilized (citrate-bicarbonate-dithionite (-CBD)
extraction), H2O2 can better selectively oxidize organic matter.
In spite of the drawbacks of sequential extraction, perhaps the best argument in favor
of this technique is that it suggests the relative strength with which trace metals are bound to
a particular matrix. For instance, using a sequential extraction scheme, Shintu et al. (1994)
determined that Pb was bound to the carbonates and Fe and Mn oxides in sediments from a
stream near a mining area. Haimsen (1977), studying soils along a river discharging waste
from a Pb and Zn mine, concluded that nonbioavailable (residual and acid-extractable)
fhu:tions of Pb and Zn were high (80-90%) due to association with Fe oxides or stable

148
minerals such as sulfides. However, studies relating the sequentially extracted fractions of
metals in soils to the actual uptake of metals by plants are surprisingly scarce in the literature.
The objectives of this research were (1) to identify the chemical forms of Pb and Zn
in mine spoil at the Mines of Spain, Dubuque County, Iowa, and (2) to determine which of
the chemical forms better predicted the bioavailability of Pb and Zn to two species of native
plants growing at the site.
MATERIALS AND METHODS
Research Area
The research site was at the Mines of Spain Recreation Area in Dubuque County,
northeastern Iowa where the bedrock is Silurian dolomite. The lead and zinc ores that were
mined at this site are classified as an Upper Mississippi Valley type (MVT) deposit, which
occurs in i)ortions of northeast Iowa, southwest Wisconsin, and northwest Illinois. Upper-
Mississippi-Valley type deposits are metallic hydrothermal ore deposits derived from hot
vapors escaping from cooling igneous magmas. Pb and Zn were transported in solution by
hot, saline brines in open cracks within the relatively flat-lying, sedimentary (carbonate) rock
(Ludvigson and Dockal, 1984). Metal sulfides, including galena, sphalerite, and pyrite,
precipitated. Geologic erosion and landscape dissection subsequently lowered the water
table, and, consequently, the sulfide crystals oxidized, dissolved, and reprecipitated as metal
oxides and carbonates (Ludvigson and Dockal, 1984).
The Mines of Spain area is in the physiographic region of Iowa called the Paleozoic
Plateau (Prior, 1991), which was covered by loess about 13,000 years ago. Predominant
vegetation is oak (Quercus ssp.) and hickory (Carya ssp.), whereas anise root {Osmorhiza

149
longistylis) and black snakeroot (Sanicular marilandica) are the predominant ground-level
plants.
Both anise root and black snakeroot are native to Iowa. They are common in upland
woodlands and wooded slopes of the Paleozoic Plateau region. Anise root plant has several
uses. Because of its distinct odor and flavor, it has been used as a flavoring for cookies, cakes
and candies. Also, early European settlers in Iowa are believed to have chewed the plant both
for its flavor and as medicine for sore throat (Runkel and Bull, 1987).
The study site was on a side slope (18-25%) where the soils are mapped as Seaton silt
loam (USDA, 1985). The local area of the mine pits sampled (~ 0.3 acres) comprises mining
excavations of various sizes (3-10 m diameter). Some pits are partially fllled, while others are
not fllled, giving rise to small depressions (0.5 - 1 m deep) over the entire hillslope. Beside
most of the depressions are mounds of spoil materials that were dumped from the excavated
pits. These features along the slope give the sampling site a rolling microtopography.
Materials &om the mine spoil and areas inmiediately adjacent and higher on the slope have
washed into the micro-depressions, resulting in redistribution of Pb and Zn ore and spoil
(Fig. 5.1).
Sampling Techniques
Samples were collected from seven sites. Three of the sites were on mine spoil
locations while four were from nonspoil locations nearby. Ail seven sites were on a side
slope below a convex ridge. Sites 1, 2, and 5 were located in the mine spoils, and sites 3 and
4 were located higher on the side slope where there was no mine spoil. Sites 6 and 7 were
nonspoil soils lower on the side slope.

J #1 n
#5 #6
Fig. 5.1. Location of sampling points at the Mines of Spain.

151
At each site, a quadrant of 1 was laid out on the ground to count and sample the
understory plants. Within that quadrant, the predominant plants, anise root {Osmorhiza
longistylis) and black snakeroot {Sanicular marilandica), were identified, counted, and
uprooted. At some locations, the two species were the only plants growing in the 1 m^
quadrant. At other locations, especially in the nonspoil locations, other understory plants
grew, and the populations of the anise root and black snakeroot were lower. The numbers of
plants identified and sampled at the locations are shown in Table S.l. After the plants were
sampled, soil (0-20 cm) around the roots was then collected.
Sample Preparation and Plant Tissue Analysis
Plant samples were taken to the laboratory where they were rinsed with deionized and
distilled water to remove debris and dust from the leaves and soil particles that clung to the
roots. Shoots were then separated from the roots and dried separately at 60°C for 4 days in a
drying oven with moderate air movement (Hach Company, 1988). Dry weights of the toots
and shoots of the plants were measured to determine the root:shoot ratio of the plants. The
samples were ground to pass a 60-mesh sieve. Moisture content was determined by drying
subsamples at lOS^C until constant weight was obtained.
Total Pb and Zn were solubilized according to the method of Miller and McFee
(1983) by digesting 1-g subsamples of the tissue with IS ml of concentrated trace-metal-
grade HNO3 at lOO^C for 16 hours using an A1 digestion block with reflux cover. After the
digestion, 5 ml of 30% H2O2 were added to oxidize resistant organic matter, and the solution
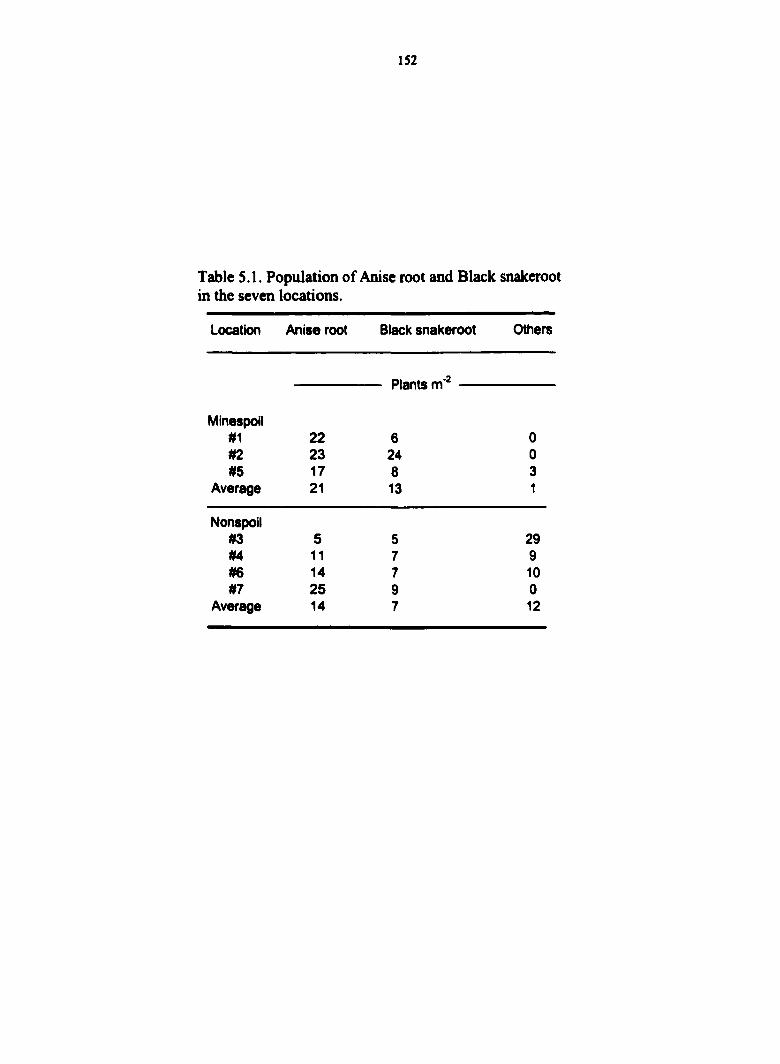
152
Table 5.1. Population of Anise root and Black snakeroot in the seven locations.
Location Anise root Black snalteroot Others
Plants m'
Minespoil #1 22 6 0 #2 23 24 0 #5 17 8 3
Average 21 13 1
Nonspoil #3 5 5 29 #4 11 7 9 #6 14 7 10 #7 25 9 0
Average 14 7 12

153
was allowed to cool. After cooling, the solution was filtered through Whatman #42 filter
paper into a 25-ml volumetric flask.
The volumetric flasks were then diluted to volume with distilled water. Pb in the
solutions was determined by inductively coupled Ar plasma atomic emission spectroscopy
(ICAP-AES) because of expected low levels of Pb in the plants. Zn in the samples was
determined by atomic absorption spectroscopy (AAS). Samples were run in duplicate to
monitor the precision of our determinations. In addition, a laboratory reference material (com
tissue sample) was included in each run for quality control.
Sample PreparatioD and Total Metal Analyses of Soil
The soil samples were air-dried at room temperature for about a week and then
ground to pass a 10-mesh sieve. Moisture content was determined by drying separate
subsamples at 10S°C until they reached constant weight. Total Pb and Zn were solubilized
according to the method of Miller and McFee (1983) by digesting 4 g of soil with 20 ml of
concentrated trace-metal-grade HNO3 at 100 °C for 16 hours using an A1 digestion block
with reflux cover. After the digestion, S ml of 30% H2O2 were added to oxidize resistant
organic matter, and the solution was allowed to cool. After cooling, the solution was filtered
through Whatman #42 filter paper into a SO-ml volumetric flask. The volumetric flasks were
then diluted to volume with distilled water.
Metals in the soil extracts were determined by atomic absorption spectrometry
(AAS). AAS was chosen over the ICP for determination of Pb and Zn in the soil samples
because of high spectral interference expected from the high Fe- and Al-containing soil
154
samples. Samples were mn in duplicate to monitor the precision of our determinations. In
addition, a reference soil sample was included in each run for quality control.
Total C and N were detemiined by dry combustion using a Leco-CHN instrument
(Nelson and Sommers, 1982). Particle size analysis of the <2-mm fraction was detemiined
with the pipette method (Walter et al., 1978). Soil pH was determined using a 1:1 soil/water
ratio. Bulk densities of field-moist samples were determined by the clod method using
parafQn (Blake, 1986). Pb and Zn extractable by diethylenetriamine pentacetic acid (DTPA)
were determined by use of a solution consisting of 0.005 M DTP A, 0.01 M triethanol amine
(TEA), and 0.01 M CaCh, adjusted to pH 7.3 (Lindsay and Norvell, 1969). An aliquot of 20
ml of the solution was added to 10 g of soil in a 12S-ml Erlenmeyer flask and covered with a
cap. The mixture was shaken on a mechanical shaker for 2 hours. The mixture was then
filtered into a 2S-ml volumetric flask with Whatman #42 filter paper and diluted to volume.
Extractable metals were determined by ICP-AES.
Sequential extraction was used to fractionate heavy metals in the seven soil samples.
The fractions, essentially those defined by Tessier et al. (1979), are as follows: exchangeable,
carbonate bound, sesquioxide bound, organic-matter boimd, and residual. We modified the
method of Tessier et al. (1979) by using Mg(N03)2 to extract exchangeable metals (Shuman,
1985) and by using the citrate-bicarbonate-dithionite extraction method (Mehra and Jackson
(1960) to extract sesquioxide-bound metals.
The solutions and conditions used for the extractions are shown in Table 4.1 (Chapter
4). Mg(N03)2 was intended to remove exchangeable Pb and Zn by flooding the soil with
alternate cations. Mg(N03)2 was used instead of MgCh because of concerns that the chloride
ion can complex metals (Doner, 1978). Na acetate (NaOAc) (1 M at pH 8.2) was used to
155
selectively dissolve the carbonates (Tessier, 1979). The combined action of Na-citrate, Na-
bicarbonate, and Na-dithionite (CBD) was used for extracting metals bound to sesquioxides.
Dithionite reduces Fe and Mn to their ferrous and manganous forms, respectively. Citrate
complexes the metals and prevents precipitation of FeS, while bicarbonate buffers the pH of
the system. Hydrogen peroxide (H2O2) was used to oxidize organic matter, liberating metals
that might be bound by the organic matter. Concentrated HNO3 was used to dissolve the
primary and secondary minerals in the soil, liberating Pb and Zn that may have been held in
mineral crystal structures. After each step of the extraction, the soil samples were rinsed with
distilled and deionized water, centrifiiged, and the water was discarded.
The concern of Shuman (198S) that Na dithionite is sometimes contaminated with Zn
was addressed by carrying blanks that received exactly the same treatment as the soil
samples. The blanks were used to prepare standard solutions for ICP and AAS analyses. In
that way, the effect of any Zn added to the soil samples with the dithionite was cancelled by
adding the same amount of Zn to the standards. Laboratory protocols, such as replicating
some samples and including a reference soil sample with each set of analyses, were used to
check the reliability of our method. As a result, the sums of the sequentially solubilized metal
fractions were closely related to the total metal released in the 16 M HNO3 digest. Regression
analysis of metals in the 16 M HNO3 digest and the simi of metals in the five sequential
extraction fractions (n = 7 locations) gave the equations:
PbHNOj = 1.3Pb,u„,-5 (R2 = 0.99)
ZNHN03 ~ 1.2ZNIUM -11 (R^ = 0.99)
It is not clear why the sum of the sequential fractions and the HNO3 digest were not equal.
However, in a preliminary experiment carried out to determine metal losses resulting from
156
washing the sample following each extraction, only 2% of total Pb and 3% of total Zn in the
sample were recovered from discarded water. This error accounts for some of the difference.
Reprecipitation of dissolved minerals following the CBD extraction might also make the soil
material more resistant to decomposition by HNO3 (used as the final sequential extractant).
Statistical Analyses
Regression analysis was performed to determine which of the soil extractions (HNO3,
DTP A, or the sequential extractions) best predicted Pb and Zn uptake by the two species. The
slope of the regression line is used as a bioavailability index. The larger the absolute value of
the index, the larger is the predicted bioavailability of a particular form of the metal.
Regression conrelation (R^) from the regression analysis was used to quantitatively determine
the nature of the relationship between Pb and Zn released by different soil extractions and Pb
and Zn taken up by the plants.
RESULTS AND DISCUSSION
Soils of the study area developed in a loess mantle that covers a dolomite-rich,
weathered, sedimentary bedrock. Sites 1, 2, and S were located directly on mine spoil, and
sites 3, 4, 6, and 7 were in nonspoil locations both up slope and down slope from the spoil
and mining pits.. Selected soil properties at the sampling sites are presented in Table 5.2. Soil
samples collected at the mine spoil locations (sites 1, 2, and S) had clay contents that ranged
from 380 to 400 g clay kg''), organic C contents of 24 -36 g C kg'', bulk densities of-1.3
Mg soil m'^, and pHs of 7.3-7.4. Samples collected at the nonspoil locations (sites 3,4,6 and

Table 5.2. Selected soil properties at the sampling locations. Location Sand Silt Clay ToUlC Organic C Bulk
Density PH
(Mgm-O g/kg " (Mgm-O MinesDoil
#1 220 380 400 49 32 1.27 7.3 #2 310 290 400 52 24 1.29 7.4 #3 360 260 380 70 36 1.25 7.3
Avenge 297 310 393 57 31 1.27 7.3 Nonspoil
#3 120 710 170 40 42 1.10 6.8 #4 140 670 190 57 56 1.10 7.0 #6 160 640 200 45 42 1.10 7.0 m 200 610 190 47 31 1.17 7.3
Average 155 658 188 47 43 1.12 7.0
158
7) had lower clay contents (170-200 g clay kg*'), higher organic C contents (31-56 g C kg"'),
lower bulk densities (1.10-1.17 Mg soil m'^), and lower pH values (7.0).
Mining in the area, which involved mechanical movement and mixing of subsurface
materials to the soil surface, is likely to have brought clayey, dolomitic materials from the
weathered residuum below the loess to the surface, increasing the pH and diluting the
original concentration of surface horizon organic matter at the mine spoil locations.
Redeposition of surficial materials eroded from the mine spoils and higher elevations into the
mine-pits (Fig. S.l) seems to be the dominant soil-forming process at the mine spoil sites,
and these processes may have contributed significantly to the redistribution of Pb and Zn in
the soils.
Plant Metal Uptake Study
Metal concentrations in anise root and black snakeroot tissues were used to measure
bioavailability of Pb and Zn in the soils. The distribution of anise root and black snakeroot in
the study sites suggests that both species have adapted to the Pb and Zn levels of the soils
(Table S.l). Both species dominated at all the mine spoil sites; in some cases, other species
were absent altogether. Anise root and black snakeroot are perennials, and they had slightly
dijfTerent root:shoot ratios. The average root:shoot ratio for anise root was 1.2, whereas that
of black snakeroot was 0.8.
Concentrations of Pb and Zn in the shoots and roots of both anise root and black
snakeroot that were growing in the mine spoil and the nonspoil sites are simmiarized in Table
S.3. Consistent with total Pb and Zn contents in the soil (Table 5.4) and the fact that Zn is an
essential micronutrient, Zn concentration in plant tissues was generally greater than that of

Table S.3. Plant tissue Pb and Zn contents of two species from the seven locations in the Mines of Spain.
Anise root Black snakeroot Anise root Black snakeroot
Location Root Shoot Root Shoot Root Shoot Root Shoot Pb Zn
Minespoil - mg kg 98 15 60 10 161 53 181 47
#2 63 5 66 21 107 37 181 70 #5 77 8 67 23 74 37 114 47
Average 79 9 64 18 114 42 159 55
Nonspoil #3 4 1 4 4 33 33 87 32 M 4 1 2 2 24 25 43 31 m 4 >1 3 2 31 22 50 28 Wl 2 >1 2 1 21 20 67 26
Average 3 1 3 2 27 25 62 29
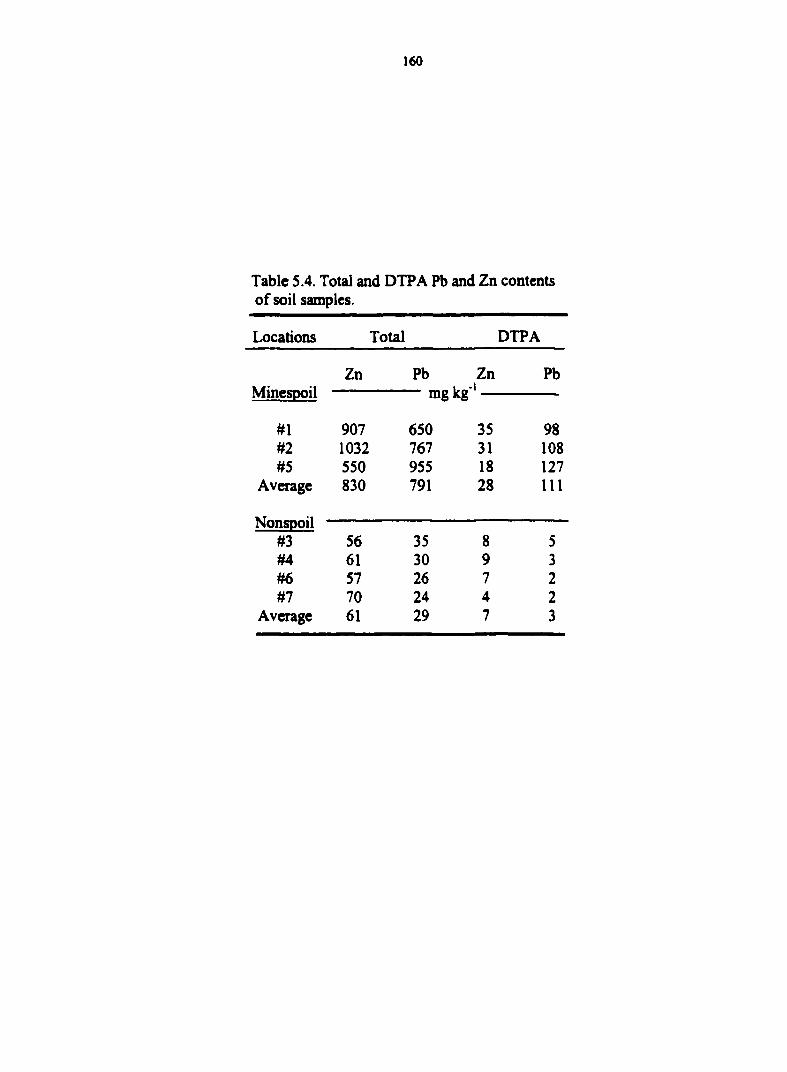
160
Table S.4. Total and DTPA Pb and Zn contents of soil samples.
Locations Total DTPA
Zn Pb Zn Pb 1 , - 1 MmesDoil mgkg 1
#1 907 650 35 98 #2 1032 767 31 108 #5 550 955 18 127
Average 830 791 28 111
NonsDoil ' NonsDoil ' #3 56 35 8 5 #4 61 30 9 3 #6 57 26 7 2 #7 70 24 4 2
Average 61 29 7 3
161
Pb. Concentrations of Zn and Pb in the roots of both species were at least three times greater
than concentrations in the shoots (Table S.3).
Similar differences between root and shoot concentrations of Pb and Zn have been
observed for other plant species (Loneragan, 1975; Chen, 1992). This observation suggests
some physiological or chemical mechanism of the plants to exclude Pb and Zn from shoot
and reproductive tissue by retaining them in the roots (Pettersson, 1976; Koeppe, 1977;
Sauerbeck, 1991), a mechanism that may have been essential for the two species to grow in
the mine spoil. Furthermore, since a greater portion of the heavy metals resided in the plant
roots, it may be that plants with higher root;shoot ratios (better developed root systems) have
higher rates of metal uptake than plants with lower ratios. This may be one of the reasons for
the differential Pb and Zn concentrations of the two sampled species, which have different
root:shoot ratios.
Zn Uptake
Total soil Zn concentrations at the nonspoil sites (56-70 mg Zn kg 'soil) were
comparable to those of most uncontaminated soils (Kabata-Pendias and Pendias, 1984),
whereas concentrations at the mine spoil locations (550-1032 mg Zn kg'' soil) were more
than 10-fold greater than concentrations at uncontaminated sites (Table 5.4). Thus, Zn
concentrations in the minespoil remained very high a century or more after mining.
Regression analysis of the total soil Zn concentration with plant uptake of Zn is
shown in Figs. 5.2, and 5.3. Total soil Zn concentration was strongly correlated with Zn
uptake in the root and shoot of black snakeroot (R^ = 0.93,0.86), the root of anise root (R^ -
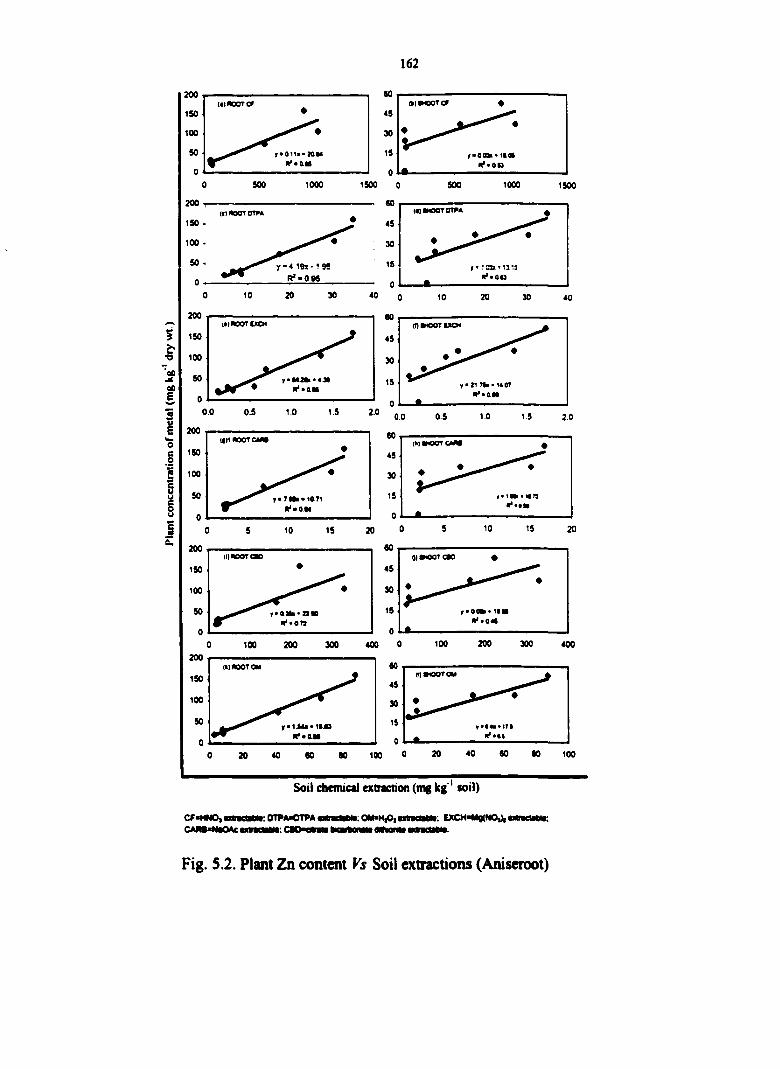
162
200
ISO 100
soo 1000 1S00 soo 1000 1S00 200
ISO 100
200 60
ISO 4S 100 30
*» s oc B
0.5 0.0 10 2.0 O.S 0.0 2.0
200
o e o ISO
I 100 e 8 c • 10.T1
o u §
200
ISO 100
200 300 100 400 200 300 400 100
200
150 100
100 100
Soil chemical extnction (mg kg' soil)
CF>«4N0,«(nGaM;0TPAOTFA«MraeaM:0M>H|0,tincaM: EXCHHIg(NO,),«>lrKliMt; CARS*NsOAc cmcMHct CSO^oinM bicvMnflis
Fig. 5.2. Plant Zn content Vs Soil extractions (Aniseroot)
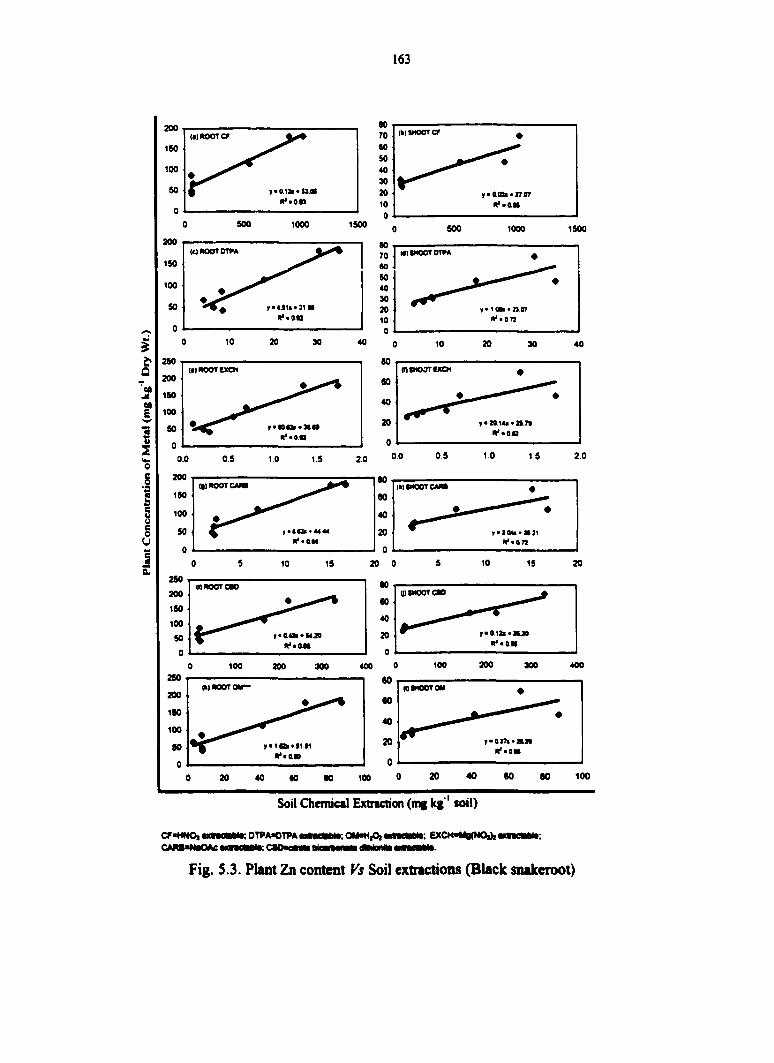
163
(•I ROOT V
If •on
500 1000
200
150
too
SO
0
250 200 150 100 50 0
100 2S0 200
ISO 100
so 0
200 300
20 40 60
1500
(fel SHOOT cr •
y • 0.08B • 27.07 If laM
500 1000 1500
(UROOTDTI>A 80 70 M 50
If'OB
40 30 20 10 0
0 10 20 30 40
80
60
40
(•iKOorexcH 80
60
40
v>aoi«M.w If •OK
20
0
M)tMOOTOT** «
\ •
If • 10k * a or
"••OTJ
10 20 30 40
(II HOOT
r*»43i<MJ0
•••ao
80 im SHOOT MM • 60
40 • ^ •
20 r>20«i>a]l 0
If >071
10 15 20
ignaoTcio
If •ON
400 100 200 300 400
(kiacoTc w
r*i»«tiji If aan
60
60
40
20
0
mlHOOTOM •
«
r-siTxaM If •OM
100 20 40 60 80 100
CF>HNO) CAra>NaOAc
Soil ChcTTUcal Extraction (mg kg' soil)
EXCH-Mg(NOdi i;DTPA>OTPAwl caoKinii
Fig. S.3. Plant Zn content Vs Soil extractions (Black snakeroot)

164
0.85), but not with the shoot of anise root (R^ = 0.53). The slopes of the regression equations
in Figs. 5.2-5.3 are the concentration factor indices of bioavailability.
The slopes indicated that incorporation of Zn in the root tissue of both species was
greater than Zn incorporation in shoots. Both species showed a 3-4 fold difference in Zn
concentration (in roots) between the minespoil and nonspoil sites, and about a 2-fold
difference in Zn concentration in the shoot (Table 5.3). Thus, Zn uptake was approximately
linear with total soil Zn concentration over the range studied.
Soil samples from the seven locations were extracted with DTPA to evaluate the
relationship between extractable levels and tissue concentration of Zn. The DTPA method
extracted less Zn than the 16 M HNO3 method (Table 5.4). DTPA-Zn increased as the total
Zn content of the soil increased, but the increase was not proportional. Average DTPA-Zn
across the locations was 28 mg Zn kg*' soil at the mine spoil sites and 7 mg Zn kg'' soil in
the nonspoil sites. Also, DTPA-Zn was strongly correlated with root and shoot uptake of Zn
by the two species (Figs. 5.2 (c) & (d), and 5.3 (c) & (d)). Although DTPA extracted less Zn
than the 16 M HNOa-extraction, plant Zn uptake was more highly correlated with DTPA
extraction than with total Zn concentration (16 M HNOs-extraction), indicating that the
DTPA extraction probably extracted Zn that is more bioavailable to plants, whereas the
HNO3 extraction removed more metals from the soil than are actually bioavailable to plants
e.g., specifically adsorbed metals and structurally bound metals.
Pb Uptake
Pb concentration in the range of 11- 42 mg Pb kg'' soil is commonly reported for
uncontaminated soils worldwide (Kabata-Pendias and Dudka, 1991; Chen et al., 1991;

165
Davies, 1983). Total Pb concentrations in the nonspoil sites (24-35 mg Pb kg'' soil) were
comparable to those of uncontaminated soils, while total Pb concentrations in the mine spoil
materials were >20 times more than Pb concentrations in uncontaminated soils (Table 5.3).
Pb uptake by the shoots and roots of both anise root and black snakeroot that were
growing in the minespoil and nonspoil sites are summarized in Table 5.3. Both species were
sensitive to Pb uptake, showing an average of more than a 26-fold difference in concentration
between plants growing in the minespoil soils and those in the nonspoil soils. The slopes of
the regression equations in Figs. 5.4 and 5.5 are the concentration factor index of
bioavailability. Regression analysis of the total soil Pb concentration with Pb uptake by the
plants suggests high relative bioavailability and a positive linear relationship. However, it is
obvious from examination of the scatter plots of Figs. 5.4(a) & (b), and 5.5(a) & (b) that the
correlations are determined by clusters of values at the high and low ends of the range of
concentrations. Thus, if conrelation analysis for the nonspoil sites was performed separately
and compared to the minespoil sites, a relationship that is different from that reported in Figs.
3-6 may be expected. Due to absence of data for Pb concentrations falling within the
midrange of our data, we cannot infer a linear relationship between Pb uptake and total soil
Pb concentration. However, to the extent that plants growing in the high Pb content soils
showed high Pb uptake, and plants growing in the low Pb content soils showed low Pb
uptake (Table 5.3 and 5.4), Pb uptake by plants depended on the total Pb content of the soils.
The DTPA method extracted less Pb than did the 16 M HNO3 method. DTPA-
extractable Pb increased with the total soil Pb concentration (Table 5.4), although not
proportionally. When averaged across the seven locations, DTPA-Pb at the nonspoil
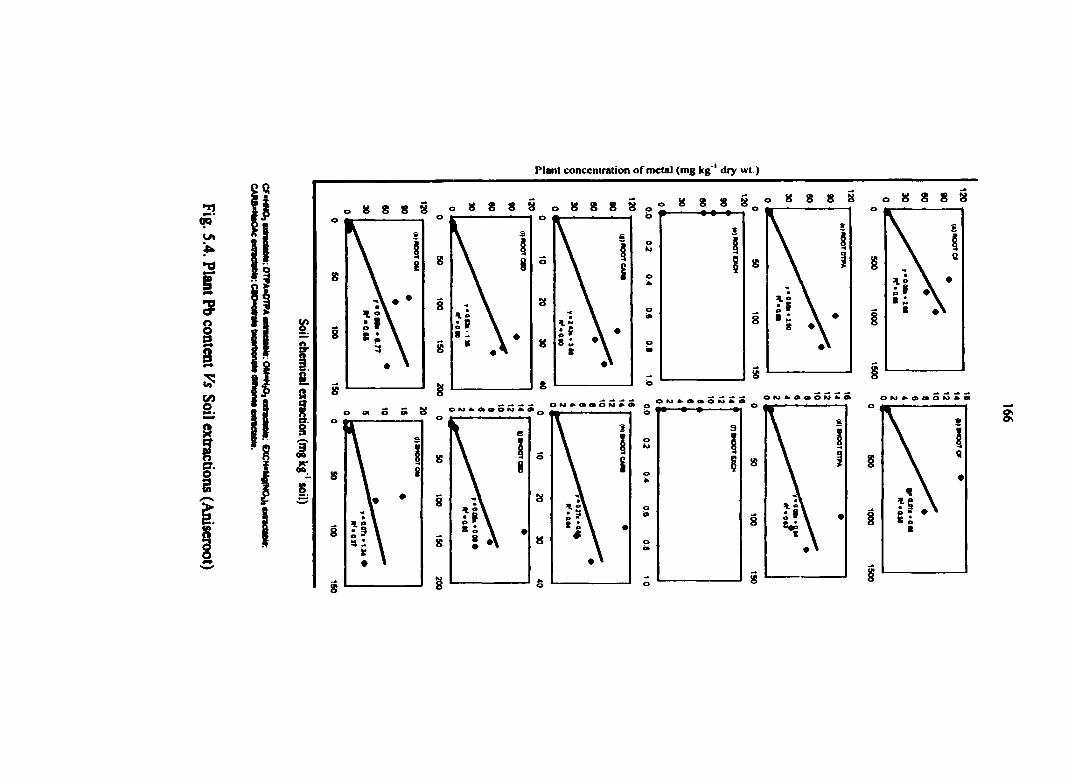
Plant concentration of metal (mg kg'' dry wt.)
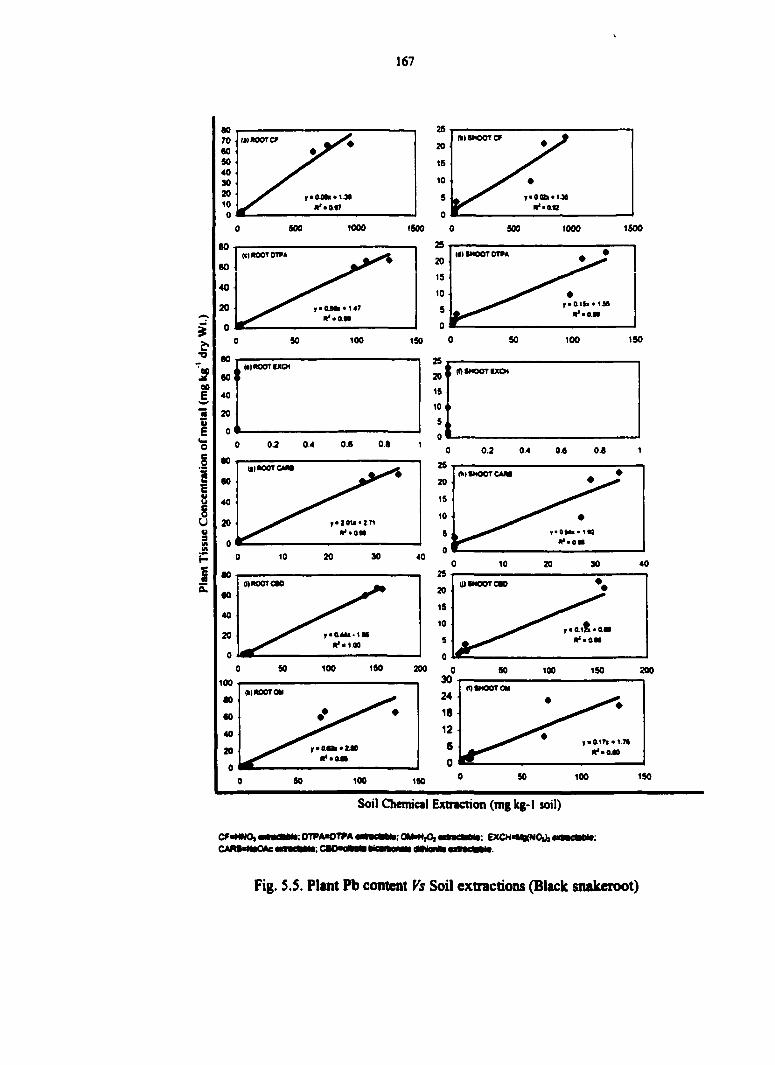
167
»•
1000 tsoo 1500 500 500 1000
(« SHOOT OT*A
40
150 100 100 ISO
eo jt eo E w
10 I > S u E o4 O 0.« 0.8 0.4
0.8 04 06 s (t)«OOT s (h»IMOOTCAm e u u e o U « s M Ml
h 40 e « (UiHOOTcao a.
ISO 100 200 ISO 200 100
100 (t) (HOOT OH (HI MOOT OM
ISO 100 100 ISO
Soil Chemical Extrtction (mg kg-1 soil)
Cf«HWOi mtwearn OTPAOTPA •McMH; mawernait: EXCH*¥g(MOA*»wembi»: CAM«MiO»c Mwtain; cio«d>iii MBWiiili mMm
Fig. S.S. Plant Pb content Fs Soil extractions (Black snakeroot)
168
locations (3 mg Pb kg' soil) was less than S% of that at the minespoil locations (111 mg Pb
kg ' soil). Therefore, DTPA-extractable Pb was a function of total soil Pb content.
Regression analysis of DTPA-Pb and plant uptake of Pb by the root and shoot of the
two species showed a trend that is similar to the relationship between total soil Pb
concentration and Pb uptake (Fig. 5.4 (a) & (b) and Fig. S.S (a) & (b)). Because of the
absence of data for total concentrations within the midrange of our data, we cannot conclude
whether the relationship between Pb uptake and DTPA-Pb is linear or curvilinear. Thus
factors other than the total Pb content of the soils may control Pb uptake by plants and
predictive relationships for Pb may be very complex.
In general DTPA-Pb was approximately 2- to 4-fold higher than DTPA-Zn, contrary
to the total Pb and Zn (16 M HNO3) concentrations in the soil. Low recovery of Zn with
DTPA was also reported by Mortvedt and Giordano (1975), who attributed it to the
extractant's inability to compete for Zn with organic ligands in the soil. However, the
stability constants of soil organo-Pb complexes are higher than those of soil organo-Zn
complexes at almost all pHs (Kabata-Pendias and Pendias, 1984), implying that the inability
of DTPA to compete with organic ligands should be greater for Pb than for Zn. We do not
have an adequate explanation to accoimt for the low recoveries other than the short
equilibration time (2 hr) for the extractions, which may be insufficient for the dissolution of
certain Zn phases.
Pb and Zn Partitioning and Bioavailability in Soil
Regression analyses of the sequentially extracted metal fractions with plant tissue
metal content was intended to identify which of the metal fractions could best predict the
169
bioavailability of Pb and Zn and to compare each of the fractions to more common indices of
bioavailability. The values of Pb and Zn used to calculate the regression lines in Figs S.2-S.S
are based on absolute concentrations for each sequential fraction across the seven sites. The
slopes of the regression lines describing the relationship between concentrations of tissue Pb
and Zn and the extractable metals are the index of bioavailability predicted by the fraction.
Predicting Zn Uptalce from its Chemical Forms
A summary of the distribution of soil Zn among the five sequentially extracted
fractions is provided in Table S.S, showing that negligible amounts of Zn (< 3%) occurred in
the exchangeable (Mg(N03)2-extractable) and carbonate (NaOAc-extractable) fractions of
the soils at all the locations. Zn was predominantly distributed in the residual (HNO3-
extractable), oxide (CBD-extractable) and organic-bound (HjOz-extractable) fractions at all
locations. Zn in the residual, oxide and organic fractions of the soil is assumed to be
relatively stable when compared with the exchangeable forms. These data suggest that a
small proportion of Zn is in the bioavailable (exchangeable and carbonate) fractions, and an
overwhehning proportion is in the less bioavailable (oxide, organic, and residual) fractions.
Plant uptake of Zn at the seven sites was strongly correlated with the exchangeable
Zn fraction in the soil (Figs. S.2 (e) & (f) and 5.3 (e) & (0)- Carbonate bound-Zn fraction was
also strongly correlated with Zn uptake by the root and shoot of anise root and black
snakeroot (Figs. 5.2 (g) & (h) and 5.3 (g) & (h)). Both exchangeable Zn fraction and the
carbonate-bound-2^ fraction were linearly correlated with plant Zn in the roots and shoots of
anise root and black snakeroot, although in all cases exchangeable Zn fractions were more
strongly correlated with Zn uptake by the roots than by the shoots. Therefore the
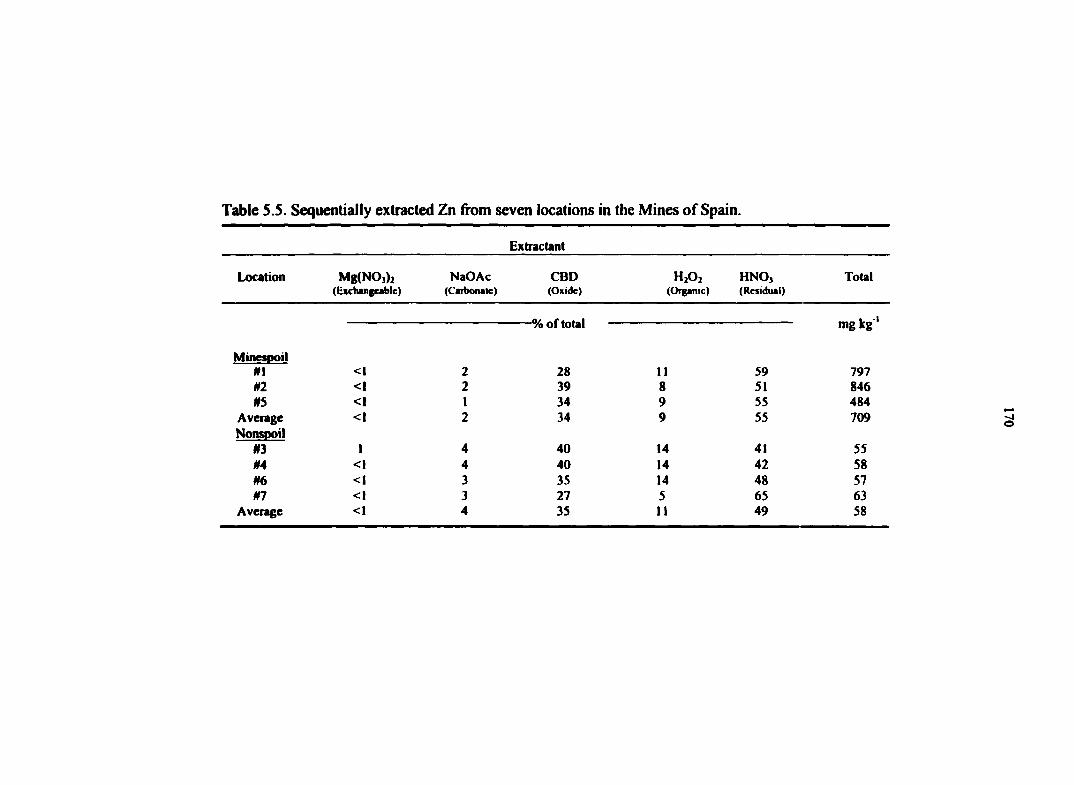
Table S.S. Sequentially extracted Zn from seven locations in the Mines of Spain.
Extnctant
Location Mg(NOj)i NaOAc CBD H2O, HNO, Total (Exchangeable) (Caibonale) (Oxide) (Organic) (Residual)
% ol tutal tng kg
MinesDoil #1 <1 2 28 II 59 797 #2 <1 2 39 8 51 846 #S <1 1 34 9 55 484
Average <1 2 34 9 55 709 Nonsimil
#3 I 4 40 14 41 55 #4 <1 4 40 14 42 58 #6 <1 3 35 14 48 57 #7 <1 3 27 5 65 63
Average <1 4 35 11 49 58

171
exchangeable index as well as the carbonate index seem to be good predictors of Zn
bioavailability. The typically low Zn concentrations in the Mg(N03)2 and NaOAc extracts
could cause analytical difficulties, leading to imprecise estimates of bioavailability.
The oxide-bound Zn fraction was strongly correlated with Zn uptake by the root and
shoot of anise root and black snakeroot. The oxide fraction of metals in general was better
correlated with Zn uptake than were the other fractions higher correlation coefGcients,
compared with the other fractions (Figs. 5.2(i) & (j) and S.3(i) & (j)- Organically bound-Zn
was strongly correlated with root and shoot Zn uptake by both aniseroot and black snakeroot
(Figs. S.2(k) & (I) and S.3(k) & (1)). Like the exchangeable and carbonate fractions, the oxide
and organic fractions were more strongly correlated with Zn uptake by the roots than by the
shoots. However, both fractions (oxide and organic) individually accounted for significant
proportions of the total soil Zn, a fact that is analytically advantageous because the laeger
amounts of Zn extracted by the extractants can be more easily determined by common
techniques, e.g., flame atomic absorption spectroscopy and inductively coupled plasma-
atomic emission spectroscopy.
Predicting Pb Uptake from its Chemical Forms
An interesting feature of these results of chemical partitioning of Pb is that Mg(N03)2
did not extract Pb from the soils by sequential extraction, probably due to strong specific
(largely covalent) interactions of Pb with the soil sorbent complex (McBride, 1994). Thus Pb
uptake could not be correlated with the exchangeable-Pb fraction in the soil (Table 5.6). One
percent of the total Pb was in the carbonate-bound fraction in the nonspoil locations, whereas
S-6 % of the total Pb was in the carbonate-bound fraction in the mine spoil locations.

Table 5.6. Sequentially extracted Pb from seven locations in the Mines of Spain.
Extractant
Location Mg(NO,h NaOAc CBD HNOj Total (Rxchangcabk) (Cafbonalc) (Oxide) (Organic) (Residual)
mg kg' % of total mg kg' Minespoil
#1 <1 5 26 13 56 537 #2 <1 5 27 22 46 588
<1 6 24 11 59 635 Average <1 5 26 15 54 586 Nonspoil
#3 <1 1 39 29 31 31 #4 <I 1 46 28 24 30 #6 <l 1 40 29 31 22 #7 <I I 47 10 42 12
Average <1 1 43 24 32 24

173
The small proportion of exchangeable and carbonate-bound Pb in the soils suggests that most
of the Pb in soils of the research site was present in chemical forms that are not readily
available for plant uptake.
The scatter plots and linear regression equations in Figs. 5.4 and S.S indicate that
plants with high Pb uptake grew on minespoil that contained high levels of Pb in the
carbonate and oxide fractions. On the other hand, plants with low Pb uptake grew at nonspoil
sites where soils contained low amounts of Pb in the two chemical fractions. The scatter plots
of Figs. 5.4 and 5.5 show an absence of concentrations in the midrange of soil Pb
concentrations, making it impossible to determine whether a linear relationship existed
between Pb uptake and the chemical fractions of Pb obtained by sequential extraction. It is
very interesting however, that the results obtained for the carbonate and oxide fractions are
consistent. On the other hand, H202-extractable Pb concentrations were more variable and
the scatter plots suggest that weak linear or curvilinear relationships with tissue Pb
concentrations might exist. In general, these results indicate that Pb uptake by plants does not
depend strongly on any single chemical fraction as none of the chemical fractions showed a
conclusive linear relationship with plant uptake.
In sunmiary, the sequential extraction data showed that Pb and Zn were associated
with the soil by mechanisms stronger than the electrostatic interactions of ion exchange. This
finding has practical implications because it suggests that Pb and Zn are relatively immobile
and difficult to leach within the soil profile. Moreover, their uptake by plants could be
restricted.
174
CONCLUSION
Mining resulted in elevated levels of Pb and Zn in the minespoil at the Mines of
Spain, with the surrounding nonspoil soils exhibiting low levels of the metals. Plants growing
in the high Pb and Zn locations (mine spoil) had greater tissue metal concentrations than
those growing in the low Pb and Zn locations (nonspoil). The total Zn concentration, DTPA-
extractable Zn, and the sequentially extracted chemical fractions of Zn all showed linear and
positive relationships with Zn uptake by the roots and shoots of aniseroot and black
snakeroot. Therefore, Zn uptake in the roots and shoots of the two species was a flmction of
Zn content of the soils and could be predicted by total Zn, DTPA-Zn, or all sequentially
extracted Zn fractions. Judged on the basis of higher correlation coefficients, as well as
analytical detection considerations, the DTPA index was the best predictor of Zn
bioavailability for both minespoil and nonspoil soils. Total Pb concentration, DTPA-Pb, and
the sequentially extracted chemical fractions of Pb did not show a conclusive linear
relationship with plant uptake of Pb in the roots and shoots of aniseroot and black snakeroot.
This result indicates that factors other than the soil Pb concentration may be controlling plant
uptake of Pb. Therefore the total soil Pb concentration, DTPA-extractable Pb and the
sequentially extracted chemical fractions of Pb alone may not be good indices for predicting
Pb uptake by plants.
ACKNOWLEDGMENTS
We thank L. Schultz, P. Flemming, and D.A. Laird for assistance in laboratory
analyses, D. Lewis for assistance in identifying the sampled plants, and L. Hundal for helpful
comments on the manuscript. We gratefully acknowledge the Iowa Agriculture and Home
175
Economics Experiment Station for funding the research. Journal Paper No. J-XXXXX of the
Iowa Agriculture and Home Economics Experiment Station, Ames, Iowa. Project No. 33S9,
supported by Hatch Act and State of Iowa funds.
REFERENCES
Asami, T. 1981. The Ichi and Maruyama River basins: Soil pollution by Cd, Zn, Pb, and Cu
discharged from Dnmo Mine. p. 125-136. In K. Kitagishi, and 1. Yamane (eds.) Heavy
metal pollution in soils of Japan. Japan Scientific Society's Press. Tokyo.
Bauchauer, M. 1973. Contamination of soil and vegetation near a Zn smelter by Zn, Cd, Cu,
and Pb. Environ. Sci. Technol. 7:131-135.
Baker, A.J.M. 1981. Accumulators and excluders - Strategies in the response of plants to
heavy metals. J. Plant Nutr. 3: 643-654
Beckett, P.H.T. 1989. The use of extractant in studies on trace metals in soils, sewage
sludges, and sludge treated soils. Adv. Soil Sci., 9:144-176.
Chen, Z. 1992. Metal contamination of flooded soils, rice plants, and surface waters in Asia,
p. 85-108. In D.C. Adriano (eds.) Biogeochemistry of trace metals. Advances in trace
substances research. Lewis Publishers, London.
Chen, J., C. Zheng, F. Wei, Y. Wu, and D.C. Adriano. 1991. Baseline concentrations of
elements in soils of China. Water Air Soil Pollut. 57: 699-712.
Chester, R and Hughes, M.J. 1967. A chemical technique for the separation of ferro-
manganese minerals, carbonate minerals, and adsorbed trace elements from pelagic
sediments. Chem. Geology 2:249-262.
176
Davies, B.E. 1983. A graphical estimation of the normal Pb content of some British soils.
Geoderma 29:67-75.
Dickson, N.M., S.A. Watmough, and A.P Turner. 1996. Ecological impact of 100 years of
metal processing at Prescot, northwest England. Environmental Reviews 4: 18-24.
Doner, H.F. 1978. Chloride as a factor in mobilities of Ni, Cu, and Cd in soil. Soil Sci. Soc.
Am. 42:882-885
Echevairia, G., P.C Vong, C. Leclerc, and J.L. Morel. 1997. Bioavailability of technetium-99
as affected by plant species and growth, application form, and soil incubation. J.
Environ. Qual. 26:947-956.
Freedman, B., and T.C. Hutchinson. 1981. Sources of metal and elemental contamination of
terrestrial environments, p. 35-94. In N.W. Lepp (ed.) Effect of heavy metal pollution
on plants. Metals in the environment. Vol. 2. Applied Science Publishers, London,
UK.
Gimeno, G.E., V. Andreu, and R. Boluda. 1996. Heavy metals incidence in the application of
inorganic fertilizers and pesticides to rice farming soils. Environmental Pollution 92:
19-25.
Gonsior, S.J., J.J. Sorci, M.J. Zoelkier, and B.D. Landenberger. 1997. The effects of EDTA
on metal solubilization in river sediment/water systems. J. Environ. Qual. 26:957-
966.
Hach Company. 1988. Plant tissue and sap analysis manual. Literature code #3118. Hatch
company Loveland, Co.
Haimsen, K., 1977. Behavior of heavy metals in soils. Center for Agricultural Publishing and
documentation, Wageningen.
Jones, L.H.P., L.R. Clement, and M.J. Hopper. 1973. Pb uptake from solution from perennial
ryegrass and its transport from shoots to roots. Plant Soil. 38:403-414.
Kabata-Pendias, A., and H. Pendias. 1984. Trace elements in soils and plants. CRC Press,
Inc. Boca Raton, Florida.
Kabata-Pendias, A., and S. Dudka. 1991. Baseline data for Cd and Pb in soils and smoke
cereals of Poland. Water Air Soil Pollut. 57:723-731.
Koeppe. D.E. 1977. The uptake, distribution and effect of Cd and Pb in plants. Sci. Tot.
Environ. 7:197-206.
Lagerwerff, J.V., and A.W. Specht. 1970. Contamination of roadside soil and vegetation with
Cd, Ni, Pb, and Zn. Environ. Sci. Technol. 4:583-585.
Lindsay, W.L., and F. R. Cox. 1985. Micronutrient soil testing for the tropics. Fert. Res.
7:169-201.
Lindsay, W.L., and W.A Norvell. 1978. Development of a DTPA soil test for Zn, Fe, Mn and
Cu. Soil Sci. Soc. Am. J. 42:421-428.
Loneragan, J.F. 1975. The availability and absorption of trace elements in soil plant systems
and their relation to movement and concentrations of trace elements in plants, p. 109-
134. In Nicholas, D.J and A.R. Egan (ed.) Trace elements in soil-plant-animal
systems. Proceedings of the Jubilee of the Waite Agricultural Research Institute. Glen
Osmund, South Australia.
Ludvigson, G. A., and J.A. Dockal. 1984. Lead and zinc mines in the Dubuque area. Iowa
Geology No.9. Iowa Department of Natural Resources.
Luoma, S.N., and G.W. Bryan. 1978. Factors controlling the availability of sediment-bound
Pb to the estuaiine bivalve scrobicularia plana. J. Mar. Biol. Ass. U.K. 58:793-802

Malone, C., D.E. Koeppe, and R.J. Miller. 1974. Localization of Pb accumulated by com
plants. Plant Physiol. 53:388-394.
McBhde, M.B., 1994. Environmental chemistry of soils. Oxford University Press. New
York.
McLaren, R.G., and D.V. Crawford. 1973. Studies of soil Cu 1. The fractionation of Cu in
soils. J. Soil Sci. 24:172-181.
Mehra, O.P., and M.L. Jackson. 1960. Iron oxide removal from soils and clays by a
dithionite-citrate system buffered by sodium bicarbonate, p. 317-342. In Ada
Swinford (ed.) Clays Clay Miner., Proc. Conf. (7'*', Washington, D.C., 1958).
Pengamon press, Elmsford, NY.
Merckx, R., J.H. Van, J. Sinnaeve, and A. Cremers. 1986. Plant-induced changes in the
rhizosphere of maize and wheat. II. Complexation of Co, Zn, and Mn in rhizosphere
of maize and wheat. Plant Soil 96:95-107.
Miller, W.P., D.C. Martens, and L.W. Zelany. 1986. Effect of sequence in extraction of trace
metals from soils. Soil Sci. Soc. Am. J. 50:598-601
Miller, W.P., and W.W. MC Fee. 1983. Distribution of Cd, Zn, Cu, and Pb in soils of
industrial northwestem Indiana. J. Environ. Qual. 12:29-33.
Moreno, J.L., C. Garcia, and T. Hernandez. 1997. Application of composted sewage sludges
contaminated with heavy metals to agricultural soils: Effect on lettuce growth. Soil
Sci. Plant Nutr. 43:565-573.
Mortvedt, J.J., and P.M. Giordano. 1975. Responses of com to Zn and Cr in municipal
wastes applied to soil. J. Environ. Qual. 4:170-174

Nelson, D.W., and L.E. Sommers. 1982. Total carbon, organic carbon and organic matter, p.
539-577. In Page, A.L., R.H. Miller, D.R. Keeney. (ed.) Methods of soil analysis. Part
2.2nd ed. Agron. Monogr. 9. ASA and SSSA, Madison.
Page, A.L. 1974. Fate and effects of trace elements in sewage sludge when applied to
agricultural lands. EPA Publication no. 670/2-74-005. Cincinnati.
Pettersson, O. 1976. Heavy-metal ion uptake by plants from nutrient solutions with metal
ion, plant species and growth period. Plant Soil 45:445-459.
Prior, J.C. 1991. Landforms of Iowa. University of Iowa Press, Iowa City.
Runkel, S.T., and A.F. Bull. 1987. Wildflowers of Iowa woodlands. Iowa State University
Press.
Sauerbeck, D., H. Barth, and P. Hermite. 1987. Effects of agricultural practices on the
physical, chemical and biological properties of soils, p. 181-210. In Barth, H. (ed.)
Use of sewage sludge and agricultural wastes. Part n. Scientific basis for soil
protection in the European Community. Elsevier Applied Science Publishers.
Barking, Essex. UK
Sauerbeck, D.R. 1991. Plant, element and soil properties governing uptake and availability of
heavy metals derived from sewage sludge. Water Air Soil Pollut. 57:227-237.
Sheppard, M.I., and M. Stephenson. 1995. Critical evaluation of selective extraction methods
for soils and sediments, p. 69-100. In R. Prost (ed.) Third International Conference on
the biogeochemistry of trace elements: Contaminated soils. Paris, France. 15-19 May
1995. INRA Editions. Versailles, France.
180
Schintu, M., A. Kudo, G. Sarritzu and A. Contu. 1991. Heavy metal distribution and
mobilization in sediment from a drinking water reservoir near a mining area. Water
Air Soil Pollut. 57: 329-338.
Shuman, L.M. 198S. Fractionation method for soil microelements. Soil Sci. 140:1:11-23.
Sloan, J.J., R.H. Dowdy, M.S. Dolan, and D.R. Linden. 1997. Long-term effects of biosolids
applications on heavy metal bioavailability in agricultural soils. J. Environ. Qual.
26:966-974.
Soil Survey Staff 1984. Soil survey of Dubuque County, Iowa. USD A, SCS. Washington,
D.C.
Sposito, G., L.J. Lund and A. C. Chang. 1982. Trace metal chemistry in arid-zone field soils
amended with sewage sludge: I. Fractionation of Ni, Cu, Zn, Cd and Pb in solid
phases. Soil Sci. Soc. Am. J. 46:260-264.
Srikanth, R. and S.R P. Reddy. 1991. Lead, cadmium and chromium levels in vegetables
grown in urban sewage sludge. Food Chemistry 40: 229-234.
Srivastava, P.C., and V.C Gupta. 1996. Trace elements in crop production. Science
Publishers Inc., NH.
Stover, R.C., L.£. Sommers, and D.J. Silviera. 1976. Evaluation of metals in wastewater
sludge. J. Water Pollut. Control Fed. 48:2165-2175.
Swennen, R., I.Van Keer, and W. De Vos. 1994. Heavy metal contamination in overbank
sediments of the Geul river (East Belgium): Its relation to former Pb-Zn mining
activities. Environ. Geol. 24:12-21.
Tessier, A., P.G.C. Campbell, and M. Bisson. 1979. Sequential extraction procedure for the
speciation of particulate trace metals. Anal. Chem. 51:7:844-850.

181
Tiller, K.G., and J.F. Hodgson. 1962. The specific sorption of cobalt and Zn by layer
silicates. Clays Clay Miner. 9:393-403.
Wagemann, R., G.J. Brunskill, and B.W. Graham. 1977. Composition and reactivity of some
river sediments from the Mackenzie Valley, N.W.T., Canada. Environ. Geol., 1:349-
358.
Walters, N.F., G.R. Hallberg, and T. Fenton. 1978. Particle size analysis by Iowa State
University Soil Survey Laboratory, p. 61-90. In G.R. Hallberg (ed.) Standard
procedures for evaluation of Quaternary materials in Iowa. Iowa Geological Survey
Tech. Info. Series #8.

182
CHAPTER 6. SUMMARY AND CONCLUSIONS
During the course of soil genesis, different soil forming factors interact to result in
certain processes (e.g. accumulations, removals, translocations and transformations) that lead
to differential distribution of heavy metals in various soil horizons. These distributions and
associations with different soil components play an important role on the availability of
metals for leaching and to living systems. Therefore, the behavior (distribution, chemical
forms, bioavailability, and microenvironment) of heavy metals in soils is best studied in the
context of soil genesis. In this research project, we investigated the behavior of heavy metals
(Pb, Zn, Cu, Ni, and Fe) in soils, and we related the behavior to pedogenic processes over
time. The investigatation was based on chemical extractions, developing eiuichment factor
models, and calculating bioavailability indices of soil samples from different contamination
envirotmients.
The paper in Chapter 2 discussed the morphological and chemical changes of a
tropical Ultisol as f\mction of sewage sludge-amendment. Samples for the study were
collected from a sewage farm at the University of Nigeria where the only source of fertility is
sewage sludge from a domestic origin. At the sewage farm (about 5 ha), two representative
soils at the sludge-amended site and one control soil were identified and studied. The soils
were characterized in terms of physical, chemical and morphological properties. The control
soil was a deq), porous sandy loam with clay content that increased with soil depth. All three
soils were strongly to very strongly acid and contained low amounts of organic matter that
decreased with depth. Their substirface diagnostic horizons were argillic. On the basis of
morphological and chemical properties of the control soil, the soil was classified as a coarse-
183
loamy, siliceous, isohyperthermic Rhodic Kandiustult. Sewage-sludge amendment increased
the total N and total C concentration, cation exchange capacity and the exchangeable bases of
the soils compared to the control soil. Increased biological activities due to sludge-
amendment resulted in better aggregate formation in the surface horizons of the amended
soils. Ferrolytic weathering caused by temporary saturation of soils, may have played a role
in the redistribution of sludge-derived exchangeable bases within the soil profile. After more
than 37 years of sewage sludge amendment, the chemistry of the soil had changed enough to
warrant a reclassification in Soil Taxonomy at the soil order level from Ultisols to Alfisols.
In the experiment examining the long-term effects of metal-enriched sewage sludge
use on the fate of heavy metals in soils (paper in Chapter 3), total metal analysis, sequential
fractionation and DTPA extractions were carried out on the control and sludge-amended soil
samples from Nigeria. Enrichment factors (EF) were calculated for each metal to determine
the degree of enrichment over background levels. The sewage sludge contained high levels of
Zn and Cu but low levels of Pb and Ni. The control soil contained background levels of Zn,
Cu, Pb, and Ni. Compared with the control soil, the sludge-amended soils contained elevated
levels of Zn and Cu, but contained low levels of Pb and Ni. The distribution of the metals in
the sludge-amended soils reflected the concentrations in the UNN sludge and suggested that
the sludge was a source of the metals in the soils. Zinc and Cu in the sewage sludge-amended
soils, were strongly enriched in the topsoil, decreased in concentration with soil depth, and
were more bioavailable than in the control soil.
The paper in Chapter 4 discussed research on the impact of Pb mining on the
pedogenesis of the immediate mine soil environment and redistribution of Pb. Samples for
the research were collected from a mine pit, mine spoil, and a reference soil at an abandoned
184
Pb and Zn mine (Mines of Spain) in Dubuque, Iowa. The soils are mapped as Seaton silt
loam and classified as fine silty, smectitic, mesic, Typic Eutrudept, and Mollic Hapludalf.
Soil profile studies indicated that Pb mining influenced the pedogenesis of the soils of the
immediate mining areas and resulted in the redistribution of Pb in the minesoil profiles.
Sequential extraction studies indicated that Pb in the mine soils was associated with
sesquioxides as well as with soil organic matter by mechanisms that were stronger than
normal ion exchange mechanisms. Microanalytical studies indicated that, depending on the
level of contamination and the nature of the environment of the contamination, SEM/EDX
analysis could be used to localize Pb in association with its microenvironment.
The paper in Chapter 5 discussed the bioavailabilty of Pb in soils around the
nineteenth-century mine near Dubuque, Iowa. The objectives were (a) to determine whether
the native vegetation had taken up Pb and Zn fix>m the mine related soils aAer ISO years of
soil formation and natural vegetation and (b) to develop indices based on chemical forms to
predict the availability of Pb and Zn to plants growing in the spoil. Lead and Zn uptake by
the roots and shoots of wildflower species (anise root and black snakeroot) growing at seven
locations in the Mines of Spain State Recreation Area were determined and correlated with
various soil extractions (16 M HNO3, diethylenetriamine pentacetic acid (DTPA), and four
sequentially extracted fractions). Bioavailability indices derived from sequentially extracted
Pb and Zn fiw:tions were compared with those derived from the HNO3 extraction and the
DTPA extraction to determine which index better predicted Pb and Zn uptake. Sequential
extraction indicated that Pb and Zn occurred mainly in chemical forms that were not readily
available for plant uptake. All extractions of Zn were strongly correlated with plant-tissue Zn
uptake. Tissue Zn concentration in the two wildflower species were better correlated with
185
DTPA-extractable Zn (R^ = 0.95-0.63) than with HNOa-extractable Zn (R^ = 0.85-0.53).
Most sequentially extracted Zn fractions were also correlated with plant-tissue uptake of Zn.
None of the extractions of Pb (HNOa-extractable Pb, DTPA-extractable Pb, and the
sequentially extracted Pb fractions) showed a conclusive relationship with Pb uptake in the
roots and shoots of the sampled species. Based on higher correlation coefficients, the ease of
analysis, as well as analytical detection considerations, the DTPA index is preferred for
predicting Zn uptake by these plants; but none of the soil extractions alone was a good
predictor of Pb uptake by these plants.

186
APPENDIX A: ADDITIONAL INFORMATION FOR CHAPTER 2
Al. LABORATORY IDENTIFICATION OF SAMPLES
Soil sample Lab # Sample Description Location
1 Pedon 1 Apl 0-S cm Nsukka, Nigeria
2 Ap2 S-40 cm
3 Btl 40-SS cm
4 Bt2 55-80
5 Bt3 80-110 cm
6 Bt4 110-180 cm
20 Pedon 2 Ap 0-25 cm
21 Btl 25-60 cm
22 Bt2 60-120 cm
23 Bt3 120-180 cm
24 Pedon 3 Ap 0-15 cm
25 Bw 15-30 cm
26 Btl 30-70 cm
27 Bt2 70-120 cm
28 Bt3 120-190 cm
31 Pedon 1 Al 0-10 cm Dubuque, Iowa
32 A2 10-20 cm
33 BA 20-43 cm
34 Btl 43-50 cm
35 Bt2 50-70 cm
36 Bt3 70-106 cm
37 Pedon 2 A 0-18 cm
38 Bw 18-26 cm

187
39 2Ab 26-45 cm Dubuque, Iowa
40 2BwI 4S-S9 cm L
41 2Bwl 45-59 cm R
42 2Bw2 59-94 cm
43 Pedon 3 A 0-10 cm
44 Bwl 10-17 cm
45 Bw2 17-30 cm
46 2Btl 30-49 cm
47 2Bt2 49-65 cm
48 2Bt3 65-93 cm
50 Location #\ Minespoil
51 Location #2 Minespoil
52 Location #3 Nonspoil
53 Location #4 Nonspoil
54 Location #5 Minespoil
55 Location #6 Nonspoil
56 Location #7 Nonspoil
59 Surface soil sample (Study Two)
60 UNN sewage sludge
a, b, or c - Replications I, 2 or 3
L, R " Different parts of the same soil horizon
OSS "Soil samples from the Old sludge site (Water Pollution Control Facility Research Site,
Ames, Iowa)
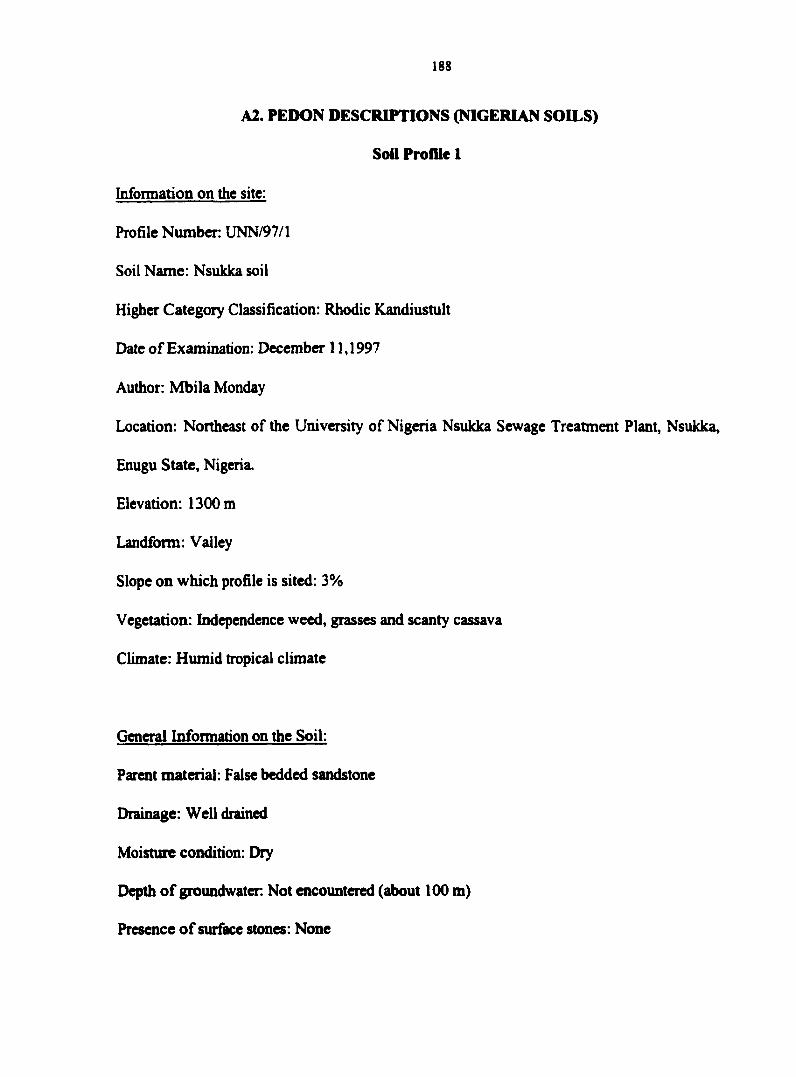
188
A2. PEDON DESCRIPTIONS (NIGERIAN SOILS)
Soil Profile 1
Information on the site:
Profile Number: UNN/97/1
Soil Name: Nsukka soil
Higher Category Classification: Rhodic Kandiustult
Date of Examination: December 11,1997
Author: Mbila Monday
Location: Northeast of the University of Nigeria Nsukka Sewage Treatment Plant, Nsukka,
Enugu State, Nigeria.
Elevation: 1300 m
Landform: Valley
Slope on which profile is sited: 3%
Vegetation: Independence weed, grasses and scanty cassava
Climate: Humid tropical climate
General Information on the Soil:
Parent material: False bedded sandstone
Drainage: Well drained
Moisture condition: Dry
Depth of groundwater. Not encountered (about 100 m)
Presence of surface stones: None
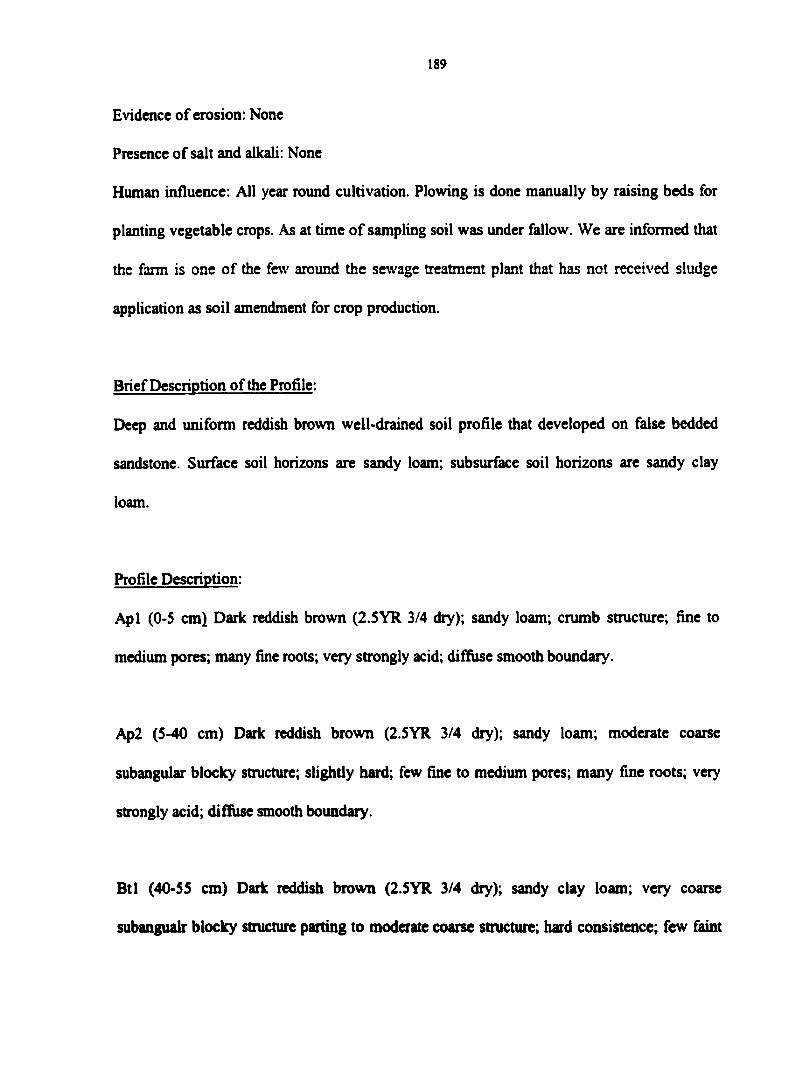
189
Evidence of erosion: None
Presence of salt and alkali: None
Human influence: All year round cultivation. Plowing is done manually by raising beds for
planting vegetable crops. As at time of sampling soil was under fallow. We are informed that
the farm is one of the few around the sewage treatment plant that has not received sludge
application as soil amendment for crop production.
Brief Description of the Profile:
Deep and uniform reddish brown well-drained soil profile that developed on false bedded
sandstone. Surface soil horizons are sandy loam; subsurface soil horizons are sandy clay
loam.
Profile Description:
Apl (0-5 cm] Daric reddish brown (2.5YR 3/4 dry); sandy loam; crumb structure; fine to
medium pores; many fine roots; very strongly acid; diffuse smooth boundary.
Ap2 (5-40 cm) Dark reddish brown (2.5YR 3/4 dry); sandy loam; moderate coarse
subangular blocky structure; slightly hard; few fine to medium pores; many fine roots; very
strongly acid; diffuse smooth boundary.
Btl (40-55 cm) Daric reddish brown (2.5YR 3/4 dry); sandy clay loam; very coarse
subangualr blocky structure parting to moderate coarse structure; hard consistence; few faint
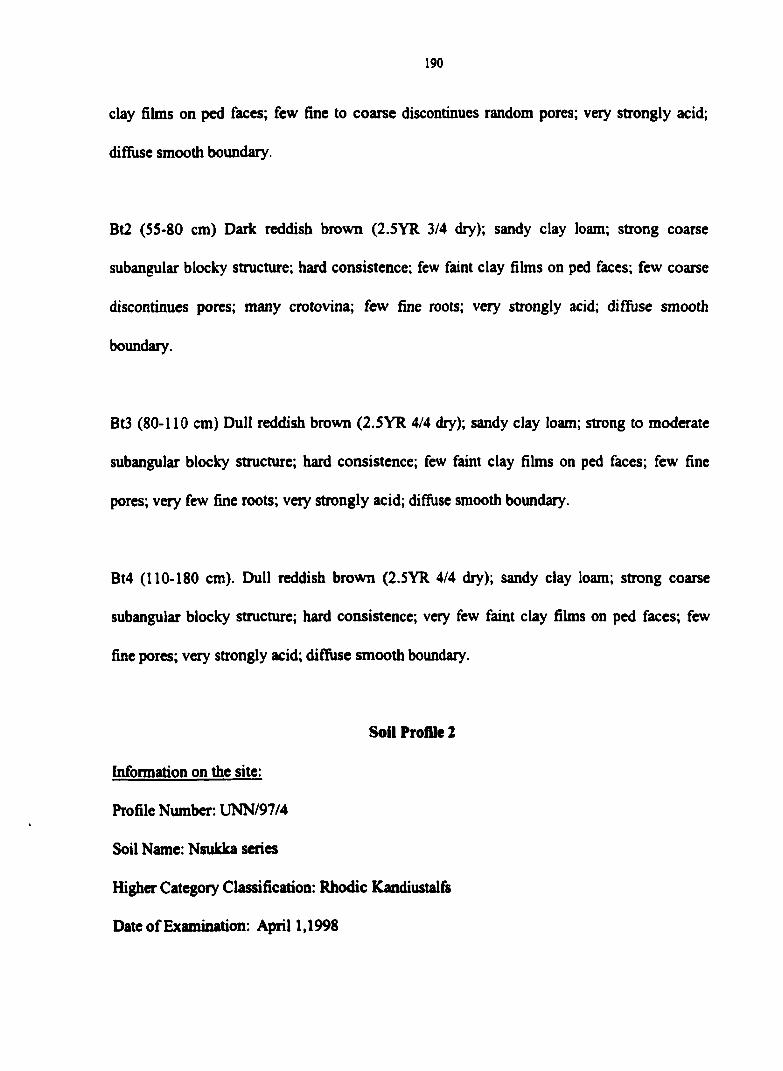
190
clay films on ped faces; few fine to coarse discontinues random pores; very strongly acid;
difiHise smooth boundary.
Bt2 (55-80 cm) Dark reddish brown (2.5YR 3/4 dry); sandy clay loam; strong coarse
subangular blocky structure; hard consistence; few faint clay films on ped faces; few coarse
discontinues pores; many crotovina; few fine roots; very strongly acid; diffuse smooth
boundary.
Bt3 (80-110 cm) Dull reddish brown (2.5YR 4/4 dry); sandy clay loam; strong to moderate
subangular blocky structure; hard consistence; few faint clay fibns on ped faces; few fine
pores; very few fine roots; very strongly acid; diffuse smooth boundary.
Bt4 (110-180 cm). Dull reddish brown (2.5YR 4/4 dry); sandy clay loam; strong coarse
subangular blocky structure; hard consistence; very few faint clay films on ped faces; few
fine pores; very strongly acid; diffuse smooth boundary.
Sou Profile 2
Information on the site:
Profile Ntmiber: lJNN/97/4
Soil Name: Nsukka series
Higher Category Classification: Rhodic Kandiustalfs
Date of Examination: April 1,1998

191
Author: Mbila Monday
Location: University of Nigeria Sewage Treatment Plant. Northeast of the campus at the
Sewage Farms.
Elevation: 1300 m
Landform: Valley
Slope on which profile is sited: 2%
Vegetation: Arable land currently imder cassava and vegetables
Climate: Humid tropical climate
General Information on the Soil:
Parent material False bedded sandstone
Drainage: Moderately well drained
Moisture condition: Top 100 cm of the soil profile is somewhat dry. Below that is moist.
Depth of groundwater: Groundwater not encountered, but believed to be about 100m
Presence of surface stones: None
Evidence of erosion: None
Presence of salt and alkali: None
Human influence: Soil has been disturbed through cultivation of the land for agriculture. Soil
is presently being used for tuber and vegetable crops, and irrigated with wastewater from the
university sewage plant.
Brief Description of the Profile:
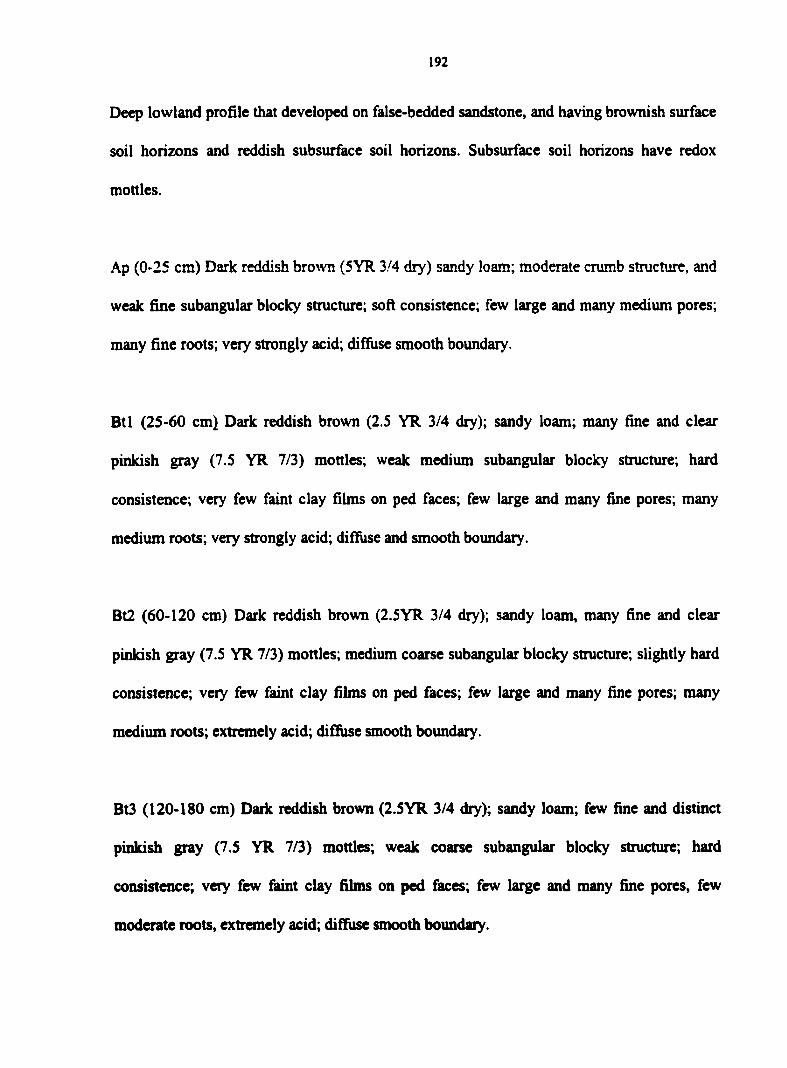
192
Deep lowland profile that developed on false-bedded sandstone, and having brownish surface
soil horizons and reddish subsurface soil horizons. Subsurface soil horizons have redox
mottles.
Ap (0-25 cm) Dark reddish brown (SYR 3/4 dry) sandy loam; moderate crumb structure, and
weak fine subangular blocky structure; soft consistence; few large and many medium pores;
many fine roots; very strongly acid; diffuse smooth boundary.
Btl (25-60 cm} Dark reddish brown (2.5 YR 3/4 dry); sandy loam; many fine and clear
pinkish gray (7.5 YR 7/3) mottles; weak medium subangular blocky structure; hard
consistence; very few faint clay fihns on ped faces; few large and many fine pores; many
medium roots; very strongly acid; diffuse and smooth boundary.
Bt2 (60-120 cm) Dark reddish brown (2.5YR 3/4 dry); sandy loam, many fine and clear
pinkish gray (7.5 YR 7/3) mottles; medium coarse subangular blocky structure; slightly hard
consistence; very few faint clay films on ped faces; few large and many fine pores; many
medium roots; extremely acid; diffuse smooth boundary.
Bt3 (120-180 cm) Dark reddish brown (2.5YR 3/4 dry); sandy loam; few fine and distinct
pinkish gray (7.5 YR 7/3) mottles; weak coarse subangular blocky structure; hard
consistence; very few faint clay films on ped faces; few large and many fine pores, few
moderate roots, extremely acid; diffuse smooth boundary.
193
Soil Profile 3
Infonnation on the site:
Profile Number: UNN/97/5
Soil Name: Nsukka series
Higher Category Classification: Rhodic Kandiustalf
Date of Examination: April 1,1998
Author: Mbila Monday
Location: University of Nigeria sewage treatment plant.
Elevation: 1300 m
Landform: Valley
Slope on which profile is sited: 2%
Vegetation: Arable land currently under cassava and vegetables
Climate: Humid Tropical climate
General Information on the Soil:
Parent material: False bedded sandstone
Drainage: Moderately well drained
Moisture condition: Top 100 cm of the soil profile is somewhat dry. Below that is moist.
Depth of groundwater: Groundwater not encountered (about 100m depth).
Presence of surface stones: None
Evidence of erosion: None
194
Presence of salt and alkali: None
Human influence: Soil has been disturbed through cultivation of the land for agriculture. Soil
is presently being used for tuber and vegetable crops and irrigated with wastewater from the
University Sewage Treatment Plant.
Brief Description of the Profile:
Deep lowland profile that developed on false-bedded sandstone with brownish topsoil and
reddish subsoil. Subsoil has redox mottles.
Ap (0-15 cm) Dark reddish brown (SYR 3/4 dry); sandy loam; medium moderate crumbs
structure, and weak fine subangular blocky structure; soft consistence; many fine and
medium pores; many roots; extremely acid; diffuse smooth boundary.
Bw (15-30 cm) Dark reddish brown (2.5 YR 3/4 dry); sandy loam; many medium and clear
pinkish white (7.5 YR 8/3) mottles; moderate fine subangular blocky struct\ire; hard; few
large and many fine pores; many medium roots; extremely acid; diffuse and smooth
boundary.
Btl (30-70 cm) Dark reddish brown (2.5YR 3/4 dry); sandy loam; many medium and clear
pinkish white (7.5 YR 8/3) mottles; medium coarse subangular blocky structure; slightly hard
consistcnce; very few faint clay films on ped faces; few large and many fine pores; many
medium roots; extremely acid; dif!vise smooth boundary.

195
Bt2 (70-120 cm) Dark reddish brown (2.5YR 3/4 dry); sandy loam; many medium and clear
pinkish white (7.5 YR 8/3) mottles; weak coarse subangular blocky structure; very hard
consistence; very few faint clay films on ped faces; few fine pores, few moderate roots, very
strongly acid; diffuse smooth boundary.
Bt3 (120-190 cm) Dark reddish brown (2.5YR 3/6 dry); sandy loam; few medium and clear
pinkish white (7.5 YR 8/3) mottles; moderate medium subangular blocky structure; very hard
consistence; very few faint clay films on ped faces; few fine pores; strongly acid; diffuse
smooth boundary.
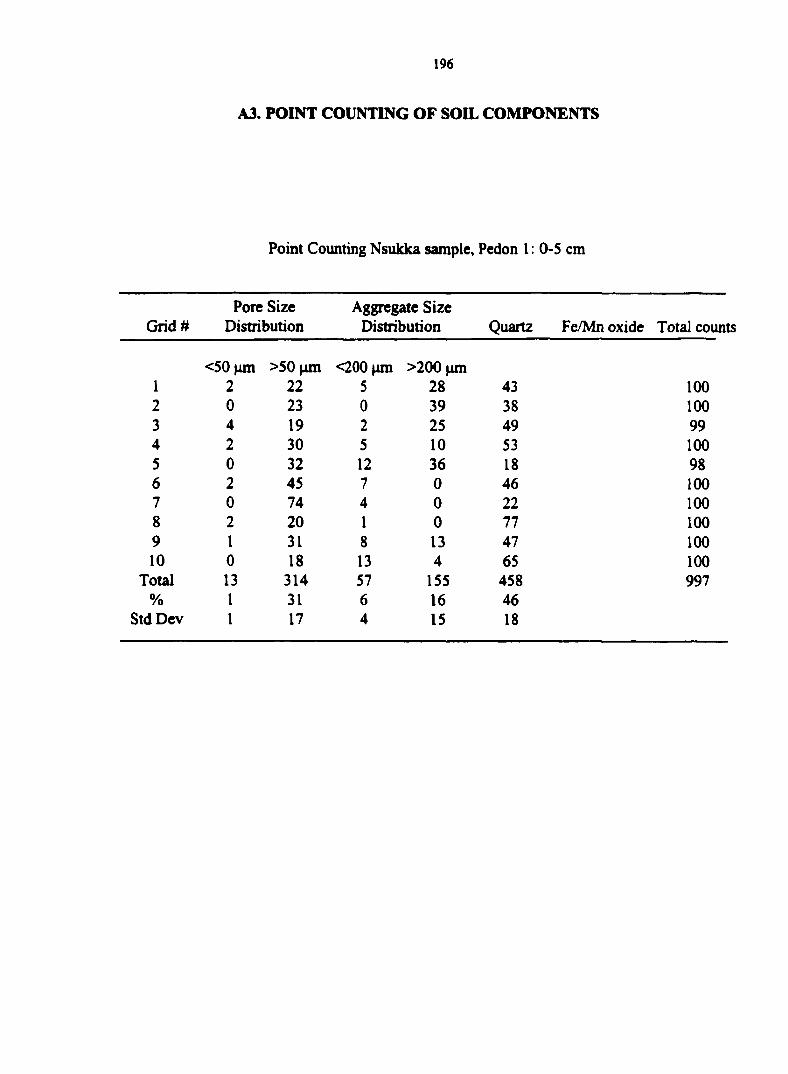
196
A3. POINT COUNTING OF SOIL COMPONENTS
Point Counting Nsukka sample, Pedon 1; 0-S cm
Pore Size Aggregate Size Grid # Distribution Distribution Quartz Fe/Mn oxide Total counts
<50 ^m >50 ^m <200 jun V
K)
O
0
1
1 2 22 5 28 43 100 2 0 23 0 39 38 100 3 4 19 '> 25 49 99 4 2 30 5 10 53 100 5 0 32 12 36 18 98 6 2 45 7 0 46 100 7 0 74 4 0 22 100 8 2 20 1 0 77 100 9 1 31 8 13 47 100 10 0 18 13 4 65 100
Total 13 314 57 155 458 997 % 1 31 6 16 46
td Dev 1 17 4 15 18
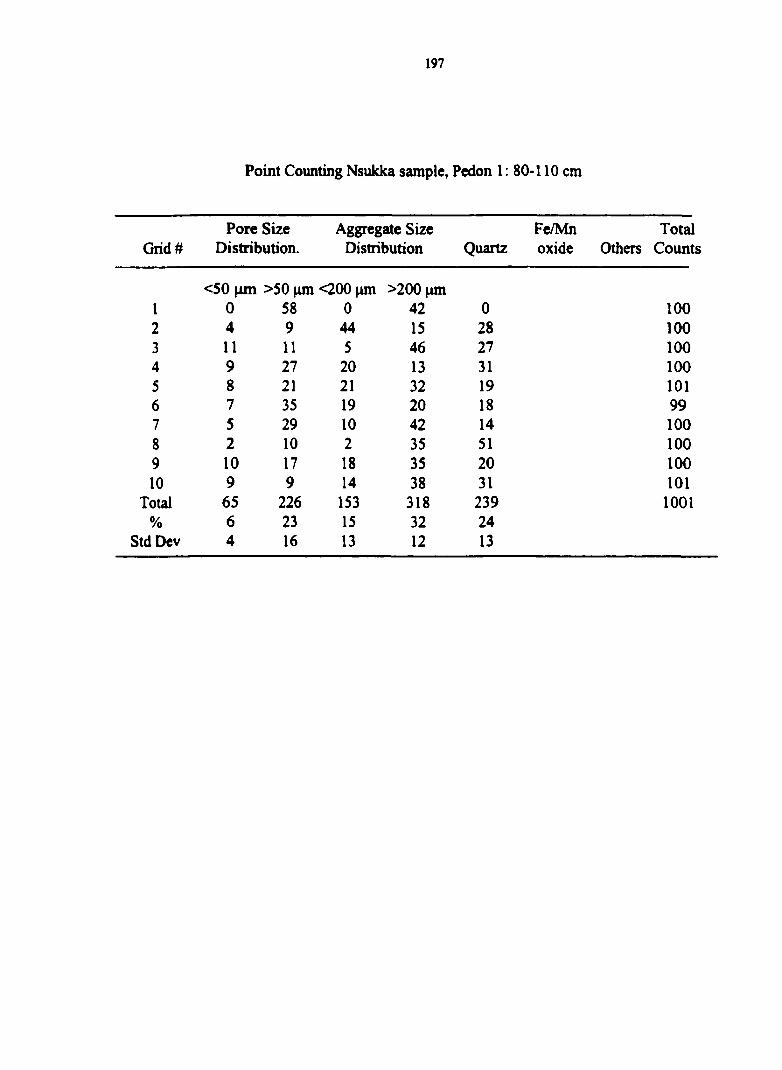
Grid
1 2 3 4 5 6 7 8 9 10
Total %
Total Counts
100
100
100
100 101 99
100
100
100 101
1001
197
Point Counting Nsukka sample, Pedon 1: 80-110 cm
Pore Size Aggregate Size Fe/Mn Distribution. Distribution Quartz oxide
<50 >50 |im <200 >200 |im 0 58 0 42 0 4 9 44 15 28 11 11 5 46 27 9 27 20 13 31 8 21 21 32 19 7 35 19 20 18 5 29 10 42 14 2 10 2 35 51 10 17 18 35 20 9 9 14 38 31 65 226 153 318 239 6 23 15 32 24 4 16 13 12 13

198
Point Counting Nsukka sample, Pedon 2: 0-2S cm
Pore Size Aggregate Size Fe/Mn Total Grid # Distribution. Distribution Quartz oxide OM Counts
<50 nm >50 ^un <200 ^m >200 |im 1 4 15 6 46 25 4 0 100 2 0 73 5 17 5 0 0 100 3 8 35 23 30 0 0 0 96 4 2 12 5 6 80 0 0 105 5 5 30 18 11 26 0 11 101 6 10 32 26 0 33 0 0 101 7 0 66 5 5 24 0 0 100 8 7 4 8 36 45 0 0 100 9 2 44 1 23 31 0 0 101 10 2 62 7 29 0 0 0 100
Total 40 373 104 203 269 4 11 1004 % 4 37 10 20 27 0 1
Std Dev 3 24 9 15 24 1 3

199
Point Counting Nsukka sample, Pedon 2: 60-120 cm
Grid # Aggregate Size Fe/Mn Total Pore Size Dist. Dist Quartz Oxide Others Counts
<50 |im >50 |im <200 >200 nm 1 8 17 9 44 23 101 2 4 28 21 15 30 98 3 7 30 9 26 29 101 4 4 31 31 10 24 100 5 8 36 24 0 31 99 6 14 41 12 0 33 100 7 0 25 3 67 5 100 8 7 23 0 67 0 97 9 4 10 10 21 53 98 10 0 24 5 48 22 99
Total 48 265 115 298 227 953 % 5 28 12 31 24
Std Dev 4 9 10 25 15

200
Point Counting Nsukka sample, Pedon 3: 0-15 cm
Fe/Mn Total Grid # Pore Size Dist. Aggregate Size Dist Quartz oxide Others Counts
<50 ^m >50 (im <200 ^m
1
o
o
<N A
1 0 37 0 19 44 100 2 7 38 5 38 12 100 3 2 15 20 0 63 100 4 5 28 7 30 30 100 5 5 46 5 37 7 100 6 0 9 4 75 12 100 7 6 3 21 0 70 100 8 4 20 23 0 54 101 9 4 50 23 0 23 100 10 2 30 29 0 42 103
Total 35 276 137 199 357 1004 % 3 27 14 20 36
Std Dev 2 16 10 25 22
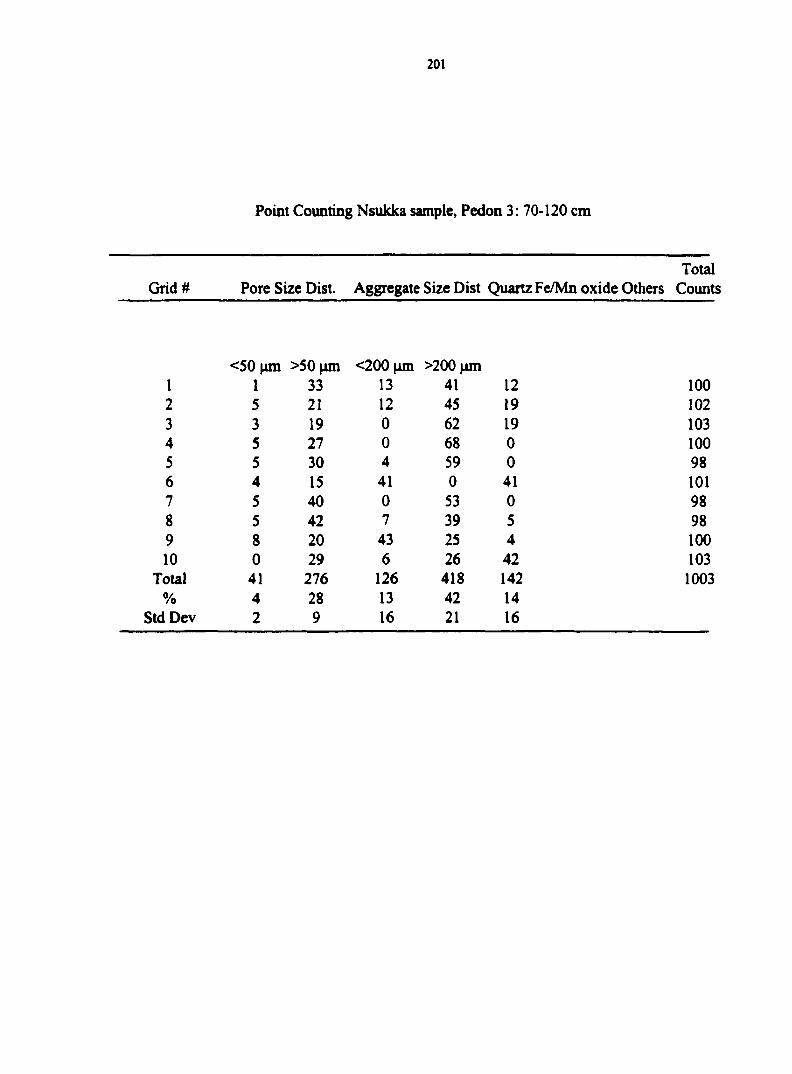
201
Point Counting Nsukka sample, Pedon 3: 70-120 cm
Total Grid # Pore Size Dist. Aggregate Size Dist Quartz Fe/Mn oxide Others Counts
<50 |im >50 |im <200 >200 ^m 1 1 33 13 41 12 100 2 5 21 12 45 19 102 3 3 19 0 62 19 103 4 5 27 0 68 0 100 5 5 30 4 59 0 98 6 4 15 41 0 41 101 7 5 40 0 53 0 98 8 5 42 7 39 5 98 9 8 20 43 25 4 100 10 0 29 6 26 42 103
Total 41 276 126 418 142 1003 % 4 28 13 42 14
Std Dev 2 9 16 21 16
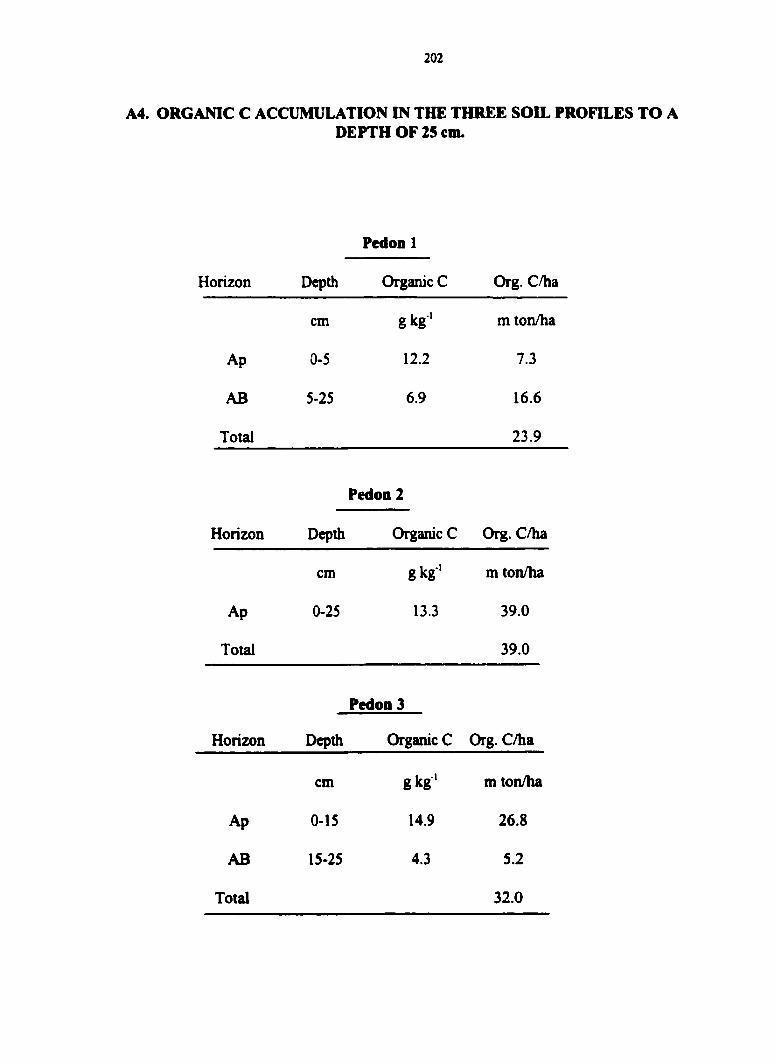
202
A4. ORGANIC C ACCUMULATION IN THE THREE SOIL PROFILES TO A DEPTH OF 25 cm.
Pedon 1
Horizon Depth Organic C Org. C/ha
cm g k g ' m ton/ha
Ap 0-5 12.2 7.3
AB 5-25 6.9 16.6
Total 23.9
Pedoa 2
Horizon Dqjth Organic C Org. C/ha
cm g k g ' m ton/ha
Ap 0-25 13.3 39.0
Total 39.0
Pedon 3
Horizon Dq)th Organic C Org. C/ha
cm g k g ' m ton/ha
Ap 0-15 14.9 26.8
AB 15-25 4.3 5.2
Total 32.0

203
Recalculating the Organic C content at diflerent horizons -example (Pedon 1 0-25 cm)
Assumptions: 1. Sludge-soil incorporation depth = 0-2S cm 2. Bulk density of top 25-cm soil =1.2 Mg m'^ soil 3. 1 ha = 10,000 m-'
Ap horizon = 0-5 cm, organic C = 12.2 g kg ' Amount of soil (5 cm depth/ha) = 10,000 m' x 1.2 Mg m'^ x 1000 kg Mg ' x 0.05 m = 600,000 kg soil.
1 kg soil = 12.2 g organic C. Therefore, 600,000 kg soil = 600,000 x 12.2 g = 7.32 xlO* g organic C =7.3 metric ton organic C/ha
AB horizon = 5-40 cm Organic C = 6.9 g kg ' (recalculation depth = 5-25 cm)
Amount of soil (2-25 cm) = 10,000 m ' x 1.2 Mg m'^ x 1000 Mg kg' x 0.20 m = 2400,000 kg soil.
1 kg soil = 6.9 g organic C. Therefore, 2400,000 kg soil = 2400,000 x 6.9 g = 16.56 xlO* g organic C =16.6 metric ton organic C/ha.
Total organic C /ha (7.3 ton/ha + 16.6 ton/ha) = 23.9 metric ton organic C/ha in top 25-cm of
pedon 1.
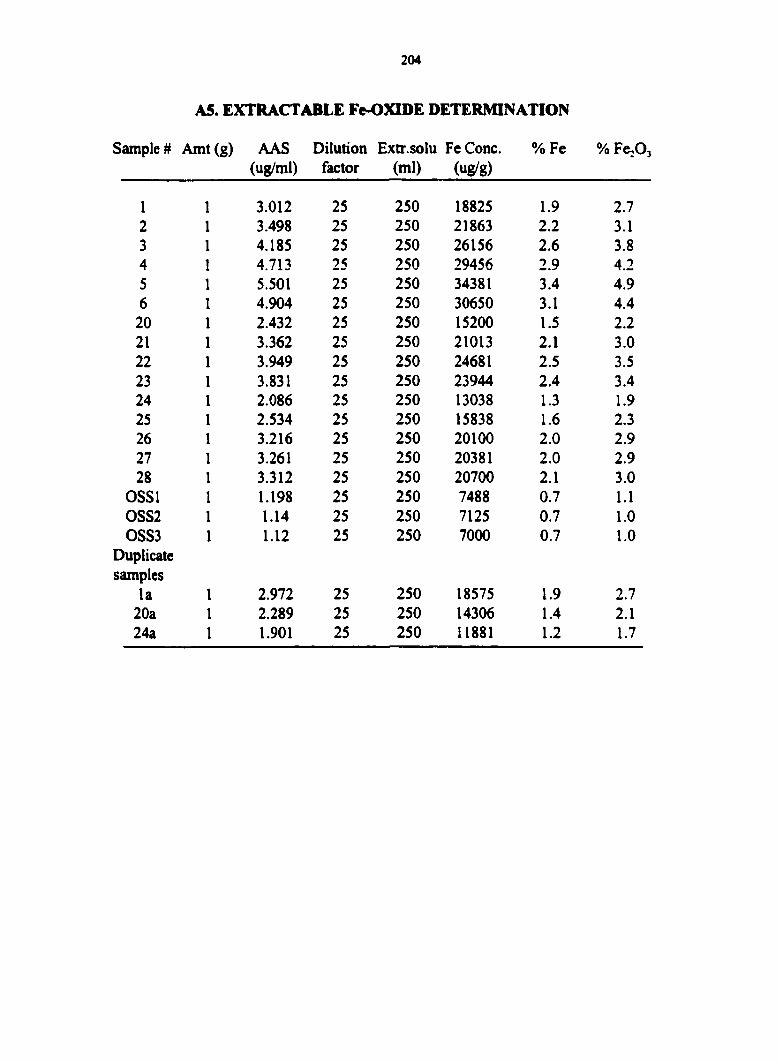
204
A5. EXTRACT ABLE Fe-OXIDE DETERMINATION
Sample# Amt(g) AAS Dilution Extr.solu FeConc. %Fe "/oFejOj (ug/ml) factor (ml) (ug/g)
1 3.012 25 250 18825 1.9 2.7 2 3.498 25 250 21863 2.2 3.1 3 4.185 25 250 26156 2.6 3.8 4 4.713 25 250 29456 2.9 4.2 5 5.501 25 250 34381 3.4 4.9 6 4.904 25 250 30650 3.1 4.4 20 2.432 25 250 15200 1.5 2.2 21 3.362 25 250 21013 2.1 3.0 22 3.949 25 250 24681 2.5 3.5 23 3.831 25 250 23944 2.4 3.4 24 2.086 25 250 13038 1.3 1.9 25 2.534 25 250 15838 1.6 2.3 26 3.216 25 250 20100 2.0 2.9 27 3.261 25 250 20381 2.0 2.9 28 3.312 25 250 20700 2.1 3.0
OSSl 1.198 25 250 7488 0.7 1.1 0SS2 1.14 25 250 7125 0.7 1.0 0SS3 1.12 25 250 7000 0.7 1.0
>uplicate amples
la 2.972 25 250 18575 1.9 2.7 20a 2.289 25 250 14306 1.4 2.1 24a 1.901 25 250 11881 1.2 1.7
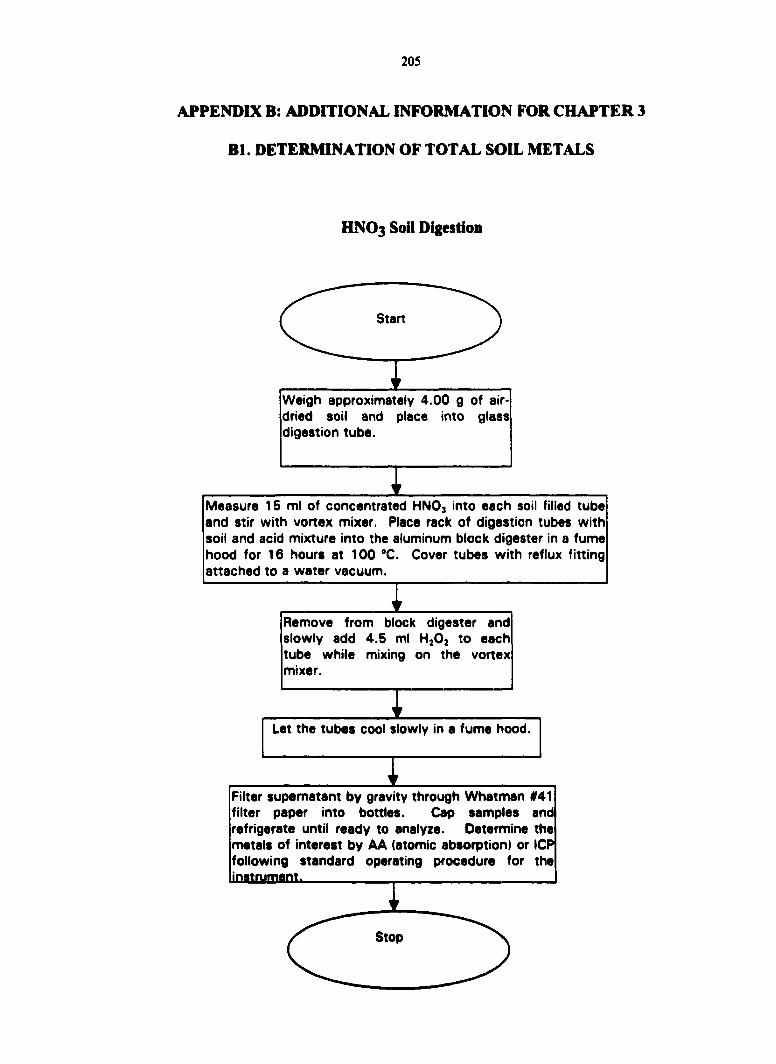
205
APPENDIX B: ADDITIONAL INFORMATION FOR CHAPTER 3
BL DETERMINATION OF TOTAL SOIL METALS
HNO3 Soil Digestion
Start
Stop
Let the tubes cool slowly in a fume hood.
Weigh approximately 4.00 g of air-dried soil and place into glass digestion tube.
Remove from block digester and slowly add 4.5 ml HjOj to each tube while mixing on the vortex mixer.
Filter supernatant by gravity through Whatman #41 filter paper into bottles. Cap samples and refrigerate until ready to analyze. Determine the metals of interest by AA (atomic absorption) or ICP following standard operating procedure for the inatrumem.
Measure 15 ml of concentrated HNO3 into each soil filled tube and stir with vortex mixer. Place rack of digestion tubes with soil and acid mixture into the aluminum block digester in a fume hood for 16 hours at 100 "C. Cover tubes with reflux fitting attached to a water vacuum.
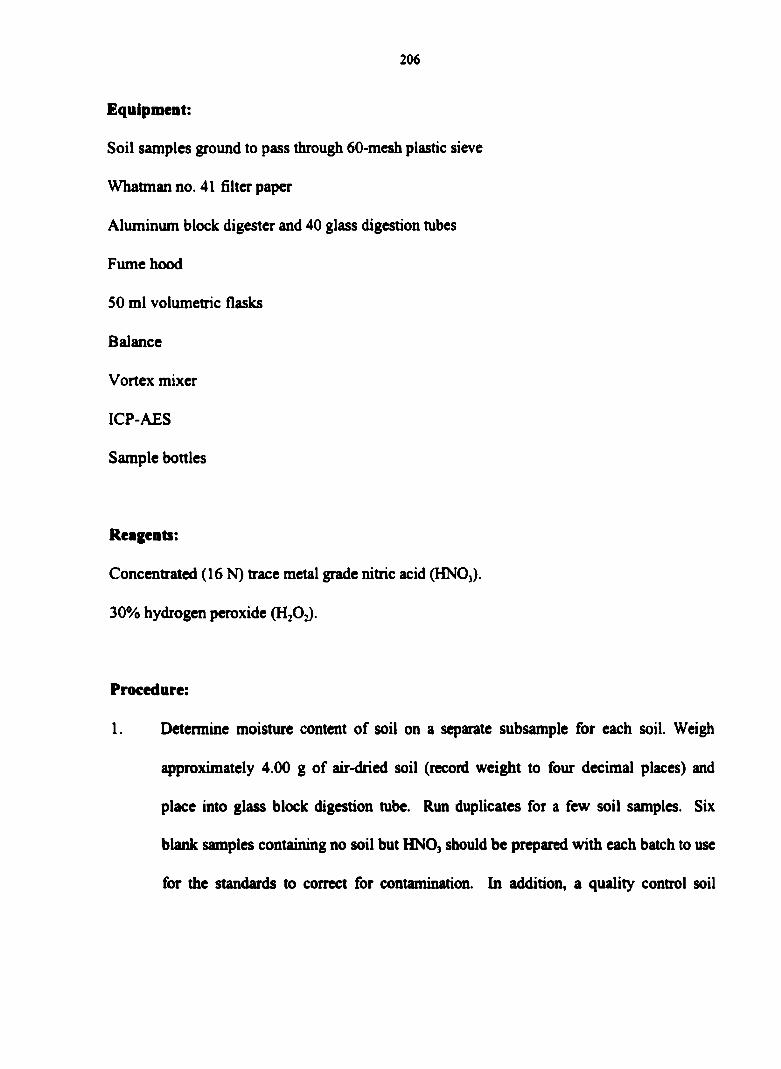
206
Equipment:
Soil samples ground to pass through 60-mesh plastic sieve
Whatman no. 41 filter paper
Aluminum block digester and 40 glass digestion tubes
Fume hood
SO ml volumetric flasks
Balance
Vortex mixer
ICP-AES
Sample bottles
Reagents:
Concentrated (16 N) trace metal grade nitric acid (HNO,).
30% hydrogen peroxide (HiOj).
Procedure:
1. Determine moisture content of soil on a separate subsample for each soil. Weigh
approximately 4.00 g of air-dried soil (record weight to four decimal places) and
place into glass block digestion tube. Run duplicates for a few soil samples. Six
blank samples containing no soil but HNO, should be prepared with each batch to use
for the standards to correct for contamination. In addition, a quality control soil
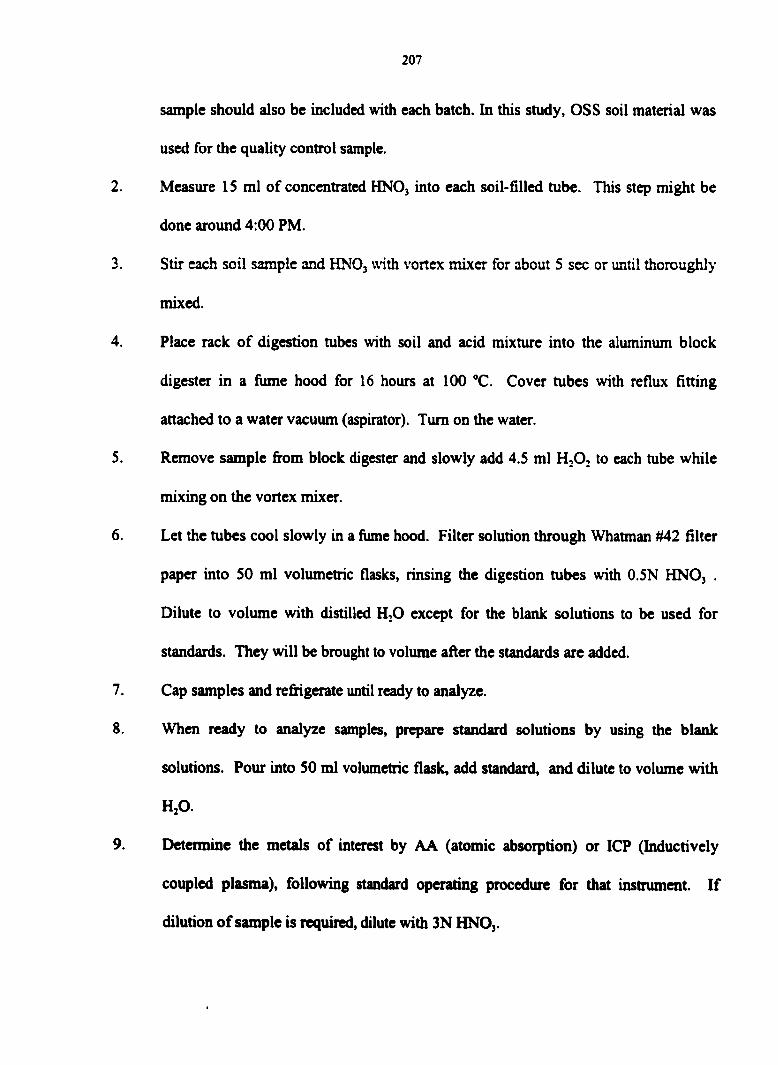
sample should also be included with each batch. In this study, OSS soil material was
used for the quality control sample.
2. Measure IS ml of concentrated HNO, into each soil-filled tube. This step might be
done around 4:00 PM.
3. Stir each soil sample and HNOj with vortex mixer for about 5 see or until thoroughly
mixed.
4. Place rack of digestion tubes with soil and acid mixture into the aluminum block
digester in a fume hood for 16 hours at 100 °C. Cover tubes with reflux fitting
attached to a water vacuum (aspirator). Turn on the water.
5. Remove sample from block digester and slowly add 4.S ml to each tube while
mixing on the vortex mixer.
6. Let the tubes cool slowly in a fiune hood. Filter solution through Whatman #42 filter
paper into SO ml volumetric flasks, rinsing the digestion tubes with 0.5N HNO, .
Dilute to volume with distilled H^O except for the blank solutions to be used for
standards. They will be brought to volume after the standards are added.
7. Cap samples and refrigerate until ready to analyze.
8. When ready to analyze samples, prepare standard solutions by using the blank
solutions. Pour into SO ml volumetric flask, add standard, and dilute to volume with
HjO.
9. Determine the metals of interest by AA (atomic absorption) or ICP (Inductively
coupled plasma), following standard operating procedure for that instrument. If
dilution of sample is required, dilute with 3N HNO,.

208
Reference:
Miller, W.P., and W.W. McFee. 1982. Distribution of Cd, Zn, Cu, and Pb in soils of
industrial northwestern Indiana: J. Environ. Qual. 12:29-33.

209
B2. SPECTRAL INTERFERENCE CORRECTION ON THE ICP
Selected wavelengths for elements to be deteimined on the ICP are rarely free from spectral
interferences from other elements, especially when those other elements are present in very
high concentrations. The soil samples from Nigeria contained very high concentrations of Al,
Fe, and P, but generally low concentrations of trace elements. Therefore, in determining the
trace metal concentrations of the sample, it was essential that the spectral interferences from
Al, Fe, and P be corrected by calculating a correction factor that was used to adjust the trace
element readings. The correction procedure was adapted from the ICP manufacturer's
instructions.
Example (Sample la -Pedon 1,0-S cm Nigeria)
If a sample containing 10,000 ug Al ml ' solution, and 0 ug Pb ml ' is run on ICP, the reading
on the Al channel will be 10,000 ppm, and the reading on the Pb channel will be 4.28 ppm.
Therefore 1 ppm Al interferes with the Pb channel by a factor [4.28/10,000] = 0.000428.
Although this value seems low, it can become a huge error for samples with very high Al
content. For instance, a sample with Al concentration of 2273 ppm, and Pb reading of 1.91
ppm, a spectral interference correction factor can be made as follows:
Spectral Interference Correction factor = [(2273 x 4.28)/l0,000] = 0.97 ppm
Therefore corrected Pb concentration = 1.91- 0.97 = 0.94 ppm (0.94 Pb ug ml ' solution)
50 ml extract = 0.94 x 50 = 47 ug.
4 g soil was used for the digestion (47/4) = 11.75 12 ug g '

210
Spectral interference correction of A1 was done for Pb, while Zn and Cu values were
corrected for interference from Fe and P.
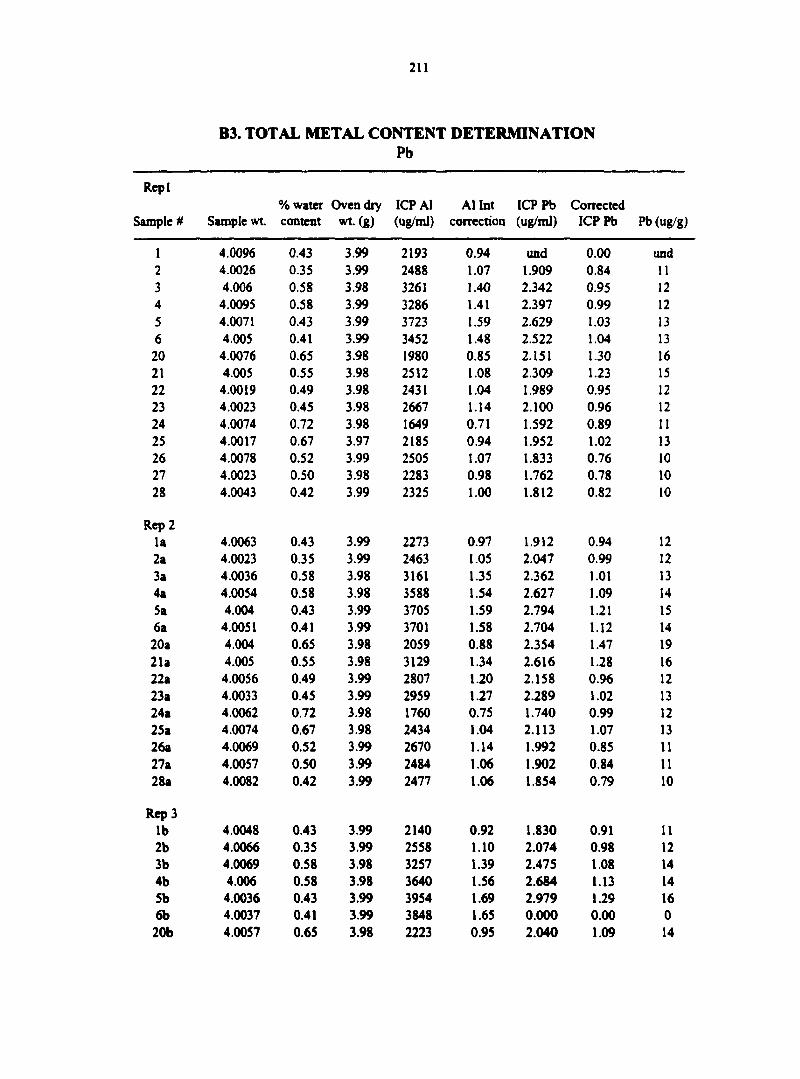
211
B3. TOTAL METAL CONTENT DETERMINATION Pb
Repl % water Oven dry ICPAl A1 Int ICPPb Corrected
impie # Sample wt content wt.(g) (ug/ml) correction (ug/ml) ICPPb Pb (ug/g)
I 4.0096 0.43 3.99 2193 0.94 und 0.00 und 2 4.0026 0.35 3.99 2488 1.07 1.909 0.84 11 3 4.006 0.58 3.98 3261 1.40 2.342 0.95 12 4 4.0095 0.58 3.99 3286 1.41 2.397 0.99 12 5 4.0071 0.43 3.99 3723 1.59 2.629 1.03 13 6 4.005 0.41 3.99 3452 1.48 2.522 1.04 13 20 4.0076 0.65 3.98 1980 0.85 2.151 1.30 16 21 4.005 0.55 3.98 2512 1.08 2.309 1.23 15 22 4.0019 0.49 3.98 2431 1.04 1.989 0.95 12 23 4.0023 0.45 3.98 2667 1.14 2.100 0.96 12 24 4.0074 0.72 3.98 1649 0.71 1.592 0.89 11 25 4.0017 0.67 3.97 2185 0.94 1.952 1.02 13 26 4.0078 0.52 3.99 2505 1.07 1.833 0.76 10 27 4.0023 0.50 3.98 2283 0.98 1.762 0.78 10 2S 4.0043 0.42 3.99 2325 1.00 1.812 0.82 10
Rq> 2 la 4.0063 0.43 3.99 2273 0.97 1.912 0.94 12 2a 4.0023 0.35 3.99 2463 1.05 2.047 0.99 12 3a 4.0036 0.58 3.98 3161 1.35 2.362 1.01 13 4a 4.0054 0.58 3.98 3588 1.54 2.627 1.09 14 5a 4.004 0.43 3.99 3705 1.59 2.794 1.21 15 6a 4.0051 0.41 3.99 3701 1.58 2.704 1.12 14 20a 4.004 0.65 3.98 2059 0.88 2.354 1.47 19 21a 4.005 0.55 3.98 3129 1.34 2.616 1.28 16 22a 4.0056 0.49 3.99 2807 1.20 2.158 0.96 12 23a 4.0033 0.45 3.99 2959 1.27 2.289 1.02 13 24a 4.0062 0.72 3.98 1760 0.75 1.740 0.99 12 2Sa 4.0074 0.67 3.98 2434 1.04 2.113 1.07 13 26a 4.0069 0.52 3.99 2670 1.14 1.992 0.85 11 27a 4.0057 0.50 3.99 2484 1.06 1.902 0.84 11 28a 4.0082 0.42 3.99 2477 1.06 1.854 0.79 10
Rq> 3 lb 4.0048 0.43 3.99 2140 0.92 1.830 0.91 11 2b 4.0066 0.35 3.99 2558 1.10 2.074 0.98 12 3b 4.0069 0.58 3.98 3257 1.39 2.475 1.08 14 4b 4.006 0.58 3.98 3640 1.56 2.684 1.13 14 5b 4.0036 0.43 3.99 3954 1.69 2.979 1.29 16 6b 4.0037 0.41 3.99 3848 1.65 0.000 0.00 0 20b 4.0057 0.65 3.98 2223 0.95 2.040 1.09 14
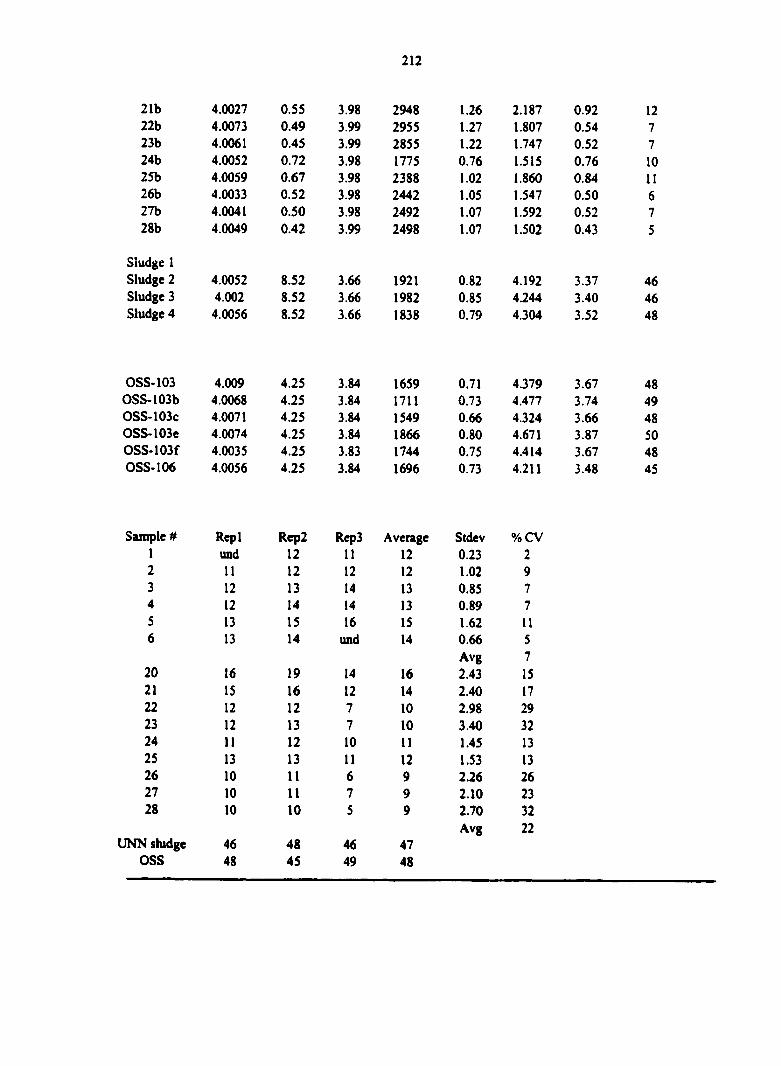
12 7 7 10 11 6 7 5
46 46 48
48 49 48 50 48 45
212
4.0027 0.55 3.98 2948 1.26 2.187 0.92 4.0073 0.49 3.99 2955 1.27 1.807 0.54 4.0061 0.45 3.99 2855 1.22 1.747 0.52 4.0052 0.72 3.98 1775 0.76 1.515 0.76 4.0059 0.67 3.98 2388 1.02 1.860 0.84 4.0033 0.52 3.98 2442 1.05 1.547 0.50 4.0041 0.50 3.98 2492 1.07 1.592 0.52 4.0049 0.42 3.99 2498 1.07 1.502 0.43
4.0052 8.52 3.66 1921 0.82 4.192 3.37 4.002 8.52 3.66 1982 0.85 4.244 3.40 4.0056 8.52 3.66 1838 0.79 4.304 3.52
4.009 4.25 3.84 1659 0.71 4.379 3.67 4.0068 4.25 3.84 1711 0.73 4.477 3.74 4.0071 4.25 3.84 1549 0.66 4.324 3.66 4.0074 4.25 3.84 1866 0.80 4.671 3.87 4.0035 4.25 3.83 1744 0.75 4.414 3.67 4.0056 4.25 3.84 1696 0.73 4.211 3.48
Repl Rq)2 Rep3 Average Stdev %CV und 12 11 12 0.23 2 11 12 12 12 1.02 9 12 13 14 13 0.85 7 12 14 14 13 0.89 7 13 15 16 15 1.62 11 13 14 und 14 0.66 5
Avg 7 16 19 14 16 2.43 15 15 16 12 14 2.40 17 12 12 7 10 2.98 29 12 13 7 10 3.40 32 11 12 10 11 1.45 13 13 13 11 12 1.53 13 10 11 6 9 2.26 26 10 11 7 9 2.10 23 10 10 5 9 2.70 32
Avg 22 46 48 46 47 48 45 49 48
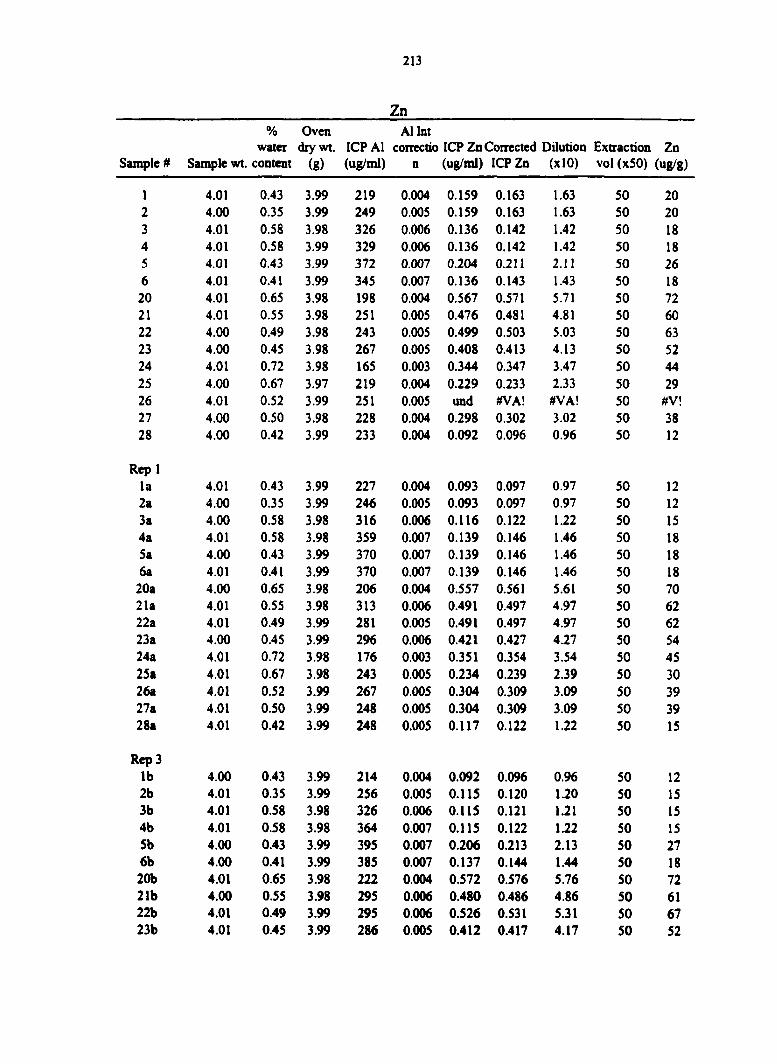
213
Zn % Oven A1 Int
water drywt ICPAl correctio ICP Zn Corrected Dilution Extraction Zn Sample# Samplewt. content (g) (ug/ml) n (ug/ml) ICPZn (xlO) vol(x50) (ug/g)
1 4.01 0.43 3.99 219 0.004 0.159 0.163 1.63 50 20 2 4.00 0.35 3.99 249 0.005 0.159 0.163 1.63 50 20 3 4.01 0.58 3.98 326 0.006 0.136 0.142 1.42 50 18 4 4.01 0.58 3.99 329 0.006 0.136 0.142 1.42 50 18 5 4.01 0.43 3.99 372 0.007 0.204 0.211 2.11 50 26 6 4.01 0.41 3.99 345 0.007 0.136 0.143 1.43 50 18 20 4.01 0.65 3.98 198 0.004 0.567 0.571 5.71 50 72 21 4.01 0.55 3.98 251 0.005 0.476 0.481 4.81 50 60 22 4.00 0.49 3.98 243 0.005 0.499 0.503 5.03 50 63 23 4.00 0.45 3.98 267 0.005 0.408 0.413 4.13 50 52 24 4.01 0.72 3.98 165 0.003 0.344 0.347 3.47 50 44 25 4.00 0.67 3.97 219 0.004 0.229 0.233 2.33 50 29 26 4.01 0.52 3.99 251 0.005 and #VA! #VA! 50 #V! 27 4.00 0.50 3.98 228 0.004 0.298 0.302 3.02 50 38 28 4.00 0.42 3.99 233 0.004 0.092 0.096 0.96 50 12
lep 1 la 4.01 0.43 3.99 227 0.004 0.093 0.097 0.97 50 12 2a 4.00 0.35 3.99 246 0.005 0.093 0.097 0.97 50 12 3a 4.00 0.58 3.98 316 0.006 0.116 0.122 1.22 50 15 4a 4.01 0.58 3.98 359 0.007 0.139 0.146 1.46 50 18 5a 4.00 0.43 3.99 370 0.007 0.139 0.146 1.46 50 18 6a 4.01 0.41 3.99 370 0.007 0.139 0.146 1.46 50 18 20a 4.00 0.65 3.98 206 0.004 0.557 0.561 5.61 50 70 21a 4.01 0.55 3.98 313 0.006 0.491 0.497 4.97 50 62 22a 4.01 0.49 3.99 281 0.005 0.491 0.497 4.97 50 62 23a 4.00 0.45 3.99 296 0.006 0.421 0.427 4.27 50 54 24a 4.01 0.72 3.98 176 0.003 0.351 0.354 3.54 50 45 25a 4.01 0.67 3.98 243 0.005 0.234 0.239 2.39 50 30 26a 4.01 0.52 3.99 267 0.005 0.304 0.309 3.09 50 39 27a 4.01 0.50 3.99 248 0.005 0.304 0.309 3.09 50 39 28a 4.01 0.42 3.99 248 0.005 0.117 0.122 1.22 50 15
!lep3 lb 4.00 0.43 3.99 214 0.004 0.092 0.096 0.96 50 12 2b 4.01 0.35 3.99 256 0.005 0.115 0.120 1.20 50 15 3b 4.01 0.58 3.98 326 0.006 0.115 0.121 1.21 50 15 4b 4.01 0.58 3.98 364 0.007 0.115 0.122 1.22 50 15 5b 4.00 0.43 3.99 395 0.007 0.206 0.213 2.13 50 27 6b 4.00 0.41 3.99 385 0.007 0.137 0.144 1.44 50 18 20b 4.01 0.65 3.98 222 0.004 0.572 0.576 5.76 50 72 21b 4.00 0.55 3.98 295 0.006 0.480 0.486 4.86 50 61 22b 4.01 0.49 3.99 295 0.006 0.526 0.531 5.31 50 67 23b 4.01 0.45 3.99 286 0.005 0.412 0.417 4.17 50 52

214
24b 4.01 0.72 3.98 177 0.003 0.297 0.301 3.01 50 38 25b 4.01 0.67 3.98 239 0.005 0.274 0.279 2.79 50 35 26b 4.00 0.52 3.98 244 0.005 0.274 0.279 2.79 50 35 27b 4.00 0.50 3.98 249 0.005 0.274 0.279 2.79 50 35 28b 4.00 0.42 3.99 250 0.005 0.116 0.121 1.21 50 15
OSS103 4.01 4.25 3.84 166 0.003 1.911 1.914 19.14 50 249
Sludge 1 4.01 8.52 3.66 184 0.003 5.619 5.622 56.22 50 767 OSS106 4.01 4.25 3.84 170 0.003 1.934 1.937 19.37 50 252
Sludge2 4.01 8.52 3.66 192 0.004 5.732 5.736 57.36 50 783 OSSl03b 4.01 4.25 3.84 171 0.003 2.070 2.073 20.73 50 270 OSS103c 4.01 4.25 3.84 155 0.003 1.934 1.937 19.37 50 252 OSSl03e 4.01 4.25 3.84 187 0.004 2.116 2.119 21.19 50 276 OSSl03f 4.00 4.25 3.83 174 0.003 2.070 2.073 20.73 50 270
Sample Rep I Rep2 Average Stdev %cv 1 12 12 12 0.1 1 2 12 15 14 2.0 15 3 15 15 15 0.1 0 4 18 15 17 2.1 13 5 18 27 23 5.9 26 6 18 18 18 0.1 1
9 Avg 20 70 72 71 1.3 2 21 62 61 62 1.0 2 22 62 67 64 3.1 5 23 54 52 53 0.9 2 24 45 38 41 4.8 12 25 30 35 33 3.6 11 26 39 35 37 2.7 7 27 39 35 37 2.6 7 28 15 15 15 0.1 1
5 Avg
102 811 767 783 103 249 252 270

21S
Ni
% water Oven dry ICP Ni Sample # Sample wt content wt. (g) (ug/ml) Ni (ug/g)
1 4.01 0.43 3.99 und #VALUE! 2 4.00 0.35 3.99 0.89 11 3 4.01 0.58 3.98 1.09 14 4 4.01 0.58 3.99 1.08 14 5 4.01 0.43 3.99 1.20 15 6 4.01 0.41 3.99 1.13 14 20 4.01 0.65 3.98 0.74 9 21 4.01 0.55 3.98 0.83 10 22 4.00 0.49 3.98 0.88 11 23 4.00 0.45 3.98 0.93 12 24 4.01 0.72 3.98 0.58 7 25 4.00 0.67 3.97 0.69 9 26 4.01 0.52 3.99 0.85 11 27 4.00 0.50 3.98 0.83 10 28 4.00 0.42 3.99 0.81 10
Rep 2 la 4.01 0.43 3.99 0.78 10 2a 4.00 0.35 3.99 0.88 11 3a 4.00 0.58 3.98 1.08 14 4a 4.01 0.58 3.98 1.19 15 5a 4.00 0.43 3.99 1.25 16 6a 4.01 0.41 3.99 1.17 15 20a 4.00 0.65 3.98 0.76 10 21a 4.01 0.55 3.98 1.06 13 22a 4.01 0.49 3.99 0.98 12 23a 4.00 0.45 3.99 1.07 13 24a 4.01 0.72 3.98 0.64 8 25a 4.01 0.67 3.98 0.87 11 26a 4.01 0.52 3.99 0.94 12 27a 4.01 0.50 3.99 0.87 11 28a 4.01 0.42 3.99 0.83 10
Rep 3 lb 4.00 0.43 3.99 0.73 9 2b 4.01 0.35 3.99 0.85 11 3b 4.01 0.58 3.98 1.05 13 4b 4.01 0.58 3.98 1.20 15 5b 4.00 0.43 3.99 1.30 16 6b 4.00 0.41 3.99 und und 20b 4.01 0.65 3.98 0.77 10 21b 4.00 0.55 3.98 0.97 12 22b 4.01 0.49 3.99 0.98 12
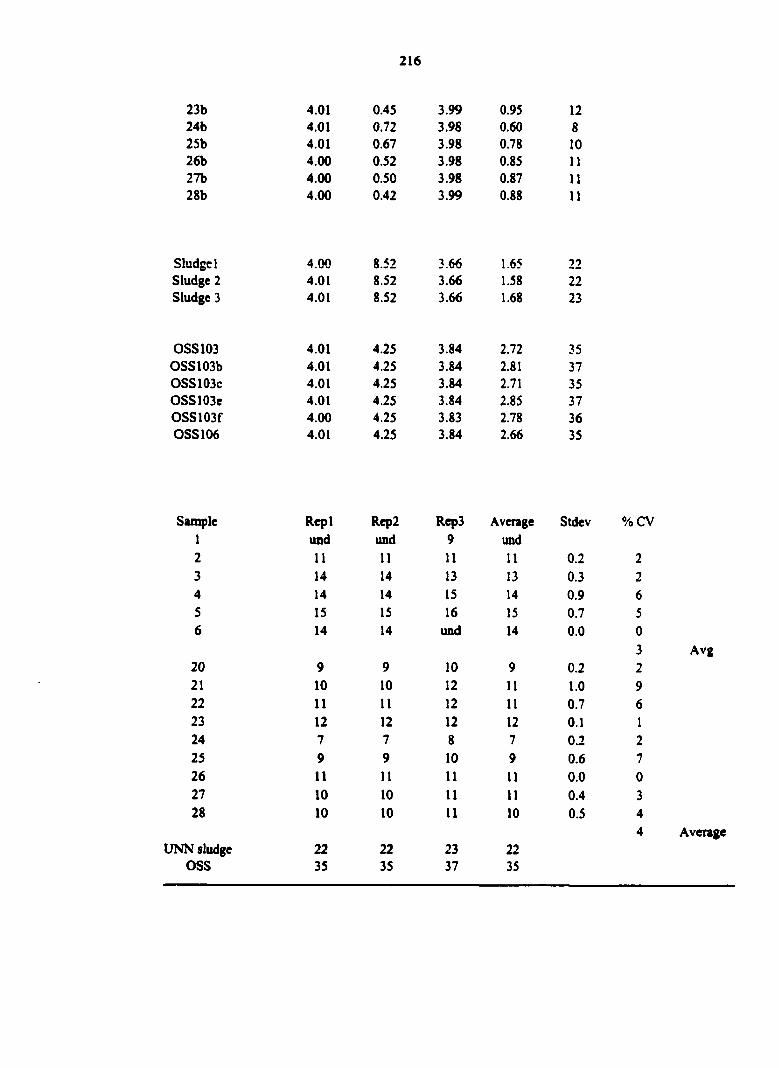
216
23b 4.01 0.45 3.99 0.95 12 24b 4.01 0.72 3.98 0.60 8 25b 4.01 0.67 3.98 0.78 10 26b 4.00 0.52 3.98 0.85 11 27b 4.00 0.50 3.98 0.87 11 28b 4.00 0.42 3.99 0.88 11
Sludge 1 4.00 8.52 3.66 1.65 22 Sludge 2 4.01 8.52 3.66 1.58 22 Sludge 3 4.01 8.52 3.66 1.68 23
OSS103 4.01 4.25 3.84 2.72 35 OSS 103b 4.01 4.25 3.84 2.81 37 OSS 103c 4.01 4.25 3.84 2.71 35 OSS103e 4.01 4.25 3.84 2.85 37 OSS103f 4.00 4.25 3.83 2.78 36 OSS 106 4.01 4.25 3.84 2.66 35
Avg
Avenge
Sample Repl Rep2 Rep3 Avenge Stdev %cv 1 und und 9 und 2 11 11 11 11 0.2 2 3 14 14 13 13 0.3 2 4 14 14 15 14 0.9 6 5 15 15 16 15 0.7 5 6 14 14 und 14 0.0 0
20 9 9 10 9 0.2 2 21 10 10 12 11 1.0 9 22 11 11 12 11 0.7 6 23 12 12 12 12 0.1 1 24 7 7 8 7 0.2 2 25 9 9 10 9 0.6 7 26 11 11 11 11 0.0 0 27 10 10 11 11 0.4 3 28 10 10 11 10 0.5 4
4 UNN sludge 22 22 23 22
OSS 35 35 37 35
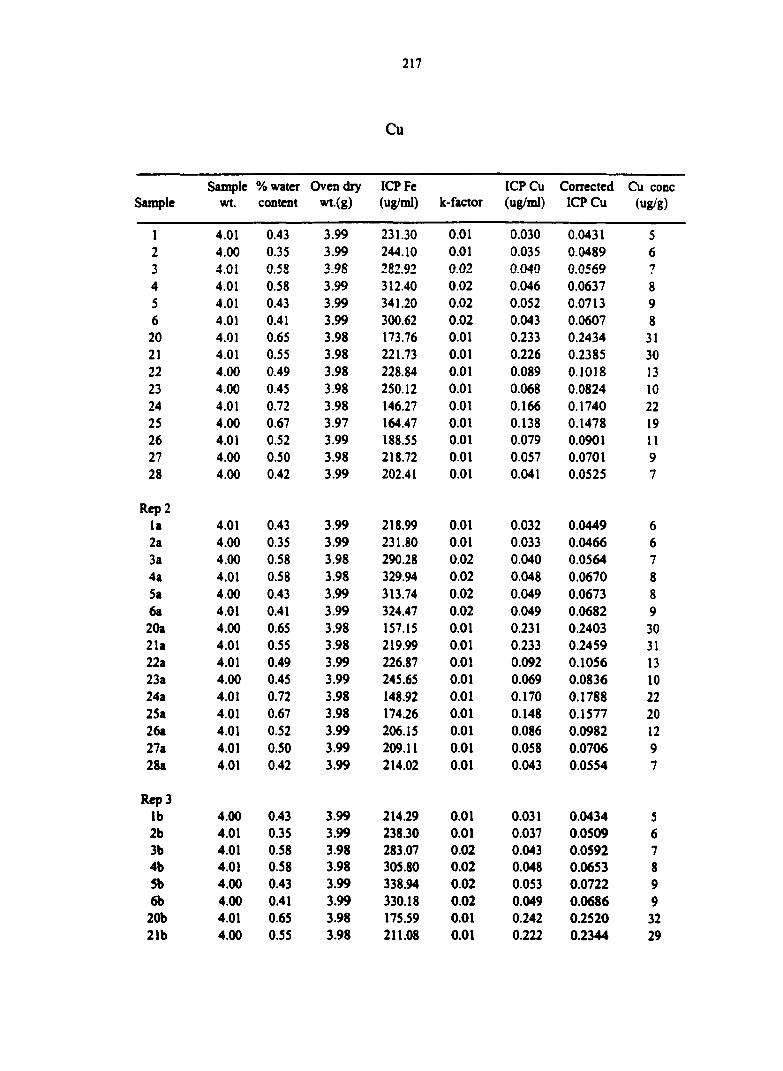
Cu
Sample % water Oven dry ICPFe ICPCu Corrected Cu conc Sample wt. content wt.(g) (ug/ml) k-factor (ug/ml) ICPCu (ug/g)
1 4.01 0.43 3.99 231.30 0.01 0.030 0.0431 5 2 4.00 0.35 3.99 244.10 0.01 0.035 0.0489 6 3 4.01 0.58 3.98 282.92 0.02 0.040 0.0569 7 4 4.01 0.58 3.99 312.40 0.02 0.046 0.0637 8 5 4.01 0.43 3.99 341.20 0.02 0.052 0.0713 9 6 4.01 0.41 3.99 300.62 0.02 0.043 0.0607 8 20 4.01 0.65 3.98 173.76 0.01 0.233 0.2434 31 21 4.01 0.55 3.98 221.73 0.01 0.226 0.2385 30 22 4.00 0.49 3.98 228.84 0.01 0.089 0.1018 13 23 4.00 0.45 3.98 250.12 0.01 0.068 0.0824 10 24 4.01 0.72 3.98 146.27 0.01 0.166 0.1740 22 25 4.00 0.67 3.97 164.47 0.01 0.138 0.1478 19 26 4.01 0.52 3.99 188.55 0.01 0.079 0.0901 11 27 4.00 0.50 3.98 218.72 0.01 0.057 0.0701 9 28 4.00 0.42 3.99 202.41 0.01 0.041 0.0525 7
Rep 2 la 4.01 0.43 3.99 218.99 0.01 0.032 0.0449 6 2a 4.00 0.35 3.99 231.80 0.01 0.033 0.0466 6 3a 4.00 0.58 3.98 290.28 0.02 0.040 0.0564 7 4a 4.01 0.58 3.98 329.94 0.02 0.048 0.0670 8 5a 4.00 0.43 3.99 313.74 0.02 0.049 0.0673 8 6a 4.01 0.41 3.99 324.47 0.02 0.049 0.0682 9 20a 4.00 0.65 3.98 157.15 0.01 0.231 0.2403 30 21a 4.01 0.55 3.98 219.99 0.01 0.233 0.2459 31 22a 4.01 0.49 3.99 226.87 O.OI 0.092 0.1056 13 23a 4.00 0.45 3.99 245.65 0.01 0.069 0.0836 10 24a 4.01 0.72 3.98 148.92 0.01 0.170 0.1788 22 25a 4.01 0.67 3.98 174.26 0.01 0.148 0.1577 20 26a 4.01 0.52 3.99 206.15 0.01 0.086 0.0982 12 27a 4.01 0.50 3.99 209.11 0.01 0.058 0.0706 9 28a 4.01 0.42 3.99 214.02 0.01 0.043 0.0554 7
Rep3 lb 4.00 0.43 3.99 214.29 0.01 0.031 0.0434 5 2b 4.01 0.35 3.99 238.30 0.01 0.037 0.0509 6 3b 4.01 0.58 3.98 283.07 0.02 0.043 0.0592 7 4b 4.01 0.58 3.98 305.80 0.02 0.048 0.0653 8 5b 4.00 0.43 3.99 338.94 0.02 0.053 0.0722 9 6b 4.00 0.41 3.99 330.18 0.02 0.049 0.0686 9 20b 4.01 0.65 3.98 175.59 0.01 0.242 0.2520 32 21b 4.00 0.55 3.98 211.08 0.01 0.222 0.2344 29
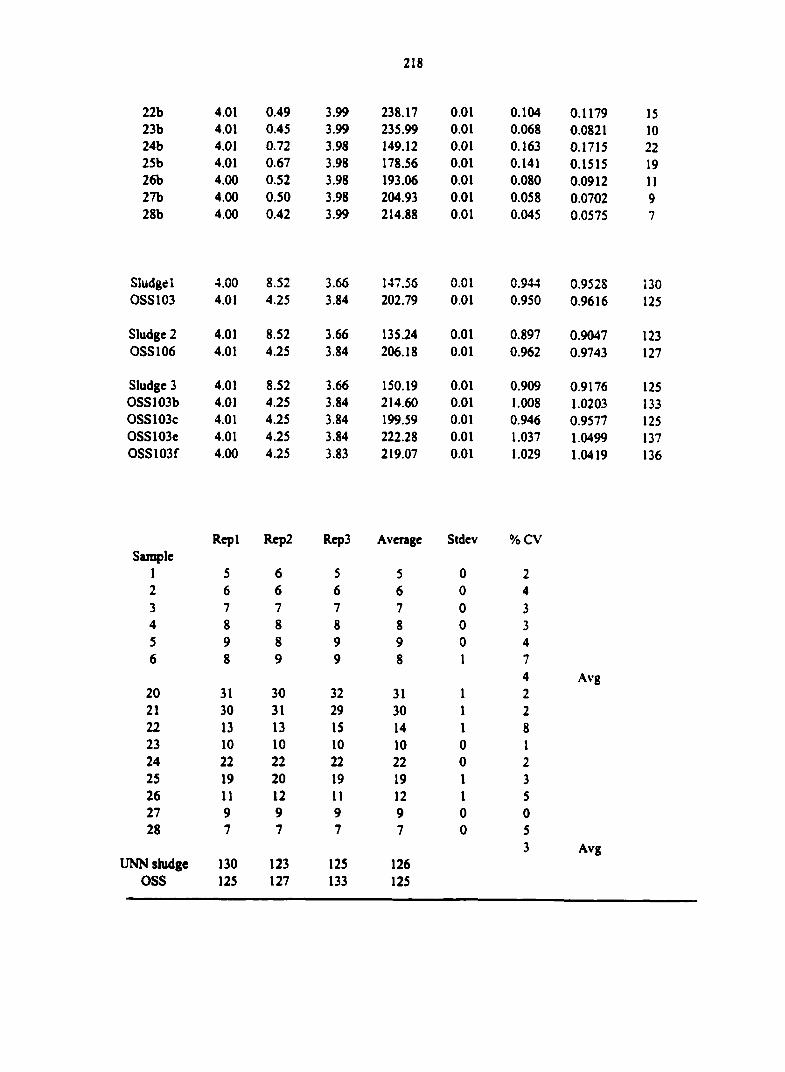
15 10
22 19 11 9 7
130
125
123 127
125 133 125 137
136
218
4.01 0.49 3.99 238.17 0.01 0.104 0.1179 4.01 0.45 3.99 235.99 0.01 0.068 0.0821 4.01 0.72 3.98 149.12 0.01 0.163 0.1715 4.01 0.67 3.98 178.56 0.01 0.141 0.1515 4.00 0.52 3.98 193.06 0.01 0.080 0.0912 4.00 0.50 3.98 204.93 0.01 0.058 0.0702 4.00 0.42 3.99 214.88 0.01 0.045 0.0575
4.00 8.52 3.66 147.56 0.01 0.944 0.9528 4.01 4.25 3.84 202.79 0.01 0.950 0.9616
4.01 8.52 3.66 135.24 0.01 0.897 0.9047 4.01 4.25 3.84 206.18 0.01 0.962 0.9743
4.01 8.52 3.66 150.19 0.01 0.909 0.9176 4.01 4.25 3.84 214.60 0.01 1.008 1.0203 4.01 4.25 3.84 199.59 0.01 0.946 0.9577 4.01 4.25 3.84 222.28 0.01 1.037 1.0499 4.00 4.25 3.83 219.07 0.01 1.029 1.0419
Rq)l Rq)2 Rep3 Average Sldev %cv
5 6 5 5 0 2 6 6 6 6 0 4 7 7 7 7 0 3 8 8 8 8 0 3 9 8 9 9 0 4 8 9 9 8 1 7
31 30 32 31 1 4 2
Avg
30 31 29 30 1 2 13 13 15 14 1 8 10 10 10 10 0 1 22 22 22 22 0 2 19 20 19 19 1 3 11 12 11 12 1 5 9 9 9 9 0 0 7 7 7 7 0 5
130 123 125 126 3 Avg
125 127 133 125
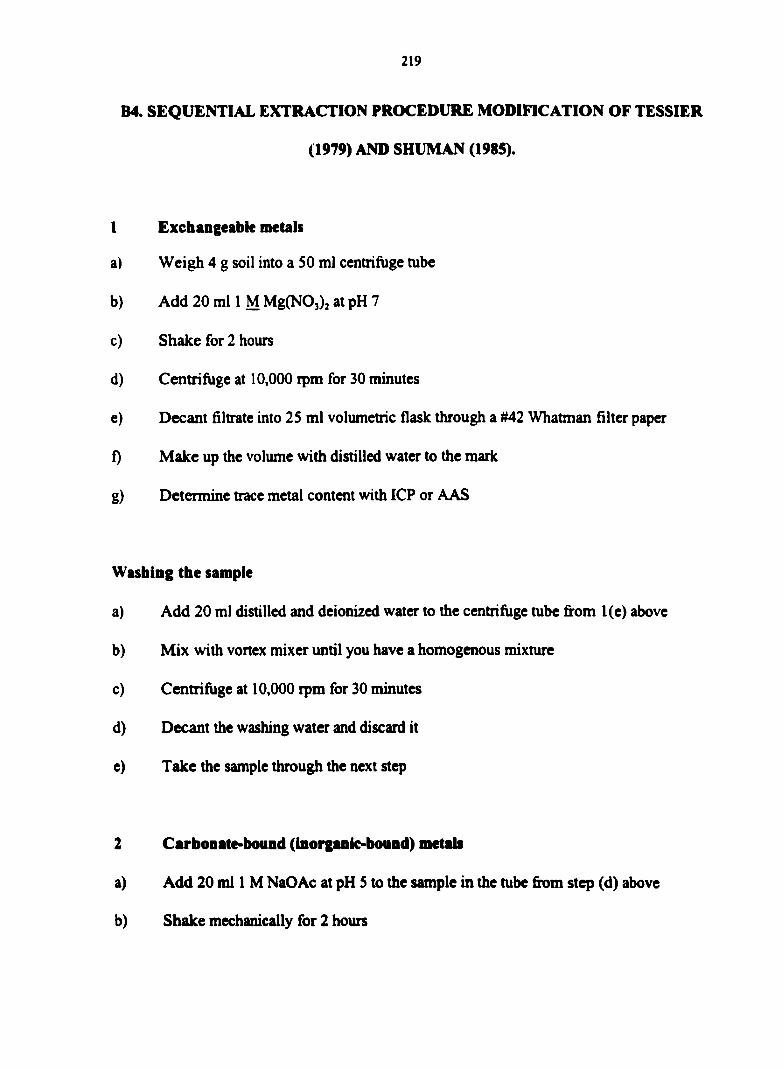
219
B4. SEQUENTIAL EXTRACTION PROCEDURE MODinCATION OF TESSIER
(1979) AND SHUMAN (1985).
1 Exchangeable metals
a) Weigh 4 g soil into a SO ml centrifuge tube
b) Add 20 ml 1 M MgCNOj): at pH 7
c) Shake for 2 hours
d) Centrifuge at 10,000 rpm for 30 minutes
e) Decant filtrate into 25 ml volumetric flask through a #42 Whatman filter paper
0 Make up the volume with distilled water to the mark
g) Determine trace metal content with IGF or AAS
Washing the sample
a) Add 20 ml distilled and deionized water to the centrifuge tube from 1(e) above
b) Mix with vortex mixer until you have a homogenous mixture
c) Centrifuge at 10,000 ipm for 30 minutes
d) Decant the washing water and discard it
e) Take the sample through the next step
2 Carbonate-bound (inorganic-bound) metali
a) Add 20 mil M NaOAc at pH S to the sample in the tube from step (d) above
b) Shake mechanically for 2 hours

220
c) Centrifuge at 10,000 rpm for 30 minutes
d) Decant filtrate into 25 ml volumetric flask through a #42 Whatman filter paper
e) Make up the volume with distilled water to the mark
f) Determine trace metal content with ICP or AAS
Washing the sample
a) Add 20 ml distilled and deionized water to the centrifuge tube from (d) above
b) Mix with vortex mixer until you have a homogenous mixture
c) Centrifuge at 10,000 rpm for 30 minutes
d) Decant the washing water and discard the water
e) Take the sample through the next step
3 Oxide-bound meUls
a) Add 20 ml Na-citrate solution to the sample in centrifuge tube from step (d) above
b) Mix contents of the tube with vortex mixer until you have homogenous mixture
c) Transfer the tubes to a hot water bath and bring the temperature of the sample to 75-
80 "C
d) Add 1 g Na3S204 and stir for S minutes
e) Add a second 1 g Na2S204 and stir
f) Centrifuge at 10,000 ipm for 30 minutes
g) Decant filtrate into SO ml volumetric flask through a #42 Whatman filter paper
h) Make up the volume with distilled water to the mark

221
i) Determine trace metal content with ICP or AAS
Washing the sample
a) Add 20 ml distilled and deionized water to the centrifuge tube from (g) above
b) Mix with vortex mixer until you have a homogenous mbcture
c) Centrifuge at 10,000 rpm for 30 minutes
d) Decant the washing water and discard the water
f) Take the sample through the next step
4 Organic matter bound metals
a) To the sample in the centrifuge tube from step (d) above add 10 ml 0.03 M HNO,
b) Add 20 ml 30 % H2O3 at pH 2 (adjust pH with HNO,)
c) Heat the mixture to 85 °C for 3 hours with intermittent agitation
d) Cool and add 10 ml 3.2 M NH4OAC in 20 % (v/v) HNO,
e) Agitate continuously for 30 minutes
0 Centrifuge at 10,000 rpm for 30 minutes
j) Decant filtrate into SO ml volumetric flask through a #42 Whatman fiher paper
k) Make up the volume with distilled water to the maik
1) Determine trace metal content with ICP or AAS

122
Washing the sample
a) Add 20 ml distilled and deionized water to the centrifuge tube from (j) above
b) Mix with voitex mixer until you have a homogenous mixture
c) Centrifuge at 10,000 ipm for 30 minutes
d) Dccant the washing water and discard the water
g) Take the sample through the next step
4 Residual metab
a) To sample in the centrifuge tube from step (d) above, add 1S mll6 M HNO,
b) Mix the mixture with vortex mixer until thoroughly mixed.
c) Transfer mixture to the long digestion tubes for aluminimi block digester
d) Rinse the centrifuge tubes with S ml HNO, and combine with (c) above
e) Place the tubes into the aluminum block digester for 16 hours at 100 °C
0 Cool the tubes and filter contents into a SO ml volumetric flask and make to volume
g) Determine total metals by ICP or AAS.

223
B5.SEQUENT1AL EXTRACTION OF TRACE METALS (NSUKKA SAMPLES)
Pb
Lab # Weakly Oxide Organic Exchangeable bound bound bound Residual Sum of (Mg(NO,)i) (NaOAc) (CBD) (HjO,J (HNOj) fractions
mg kg-'
1 0-5 0.8 0.3 1.0 1.4 3.4 6.9 Pedon 1 2 5-40 0.1 0.3 1.2 1.4 4.2 7.2 3 40-55 0.7 0.3 0.6 0.9 4.4 6.9 4 55-80 0.5 0.2 0.6 1.3 4.7 7.3 5 80-110 0.3 0.1 0.0 1.0 4.3 5.6 6 110-180 0.1 0.2 0.4 1.2 4.0 5.9 20 0-25 0.5 0.2 4.6 4.4 7.3 17.0 Pedon 2 21 25-60 0.0 0.0 0.9 2.4 8.1 11.4 22 60-120 0.0 0.0 1.6 0.8 5.0 7.5 23 120-180 0.8 0.0 1.4 1.2 5.3 8.7 24 0-15 0.2 0.4 4.2 2.2 4.9 12.0 Pedon 3 25 15-30 0.6 0.2 2.5 2.0 6.9 12.1 26 30-70 0.0 0.0 1.4 0.4 5.4 7.2 27 70-120 0.1 0.0 0.0 0.5 5.6 6.2 28 120-190 0.3 0.0 1.2 1.2 5.0 7.6
OSSl 0.0 0.2 15.2 7.8 21.9 45.1 Standard 0SS2 0.0 0.1 11.0 3.4 25.7 40.2 0SS3 0.0 0.3 14.0 3.2 28.4 45.8 0SS4 0.0 0.2 18.2 2.8 26.8 48.0 OSSS 0.0 0.2 11.8 3.0 25.8 40.7 0SS6 0.0 0.1 19.7 9.0 18.3 47.2

224
Weakly Oxide Organic Exchangeable bound bound bound Residual Sum of
libn (Mg(NO,)i) (NaOAc) (CBD) (HjOJ (HNO,) fractions
Zn - - - 1.^-1 mg kg
1 0-5 1.1 0.4 2.8 1.8 6.0 12.0 Pedon 1 2 5-40 0.6 0.3 2.5 1.5 6.7 11.6 3 40-55 0.3 0.2 1.7 1.1 8.0 11.3 4 55-80 0.3 0.2 2.1 1.2 8.4 12.3 5 80-110 0.3 0.2 2.6 2.6 7.5 13.2 6 110-180 0.2 0.4 1.9 3.2 8.3 13.9 20 0-25 11.5 4.3 20.9 8.1 9.3 54.0 Pedon 2 21 25-60 14.5 3.5 15.2 7.9 12.1 53.1 22 60-120 20.0 2.8 16.0 5.4 10.6 54.7 23 120-180 13.5 1.7 10.8 4.2 9.5 39.7 24 0-15 4.8 0.8 5.6 2.4 5.6 19.1 Pedon 3 25 15-30 2.8 0.6 5.1 1.7 7.7 17.9 26 30-70 9.8 2.0 9.3 3.1 7.5 31.7 27 70-120 8.4 2.0 8.2 2.2 7.0 27.7 28 120-190 0.7 0.3 2.5 0.7 8.0 12.2
OSSl 13.5 15.2 47,3 22.7 83.3 182.0 Standard 0SS2 13.6 15.3 53.4 19.2 79.0 180.4 0SS3 13.8 14.5 48.4 19.2 90.8 186.7 0SS4 13.3 14.5 47.8 21.5 95.1 192.3 0SS5 13.7 14.2 53.5 19.0 80.5 180.8 0SS6 13.2 14.4 46.7 28.3 76.8 179.4

225
Weakly Oxide Organic Exchangeable bound bound bound Residual Sum of
Lab# (Mg(NO,)i) (NaOAc) (CBD) (HjOj) (HNOj) fractions
Ni mg kg'
1 0-5 0.1 0.1 0.0 0.1 7.5 7.9 Pedon 1 2 5-40 0.6 0.2 0.0 0.2 9.2 10.1 3 40-55 0.0 0.0 0.3 0.0 11.7 12.0 4 55-80 0.0 0.0 0.3 0.0 12.6 13.0 5 80-110 0.4 0.2 0.4 0.2 11.4 12.6 6 110-180 0.0 0.1 0.3 0.1 12.6 12.9 20 0-25 O.l 0.1 0.3 0.1 7.3 7.9 Pedon 2 21 25-60 0.0 0.2 0.0 0.2 11.4 11.8 22 60-120 0.3 0.1 0.2 0.1 11.0 11.8 23 120-180 0.0 0.2 0.6 0.2 11.3 12.2 24 0-15 0.0 O.l 0.0 0.1 5.8 6.0 Pedon 3 25 15-30 0.2 0.2 0.4 0.2 8.1 9.1 26 30-70 0.0 0.2 0.5 0.2 9.2 10.0 27 70-120 0.1 0.1 0.6 0.1 9.0 9.9 28 120-190 0.0 0.0 0.3 0.0 10.0 10.3
OSS I 3.9 2.1 17.2 2.1 8.6 33.8 Standa 0SS2 4.1 2.1 16.1 2.1 8.4 32.7 0SS3 3.9 1.9 16.6 1.9 8.8 33.0 0SS4 3.5 1.9 17.2 1.9 9.4 33.8 0SS5 4.0 1.9 16.0 1.9 8.3 32.2 0SS6 4.1 1.9 16.2 1.9 7.8 31.9

226
Weakly Exchangeable bound
Ub n (Mg(NO,):) (NaOAc)
Oxide Organic bound bound Residual Sum of (CBD) (HjOj) (HNOj) fractions
Cu
1 0-5 0.0 0.1 • mg kg''
0.6 0.6 2.3 3.5 2 5-40 0.0 0.1 0.7 0.5 2.7 3.9 3 40-55 0.0 0.1 0.6 0.5 3.3 4.5 4 55-80 0.0 0.1 0.4 0.8 3.7 5.0 5 80-110 0.0 0.1 0.3 0.8 3.3 4.5 6 110-180 0.0 0.1 0.3 0.9 3.8 5.0 20 0-25 0.2 0.5 6.7 14.4 4.0 25.8 21 25-60 0.6 1.4 2.0 17.9 5.1 26.9 22 60-120 0.4 0.7 1.1 5.6 3.7 11.5 23 120-180 0.3 0.5 1.0 2.8 3.4 8.0 24 0-15 0.4 0.4 6.2 7.9 2.9 17.8 25 15-30 0.5 0.5 3.5 7.5 3.2 15.3 26 30-70 0.3 0.5 1.6 4.5 3.1 10.0 27 70-120 0.1 0.4 0.7 2.8 2.6 6.7 28 120-190 0.1 0.2 0.5 1.6 2.7 5.2
OSSl 0.7 1.8 28.9 26.3 40.1 97.8 0SS2 0.8 1.8 28.9 24.1 40.9 96.5 0SS3 0.8 1.7 28.6 23.6 45.1 99.8 0SS4 0.8 1.7 29.2 25.7 46.0 103.3 0SS5 0.8 1.7 27.5 24.9 41.0 95.8 0SS6 0.8 1.6 34.4 25.0 34.8 96.6
Pedon 1
Standard
in
B6. MASS BALANCE CALCULATION FOR ZN AND CU
This mass balance calculation was perfomied to estimate the amount of Zn and Cu
remaining in the soil profile as a percentage of the amount applied (correcting for background
levels of each element using data from the control soil). The mass balance calculations of Zn
and Cu as percent recoveries of sludge-applied metals are presented in Tables B6.1 and B6.2.
The accuracy of the mass balance calculations may not be great because of uncertain
assumptions, such as estimations of the sewage sludge loading rates, bulk density, and
sampling errors. Some of these problems are inherent in field studies. However, a wider
importance to the mass balance calculations is in evaluating whether heavy metals moved
from the sludge-soil layer and how fast such mobility could have been. This justifies the
above assumptions. Some of the assumptions for these calculations are presented in the text
of chapter 3. The bulk density of the horizons was assumed to be 1.2 Mg m"' on the basis of
unpublished soil data of the area.
Comparing the element recoveries with loading rates (Table 4 and S) clearly indicated
that Zn and Cu incorporated in the topsoil moved and had been redistributed in the soil
profile over time. The recovery of Zn (73%), and Cu (107%) in soil profile 2 was higher than
that of soil profile #3 (Zn, 43% and Cu, 64%). Only about 4-13% of Zn was recovered in the
sludge-soil layer. A much greater percentage was recovered in the Bt horizons (30-120 cm)
of the sewage-sludge-amended soils. For Cu, 10-25% of the total Cu loading was recovered
at the sludge-soil layer. The sludge-soil layer for the sludge-amended soils is the zone of
sludge incorporation and mixing, and is assumed to be between IS and 25 cm of the topsoil.
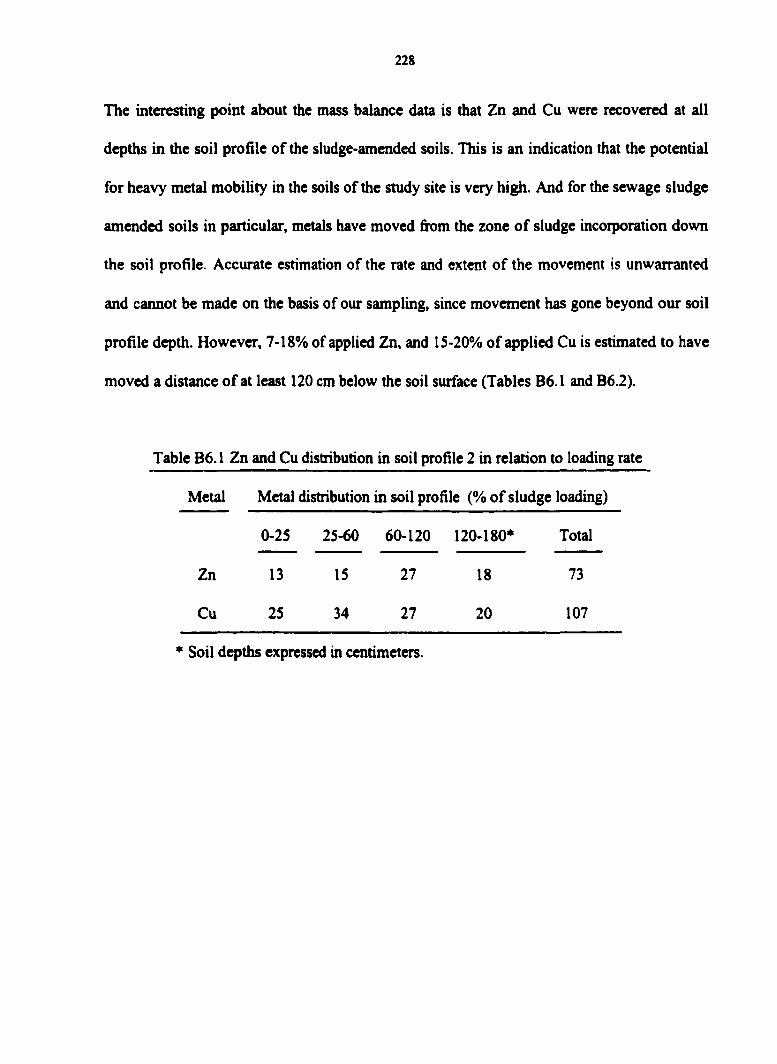
228
The interesting point about the mass balance data is that Zn and Cu were recovered at all
depths in the soil profile of the sludge-amended soils. This is an indication that the potential
for heavy metal mobility in the soils of the study site is very high. And for the sewage sludge
amended soils in particular, metals have moved from the zone of sludge incorporation down
the soil profile. Accurate estimation of the rate and extent of the movement is unwarranted
and caimot be made on the basis of our sampling, since movement has gone beyond our soil
profile depth. However, 7-18% of applied Zn, and 15-20% of applied Cu is estimated to have
moved a distance of at least 120 cm below the soil surface (Tables B6.1 and B6.2).
Table B6.1 Zn and Cu distribution in soil profile 2 in relation to loading rate
Metal Metal distribution in soil profile (% of sludge loading)
0-25 25-60 60-120 120-180* Total
Zn 13 15 27 18 73
Cu 25 34 27 20 107
* Soil depths expressed in centimeters.

229
Table B6.2 Zn and Cu distribution in soil profile 3 in relation to loading rate
Metal Metal distribution in soil profile (% of sludge loading)
0-15 15-30 30-70 70-120 120-180* Total
Zn 4 3 16 13 7 43
Cu 10 9 15 14 15 64

230
APPENDIX C: ADDITIONAL INFORMATION FOR CHAPTER 4
CI. SOIL PROnLE DESCRIPTION (MINES OF SPAIN)
Proflle 1
Oh 4 to 0 cm: black (lOYR 2/1) fibric and sapric; clear wavy boundary.
A1 0 to 10 cm; very dark gray (lOYR 3/1) and very dark brown (lOYR 2/2) silt loam; very
weak fine and very fine sub angxilar blocky and moderate fine granules; friable; many fine
and common coarse roots; clear wavy boundary.
A2 10 to 20 cm; dark gray to very dark gray (lOYR 3.5/1) and very dark brown (lOYR 2/2)
silt loam; moderate medium platy; friable; many fine and common coarse roots; clear wavy
boundary.
BA 20 to 43 cm; daik gray (lOYR 4/1) and brown to dark brown (lOYR 4/3) silt loam;
moderate medium to fine subangular blocky; friable; thin continuous very dark grayish
brown (lOYR 3/2) coatings of organic matter; many roots; abrupt smooth boundary.
Btl 43 to 70 cm; brown to dark brown (lOYR 4/3) silt loam; weak medium to fine
subangular blocky; friable; few fine distinct black (7.5YR 2/0) mottles; thin continuous very
dark grayish brown (lOYR 3/2) and dark brown (lOYR 3/3) coatings of organic matter and
clay; many fine roots; gradual smooth boundary.
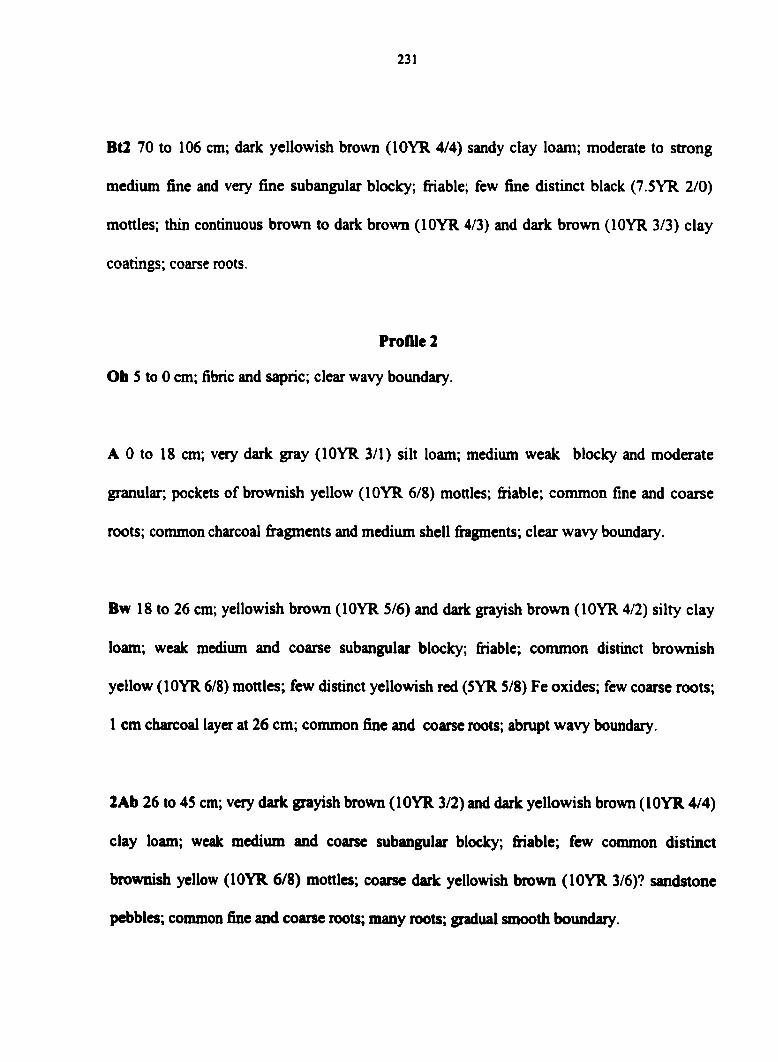
231
Bt2 70 to 106 cm; dark yellowish brown (lOYR 4/4) sandy clay loam; moderate to strong
medium fine and very fine subangular blocky; fhable; few fine distinct black (7.SYR 2/0)
mottles; thin continuous brown to dark brown (lOYR 4/3) and dark brown (lOYR 3/3) clay
coatings; coarse roots.
Profile 2
Oh S to 0 cm; fibric and saphc; clear wavy boundary.
A 0 to 18 cm; very dark gray (lOYR 3/1) silt loam; medium weak blocky and moderate
granular; pockets of brownish yellow (lOYR 6/8) mottles; friable; common fine and coarse
roots; common charcoal Augments and medium shell firagments; clear wavy boundary.
Bw 18 to 26 cm; yellowish brown (lOYR 5/6) and dark grayish brown (lOYR 4/2) silty clay
loam; weak medium and coarse subangular blocky; friable; common distinct brownish
yellow (lOYR 6/8) mottles; few distinct yellowish red (SYR 5/8) Fe oxides; few coarse roots;
1 cm charcoal layer at 26 cm; common fine and coarse roots; abrupt wavy boundary.
2Ab 26 to 45 cm; very dark grayish brown (lOYR 3/2) and dark yellowish brown (lOYR 4/4)
clay loam; weak medium and coarse subangular blocky; friable; few common distinct
brownish yellow (lOYR 6/8) mottles; coarse daric yellowish brown (lOYR 3/6)? sandstone
pebbles: common fine and coarse roots; many roots; gradual smooth boundary.
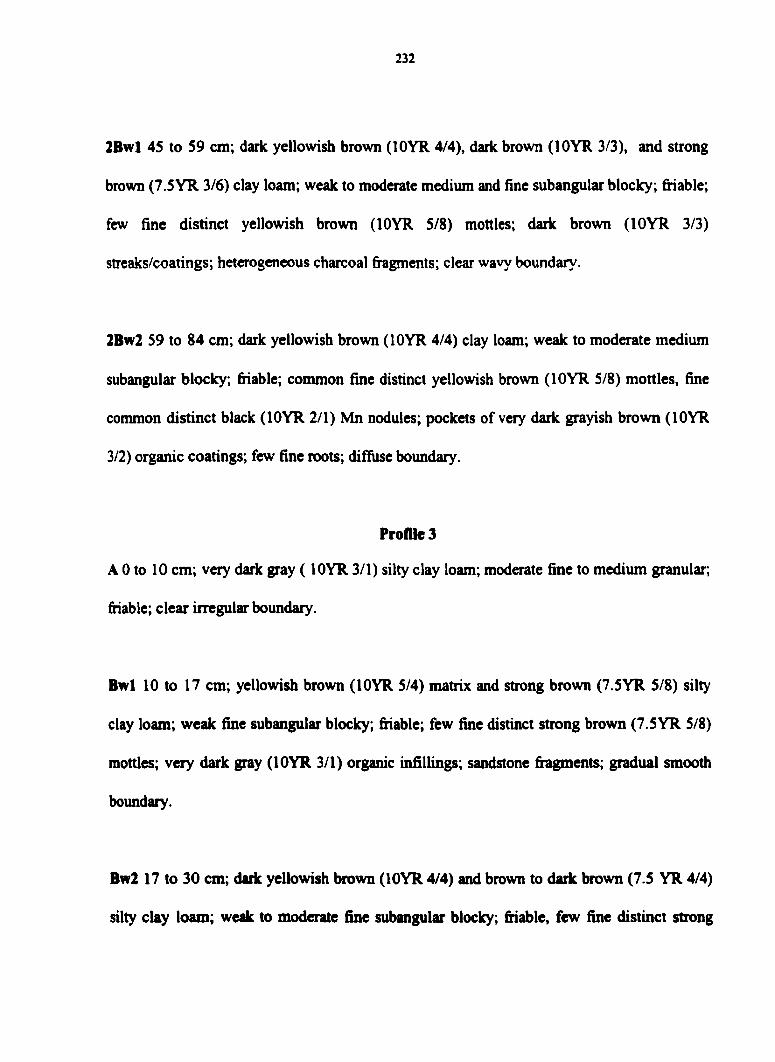
232
2Bwl 45 to 59 cm; dark yellowish brown (lOYR 4/4), dark brown (lOYR 3/3), and strong
brown (7.5YR 3/6) clay loam; weak to moderate medium and fine subangular blocky; friable;
few fine distinct yellowish brown (lOYR 5/8) mottles; dark brown (lOYR 3/3)
streaks/coatings; heterogeneous charcoal fragments; clear wavy boundary.
2Bw2 59 to 84 cm; dark yellowish brown (lOYR 4/4) clay loam; weak to moderate medium
subangular blocky; friable; common fine distinct yellowish brown (lOYR 5/8) mottles, fine
common distinct black (lOYR 2/1) Mn nodules; pockets of very dark grayish brown (lOYR
3/2) organic coatings; few fine roots; diffuse boundary.
Profile 3
A 0 to 10 cm; very dark gray (lOYR 3/1) silty clay loam; moderate fine to medium granular;
friable; clear irregular boundary.
Bwl 10 to 17 cm; yellowish brown (lOYR 5/4) matrix and strong brown (7.5YR 5/8) silty
clay loam; weak fine subangular blocky; friable; few fine distinct strong brown (7.5YR 5/8)
mottles; very dark gray (lOYR 3/1) organic infillings; sandstone fragments; gradual smooth
boundary.
Bw2 17 to 30 cm; dark yellowish brown (lOYR 4/4) and brown to dark brown (7.5 YR 4/4)
silty clay loam; weak to moderate fine subangular blocky; friable, few fine distinct strong
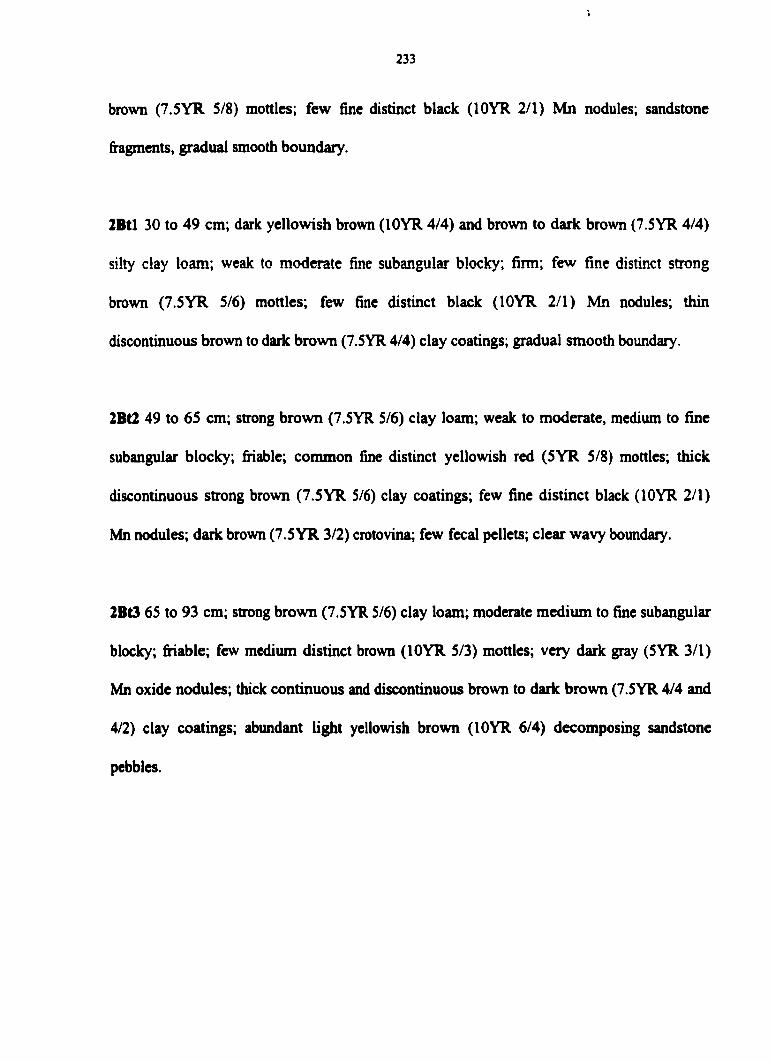
233
brown (7.5YR 5/8) mottles; few fine distinct black (lOYR 2/1) Mn nodules; sandstone
fragments, gradual smooth boundary.
2Btl 30 to 49 cm; dark yellowish brown (lOYR 4/4) and brown to dark brown (7.5YR 4/4)
silty clay loam; weak to moderate fine subangular blocky; firm; few fine distinct strong
brown (7.5YR 5/6) mottles; few fine distinct black (lOYR 2/1) Mn nodules; thin
discontinuous brown to dark brown (7.5YR 4/4) clay coatings; gradual smooth boundary.
2Bt2 49 to 65 cm; strong brown (7.5YR 5/6) clay loam; weak to moderate, medium to fine
subangular blocky; friable; common fine distinct yellowish red (5YR 5/8) mottles; thick
discontinuous strong brown (7.5YR 5/6) clay coatings; few fine distinct black (lOYR 2/1)
Mn nodules; dark brown (7.5 YR 3/2) crotovina; few fecal pellets; clear wavy boundary.
2Bt3 65 to 93 cm; strong brown (7.5YR 5/6) clay loam; moderate medium to fine subangular
blocky; fiiable; few medium distinct brown (lOYR 5/3) mottles; very dark gray (5YR 3/1)
Mn oxide nodules; thick continuous and discontinuous brown to dark brown (7.5YR 4/4 and
4/2) clay coatings; abundant light yellowish brown (lOYR 6/4) decomposing sandstone
pebbles.
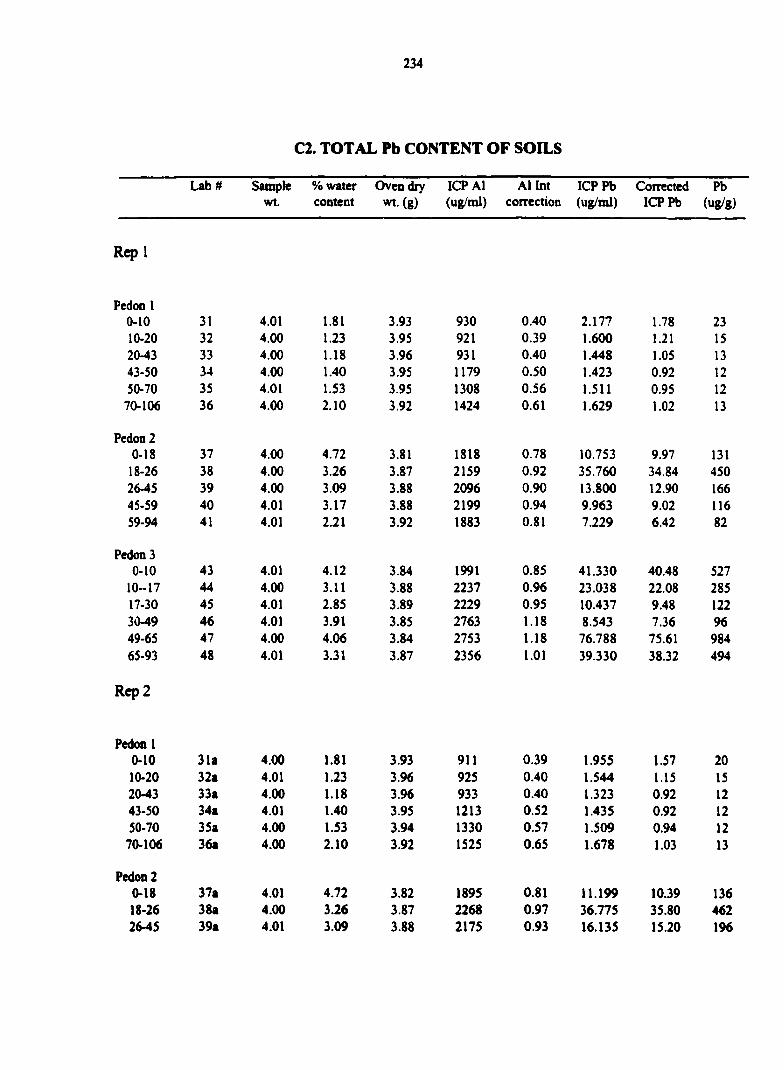
234
C2. TOTAL Pb CONTENT OF SOILS
Lab # Sample % water Oven dry ICP A1 A1 Int ICP Pb Corrected Pb wt. content wt. (g) (ug/ml) correction (ug/ml) ICP Pb (ug/g)
Rep 1
Pedon I rcaoo 1
0-10 31 4.01 1.81 3.93 930 0.40 2.177 1.78 23 10-20 32 4.00 1.23 3.95 921 0.39 1.600 1.21 15 20-43 33 4.00 1.18 3.96 931 0.40 1.448 1.05 13 43-50 34 4.00 1.40 3.95 1179 0.50 1.423 0.92 12 50-70 35 4.01 1.53 3.95 1308 0.56 1.511 0.95 12
70-106 36 4.00 2.10 3.92 1424 0.61 1.629 1.02 13
Pedon 2 0-18 37 4.00 4.72 3.81 1818 0.78 10.753 9.97 131
18-26 38 4.00 3.26 3.87 2159 0.92 35.760 34.84 450 26-45 39 4.00 3.09 3.88 2096 0.90 13.800 12.90 166 45-59 40 4.01 3.17 3.88 2199 0.94 9.963 9.02 116 59-94 41 4.01 2.21 3.92 1883 0.81 7.229 6.42 82
Pedon 3 0-10 43 4.01 4.12 3.84 1991 0.85 41.330 40.48 527
10-17 44 4.00 3.11 3.88 2237 0.96 23.038 22.08 285 17-30 45 4.01 2.85 3.89 2229 0.95 10.437 9.48 122 30-49 46 4.01 3.91 3.85 2763 1.18 8.543 7.36 96 49-65 47 4.00 4.06 3.84 2753 1.18 76.788 75.61 984 65-93 48 4.01 3.31 3.87 2356 1.01 39.330 38.32 494
Rep 2
Pedon 1 0-10 31a 4.00 1.81 3.93 911 0.39 1.955 1.57 20 10-20 32a 4.01 1.23 3.96 925 0.40 1.544 1.15 15 20-43 33a 4.00 1.18 3.96 933 0.40 1.323 0.92 12 43-50 34a 4.01 1.40 3.95 1213 0.52 1.435 0.92 12 50-70 35a 4.00 1.53 3.94 1330 0.57 1.509 0.94 12 70-106 36a 4.00 2.10 3.92 1525 0.65 1.678 1.03 13
Pedon2 0-18 37a 4.01 4.72 3.82 1895 0.81 11.199 10.39 136 18-26 38a 4.00 3.26 3.87 2268 0.97 36.775 35.80 462 26-45 39a 4.01 3.09 3.88 2175 0.93 16.135 15.20 196

235
45-59 40a 4.00 3.17 3.88 2075 0.89 9.404 8.52 110
59-94 41a 4.00 2.21 3.92 1870 0.80 7.467 6.67 85
Pedon 3 0-10 43a 4.00 4.12 3.84 2045 0.88 41.508 40.63 529
10-17 44a 4.00 3.11 3.88 2408 1.03 22.383 21.35 275 17-30 45a 4.00 2.85 3.89 2128 0.91 10.589 9.68 124 30-49 46a 4.00 3.91 3.85 2566 1.10 8.824 7.73 100 49-65 47a 4.01 4.06 3.85 2809 1.20 73.449 72.25 939 65-93 48a 4.01 3.31 3.87 2462 1.05 37.317 36.26 468
Rq) 3
Pedon 1 0-10 31b 4.00 1.81 3.93 968 0.41 2.225 1.81 23 10-20 32b 4.00 1.23 3.96 1001 0.43 1.695 1.27 16 20-43 33b 4.00 1.18 3.96 943 0.40 1.377 0.97 12 43-50 34b 4.00 1.40 3.95 1173 0.50 1.489 0.99 13 50-70 45b 4.00 1.53 3.94 1307 0.56 1.470 0.91 12 70-106 36b 4.00 2.10 3.92 1566 0.67 1.629 0.96 12
Pedon 2 0-18 37b 4.01 4.72 3.82 2003 0.86 11.962 11.10 145 18-26 38b 4.01 3.26 3.88 2349 1.01 39.617 38.61 498 26-45 39b 4.01 3.09 3.88 2257 0.97 13.653 12.69 163 45-59 40b 4.01 3.17 3.88 2202 0.94 9.854 8.91 115 59-94 41b 4.00 2.21 3.92 1803 0.77 7.324 6.55 84
Pedon 3 0-10 43b 4.01 4.12 3.84 2265 0.97 43.990 43.02 560
10-17 44b 4.00 3.11 3.88 2331 1.00 24.665 23.67 305 17-30 45b 4.00 2.85 3.89 2446 1.05 10.677 9.63 124 30-49 46b 4.01 3.91 3.85 2810 1.20 8.229 7.03 91 49-65 47b 4.01 4.06 3.84 2659 1.14 73.045 71.91 935 65-93 48b 4.00 3.31 3.87 2278 0.98 37.328 36.35 469
OSSl 4.01 4.25 3.84 1659 0.71 4.379 3.67 48 0SS2 4.01 4.25 3.84 1696 0.73 4.211 3.48 45 0SS3 4.01 4.25 3.84 1711 0.73 4.477 3.74 49 0SS4 4.01 4.25 3.84 1549 0.66 4.324 3.66 48 0SS5 4.01 4.25 3.84 1866 0.80 4.671 3.87 50 0SS6 4.00 4.25 3.83 1744 0.75 4.414 3.67 48
Summiiy
Sample# Rcpl Rep2 Rep3 Avenge StdDev. Rel Dev. CV 31 23 20 23 22 1.7 0.08 8 32 15 15 16 15 0.7 0.05 5

236
33 13 12 12 12 0.8 0.06 6 34 12 12 13 12 0.5 0.04 4 35 12 12 12 12 0.3 0.02 2 36 13 13 12 13 0.5 0.04 4
Average 15 14 15 14 0.75 0.05 5
37 131 136 145 137 7,5 0.05 5 38 450 462 498 470 25.1 0.05 5 39 166 196 163 175 17.9 0.10 10 40 116 110 115 114 3.4 0.03 3 41 82 85 84 84 1.6 0.02 2 43 527 529 560 539 18.4 0.03 3 44 285 275 305 288 15.2 0.05 5 45 122 124 124 123 1.4 0.01 1 46 96 100 91 96 4.6 0.05 5 47 984 939 935 953 27.3 0.03 3 48 494 468 469 477 14,9 0.03 3
Average 314 311 317 314 12.48 0.04 4
Ames 112 123 120 118 5.6 0.05 5 sludge UNN 46 48 46 47 l.l 0.02 2 sludge OSS 48 45 49 48 1.7 0.04 4

237
C3. SEQUENTIAL EXTRACTION OF PB (MINES OF SPAIN)
Ub# Mg(N03) NaOAc CBD OM Residual Sum
Pedon 1 0-10 31 0 0 10 1 11 23
10-20 32 0 0 5 3 8 16 20-43 33 0 0 5 2 5 12 43-50 34 0 0 3 2 5 10 50-70 35 0 0 2 2 5 8 70-106 36 0 0 2 2 5 10
Average 0 0 5 2 7 13
Pedon 2 0-18 37 0 2 63 67 20 153
18-26 38 0 25 54 98 168 345 26-45 39 0 5 34 100 25 163 45-59 40 0 2 19 63 21 105 59-94 41 0 3 10 14 43 70
Average 0 8 36 68 55 167
Pedon 3 0-10 43 0 25 141 104 187 457
10-17 44 0 15 42 58 135 251 17-30 45 0 3 9 20 67 99 30-49 46 0 2 10 10 51 73 49-65 47 0 75 118 259 333 785 65-93 48 0 22 94 275 101 492
Average 0 24 69 121 146 359
Surface 59 0 6 101 17 164 288
tef samples 1 OSSl 0 0 15 8 22 45 2 0SS2 0 0 11 3 26 40 3 0SS3 0 0 14 3 28 46 4 0SS4 0 0 18 3 27 48 5 0SS5 0 0 12 3 26 41 6 0SS6 0 0 20 9 18 47
Average 0 0 15 5 24 44
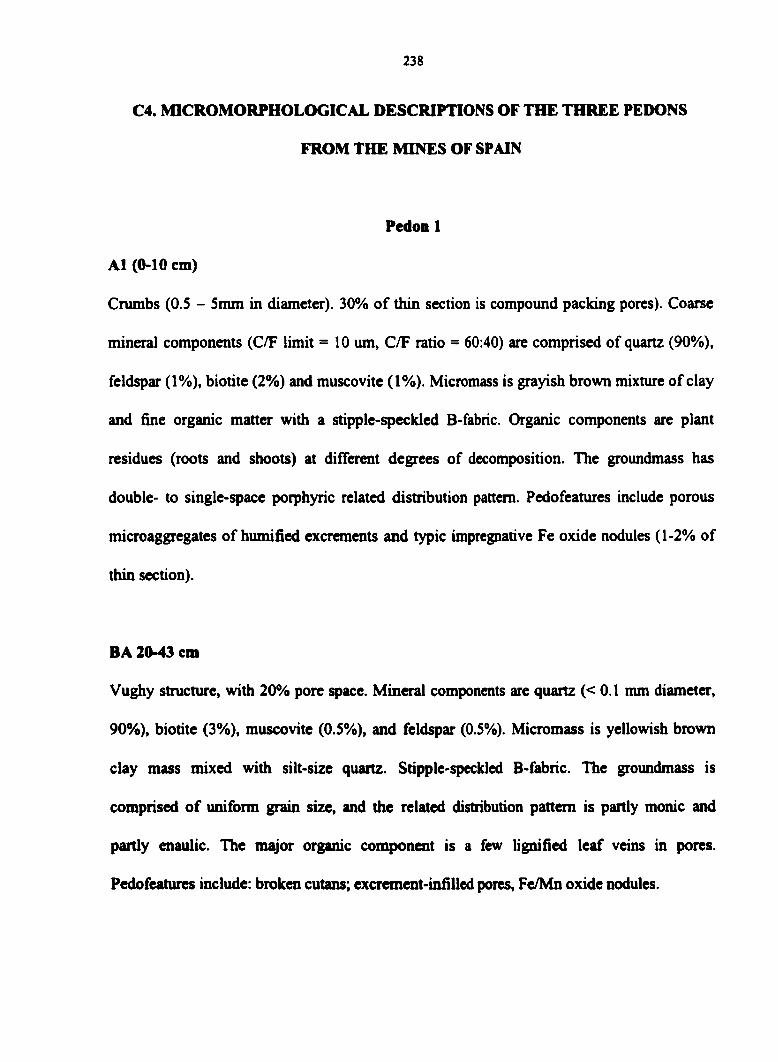
238
C4. MICROMORPHOLOGICAL DESCRIPTIONS OF THE THREE PEDONS
FROM THE MINES OF SPAIN
Pedon 1
A1 (0-10 cm)
Crumbs (O.S - Sinm in diameter). 30% of thin section is compound packing pores). Coarse
mineral components (C/F limit = 10 um, C/F ratio = 60:40) are comprised of quartz (90%),
feldspar (1%), biotite (2%) and muscovite (1%). Micromass is grayish brown mixture of clay
and fine organic matter with a stipple-speckled B-fabric. Organic components are plant
residues (roots and shoots) at different degrees of decomposition. The groundmass has
double- to single-space poiphyric related distribution pattern. Pedofeatures include porous
microaggregates of humified excrements and typic impregnative Fe oxide nodules (1-2% of
thin section).
BA 20-43 cm
Vughy structure, with 20% pore space. Mineral components are quartz (< 0.1 mm diameter,
90%), biotite (3%), muscovite (0.5%), and feldspar (0.5%). Micromass is yellowish brown
clay mass mixed with silt-size quartz. Stipple-speckled B-fabric. The groundmass is
comprised of uniform grain size, and the related distribution pattern is partly monic and
partly enaulic. The major organic component is a few lignified leaf veins in pores.
Pedofeatures include: broken cutans; excrement-infilled pores, Fe/Mn oxide nodules.
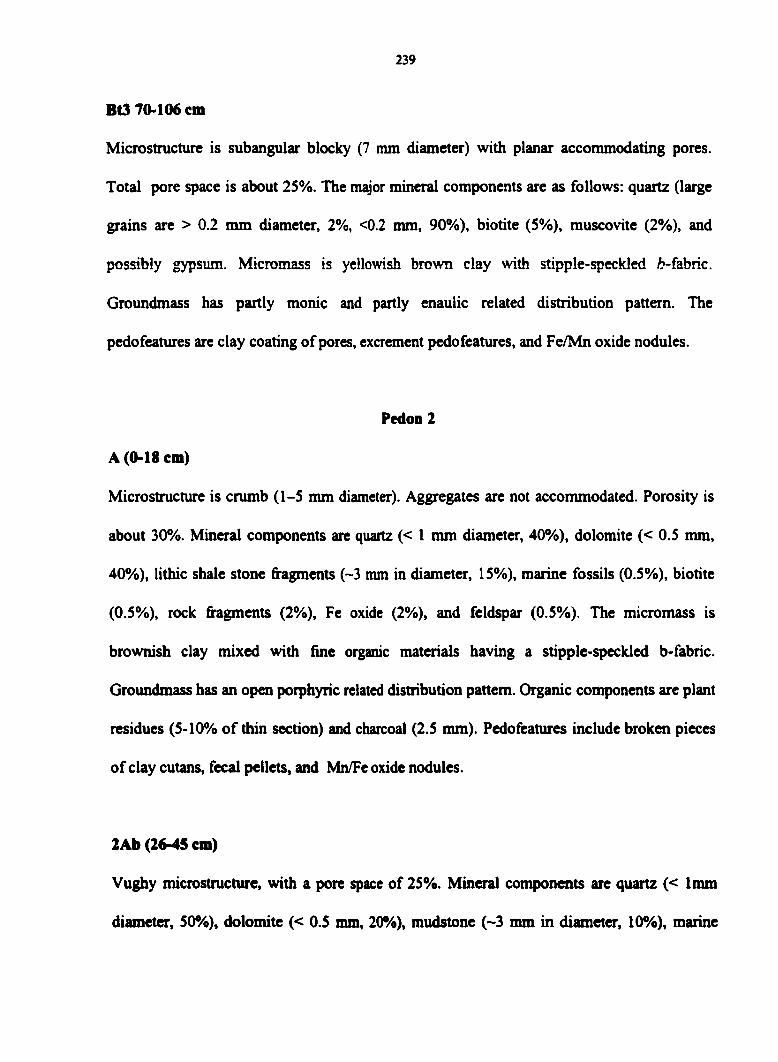
239
Bt3 70-106 cm
Microstructure is subangular blocky (7 nun diameter) with planar accommodating pores.
Total pore space is about 25%. The major mineral components are as follows: quartz (large
grains are > 0.2 mm diameter, 2%, <0.2 mm, 90%), biotite (5%), muscovite (2%), and
possibly gypsum. Micromass is yellowish brown clay with stipple-speckled ^?-fabric.
Groundmass has partly monic and partly enaulic related distribution pattern. The
pedofeatures are clay coating of pores, excrement pedofeatures, and Fe/Mn oxide nodules.
Pedon 2
A (0-18 cm)
Microstructure is crumb (1-5 mm diameter). Aggregates are not accommodated. Porosity is
about 30%. Mineral components are quartz (< 1 mm diameter, 40%), dolomite (< 0.5 mm,
40%), lithic shale stone fragments (~3 mm in diameter, 15%), marine fossils (0.5%), biotite
(0.5%), rock fragments (2%), Fe oxide (2%), and feldspar (0.5%). The micromass is
brownish clay mixed with fine organic materials having a stipple-speckled b-fabric.
Groundmass has an open porphyric related distribution pattern. Oganic components are plant
residues (5-10% of thin section) and charcoal (2.5 mm). Pedofeatures include broken pieces
of clay cutans, fecal pellets, and Mn/Fe oxide nodules.
2Ab (26-45 cm)
Vughy microstructure, with a pore space of 25%. Mineral components are quartz (< 1mm
diameter, 50%), dolomite (< 0.5 mm, 20%), mudstone (~3 nun in diameter, 10%), marine

240
fossils (1%), biodte (0.5%), (2%), and feldspar (1%). Micromass is reddish brown clay, with
stipple-speckled 6-fabric. Groundmass has an open- to single-spaced porphyric related
distribution pattern. Pedofeatiires include broken cutans, fecal pellets, and Fe/Mn oxide
nodules.
2Bw2 (59-84 cm)
Microstructure is complex, comprising weak subangular blocky structure that breaks into
clods. Pores comprise accommodating planes and few chambers and channels with a total
porosity of about 30%. Mineral components are quartz (< 1 mm diameter, 20%, <0.3 mm,
40%), dolomite (< 0.5 mm, 20%), accretion clay (~6 mm in diameter, 10%), and feldspar
(1%). Micromass is dark brownish clay with stipple-speckled 6-fabric. The groundmass has
an open porphyric related distribution pattern. Pedofeatures include pore and grain coatings
of clay and Fe/Mn oxide nodules (~1% of thin section).
Pedon 3
A (0-10 cm)
Partly crack microstructure and crumbs with 15-20 % randomly distributed pore spaces.
Coarse fraction is dominated by dolomite fragments (30% that range from 0.1 to 0.5 mm in
diameter), medium quartz grains (20%), and feldspars (2%). Fine fraction comprises clay
mixed with amorphous Fe-oxides and microcrystals of quartz. Organic components comprise
many plant tissues at different stages of decomposition. The micromass has an
undifferentiated fr-fabric resulting from patches of oriented clay mixed with Fe oxides.
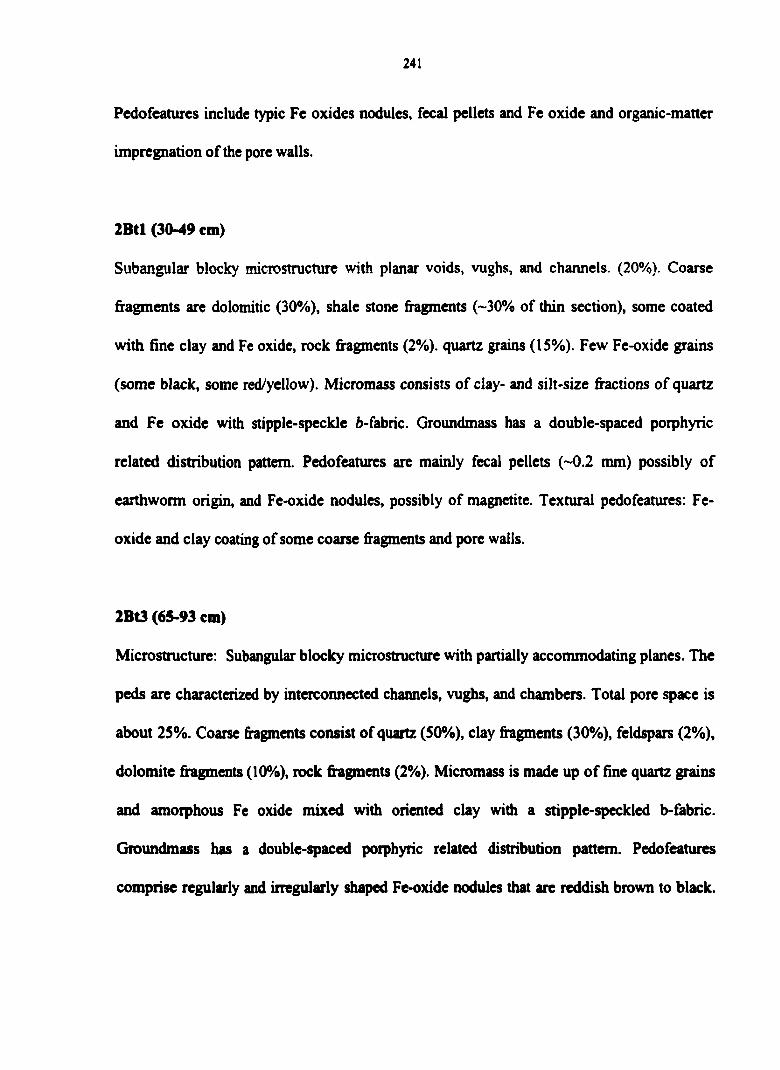
241
Pedofeatures include typic Fe oxides nodiUes, fecal pellets and Fe oxide and organic-matter
impregnation of the pore walls.
2Btl (30-49 cm)
Subangular blocky microstnicture with planar voids, vughs, and channels. (20%). Coarse
fragments are dolomitic (30%), shale stone fragments (~30% of thin section), some coated
with fine clay and Fe oxide, rock fragments (2%). quartz grains (15%). Few Fe-oxide grains
(some black, some red/yellow). Micromass consists of clay- and silt-size fractions of quartz
and Fe oxide with stipple-speckle 6-fabric. Groundmass has a double-spaced porphyric
related distribution pattern. Pedofeatures are mainly fecal pellets (--0.2 mm) possibly of
earthworm origin, and Fe-oxide nodules, possibly of magnetite. Textural pedofeatures: Fe-
oxide and clay coating of some coarse fragments and pore walls.
2Bt3 (65-93 cm)
Microstnicture; Subangular blocky microstnicture with partially accommodating planes. The
peds are characterized by interconnected channels, vughs, and chambers. Total pore space is
about 25%. Coarse fragments consist of quartz (50%), clay fragments (30%), feldspars (2%),
dolomite fragments (10%), rock fragments (2%). Micromass is made up of fine quartz grains
and amorphous Fe oxide mixed with oriented clay with a stipple-speckled b-fabric.
Groundmass has a double-spaced porphyric related distribution pattern. Pedofeatures
comprise regularly and irregularly shaped Fe-oxide nodules that are reddish brown to black.
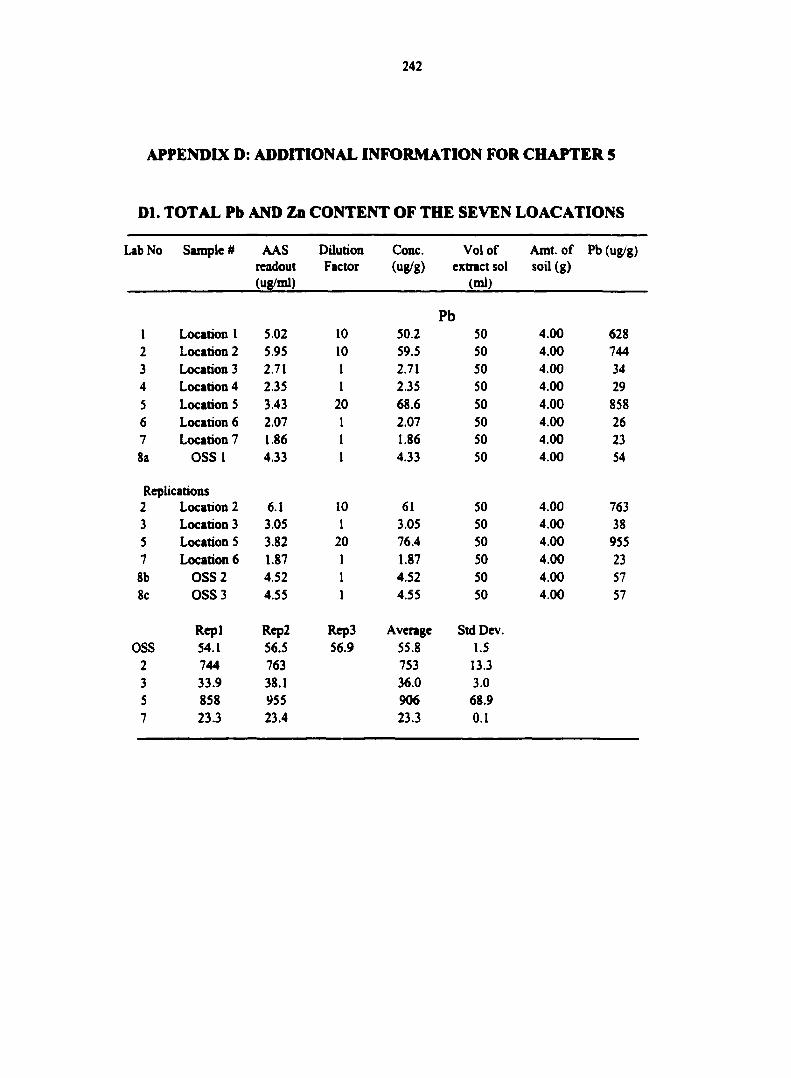
APPENDIX D: ADDITIONAL INFORMATION FOR CHAPTER 5
Dl. TOTAL Pb AND Zn CONTENT OF THE SEVEN LOACATIONS
iibNo Sample # AAS readout (ug/ml)
Dilution Factor
Cone, (ug/g)
Vol of extract sol
(ml)
Amt. of soil (g)
Pb (ug/g
Pb 1 LocatioD 1 5.02 10 50.2 50 4.00 628 2 Location 2 5.95 10 59.5 50 4.00 744 3 Location 3 2.71 I 2.71 50 4.00 34 4 Location 4 2.35 1 2.35 50 4.00 29 5 Location 5 3.43 20 68.6 50 4.00 00
00
6 Location 6 2.07 1 2.07 50 4.00 26 7 Location 7 1.86 1 1.86 50 4.00 23 8a OSS 1 4.33 1 4.33 50 4.00 54
Rq)lications 2 Location 2 6.1 10 61 50 4.00 763 3 Location 3 3.05 1 3.05 50 4.00 38 5 Location S 3.82 20 76.4 50 4.00 955 7 Location 6 1.87 1 1.87 50 4.00 23
8b OSS 2 4.52 1 4.52 50 4.00 57 8c OSS 3 4.55 1 4.55 50 4.00 57
Rq)l Rep2 Rep3 Average Std Dev. OSS 54.1 56.5 56.9 55.8 1.5
2 744 763 753 13.3 3 33.9 38.1 36.0 3.0 5 858 955 906 68.9 7 23.3 23.4 23.3 0.1

243
Zn (mg kg')
1 Location 1 0.35 200 70 50 4.00 875 2 Location 2 0.4 200 80 50 4.00 1000 3 Location 3 0.35 12.5 4.375 50 4.00 55 4 Location 4 0.38 12.5 4.75 50 4.00 59 5 Location S 0.21 200 42 50 4.00 525 6 Location 6 0.36 12.5 4.5 50 4.00 56 T Locatioo 7 0.44 12.5 5.5 50 4.00 69
8a OSS 1 0.31 50 15.5 50 4.00 194 Replications
2 Location 2 0.4 200 80 50 4.00 1000 3 Location 3 0.55 8.3 4.565 50 4.00 57 5 Location 5 0.22 200 44 50 4.00 550 7 Location 6 0.44 12.5 5.5 50 4.00 69
8b OSS 2 0.32 50 16 50 4.00 200 8c OSS 3 0.31 50 15.5 50 4.00 194
Repl Rep 2 Rep 3 Avenge Std Dev. OSS 194 200 194 196 3.6
2 1000 1000 1000 0.0 3 55 57 56 1.7 5 525 550 538 17.7 7 69 69 69 0.0

244
D2. SEQUENTIAL EXTRACTION (SEVEN LOCATIONS)
Lab # Exchang Carbonate Oxide OM bound Residual Sum of cable bound bound (HjOi) (HNOj) fractions
(Mg(N03)2) (NaOAc) (CBD)
mgkg-'
Zn 50 2 17 223 87 468 797 51 1 15 331 67 431 846
52 1 2 22 8 23 55 53 0 2 23 8 24 58 54 1 7 166 42 268 484 55 0 2 20 8 28 57 56 0 2 17 3 41 63
Pb 50 0 27 139 69 302 537 51 0 29 158 130 271 588 52 0 0 12 9 10 31 53 0 0 14 8 7 30 54 0 35 152 73 375 635 55 0 0 9 6 7 22 56 0 0 6 1 5 12