mobile augmented reality techniques for emergency response
TRANSCRIPT

Mobile Augmented Reality Techniques for Emergency ResponseAlexandre Campos
NOVA LINCS,Faculdade de Ciências e Tecnologia,
Universidade NOVA de [email protected]
Nuno CorreiaNOVA LINCS,
Faculdade de Ciências e Tecnologia,Universidade NOVA de Lisboa
Teresa RomãoNOVA LINCS,
Faculdade de Ciências e Tecnologia,Universidade NOVA de Lisboa
Isabel NunesUNIDEMI,
Faculdade de Ciências e Tecnologia,Universidade NOVA de Lisboa
Mário Simões-MarquesCINAV- Portuguese Navy
ABSTRACTIn an emergency situation, each response agent must act quicklyand accurately. The support of a mobile device that can provide anappropriate insight of the surroundings and that allows users toexchange information with the other members of the emergencyteams, can prevent harm and even save many lives. This paperpresents amobile application that integrates a georeferenced systemwith augmented reality techniques, in order to serve the needs of theoperatives in emergency situations. The work intends to introducesolutions which optimize the performance with which the usertakes advantage of the mobile application, such as the organizationof the data flow that is displayed and the augmentation of thesurrounding area. User studies were conducted with members ofthe National Navy. The results were positive although there arestill some aspects that should be improved.
CCS CONCEPTS•Human-centered computing→Mixed / augmented reality.
KEYWORDSemergency response, mobile augmented reality, location based sys-tem
ACM Reference Format:Alexandre Campos, Nuno Correia, Teresa Romão, Isabel Nunes, and MárioSimões-Marques. 2019. Mobile Augmented Reality Techniques for Emer-gency Response. In 16th EAI International Conference on Mobile and Ubiqui-tous Systems: Computing, Networking and Services (MobiQuitous), Novem-ber 12–14, 2019, Houston, TX, USA. ACM, New York, NY, USA, 9 pages.https://doi.org/10.1145/3360774.3360825
Permission to make digital or hard copies of all or part of this work for personal orclassroom use is granted without fee provided that copies are not made or distributedfor profit or commercial advantage and that copies bear this notice and the full citationon the first page. Copyrights for components of this work owned by others than ACMmust be honored. Abstracting with credit is permitted. To copy otherwise, or republish,to post on servers or to redistribute to lists, requires prior specific permission and/or afee. Request permissions from [email protected], November 12–14, 2019, Houston, TX, USA© 2019 Association for Computing Machinery.ACM ISBN 978-1-4503-7283-1/19/11. . . $15.00https://doi.org/10.1145/3360774.3360825
1 INTRODUCTIONIn emergency situations, such as natural disasters, it is crucial forfirst responders to have a clear and adequate access to informationabout the surrounding environment, in order to allow a fast andefficient response. Dealing with these scenarios is not a simple task,since usually first responders face chaotic situations in places theydo not know and often with inaccurate and incomplete informationregarding the events. However, recent technological advances allowthe arising of new approaches and techniques to respond to theneeds.
Mobile devices are increasingly being used by our society and areplaying an important role in how we perceive the world and relatewith others. Augmented reality, on the other hand, is a technologythat is gaining preponderance and various ways of integrating it indifferent contexts are currently being studied.
The aim of this work is to develop a mobile application capa-ble of assisting the tasks and decisions of first responders throughthe use of emerging technologies, namely augmented reality tech-niques, that allow the visualization of georeferenced data, whichcorrespond to the various occurrences (points of interest, incidents,teams operating) reported during an emergency operation.
The mobile application integrates an intelligent distributed sys-tem, funded by the National Ministry of Defense and by the Na-tional Navy, that aims at supporting and facilitating the exchangeof information between the different actors involved in disasterrecovery and rescue operations, especially the agents operating onthe ground (first responders) and the decision makers present inthe command center, providing them with a situational and holisticunderstanding of the occurrences [11].
The mobile application developed in the scope of this workfollows an iterative and user-centered design methodology andstarted from a previously built prototype [9]. The new version,discussed in this article, adds new solutions at the level of thegraphical interface, new features, and improved techniques thatenhance the user experience, including optimized augmented realitytechniques, which are the main subject of this work.
This paper discusses the mobile application development pro-cess, the new contributions introduced, mostly augmented realitytechniques, and the consequent outcomes. It is structured as fol-lows. Section 2 briefly reviews related work in the field of mobile

MobiQuitous, November 12–14, 2019, Houston, TX, USA Alexandre Campos, Nuno Correia, Teresa Romão, Isabel Nunes, and Mário Simões-Marques
augmented reality for emergencies. Section 3 present the applica-tion development process, describing the prototype features andthe way they were implemented. Section 4 summarizes the userevaluations performed and the results obtained. Last section refersto the conclusions and describes the future work to be done.
2 RELATEDWORKAugmented reality (AR) combines, in real time, virtual objects withthe real world, providing additional information about the realenvironment. AR techniques have been used inmany different areas,such as military, infrastructure construction, robotics, medicine orentertainment [1]. Marketing campaigns and tour itineraries arealso benefiting from the use of AR systems [17]. In the contextof emergency situations, mobile systems that make use of AR arebeing studied and developed as described next.
Training emergency responders through AR mobile interfaces - Thework described in [13] aims at supporting emergency responderstrainees in acquiring familiarity with new technologies which canprepare them to face disaster situations. The authors propose theadoption of augmented reality mobile interfaces to enhance thetraining efficacy for on-site crisis preparedness activities. The sys-tem provides an integrated solution for mobile devices which iscomposed by two visualization modalities: MapMode correspondsto a two-dimensional map view, where paths and geographic objectsof interest are drawn on the map; LiveMode exploits the augmentedreality techniques in order to improve users perception about theirsurroundings. To make use of this system, a disaster scenario isbuilt and the trainees are requested to perform some specific tasksthat are usually difficult to perform under stress in the real world.
Augmented reality system for earthquake disaster response - In [8],an augmented reality system for earthquake disaster response isdescribed. This system uses augmented reality techniques to displayadditional information in the context of a disaster, more specificallyearthquakes. Such information can be humans hidden by debris orsimulations of damages. The whole system consists of a disastermanagement tool (DMT) made for experts on search and rescue(SAR), whose main goal is to find and rescue people trapped in therubble of collapsed buildings. An AR system is part of the DMTand it was developed in order to enable SAR experts of differentinstitutions, that have to work together, to communicate and ex-change information among each other. The virtual images overlaysthe real world and the result can be observed with a display or ahelmet mounted retinal display.
Augmented reality for fire and emergency services - In [16], an aug-mented reality system for fire and emergency services is proposed.The system aims at improving the collaboration between differententities involved in a fire emergency and at providing a rapid flow ofinformation across different devices used in this context. Throughthe aid of augmented reality, displayed on head mounted displays,certain locations can be target on a 3D map which can be seenby the operators. Field operators can also use augmented realitymarkers to mark relevant information, which is then accessible toall other entities involved in the operations. In addition, buildingplans can be loaded into the real environment, giving the user abetter perception of the area. When the operation ends, the created
augmented reality objects are saved and are subsequently used foranalysis as to how the operation unfolded.
One of the main challenges inherent to the usage of augmentedreality systems, especially mobile augmented reality systems, is theproper organization of the virtual objects made available to the user.Several techniques have been studied with the aim of optimizingthe positioning of virtual objects on the real environment, whileothers were created to maximize the relevance of the displayedvirtual objects.
Methods to automatically filter information according to theneeds of the user are suggested by some authors [5, 7]. These tech-niques needs to collect contextual information, such as the locationof the user or the task being performed. After being processed,the contextual information allows to check which virtual objectsshould be presented, avoiding the display of non-relevant data.
Other studies have presented different approaches to display rel-evant information in mobile augmented reality systems [14]. Thesolution consisted of representing more relevant objects throughwarm colors and less relevant objects through cold colors. In ad-dition, the opacity of the objects was altered according to theirdegree of relevance to the user, with the most relevant objectsbeing represented by higher opacity values.
Another method that seeks to make the information that is dis-played to the user more noticeable consists of aggregating objectsthat are at a very close viewing angle. This technique acts locallyand prevents the concentration of objects in the same region, whichcan cause overlapping or confusion [3].
Mobile AR applications work with a limited angle, therefore,many objects are off-screen. To address this problem three tech-niques were introduced. Mini-maps are miniature maps, usuallyplaced on the screen corner, that contain a two-dimensional refer-ential to place objects around the user location. Although accurate,some authors claim that they are difficult to interpret [12]. 3D Ar-rows, on the other hand, indicate the direction of off-screen objectsvia three-dimensional arrows. The size of the arrow is propor-tional to the distance the object is. However, this technique is onlyadequate when representing a few number of points of interest,otherwise it induces confusion. Sidebars technique provides twosidebars where off-screen objects can be displayed. The side wherethe objects are represented defines the shortest direction the usershould rotate the device to find them [15].
3 APPLICATION DEVELOPMENTThe development of the prototype described in this paper followeda user-centered design methodology, involving an iterative designprocess with several design, implementation and evaluation cyclesthat help to improve the system’s quality, functionality and inter-face. Several meetings with representatives of the Navy also tookplace, where the requirements of the prototype were discussed. Thediagram in figure 1 illustrates the development process.
In 3.1 the overall behavior of the current prototype is described,whereas in 3.2, the main contributions and techniques introducedin the scope of this work are mentioned. Subsection 3.3 exposes thetechnologies used in the development of the solution while subsec-tion 3.4 addresses the augmented reality techniques introduced.

Mobile Augmented Reality Techniques for Emergency Response MobiQuitous, November 12–14, 2019, Houston, TX, USA
Figure 1: Development process in the new prototype
3.1 Mobile Application BehaviorThe developed mobile application is a tool for first responders ad-dressing emergency situations that allows them, as members of aspecific operation team, to report and access information regardingdifferent points of interest (POI), such as command centers or ad-vanced medical posts, and incidents that occur during emergencyoperations, which can be divided into four categories: person, in-frastructure, security and hazard. All the POI and incidents reportedare associated with specific geographic coordinates. Furthermore,real-time information about each team operating on the ground,which includes their actual locations, is also provided through theapplication to all teams.
The information about each occurrence (POI, incidents and oper-ation teams) is centralized and shared between the different teams,allowing them to have a better perception of the environment inwhich they are inserted, optimizing their tasks.
In addition to the occurrences, the operating teams are also ableto consult, through the application, the orders assigned to them.
POI and incidents are usually inserted by operation teams whoserole is to make the site recognition (RECON), and the other teams,such as search and rescue (SAR) or rapid intervention teams (BIR),may rely on this collect data to perform their tasks and also edit it.Users, who are logged as members of a specific team, can accessoccurrences through search pages (Fig. 2 left) or a georeferencedview that makes use of a map (Fig. 2 center). To complement the two-dimensional map view, the user can use the augmented reality view(Fig. 2 right), which presents the events from a different perspective.
Each object represented in the AR view may correspond to eitheran occurrence or a set of occurrences. Users can interact with theobjects displayed in the AR view. Objects that represent multipleoccurrences can be expanded so that each of the associated occur-rences is displayed. Objects that represent a single occurrence canbe selected and so its detailed information is provided
In the AR view, the user has also several options available thatallow to configure the way the data is displayed, so that the mostimportant data for the user can be quickly and efficiently identified.The options introduced are discussed in more detail in section 3.4.
3.2 Contributions of The Developed WorkThe definition of the system requirements, which were improvedthroughout the development process, in collaboration with theNavy representatives, contributed to the construction of a datamodel better suited to the needs of the project, or even to theimplementation of a new interface and functionalities. One of the
Figure 2: Search page (left); Map view (center); AR view(right)
added requirements refers to the possibility of specifying whatare the objectives (specific incidents or POI) of the orders that areassigned to the operation teams. In this way, it was easy to concludethat the occurrences do not always present the same relevance foreach of the response teams.
The development of the new functional prototype, object of studyof this article, was also based on the results obtained in the usabilitytests performed at the end of the development of the previousprototype [9], as well as those that resulted from the introductoryusability tests conducted at the beginning of the development of thiswork, which also evaluated the old prototype and are mentionedin section 4. The conclusions drawn from these two evaluationsto the previous prototype revealed the need to adjust its graphicinterface in order to make it more attractive, clear and comfortablefor the user, as well as making it responsive to devices of differentdimensions. As far as the augmented reality is concerned, somedifficulties were found in the proper visualization of the differentoccurrences, especially when these were concentrated in the sameregion. In these cases, occurrences appeared at different heights,often outside the user’s field of vision, or even overlapped witheach other.
These are aspects that deserved special attention during thedevelopment of the application described in this paper.
3.3 Implementation DetailsThe application runs in Android operating system and it is nowcompatible with devices of different dimensions. The communica-tion with the remote server is ensured via HTTP requests.
New data insertion layouts took into account previous ergonomicstudies carried out on the subject [6]. To reduce the learning process,the implemented insertion and query layouts are similar for all datatypes in the application.
The symbology adopted to represent the points of interest, inci-dents and teams resulted from the combination of symbols used inother emergency exercises, as well as other related proposals [10].
TheWikitude SDK was used to implement the augmented realityview in the application. The techniques introduced in the latest

MobiQuitous, November 12–14, 2019, Houston, TX, USA Alexandre Campos, Nuno Correia, Teresa Romão, Isabel Nunes, and Mário Simões-Marques
Figure 3: Cluster of occurrences (top); Expanded cluster ofoccurrences (bottom)
version of the prototype have made use of the features supportedby the Javascript API, which includes the possibility of creatinglocation-based markers by using georeferenced data. These mark-ers are associated with geographic coordinates and represent thevarious points of interest, incidents and operation teams.
3.4 Augmented Reality Techniques IntroducedAlthough the results of the work developed consisted of the mod-eling of a new data structure and the introduction of new func-tionalities and a more suitable graphical interface, the main objectof discussion and analysis of the present article concerns the opti-mizations and augmented reality techniques adopted in the mostrecent version of the functional prototype. These contributions arepresented below.
3.4.1 Information Overlap. The previous prototype representedthe augmented reality objects at different heights, according tothe distance to the user. This solution contributed to reducing theprobability of seeing objects overlapping in space, but often forcedthe user to rotate the device vertically to locate all objects. Thenew prototype implemented a solution that displays by default allobjects on the horizon line, when the user positions the deviceperpendicularly to the ground.
Regarding the possible large concentration of objects in a givenarea of the screen, which may lead to data overlapping, two ap-proaches were introduced to group those that are in a similar angleof view.
The first one was based on the Wikitude documentation, whichsuggests a simplified algorithm for creating clusters when pointsare in the same region. The regions are delimited according to theangle they form with the user. However, it simply divides the spaceinto predefined regions. Thus, objects that are on the border ofneighboring regions are not grouped, although they may overlap.
An alternative algorithm, which dynamically creates the spaceregions occupied by each cluster, aggregating all points that transi-tively occupy similar regions, was also implemented. This optionavoids the assignment of objects that are in a similar viewing an-gle to different clusters, but, in the other hand, may lead to theformation of clusters associated with excessively wide regions.
Both approaches are available and the user can choose which oneis best suited to the circumstances in which he is inserted. In bothapproaches, when the user selects the AR object that represents aparticular cluster, it is expanded during ten seconds, regroupingafter that period of time. Figure 3 shows a cluster before and afterbeing expanded.
3.4.2 Information Filtering. While it may be an added value inmostcases, automatic information filtering is not advisable in systemsthat provide assistance in emergency situations, as much as it is notdesirable to omit information without the user being aware of itsexistence. Although first responders normally have their functionswell defined in the operation, the remaining information shouldnot be overlooked.
In the scope of this work, a visualization option was introducedthat applies different levels of opacity to each occurence accordingto the relevance that it presents to the user. When this functionalityis enabled, the objectives of the running orders always maintain themaximum opacity value, since they correspond to the user’s focusat that instant. The other occurrences present different levels ofopacity, according to the type of operation team that is making useof the application. Search and rescue teams, for example, typicallyhave people-related actions, so these occurrences have a higheropacity value than the remaining ones.
Figure 4 illustrates the application of different opacities in twooccurrences. The injured person, unlike the hospital, coincide, inthis example, with the objective of the running order and thereforemaintains the maximum value of opacity.
3.4.3 Off-screen Information. From the analysis of all the off-screentechniques mentioned in the related work (2), table 1 has beenconstructed.
The first column of the table contains the techniques to be com-pared. The second column indicates the ease of integrating thetechnique into the existing prototype. The parameter in the thirdcolumn refers to the possibility of differentiating points accordingto categories. The ease with which the user can identify the objectsthrough the technique is represented in the values of the fourthcolumn. In the last column it is mentioned the scalability that thetechnique presents for a high number of objects.
From the table results, it has been concluded that the techniquesthat best fit the current prototype are the mini-map and sidebars,
Mobile Augmented Reality Techniques for Emergency Response MobiQuitous, November 12–14, 2019, Houston, TX, USA
Figure 4: Different values of opacity in the AR view
Table 1: Comparison between off-screen visualization tech-niques
Technique Integ. Categ. Ident. Scal.Mini-map 3 2 2 33D Arrows 1 2 3 2Sidebars 2 3 3 3
since it requires the usage of many points. Therefore, the prototypemakes use of a radar which behaves in a manner equivalent to amini-map.
The points that mark the different objects in the user’s vicinityhave been designed with the formats and colors shared by theaugmented reality symbols to become more easily distinguishableby the users, as can be seen in figure 3.
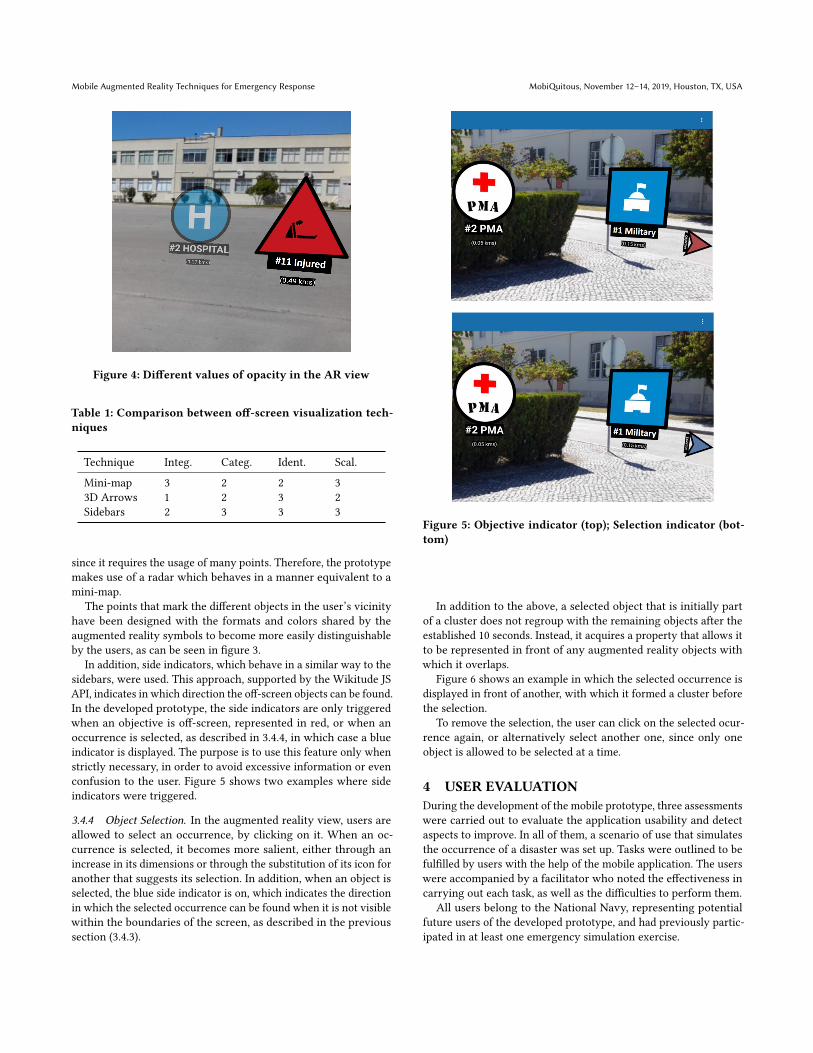
In addition, side indicators, which behave in a similar way to thesidebars, were used. This approach, supported by the Wikitude JSAPI, indicates in which direction the off-screen objects can be found.In the developed prototype, the side indicators are only triggeredwhen an objective is off-screen, represented in red, or when anoccurrence is selected, as described in 3.4.4, in which case a blueindicator is displayed. The purpose is to use this feature only whenstrictly necessary, in order to avoid excessive information or evenconfusion to the user. Figure 5 shows two examples where sideindicators were triggered.
3.4.4 Object Selection. In the augmented reality view, users areallowed to select an occurrence, by clicking on it. When an oc-currence is selected, it becomes more salient, either through anincrease in its dimensions or through the substitution of its icon foranother that suggests its selection. In addition, when an object isselected, the blue side indicator is on, which indicates the directionin which the selected occurrence can be found when it is not visiblewithin the boundaries of the screen, as described in the previoussection (3.4.3).
Figure 5: Objective indicator (top); Selection indicator (bot-tom)
In addition to the above, a selected object that is initially partof a cluster does not regroup with the remaining objects after theestablished 10 seconds. Instead, it acquires a property that allows itto be represented in front of any augmented reality objects withwhich it overlaps.
Figure 6 shows an example in which the selected occurrence isdisplayed in front of another, with which it formed a cluster beforethe selection.
To remove the selection, the user can click on the selected ocur-rence again, or alternatively select another one, since only oneobject is allowed to be selected at a time.
4 USER EVALUATIONDuring the development of the mobile prototype, three assessmentswere carried out to evaluate the application usability and detectaspects to improve. In all of them, a scenario of use that simulatesthe occurrence of a disaster was set up. Tasks were outlined to befulfilled by users with the help of the mobile application. The userswere accompanied by a facilitator who noted the effectiveness incarrying out each task, as well as the difficulties to perform them.
All users belong to the National Navy, representing potentialfuture users of the developed prototype, and had previously partic-ipated in at least one emergency simulation exercise.

MobiQuitous, November 12–14, 2019, Houston, TX, USA Alexandre Campos, Nuno Correia, Teresa Romão, Isabel Nunes, and Mário Simões-Marques
Figure 6: Occurrence selected in augmented reality view
4.1 Preliminary EvaluationThe first evaluation had an introductory nature and allowed tocollect information about the behavior of the existing preliminaryprototype. Three users, aged between 18 and 24 years, all males,experienced the application through three different mobile devices,and notes were drawn about the user experience which guided theredesign of the application and the optimization of the augmentedreality techniques as it is described in this paper.
In addition to the problems reported by users regarding thegraphical interface of the prototype, they also had difficulties in lo-cating the occurrences in the augmented reality view, as sometimesit was necessary to move the device vertically to locate them. Atother times the occurrences even came to overlap with each other.
4.2 Intermediate and Final EvaluationsThe last two assessments consisted of a more formal process andsome written questionnaires were answered by the participantsafter performing the assigned tasks.
4.2.1 Methodology and Tasks Performed. In both intermediate andfinal evaluations, before the tests started, a brief explanation of thescenario and tasks to be performed was given to the users. Each testsession was comprised by two different parts, each performed byone different user. In order to complete all the tasks (in a balancedway), each user participated in two distinct test sessions, playingdifferent roles in each one of them. A test session starts with theintervention of a user which represents a recognition team (RECON)member. This kind of teams are mainly responsible for reportingevents at the place where the operation takes place, and so, thetasks requested to this user served essentially the purpose of testingthe insertion/editing of data (points of interest and incidents) inthe application, as well as checking the usability of the applicationand the usefulness it presents in recognition operations.
The second part of a test session was performed by a user play-ing the role of a search and rescue team (SAR) member. This userwas requested to search for points of interest and incidents previ-ously entered by the recognition team member. In addition, theywere asked to find this same information in the map and AR view.
Figure 7: Participant performing an user test
These two visualization options were also used to assist the user innavigating to these points on the ground.
Figure 7 shows a participant performing the user tests. Duringthe test sessions, users were encouraged to think aloud, sharingtheir feelings and thoughts.
4.2.2 Intermediate Evaluation. For this evaluation, five elements ofthe navy, aged between 19 and 24 (mean: 20.2, SD: 1.94), all male andwith experience in emergency simulation exercises, participated inthe user tests. The device used was a Sony Xperia G3221.
At the end of the test sessions, the participants answered twoquestionnaires to assess the experience of using the application.One uses the System Usability Scale (SUS) [2], which is a very easyscale to administer to participants in order to measure the usabil-ity, while the other is the standard User Experience Questionnaire(UEQ) [4], which measures the user experience of interactive prod-ucts. Furthermore, a few questions were asked specifically to getthe participants opinion about the main features of the application.
Both SUS and additional questions were based on a Likert scale,ranging from 1 (totally disagree) and 5 (totally agree).
The tasks performed in the augmented reality view consistedmainly in the identification of occurrences, which also includedtheir identification through the existing radar. Participants werealso asked to identify clusters of objects, attempting to test theease with which they manipulated and accessed their content. Thefeatures related to the selection of an occurrence, the side indicatorsand the differentiation of opacity values (according to the relevanceof the occurrence) had not yet been implemented at the time of thisevaluation. Therefore they were not tested at this stage.
On a Likert-scale of 1 to 5, with 5 being the best score, the averageresponse rate was 4.0 when users were asked how easy it was tooperate the augmented reality view and 4.2 when they rated thestatement "Augmented reality view is a valuable complement tothe map view".

Mobile Augmented Reality Techniques for Emergency Response MobiQuitous, November 12–14, 2019, Houston, TX, USA
Figure 8: SUS results obtained in the intermediate evaluation(top); SUS results obtained in the final evaluation (bottom)
Regarding the clustering of concentrated points, two partici-pants commented that the expanded points should not necessarilyregroup after a few seconds unless it is explicitly requested by theusers.
The average score obtained in the SUS questionnaires was 76.5,which is good, but susceptible to improvements, while the UEQquestionnaires results were also positive, as shown in figures 8 (top)and 9 (top).
After these usability tests, new augmented reality techniqueswere introduced, namely the selection of an occurrence, the sideindicators and the differentiation of opacity values, as well as someadjustments in the interface and overall application behavior.
4.2.3 Final Evaluation. For the final usability tests, which tookplace two months after the previous ones, ten participants (ninemale and one female), between the ages of 19 and 24 (mean: 20.5,SD: 1.57), carried out the tasks proposed and answered the question-naires. SUS and UEQ were considered once again and the additionalquestionnaire included more questions than those covered in theintermediate evaluation. The device used was a tablet SamsungGalaxy Note 10.1 2014 Edition.
All of the AR techniques mentioned in 3.4 were tested and nouser had difficulty in completing the proposed tasks.
The score obtained in the SUS questionnaire was 82%, which isan improvement of 5.5% when compared to the results obtainedpreviously.
As can be seen in figure 8 (bottom), question "Q8" ("I foundthe system very cumbersome to use"), which follows an invertedlogic, obtained the maximum score of 100%, whilst "Q6" ("I thoughtthere was too much inconsistency in this system") also surpassed90%, which indicates that the application is not cumbersome andit is consistent. In contrast, although questions "Q4" ("I think that
Figure 9: UEQ results obtained in the intermediate evalua-tion (top); UEQ results obtained in the final evaluation (bot-tom)
I would need the support of a technical person to be able to usethis system") and "Q10" ("I needed to learn a lot of things beforeI could get going with this system") also obtained positive scores,they reached weaker outcomes than those previously obtained. Thismay indicate that the addition of new features led some users tothink that it would be useful to obtain training before using themobile application in real emergency situations.
Regarding the UEQ questionnaire, overall results also improved,as shown in figure 9.
The optimization and introduction of new AR techniques mayhave contributed to the enhancement of "Stimulation" and "Effi-ciency", whereas the interface and overall application behavioradjustments led to improvements on "Dependability".
In addition to the first four questions, which were also answeredin the intermediate evaluation, 11 new questions were added, fo-cusing mostly on the experience of use of the AR view. All of themare mentioned in figure 10.
All the answers to questions related to the implemented AR tech-niques obtained an average score higher than 4 and were betterwhen compared with those obtained in the intermediate usabil-ity tests (regarding AR only questions "3" and "4" were asked inboth evaluations). Thus, it can be concluded that these techniquesare viable options to solve the problem based on the difficulty oforganizing the flow of data displayed in augmented reality envi-ronments. In particular, the side indicators and the clusters werethe techniques that presented better outcomes. Regarding the tech-nique that applies different opacities to occurrences, according totheir relevance, quite positive results were also obtained. One ofthe participants suggested that, in addition to this technique, mostrelevant occurrences could also blink.

MobiQuitous, November 12–14, 2019, Houston, TX, USA Alexandre Campos, Nuno Correia, Teresa Romão, Isabel Nunes, and Mário Simões-Marques
Figure 10: Results of additional questions in the final evalu-ation
The comparison between the two implemented clustering op-tions comes from the declared preference of the users after usingthe two aggregation techniques to perform the tasks. The behaviorof those aggregation algorithms is dependent on the exact locationwhere the occurrences are introduced and where the user is. Smallchanges between each of the test sessions are sufficient for thealgorithm to calculate the clusters in a different way. As such, theresults obtained by the various usability tests were not homoge-neous. In 40% of the cases, the participants did not observe anydifference when they changed the aggregation algorithm, whereasof the remaining 60%, 2/3 preferred the alternative algorithm, toavoid more effectively overlapping data in neighborhood areas,while the other 1/3 preferred the Wikitude algorithm, because itdoes not excessively aggregate objects. These data are enough toget a trend but not to draw conclusions.
When comparing which of the viewing options (map view orAR view) is more efficient, both in identifying and navigating tooccurrences, opinions are also not unanimous, as can be seen fromthe answers provided to questions "11","12","14" and "15" of theadditional questionnaire. Some participants find the map viewmoresuitable, while others feel more comfortable when using the ARview. The standard deviation obtained in these questions reinforcesthe idea that there was some division in the opinions of the users.One participant commented that he preferred the map view if hewas in a location he knew well, while in an unknown location theview of AR might be more advantageous.
5 CONCLUSIONS AND FUTUREWORKThis paper presented the development process of a mobile applica-tion that assists first responders in emergency situations, highlight-ing the augmented reality techniques that were implemented.
The aim of this work was to develop a tool which facilitatesthe report of data in these contexts, such as points of interest andincidents, as well as provide a way of communication betweenthe agents present in those operations. The prototype uses an in-teractive map where the occurrences are displayed and also an
augmented reality option that allows users to visualize and interactwith the information content.
The results of the evaluations were generally good and have im-proved after the introduction of new augmented reality techniques.
It became clear that augmented reality is advantageous in assist-ing in emergency situations, serving as a valuable complement tothe map view.
Regarding AR, the next steps may consist of developing newaggregation techniques which lead to more conclusive results inthis matter.
It is also foreseen to integrate the mobile application with thecentral system in order to provide interoperability between systemsand allow the communication between all the actors in the groundand the decision makers in the command center.
It would also be interesting to develop a tool that focused onthe time spent performing each task and on the number of clicksneeded to complete each one, introducing optimizations at thislevel.
ACKNOWLEDGMENTSThis work is funded by FCT/MCTES PEstUID/CEC/04516/2019NOVA LINCS, the Portuguese Ministry of Defense, and the Por-tuguese Navy.
REFERENCES[1] Ronald T Azuma. 1997. A survey of augmented reality. Presence: Teleoperators &
Virtual Environments 6, 4 (1997), 355–385.[2] John Brooke. 1996. SUS-A quick and dirty usability scale. Usability evaluation in
industry 189, 194 (1996), 4–7.[3] Maria Beatriz Carmo, Ana Paula Afonso, António Ferreira, Ana Paula Cláudio, and
Gonçalo Silva. 2016. PoI Awareness, Relevance and Aggregation for AugmentedReality. In Information Visualisation (IV), 2016 20th International Conference. IEEE,300–305.
[4] Manuel Pérez Cota, Jörg Thomaschewski, Martin Schrepp, and Ramiro Gonçalves.2014. Efficient measurement of the user experience. Procedia Computer Science27 (2014), 491–498.
[5] Steven Feiner, Blair Macintyre, and Dorée Seligmann. 1993. Knowledge-basedaugmented reality. Commun. ACM 36, 7 (1993), 53–62.
[6] Diogo Figueiredo. To publish. Applying the User-Centered Design approach for Pro-totyping the Interfaces of an Intelligent Emergency Management System. Master’sthesis.
[7] Simon Julier, Yohan Baillot, Dennis Brown, and Marco Lanzagorta. 2002. In-formation filtering for mobile augmented reality. IEEE Computer Graphics andApplications 22, 5 (2002), 12–15.
[8] Johannes Leebmann. 2004. AnAugmented Reality System for EarthquakeDisasterResponse. International Archives of the Photogrammetry, Remote Sensing andSpatial Information Sciences 34 (2004).
[9] Raquel Lucas. 2017. Realidade Aumentada para Emergências. Master’s thesis.[10] Silvia T Marinova. 2018. New Map Symbol System for Disaster Management.
Proceedings of the ICA 1 (2018), 74.[11] Isabel L Nunes, Raquel Lucas, Mário Simões-Marques, and Nuno Correia. 2017.
Augmented Reality in Support of Disaster Response. In International Conferenceon Applied Human Factors and Ergonomics. Springer, 155–167.
[12] Torben Schinke, Niels Henze, and Susanne Boll. 2010. Visualization of off-screenobjects in mobile augmented reality. In Proceedings of the 12th internationalconference on Human computer interaction with mobile devices and services. ACM,313–316.
[13] Monica Sebillo, Giuliana Vitiello, Luca Paolino, and Athula Ginige. 2016. Trainingemergency responders through augmented reality mobile interfaces. MultimediaTools and Applications 75, 16 (2016), 9609–9622.
[14] Gonçalo Silva, Maria Beatriz Carmo, Ana Paula Afonso, Ana Paula Cláudio,and António Ferreira. 2015. Visualização de Objetos Off-Screen em RealidadeAumentada Móvel. 22o Encontro Português de Computação Gráfica e Interação,Coimbra (2015).
[15] Teresa Siu and Valeria Herskovic. 2013. SidebARs: improving awareness of off-screen elements in mobile augmented reality. In Proceedings of the 2013 ChileanConference on Human-Computer Interaction. ACM, 36–41.

Mobile Augmented Reality Techniques for Emergency Response MobiQuitous, November 12–14, 2019, Houston, TX, USA
[16] Aameer R Wani, Sofi Shabir, and Roohie Naaz. 2013. Augmented reality for fireand emergency services. In Int. Conf. on Recent Trends in Communication andComputer Networks, Byderabad India.
[17] Feifei Xu, Feng Tian, Dimitrios Buhalis, Jessika Weber, and Hongmei Zhang. 2016.Tourists as mobile gamers: Gamification for tourism marketing. Journal of Travel& Tourism Marketing 33, 8 (2016), 1124–1142.