moberg pharma ab -...
TRANSCRIPT

0
Corporate presentationAktiespararna Trollhättan, April 20th 2016Anna Ljung, CFO
Moberg Pharma ABPROVIDING UNIQUE PRODUCTS IN UNDERSERVED NICHES

1
Disclaimer
1
Statements included herein that are not historical facts are forward-looking statements. Such forward-looking statements involve a number of risks and uncertainties and are subject to change at any time. In the event such risks or uncertainties materialize, Moberg Pharma’s results could be materially affected. The risks and uncertainties include, but are not limited to, risks associated with the inherent uncertainty of pharmaceutical research and product development, manufacturing and commercialization, the impact of competitive products, patents, legal challenges, government regulation and approval, Moberg Pharma’s ability to secure new products for commercialization and/or development and other risks and uncertainties detailed from time to time in Moberg Pharma’s interim or annual reports, prospectuses or press releases.

2
2
Net Sales grew to 286 MSEK (full year 2015)- U.S. OTC Sales operations- Products sold in 40+ countries- 35 employees in Sthlm and NJ
Focus in OTC/Dermatology/Topicals- Leading U.S. OTC SKU in Nail Fungus- Superior PII data for MOB015
Market Cap ~750 MSEK (OMX:MOB)
Moberg PharmaPROVIDING UNIQUE PRODUCTS IN UNDERSERVED NICHES

3
3
Strategic elements
Growth strategy- Organic growth- M&A/Innovation engine
Build value through combiningBrand/IP Equity
Outlook
Profitable growth, targeting a long-term EBITDA margin of at least 25%
Moberg PharmaPROVIDING UNIQUE PRODUCTS IN UNDERSERVED NICHES

2015 – Continued growth and doubling of profit

5
5
Q415 net sales grew by 7% to MSEK 54
Year-on-year, 2015 net sales grew by 43% (21% at fixed exchange rates) and EBITDA improved by 83%
Asian launch driving growth in distributor sales
Innovation engine progress – Bupi Ph II results, Colep, Cadila, reg meetings
SEK 300 million raised in the Nordic bond market to finance growth and acquisitions
Divestment of three non-core brands enable increased focus on strategic assets
Highlights from Q415 and Q116 to date

6
Net Sales, MSEK
Growth in 2015 improved EBITDA with 83%
6
286 (+43%)
200
EBITDA, MSEK EBITDA Commercial Operations, MSEK
2015 12m2014 12m
NOTE: EBITDA Commercial Operations does not include R&D and Business Development expenses for future products outside existing brands
25
46 (+83%)
13% 16% 22% 24%
68 (+58%)
43

7
23 consecutive quarters of Sales growth
Product Sales, TTM, MSEK
7
0
50
100
150
200
250
300
Q12010
Q22010
Q32010
Q42010
Q12011
Q22011
Q32011
Q42011
Q12012
Q22012
Q32012
Q42012
Q12013
Q22013
Q32013
Q42013
Q12014
Q22014
Q32014
Q42014
Q12015
Q22015
Q32015
Q42015

8
P&L - Sales growth and doubling of profit
8
1) Research and development expenses – existing product portfolio includes R&D expenses for new product variants under existing brands, regulatory work and quality.2) Research and development expenses - future products includes R&D expenses for new product candidates, for example MOB-015.
Due to the rounding component, totals may not tally.
P&L Summary (MSEK)Q4 2015 Q4 2014 FY 2015 FY 2014
Revenue 54 44 286 200Gross profit 37 32 214 151% 68% 72% 75% 75%
SG & A ‐26 ‐25 ‐142 ‐106R&D ‐ existing product portfolio1) ‐2 ‐1 ‐6 ‐7Other operating income/operating expenses 0 4 4 6EBITDA Commercial Operations 9 9 68 43% 16% 21% 24% 22%
R&D & BD ‐ future products2) ‐5 ‐6 ‐22 ‐18EBITDA 4 4 46 25% 8% 8% 16% 13%
Depreciation/amortization ‐3 ‐2 ‐11 ‐8Operating profit (EBIT) 1 1 35 17

9
Other21%
Nalox/ Kerasal Nail
55%
Kerasal11%
JointFlex13%
RoW15%
Europe 11%
Americas 74%
Sales via distributors
28%
Direct OTC Sales 72%
Majority of revenue from direct OTC sales – Launches in Asia drives RoW product sales
9
Channels Products Geography
Distribution of revenue, January – December 2015

10
Solid cash position and positive cash flow
10
Full-year 2015 Full-year 2014
Operative cash flow +31 MSEK +16 MSEK
Cash position 45 MSEK 62 MSEK
Not including:
Bond issue of 300 MSEK closed in January 2016Bond structure also allows tap issues of additional 300 MSEK
Divestment of three non-core brands for 10 MUSD closed in April 2016

Progress in Commercial Operations

12
12
Strategic brands
Kerasal® - Foot careEmtrix®
Balmex® - Diaper rash
Domeboro® - Derma/Skin irritation
Mature brands – Divested April 1, 2016
Jointflex® - External analgesic
Vanquish® - Internal analgesic
Fergon® - Iron supplement
Focus on strategic brands

13
Kerasal Nail - the OTC market leader in the U.S.
13
No 1 with 22% market share in Q4 20151)
Key claim “visible difference in 2 weeks”. Product supported by 4 clinical studies
Available at >30 000 points of sale
1)Retail sales of nail fungus products excluding private label in Multioutlet Stores over the last 52 weeksending December 27, 2015 as reported by SymphonyIRI

14
Scalable infrastructure for marketing U.S OTC brandsRetailers/WholesalersSales Force
Contract Manufacturers
Logistics
Sales and marketing/Brand Management
14
Note: Largest retailers and whole-salers only, not an all inclusive list.

15
Acquired from Chattem (Sanofi) for $3.9 million (MSEK 33.3)– Sales trending above $4 million annually– Deal financed with existing funds
Strong heritage in baby diaper rash with broad distribution in major chains:
Closed Balmex acquisition April 24, 2015
15

16
Distributor Sales well positioned for further growth
Note: Four largest distributors only, not an all inclusive list.bv
16
Sales in >40 markets
Growth in Europe (+7%)- Emtrix® rights in six EU markets taken back
Asian launches progresses well and rapid growth of sales
- 6 markets launched - Ongoing preparations in other
Large growth potential

17
TV commercial in Malaysia – aired from Nov/Dec 2014
17

18
Launches in Asia a key growth driver
18
MalaysiaLaunch Q4 2014, already market leader
Hong KongExcellent start of sales and reorders
SingaporeLaunch started, to be ramped up
ChinaRegional launch started in May 2015
IndonesiaLaunch and TV started Aug 2015
PhilippinesLaunch started Nov 2015
Other marketsLaunch preparations ongoing

Innovation Engine
20
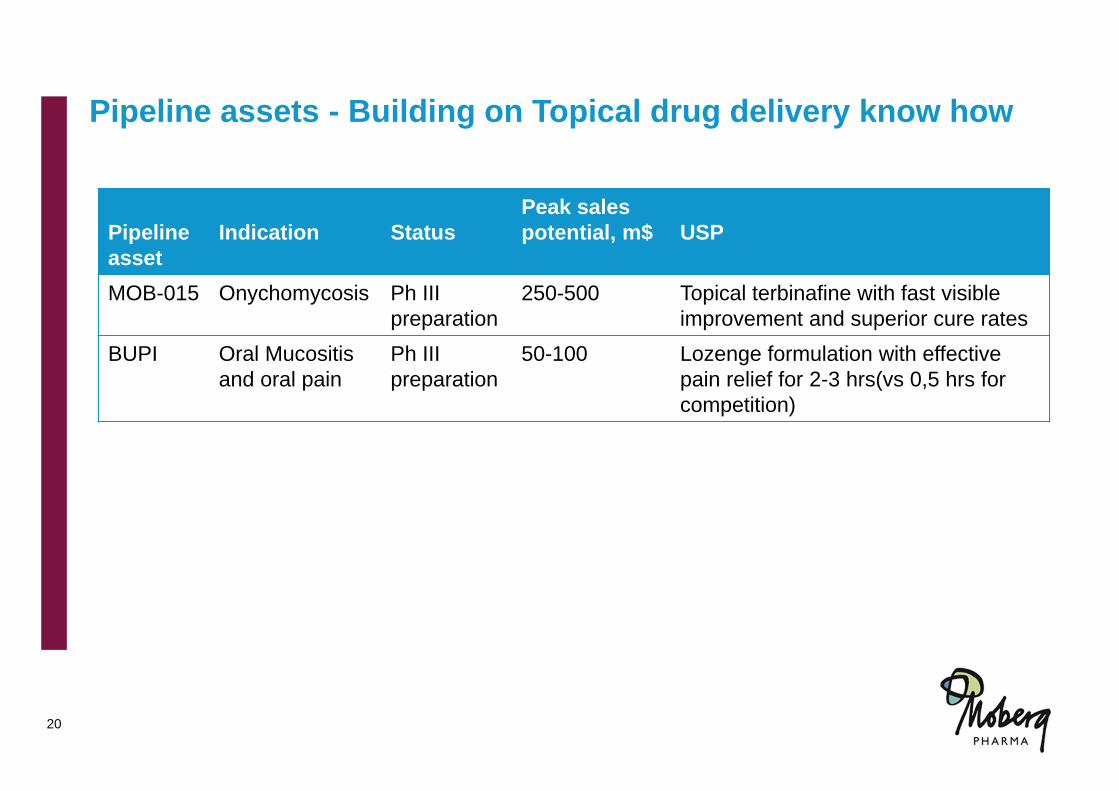
Pipeline assets - Building on Topical drug delivery know how
Pipeline asset
Indication StatusPeak sales potential, m$ USP
MOB-015 Onychomycosis Ph III preparation
250-500 Topical terbinafine with fast visible improvement and superior cure rates
BUPI Oral Mucositisand oral pain
Ph III preparation
50-100 Lozenge formulation with effective pain relief for 2-3 hrs(vs 0,5 hrs for competition)
20

21
MOB-015 – USPs and Strategy
21
USPs Targets a superior profile, in mild to moderate onychomycosisbased on phase II data and experience from the OTC product(>600 patients in clinical trials and >10 million units sold to date):
Superior cure rates – Mycological and ClinicalShorter treatment time – potentially 6 monthsFirst visible improvement within 2-4 weeks
Strategy Prepare Phase III to start in 2016Objective to maintain control of asset in key territories through phase III
1
2
3

22
BUPI targets to provide additional and prolonged pain relief
22
Product & Indication BUPI (bupivacaine lozenge) for oral pain relief (mouth and throat) 1st indication: Oral Mucositis in cancer patients. Large unmet need Other indications: Burning Mouth Syndrome, Sjögren’s syndrome, Upper
gastrointestinal endoscopy. Long-term also OTC potential.Value and Next steps Peak Sales potential $50-100m, whereof the OM indication is $20-25m Positive topline Phase II data

23
Innovation Engine
23
Organic growth Current products growing, adding new markets Line extensions adding incremental growth
- Focus on strategic brands 5 patent families enable additional products
- MOB-015, K-Nail+ patents granted
4ACQUISITIONS LAST 40 MONTHS
4PATENTS APPROVED 2015
Acquisitions/inlicensing Brands - Focus on US OTC market Pipeline assets enabling new products
Completed Acquisitions Alterna LLC, Nov 2012, $26m (2.3x Sales) Bayer brands, Dec 2013, $4.8m (1.6x Sales) Bupizenge, April 2014, dev. project,$1m Balmex, April 2015, $3.9m (<1x Net Sales)
24
24
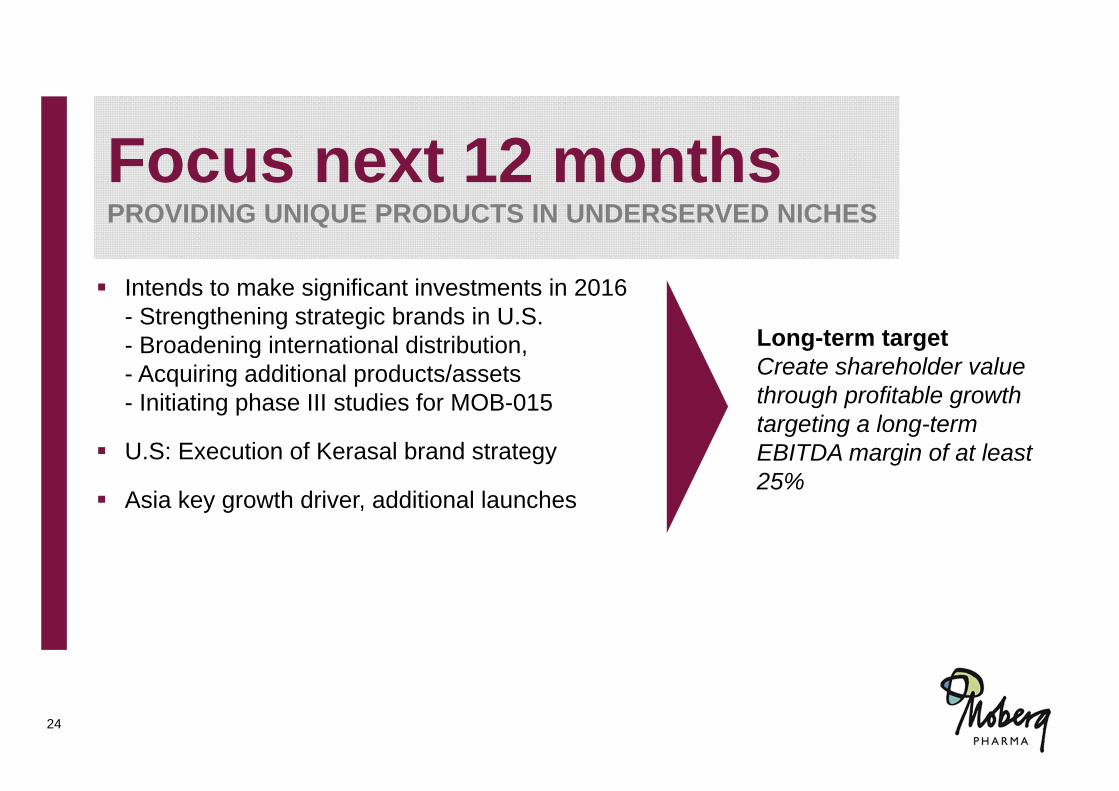
Focus next 12 monthsPROVIDING UNIQUE PRODUCTS IN UNDERSERVED NICHES
Intends to make significant investments in 2016- Strengthening strategic brands in U.S. - Broadening international distribution, - Acquiring additional products/assets - Initiating phase III studies for MOB-015
U.S: Execution of Kerasal brand strategy
Asia key growth driver, additional launches
Long-term targetCreate shareholder value through profitable growth targeting a long-term EBITDA margin of at least 25%

25
25
Commercial niche strategy enables a growing and profitable base business
Pipeline with large potential and at reasonable risk- Proven molecules limit development risk, cost and TTM
Acquisition strategy with substantial value potential- 4 acquisitions in last 40 months- Team, systems and infrastructure in place to enable scale-up- Capacity to finance deals
Strong Team with track record
Why invest in Moberg Pharma

26
26
Q&A