mnras atex style file v3 - arxiv · a. d’a` ı1, ⋆ p.a. evans2 ... 0.58 kev and an absorbing...
TRANSCRIPT
arX
iv:1
607.
0426
4v3
[as
tro-
ph.H
E]
4 S
ep 2
016
MNRAS 000, ??–?? (0000) Preprint 6th September 2016 Compiled using MNRAS LATEX style file v3.0
Evidence for the magnetar nature of 1E 161348–5055 in
RCW103
A. D’Aı1, ⋆ P.A. Evans2, D. N. Burrows3, N. P.M. Kuin4, D. A. Kann5, S. Campana6,
A. Maselli1, P. Romano1, G. Cusumano1, V. La Parola1, S. D. Barthelmy7,
A. P. Beardmore2, S. B. Cenko7,8, M. De Pasquale4, N. Gehrels7, J. Greiner9,
J. A. Kennea3, S. Klose9, A. Melandri6, J. A. Nousek3, J. P. Osborne2, D.M. Palmer10,
B. Sbarufatti3,6, P. Schady9, M.H. Siegel3, G. Tagliaferri6, R. Yates9, S. Zane4
1 INAF/IASF Palermo, via Ugo La Malfa 153, I-90146, Palermo, Italy2 Department of Physics and Astronomy, University of Leicester, Leicester LE1 7RH, UK3 Department of Astronomy and Astrophysics, Pennsylvania State University, 525 Davey Lab, University Park, PA 16802, USA4 Mullard Space Science Laboratory, UCL, Holmbury St Mary, Dorking, Surrey, RH56NT, UK5 Thuringer Landessternwarte Tautenburg, Sternwarte 5, D-07778 Tautenburg, Germany6 INAF, Osservatorio Astronomico di Brera, via E. Bianchi 46, I-23807 Merate, Italy7 NASA Goddard Space Flight Center, Mail Code 661, Greenbelt, MD 20771, USA8 Joint Space-Science Institute, University of Maryland, College Park, MD 20742, USA9 Max-Planck-Institut fur extraterrestrische Physik, Giessenbachstraße 1, D-85748 Garching, Germany10 Los Alamos National Laboratory, B244, Los Alamos, NM 87545, USA
Received 2016 July 15; accepted 2016 August 08
ABSTRACT
We report on the detection of a bright, short, structured X-ray burst coming fromthe supernova remnant RCW103 on 2016 June 22 caught by the Swift/Burst AlertTelescope (BAT) monitor, and on the follow-up campaign made with Swift/X-RayTelescope, Swift/UV/Optical Telescope and the optical/near infrared (NIR) Gamma-ray Burst Optical and Near-infrared Detector. The characteristics of this flash, suchas duration and spectral shape, are consistent with typical short bursts observed fromsoft gamma repeaters. The BAT error circle at 68 per cent confidence range enclosesthe point-like X-ray source at the centre of the nebula, 1E 161348–5055. Its nature hasbeen long debated due to a periodicity of 6.67 h in X-rays, which could indicate eitheran extremely slow pulsating neutron star, or the orbital period of a very compactX-ray binary system. We found that 20 min before the BAT trigger, the soft X-ray emission of 1E 161348–5055 was a factor of ∼ 100 higher than measured 2 yrearlier, indicating that an outburst had already started. By comparing the spectraland timing characteristics of the source in the 2 yr before the outburst and after theBAT event, we find that, besides a change in luminosity and spectral shape, also the6.67 h pulsed profile has significantly changed with a clear phase shift with respect toits low-flux profile. The UV/optical/NIR observations did not reveal any counterpartat the position of 1E161348–5055. Based on these findings, we associate the BAT burstwith 1E 161348–5055, we classify it as a magnetar, and pinpoint the 6.67 h periodicityas the magnetar spin period.
Key words: — X-rays: general — X-rays: individual: 1E 161348-5055
1 INTRODUCTION
RCW103 is a shell supernova remnant (SNR) of ∼ 9 arcminapparent diameter, expanding at around 1100 km s−1, with
c© 0000 The Authors

2 A. D’Aı et al.
an estimated age between 1350 and 3050 yr (Carter et al.1997), and at a distance of 3.3 kpc (Caswell et al. 1975).Frank et al. (2015) gave a detailed, spatially resolved, ac-count of the X-ray emission of the SNR, that can be mod-elled with an absorbed, non-equilibrium ionization state(NEI) plane shock model, with an average temperature of0.58 keV and an absorbing column density NH =0.95× 10²²
cm−2. The relative abundance of the most important metals(Ne, Mg, Si, S, and Fe) is generally found to be half the equi-valent solar value, reflecting the stronger contribution of themetal-poor circumstellar medium emission with respect tothe expected metal-rich ejecta.
The compact soft X-ray source 1E 161348–5055 (here-after 1E 1613), which is the neutron star (NS) born from thecore-collapse supernova explosion, lies nearly at the centreof the SNR. The association between the central compactobject (CCO) and the SNR is proved by a depression of ∼ 1arcmin in the Hi emission of the SNR, which is positionallyand kinematically coincident with the location of the CCO(Reynoso et al. 2004). However, the CCO has no confirmedcounterpart at other wavelengths.
The X-ray luminosity of 1E 1613 can vary by more thanone order of magnitude on a time-scale of years in the range1033–1035 erg s−1 (De Luca et al. 2006). The X-ray spec-trum is rather soft, and it can be well described either bythe sum of two blackbodies with temperatures of 0.5 keV(and corresponding emitting radius, RBB of few hundredmetres) and 1.0 keV (RBB tens of metres), respectively, orby the sum of a soft black-body of 0.5 keV and a steep power-law of photon index∼ 3 (De Luca et al. 2006; Esposito et al.2011). One of its most enigmatic features is a periodicityof 6.67 h found in a long XMM-Newton observation of thesource (De Luca et al. 2006). It is debated if the periodicityrefers to the rotational period of an extremely slow, andpeculiar, NS, or it is an orbital modulation of an accret-ing compact X-ray binary system. In the first hypothesisthe NS should have an extreme magnetic field (B ∼ 1013–1015 G) as is typical of the so-called magnetar systems. Thiscould possibly explain the very long spin period because ofa large spin-down due to the interaction with a fossil discformed from the debris of the supernova (SN) explosion. Inthe latter case the system would be a quite odd exampleof a very young low-mass X-ray binary system, even if therequirement of an extreme magnetic field is probably stillneeded (De Luca et al. 2006; Li 2007; Pizzolato et al. 2008;Bhadkamkar & Ghosh 2009; Ikhsanov et al. 2013).
In this paper, we report on the recent discovery ofa bright X-ray flash observed on 2016 June 22 with theSwift/Burst Alert Telescope (BAT) instrument (D’Aı et al.2016) from the RCW103 region. The position of the hardX-ray source responsible for the X-ray flash, labelled SGR1617-5103, is compatible with the position of 1E 1613(D’Aı et al. 2016; Stamatikos et al. 2016). We present a de-tailed spectral and timing study of the X-ray emission of1E 1613 before and after the BAT trigger, finding the CCOin an outburst state. We also report on the search for a tran-sient UV/optical/NIR counterpart with the Gamma-RayOptical and Near-infrared Detector (GROND; Schady et al.2016) and Swift/UV/Optical Telescope (UVOT) to the out-bursting source, finding only upper limits at the position ofthe CCO. We propose the identification of SGR 1617–5103
with 1E 1613 and we discuss the implications of this discov-ery for constraining the nature of 1E 1613.
2 OBSERVATIONS, DATA REDUCTION, AND
ANALYSIS
The Swift (Gehrels et al. 2004) satellite was launched in2004 with the primary goal of detecting gamma-ray bursts.The scientific payload of Swift comprises three different in-struments: BAT (Barthelmy et al. 2005), a coded mask tele-scope sensitive to photons in the 15–350 keV range and witha 2 sr field of view, the X-ray Telescope (XRT; Burrows et al.2005), that covers the soft X-ray range (0.3–10 keV) witha field of view ∼ 23.6 arcmin and the UV/Optical tele-scope (UVOT; Roming et al. 2005), that with different fil-ters can cover the 1270–6240 A wavelength range on a17× 17 arcmin2 field of view. Swift/X-Ray Telescope (XRT)can perform X-ray observations in imaging mode with a 2.5s frame-time (Photon Counting mode, PC) or in WindowedTiming (WT) mode at a higher timing resolution of 1.8 ms.
We performed data extraction and reduction using theheasoft software (v. 6.19) developed and maintained bythe NASA High Energy Astrophysics Science Archive Re-search Center (heasarc). We used xspec v. 12.9.0 for spec-tral analysis. Spectra are re-binned to a minimum of 20counts per energy channel to allow use of χ2 statistics. Er-rors on spectral parameters are given at 90% confidencelevel (∆χ2 =2.706). Luminosities are given assuming iso-tropic emission and a distance of 3.3 kpc.
2.1 BAT analysis and results
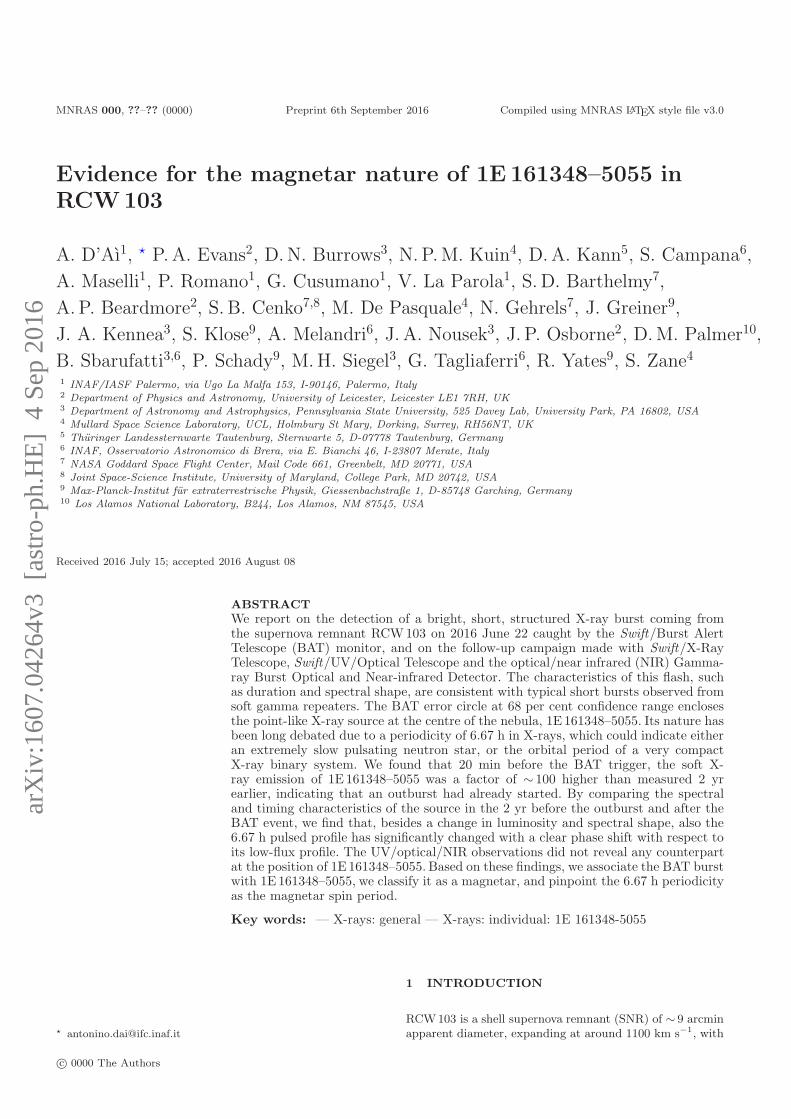
BAT triggered on SGR 1617–5103 at 02:03:13.845 ut on2016 June 22 (T0 =57561.08557691 MJD). The BAT mask-weighted light curve shows a structured short pulse withT90 (the time over which a burst emits from 5% of its totalmeasured counts to 95%) of 8.0± 4.5 ms. In Fig. 1 we showthe burst profile in some energy-selected bands with a timeresolution of 2 ms. The profile is consistent with a singledouble-peaked burst or, possibly, with two consecutive, veryclose, shorter bursts.
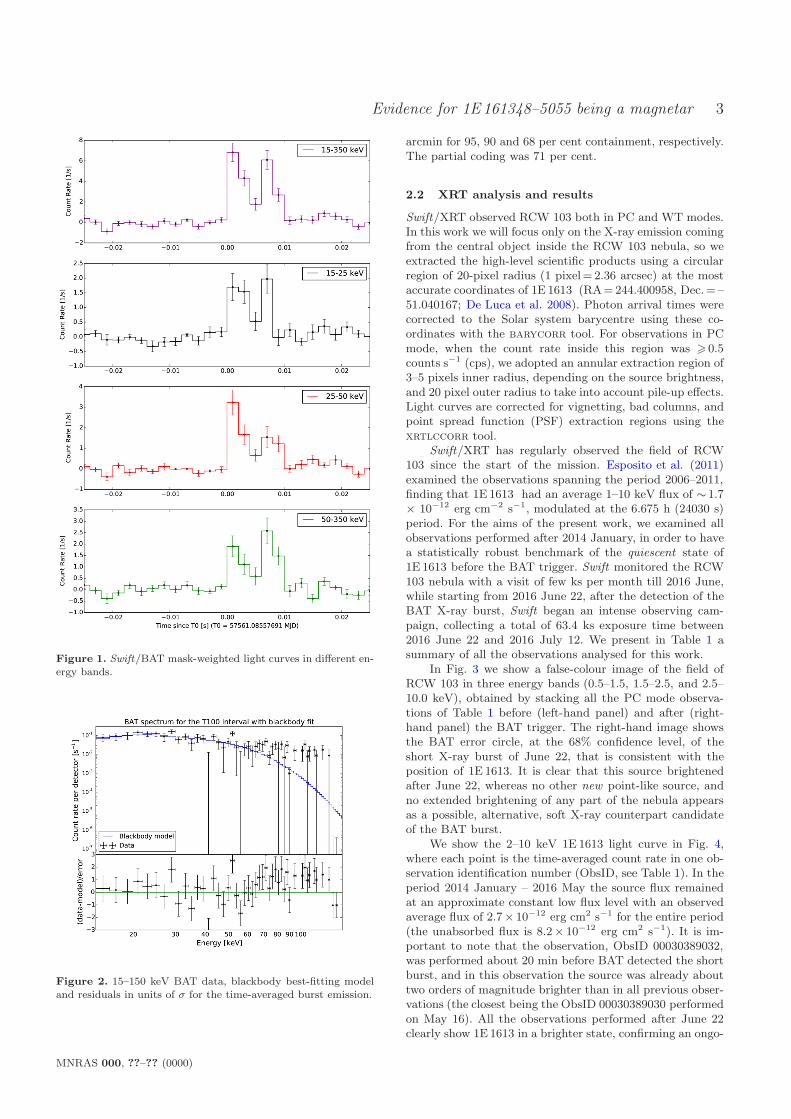
We fitted the time-averaged BAT spectrum from T0 toT0+10 ms using a power-law model. The spectral fit showsa power-law photon index of 2.38± 0.21 and a fluence (15–150 keV) of (1.25 ± 0.22)× 10−8 erg cm−2, with a reducedchi-squared (χ2
red) of 1.55 for 57 degrees of freedom (dof).A blackbody model provides a significantly better descrip-tion of the data, with a χ2
red of 1.18 for 57 dof (Fig. 2). Theblackbody temperature is kT =10.3± 1.3 keV, the black-body radius is 1.2± 0.2 km, and the corresponding fluence(15–150 keV) is 1.51± 0.24 × 10⁻⁸ erg cm−2, which trans-lates for a distance of 3.3 kpc into an isotropic total energyrelease of (2.0± 0.3) × 1037 erg. A time-resolved fit fromT0 to T0+5 ms and from T0+5 to T0+10 ms, is consistentfor both intervals with a thermal blackbody emission of tem-perature kT =8.7± 1.7 and kT =10+5
−3 keV, and a blackbodyradius 1.7+0.9
−0.5 and 0.9+0.9−0.5 km for the first and second peak,
respectively.The BAT ground-calculated position is RA, Dec. =
244.◦385, –51.◦047, with an uncertainty of 2.0, 1.7, and 1.2
MNRAS 000, ??–?? (0000)
Evidence for 1E 161348–5055 being a magnetar 3
Figure 1. Swift/BAT mask-weighted light curves in different en-ergy bands.
Figure 2. 15–150 keV BAT data, blackbody best-fitting modeland residuals in units of σ for the time-averaged burst emission.
arcmin for 95, 90 and 68 per cent containment, respectively.The partial coding was 71 per cent.
2.2 XRT analysis and results
Swift/XRT observed RCW 103 both in PC and WT modes.In this work we will focus only on the X-ray emission comingfrom the central object inside the RCW 103 nebula, so weextracted the high-level scientific products using a circularregion of 20-pixel radius (1 pixel= 2.36 arcsec) at the mostaccurate coordinates of 1E 1613 (RA=244.400958, Dec.= –51.040167; De Luca et al. 2008). Photon arrival times werecorrected to the Solar system barycentre using these co-ordinates with the barycorr tool. For observations in PCmode, when the count rate inside this region was > 0.5counts s−1 (cps), we adopted an annular extraction region of3–5 pixels inner radius, depending on the source brightness,and 20 pixel outer radius to take into account pile-up effects.Light curves are corrected for vignetting, bad columns, andpoint spread function (PSF) extraction regions using thexrtlccorr tool.
Swift/XRT has regularly observed the field of RCW103 since the start of the mission. Esposito et al. (2011)examined the observations spanning the period 2006–2011,finding that 1E 1613 had an average 1–10 keV flux of ∼ 1.7× 10⁻¹² erg cm−2 s−1, modulated at the 6.675 h (24030 s)period. For the aims of the present work, we examined allobservations performed after 2014 January, in order to havea statistically robust benchmark of the quiescent state of1E 1613 before the BAT trigger. Swift monitored the RCW103 nebula with a visit of few ks per month till 2016 June,while starting from 2016 June 22, after the detection of theBAT X-ray burst, Swift began an intense observing cam-paign, collecting a total of 63.4 ks exposure time between2016 June 22 and 2016 July 12. We present in Table 1 asummary of all the observations analysed for this work.
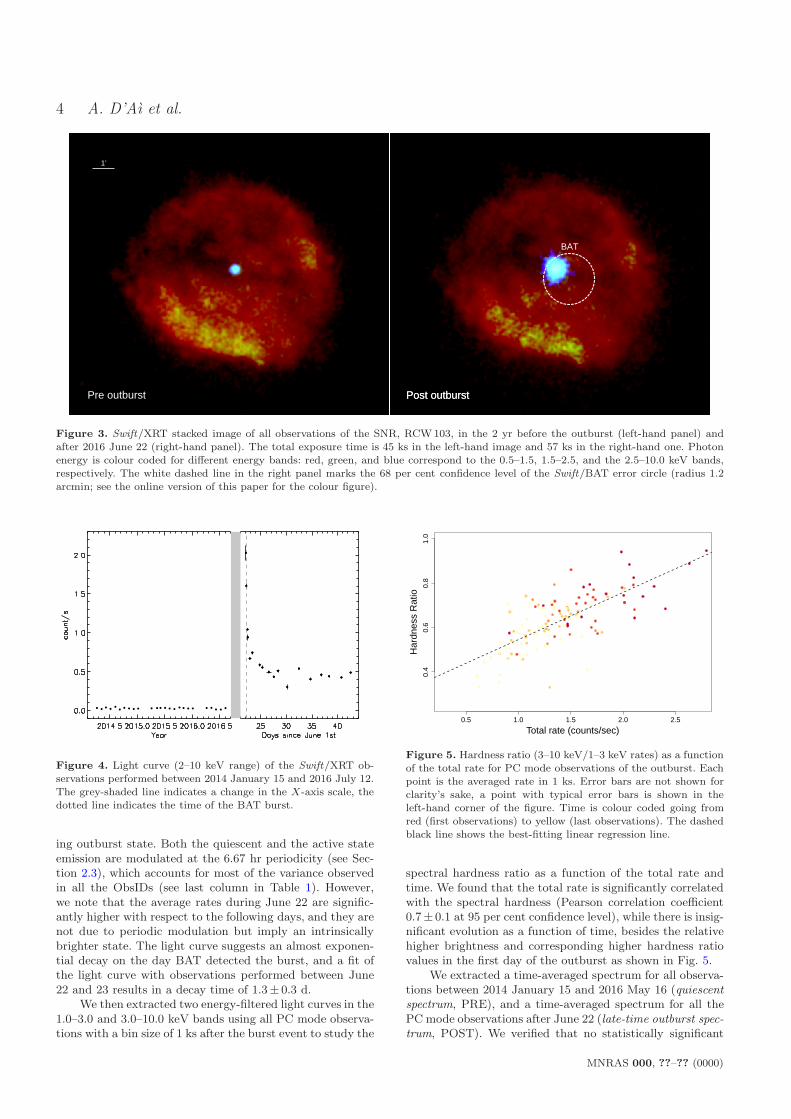
In Fig. 3 we show a false-colour image of the field ofRCW 103 in three energy bands (0.5–1.5, 1.5–2.5, and 2.5–10.0 keV), obtained by stacking all the PC mode observa-tions of Table 1 before (left-hand panel) and after (right-hand panel) the BAT trigger. The right-hand image showsthe BAT error circle, at the 68% confidence level, of theshort X-ray burst of June 22, that is consistent with theposition of 1E 1613. It is clear that this source brightenedafter June 22, whereas no other new point-like source, andno extended brightening of any part of the nebula appearsas a possible, alternative, soft X-ray counterpart candidateof the BAT burst.
We show the 2–10 keV 1E 1613 light curve in Fig. 4,where each point is the time-averaged count rate in one ob-servation identification number (ObsID, see Table 1). In theperiod 2014 January – 2016 May the source flux remainedat an approximate constant low flux level with an observedaverage flux of 2.7× 10⁻¹² erg cm2 s−1 for the entire period(the unabsorbed flux is 8.2× 10⁻¹² erg cm2 s−1). It is im-portant to note that the observation, ObsID 00030389032,was performed about 20 min before BAT detected the shortburst, and in this observation the source was already abouttwo orders of magnitude brighter than in all previous obser-vations (the closest being the ObsID 00030389030 performedon May 16). All the observations performed after June 22clearly show 1E1613 in a brighter state, confirming an ongo-
MNRAS 000, ??–?? (0000)
4 A. D’Aı et al.
Post outburst
BAT
Post outburst
1’
Pre outburst
Figure 3. Swift/XRT stacked image of all observations of the SNR, RCW 103, in the 2 yr before the outburst (left-hand panel) andafter 2016 June 22 (right-hand panel). The total exposure time is 45 ks in the left-hand image and 57 ks in the right-hand one. Photonenergy is colour coded for different energy bands: red, green, and blue correspond to the 0.5–1.5, 1.5–2.5, and the 2.5–10.0 keV bands,respectively. The white dashed line in the right panel marks the 68 per cent confidence level of the Swift/BAT error circle (radius 1.2arcmin; see the online version of this paper for the colour figure).
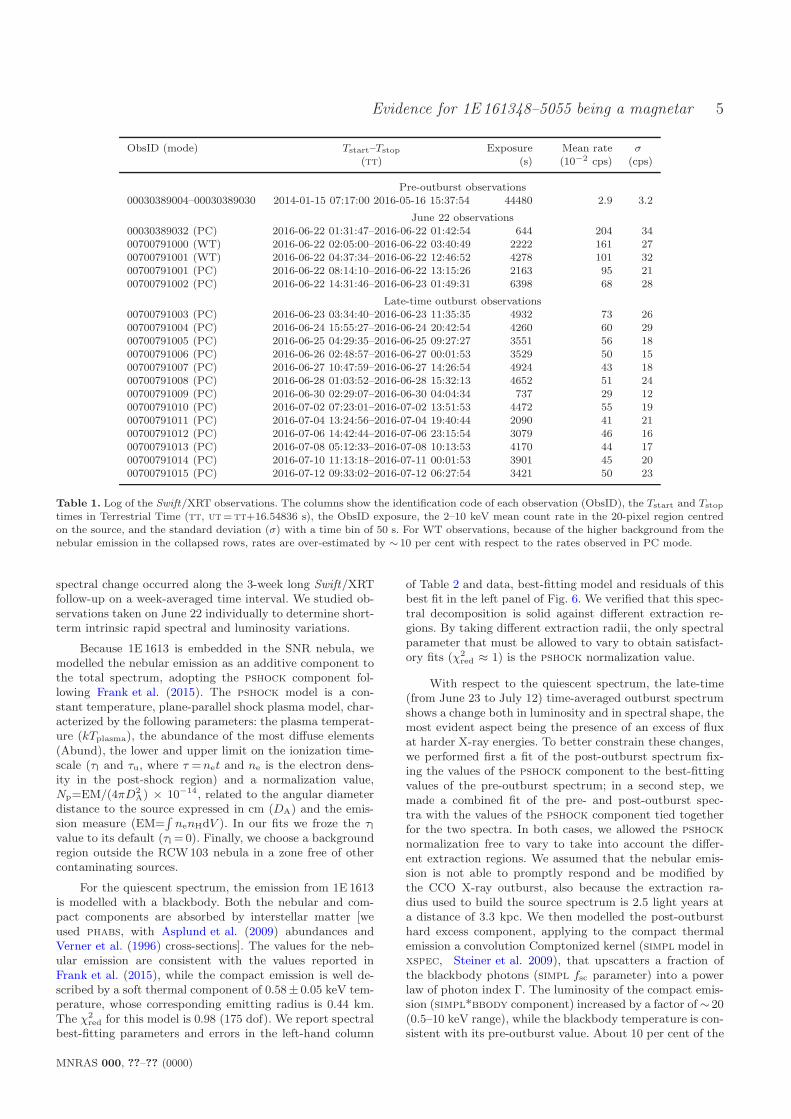
Figure 4. Light curve (2–10 keV range) of the Swift/XRT ob-servations performed between 2014 January 15 and 2016 July 12.The grey-shaded line indicates a change in the X-axis scale, thedotted line indicates the time of the BAT burst.
ing outburst state. Both the quiescent and the active stateemission are modulated at the 6.67 hr periodicity (see Sec-tion 2.3), which accounts for most of the variance observedin all the ObsIDs (see last column in Table 1). However,we note that the average rates during June 22 are signific-antly higher with respect to the following days, and they arenot due to periodic modulation but imply an intrinsicallybrighter state. The light curve suggests an almost exponen-tial decay on the day BAT detected the burst, and a fit ofthe light curve with observations performed between June22 and 23 results in a decay time of 1.3± 0.3 d.
We then extracted two energy-filtered light curves in the1.0–3.0 and 3.0–10.0 keV bands using all PC mode observa-tions with a bin size of 1 ks after the burst event to study the
0.5 1.0 1.5 2.0 2.5
0.4
0.6
0.8
1.0
Total rate (counts/sec)
Har
dnes
s R
atio
Figure 5. Hardness ratio (3–10 keV/1–3 keV rates) as a functionof the total rate for PC mode observations of the outburst. Eachpoint is the averaged rate in 1 ks. Error bars are not shown forclarity’s sake, a point with typical error bars is shown in theleft-hand corner of the figure. Time is colour coded going fromred (first observations) to yellow (last observations). The dashedblack line shows the best-fitting linear regression line.
spectral hardness ratio as a function of the total rate andtime. We found that the total rate is significantly correlatedwith the spectral hardness (Pearson correlation coefficient0.7± 0.1 at 95 per cent confidence level), while there is insig-nificant evolution as a function of time, besides the relativehigher brightness and corresponding higher hardness ratiovalues in the first day of the outburst as shown in Fig. 5.
We extracted a time-averaged spectrum for all observa-tions between 2014 January 15 and 2016 May 16 (quiescentspectrum, PRE), and a time-averaged spectrum for all thePC mode observations after June 22 (late-time outburst spec-trum, POST). We verified that no statistically significant
MNRAS 000, ??–?? (0000)
Evidence for 1E 161348–5055 being a magnetar 5
ObsID (mode) Tstart–Tstop Exposure Mean rate σ
(tt) (s) (10−2 cps) (cps)
Pre-outburst observations00030389004–00030389030 2014-01-15 07:17:00 2016-05-16 15:37:54 44480 2.9 3.2
June 22 observations00030389032 (PC) 2016-06-22 01:31:47–2016-06-22 01:42:54 644 204 3400700791000 (WT) 2016-06-22 02:05:00–2016-06-22 03:40:49 2222 161 2700700791001 (WT) 2016-06-22 04:37:34–2016-06-22 12:46:52 4278 101 3200700791001 (PC) 2016-06-22 08:14:10–2016-06-22 13:15:26 2163 95 2100700791002 (PC) 2016-06-22 14:31:46–2016-06-23 01:49:31 6398 68 28
Late-time outburst observations00700791003 (PC) 2016-06-23 03:34:40–2016-06-23 11:35:35 4932 73 2600700791004 (PC) 2016-06-24 15:55:27–2016-06-24 20:42:54 4260 60 2900700791005 (PC) 2016-06-25 04:29:35–2016-06-25 09:27:27 3551 56 1800700791006 (PC) 2016-06-26 02:48:57–2016-06-27 00:01:53 3529 50 1500700791007 (PC) 2016-06-27 10:47:59–2016-06-27 14:26:54 4924 43 1800700791008 (PC) 2016-06-28 01:03:52–2016-06-28 15:32:13 4652 51 2400700791009 (PC) 2016-06-30 02:29:07–2016-06-30 04:04:34 737 29 1200700791010 (PC) 2016-07-02 07:23:01–2016-07-02 13:51:53 4472 55 1900700791011 (PC) 2016-07-04 13:24:56–2016-07-04 19:40:44 2090 41 2100700791012 (PC) 2016-07-06 14:42:44–2016-07-06 23:15:54 3079 46 1600700791013 (PC) 2016-07-08 05:12:33–2016-07-08 10:13:53 4170 44 1700700791014 (PC) 2016-07-10 11:13:18–2016-07-11 00:01:53 3901 45 2000700791015 (PC) 2016-07-12 09:33:02–2016-07-12 06:27:54 3421 50 23
Table 1. Log of the Swift/XRT observations. The columns show the identification code of each observation (ObsID), the Tstart and Tstop
times in Terrestrial Time (tt, ut= tt+16.54836 s), the ObsID exposure, the 2–10 keV mean count rate in the 20-pixel region centredon the source, and the standard deviation (σ) with a time bin of 50 s. For WT observations, because of the higher background from thenebular emission in the collapsed rows, rates are over-estimated by ∼ 10 per cent with respect to the rates observed in PC mode.
spectral change occurred along the 3-week long Swift/XRTfollow-up on a week-averaged time interval. We studied ob-servations taken on June 22 individually to determine short-term intrinsic rapid spectral and luminosity variations.
Because 1E 1613 is embedded in the SNR nebula, wemodelled the nebular emission as an additive component tothe total spectrum, adopting the pshock component fol-lowing Frank et al. (2015). The pshock model is a con-stant temperature, plane-parallel shock plasma model, char-acterized by the following parameters: the plasma temperat-ure (kTplasma), the abundance of the most diffuse elements(Abund), the lower and upper limit on the ionization time-scale (τl and τu, where τ =net and ne is the electron dens-ity in the post-shock region) and a normalization value,Np=EM/(4πD2
A) × 10−14, related to the angular diameterdistance to the source expressed in cm (DA) and the emis-sion measure (EM=
∫nenHdV ). In our fits we froze the τl
value to its default (τl =0). Finally, we choose a backgroundregion outside the RCW103 nebula in a zone free of othercontaminating sources.
For the quiescent spectrum, the emission from 1E 1613is modelled with a blackbody. Both the nebular and com-pact components are absorbed by interstellar matter [weused phabs, with Asplund et al. (2009) abundances andVerner et al. (1996) cross-sections]. The values for the neb-ular emission are consistent with the values reported inFrank et al. (2015), while the compact emission is well de-scribed by a soft thermal component of 0.58± 0.05 keV tem-perature, whose corresponding emitting radius is 0.44 km.The χ2
red for this model is 0.98 (175 dof). We report spectralbest-fitting parameters and errors in the left-hand column
of Table 2 and data, best-fitting model and residuals of thisbest fit in the left panel of Fig. 6. We verified that this spec-tral decomposition is solid against different extraction re-gions. By taking different extraction radii, the only spectralparameter that must be allowed to vary to obtain satisfact-ory fits (χ2
red ≈ 1) is the pshock normalization value.
With respect to the quiescent spectrum, the late-time(from June 23 to July 12) time-averaged outburst spectrumshows a change both in luminosity and in spectral shape, themost evident aspect being the presence of an excess of fluxat harder X-ray energies. To better constrain these changes,we performed first a fit of the post-outburst spectrum fix-ing the values of the pshock component to the best-fittingvalues of the pre-outburst spectrum; in a second step, wemade a combined fit of the pre- and post-outburst spec-tra with the values of the pshock component tied togetherfor the two spectra. In both cases, we allowed the pshock
normalization free to vary to take into account the differ-ent extraction regions. We assumed that the nebular emis-sion is not able to promptly respond and be modified bythe CCO X-ray outburst, also because the extraction ra-dius used to build the source spectrum is 2.5 light years ata distance of 3.3 kpc. We then modelled the post-outbursthard excess component, applying to the compact thermalemission a convolution Comptonized kernel (simpl model inxspec, Steiner et al. 2009), that upscatters a fraction ofthe blackbody photons (simpl fsc parameter) into a powerlaw of photon index Γ. The luminosity of the compact emis-sion (simpl*bbody component) increased by a factor of∼ 20(0.5–10 keV range), while the blackbody temperature is con-sistent with its pre-outburst value. About 10 per cent of the
MNRAS 000, ??–?? (0000)
6 A. D’Aı et al.
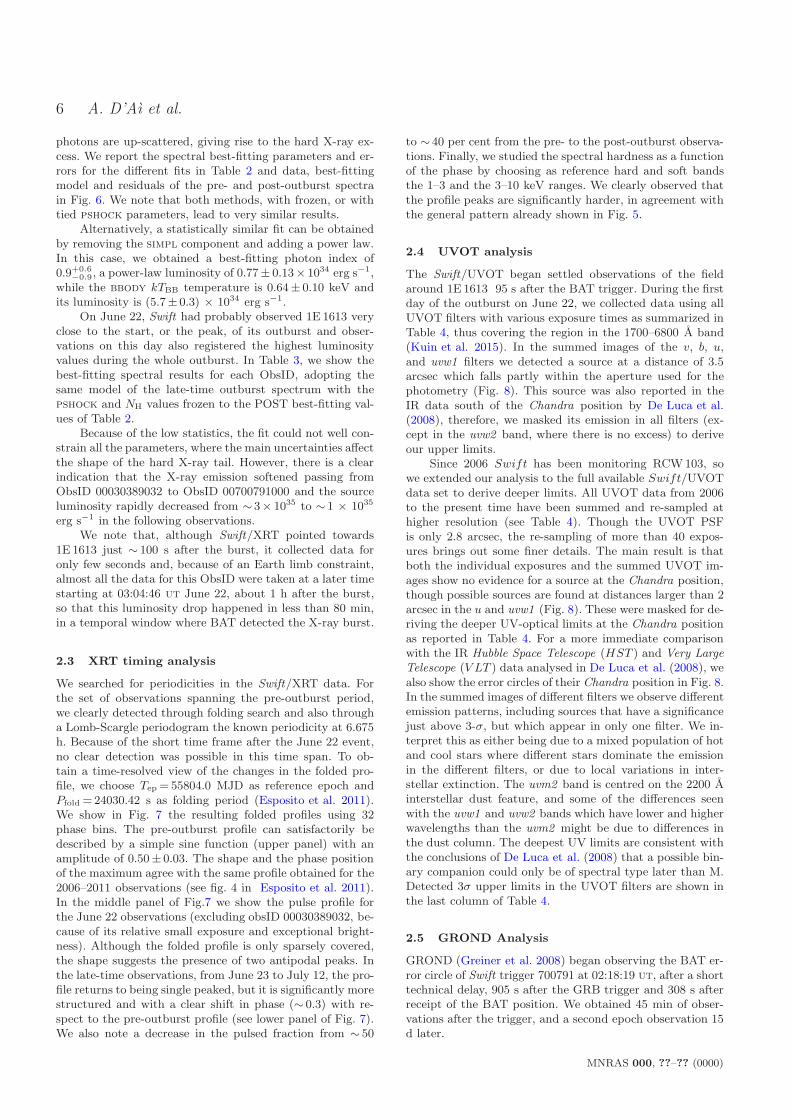
photons are up-scattered, giving rise to the hard X-ray ex-cess. We report the spectral best-fitting parameters and er-rors for the different fits in Table 2 and data, best-fittingmodel and residuals of the pre- and post-outburst spectrain Fig. 6. We note that both methods, with frozen, or withtied pshock parameters, lead to very similar results.
Alternatively, a statistically similar fit can be obtainedby removing the simpl component and adding a power law.In this case, we obtained a best-fitting photon index of0.9+0.6
−0.9, a power-law luminosity of 0.77± 0.13× 1034 erg s−1,while the bbody kTBB temperature is 0.64± 0.10 keV andits luminosity is (5.7± 0.3) × 1034 erg s−1.
On June 22, Swift had probably observed 1E 1613 veryclose to the start, or the peak, of its outburst and obser-vations on this day also registered the highest luminosityvalues during the whole outburst. In Table 3, we show thebest-fitting spectral results for each ObsID, adopting thesame model of the late-time outburst spectrum with thepshock and NH values frozen to the POST best-fitting val-ues of Table 2.
Because of the low statistics, the fit could not well con-strain all the parameters, where the main uncertainties affectthe shape of the hard X-ray tail. However, there is a clearindication that the X-ray emission softened passing fromObsID 00030389032 to ObsID 00700791000 and the sourceluminosity rapidly decreased from ∼ 3× 1035 to ∼ 1 × 1035
erg s−1 in the following observations.We note that, although Swift/XRT pointed towards
1E 1613 just ∼ 100 s after the burst, it collected data foronly few seconds and, because of an Earth limb constraint,almost all the data for this ObsID were taken at a later timestarting at 03:04:46 ut June 22, about 1 h after the burst,so that this luminosity drop happened in less than 80 min,in a temporal window where BAT detected the X-ray burst.
2.3 XRT timing analysis
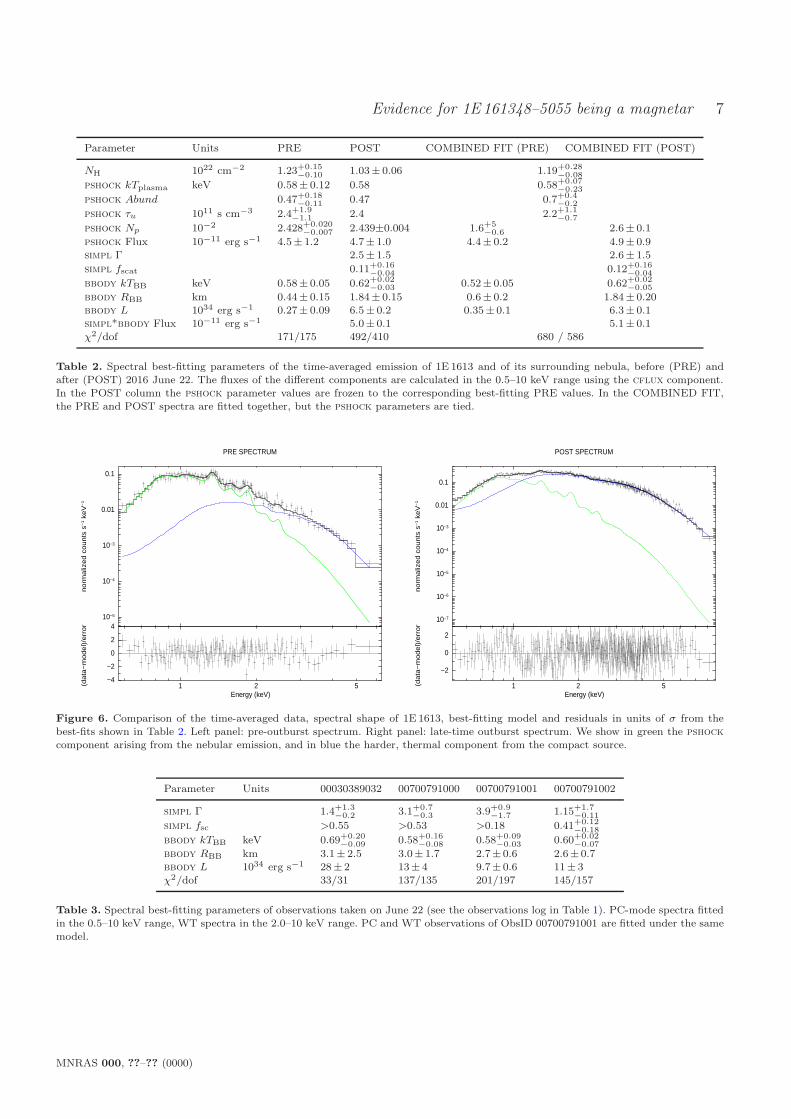
We searched for periodicities in the Swift/XRT data. Forthe set of observations spanning the pre-outburst period,we clearly detected through folding search and also througha Lomb-Scargle periodogram the known periodicity at 6.675h. Because of the short time frame after the June 22 event,no clear detection was possible in this time span. To ob-tain a time-resolved view of the changes in the folded pro-file, we choose Tep =55804.0 MJD as reference epoch andPfold =24030.42 s as folding period (Esposito et al. 2011).We show in Fig. 7 the resulting folded profiles using 32phase bins. The pre-outburst profile can satisfactorily bedescribed by a simple sine function (upper panel) with anamplitude of 0.50± 0.03. The shape and the phase positionof the maximum agree with the same profile obtained for the2006–2011 observations (see fig. 4 in Esposito et al. 2011).In the middle panel of Fig.7 we show the pulse profile forthe June 22 observations (excluding obsID 00030389032, be-cause of its relative small exposure and exceptional bright-ness). Although the folded profile is only sparsely covered,the shape suggests the presence of two antipodal peaks. Inthe late-time observations, from June 23 to July 12, the pro-file returns to being single peaked, but it is significantly morestructured and with a clear shift in phase (∼ 0.3) with re-spect to the pre-outburst profile (see lower panel of Fig. 7).We also note a decrease in the pulsed fraction from ∼ 50
to ∼ 40 per cent from the pre- to the post-outburst observa-tions. Finally, we studied the spectral hardness as a functionof the phase by choosing as reference hard and soft bandsthe 1–3 and the 3–10 keV ranges. We clearly observed thatthe profile peaks are significantly harder, in agreement withthe general pattern already shown in Fig. 5.
2.4 UVOT analysis
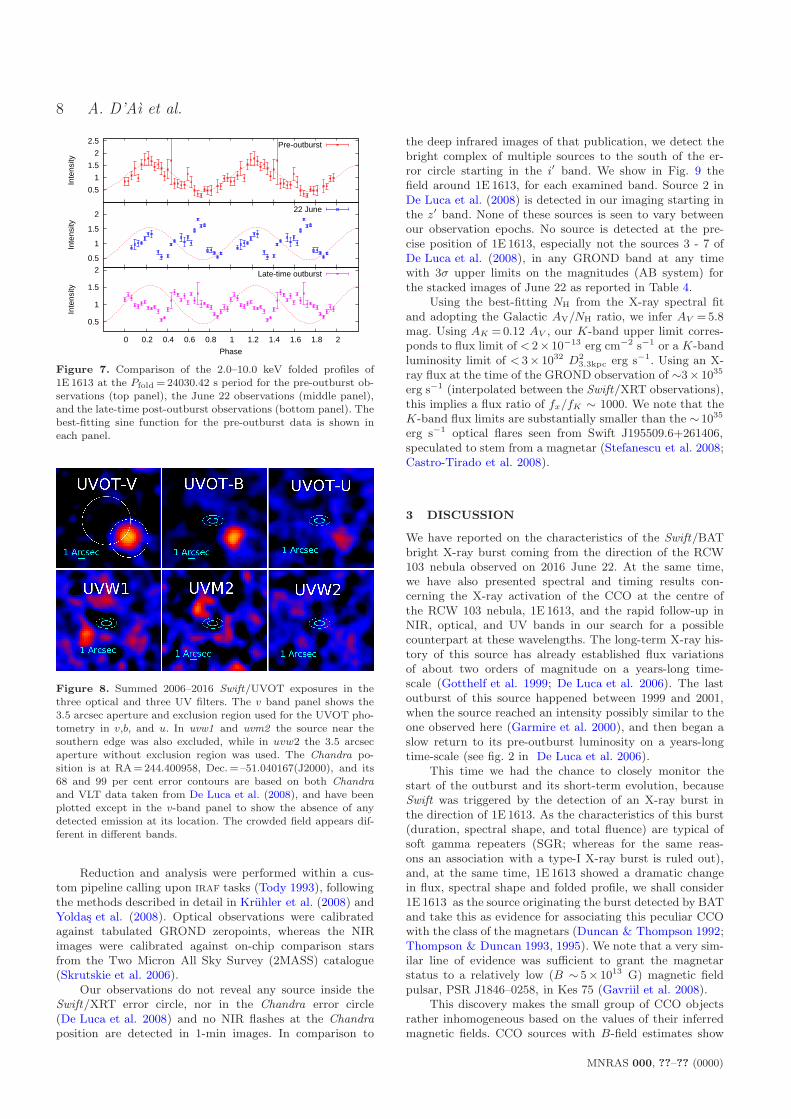
The Swift/UVOT began settled observations of the fieldaround 1E 1613 95 s after the BAT trigger. During the firstday of the outburst on June 22, we collected data using allUVOT filters with various exposure times as summarized inTable 4, thus covering the region in the 1700–6800 A band(Kuin et al. 2015). In the summed images of the v, b, u,and uvw1 filters we detected a source at a distance of 3.5arcsec which falls partly within the aperture used for thephotometry (Fig. 8). This source was also reported in theIR data south of the Chandra position by De Luca et al.(2008), therefore, we masked its emission in all filters (ex-cept in the uvw2 band, where there is no excess) to deriveour upper limits.
Since 2006 Swift has been monitoring RCW103, sowe extended our analysis to the full available Swift/UVOTdata set to derive deeper limits. All UVOT data from 2006to the present time have been summed and re-sampled athigher resolution (see Table 4). Though the UVOT PSFis only 2.8 arcsec, the re-sampling of more than 40 expos-ures brings out some finer details. The main result is thatboth the individual exposures and the summed UVOT im-ages show no evidence for a source at the Chandra position,though possible sources are found at distances larger than 2arcsec in the u and uvw1 (Fig. 8). These were masked for de-riving the deeper UV-optical limits at the Chandra positionas reported in Table 4. For a more immediate comparisonwith the IR Hubble Space Telescope (HST ) and Very LargeTelescope (V LT ) data analysed in De Luca et al. (2008), wealso show the error circles of their Chandra position in Fig. 8.In the summed images of different filters we observe differentemission patterns, including sources that have a significancejust above 3-σ, but which appear in only one filter. We in-terpret this as either being due to a mixed population of hotand cool stars where different stars dominate the emissionin the different filters, or due to local variations in inter-stellar extinction. The uvm2 band is centred on the 2200 Ainterstellar dust feature, and some of the differences seenwith the uvw1 and uvw2 bands which have lower and higherwavelengths than the uvm2 might be due to differences inthe dust column. The deepest UV limits are consistent withthe conclusions of De Luca et al. (2008) that a possible bin-ary companion could only be of spectral type later than M.Detected 3σ upper limits in the UVOT filters are shown inthe last column of Table 4.
2.5 GROND Analysis
GROND (Greiner et al. 2008) began observing the BAT er-ror circle of Swift trigger 700791 at 02:18:19 ut, after a shorttechnical delay, 905 s after the GRB trigger and 308 s afterreceipt of the BAT position. We obtained 45 min of obser-vations after the trigger, and a second epoch observation 15d later.
MNRAS 000, ??–?? (0000)
Evidence for 1E 161348–5055 being a magnetar 7
Parameter Units PRE POST COMBINED FIT (PRE) COMBINED FIT (POST)
NH 1022 cm−2 1.23+0.15−0.10 1.03± 0.06 1.19+0.28
−0.08
pshock kTplasma keV 0.58± 0.12 0.58 0.58+0.07−0.23
pshock Abund 0.47+0.18−0.11 0.47 0.7+0.4
−0.2
pshock τu 1011 s cm−3 2.4+1.9−1.1 2.4 2.2+1.1
−0.7
pshock Np 10−2 2.428+0.020−0.007 2.439±0.004 1.6+5
−0.6 2.6± 0.1
pshock Flux 10−11 erg s−1 4.5± 1.2 4.7± 1.0 4.4± 0.2 4.9± 0.9simpl Γ 2.5± 1.5 2.6± 1.5
simpl fscat 0.11+0.16−0.04 0.12+0.16
−0.04
bbody kTBB keV 0.58± 0.05 0.62+0.02−0.03 0.52± 0.05 0.62+0.02
−0.05
bbody RBB km 0.44± 0.15 1.84± 0.15 0.6± 0.2 1.84± 0.20bbody L 1034 erg s−1 0.27± 0.09 6.5± 0.2 0.35± 0.1 6.3± 0.1simpl*bbody Flux 10−11 erg s−1 5.0± 0.1 5.1± 0.1χ2/dof 171/175 492/410 680 / 586
Table 2. Spectral best-fitting parameters of the time-averaged emission of 1E 1613 and of its surrounding nebula, before (PRE) andafter (POST) 2016 June 22. The fluxes of the different components are calculated in the 0.5–10 keV range using the cflux component.In the POST column the pshock parameter values are frozen to the corresponding best-fitting PRE values. In the COMBINED FIT,the PRE and POST spectra are fitted together, but the pshock parameters are tied.
10−5
10−4
10−3
0.01
0.1
no
rma
lize
d c
ou
nts
s−
1 k
eV
−1
PRE SPECTRUM
1 2 5−4
−2
0
2
4
(da
ta−
mo
de
l)/e
rro
r
Energy (keV)
10−7
10−6
10−5
10−4
10−3
0.01
0.1
no
rma
lize
d c
ou
nts
s−
1 k
eV
−1
POST SPECTRUM
1 2 5
−2
0
2
(da
ta−
mo
de
l)/e
rro
r
Energy (keV)
Figure 6. Comparison of the time-averaged data, spectral shape of 1E 1613, best-fitting model and residuals in units of σ from thebest-fits shown in Table 2. Left panel: pre-outburst spectrum. Right panel: late-time outburst spectrum. We show in green the pshock
component arising from the nebular emission, and in blue the harder, thermal component from the compact source.
Parameter Units 00030389032 00700791000 00700791001 00700791002
simpl Γ 1.4+1.3−0.2 3.1+0.7
−0.3 3.9+0.9−1.7 1.15+1.7
−0.11
simpl fsc >0.55 >0.53 >0.18 0.41+0.12−0.18
bbody kTBB keV 0.69+0.20−0.09 0.58+0.16
−0.08 0.58+0.09−0.03 0.60+0.02
−0.07
bbody RBB km 3.1± 2.5 3.0± 1.7 2.7± 0.6 2.6± 0.7bbody L 1034 erg s−1 28± 2 13± 4 9.7± 0.6 11± 3χ2/dof 33/31 137/135 201/197 145/157
Table 3. Spectral best-fitting parameters of observations taken on June 22 (see the observations log in Table 1). PC-mode spectra fittedin the 0.5–10 keV range, WT spectra in the 2.0–10 keV range. PC and WT observations of ObsID 00700791001 are fitted under the samemodel.
MNRAS 000, ??–?? (0000)
8 A. D’Aı et al.
0.5
1
1.5
2
0 0.2 0.4 0.6 0.8 1 1.2 1.4 1.6 1.8 2
Inte
nsity
Phase
Late-time outburst
0.5
1
1.5
2
Inte
nsity
22 June
0.5
1
1.5
2
2.5
Inte
nsity
Pre-outburst
Figure 7. Comparison of the 2.0–10.0 keV folded profiles of1E 1613 at the Pfold = 24030.42 s period for the pre-outburst ob-servations (top panel), the June 22 observations (middle panel),and the late-time post-outburst observations (bottom panel). Thebest-fitting sine function for the pre-outburst data is shown ineach panel.
Figure 8. Summed 2006–2016 Swift/UVOT exposures in thethree optical and three UV filters. The v band panel shows the3.5 arcsec aperture and exclusion region used for the UVOT pho-tometry in v,b, and u. In uvw1 and uvm2 the source near thesouthern edge was also excluded, while in uvw2 the 3.5 arcsecaperture without exclusion region was used. The Chandra po-sition is at RA = 244.400958, Dec. = –51.040167(J2000), and its68 and 99 per cent error contours are based on both Chandraand VLT data taken from De Luca et al. (2008), and have beenplotted except in the v-band panel to show the absence of anydetected emission at its location. The crowded field appears dif-ferent in different bands.
Reduction and analysis were performed within a cus-tom pipeline calling upon iraf tasks (Tody 1993), followingthe methods described in detail in Kruhler et al. (2008) andYoldas et al. (2008). Optical observations were calibratedagainst tabulated GROND zeropoints, whereas the NIRimages were calibrated against on-chip comparison starsfrom the Two Micron All Sky Survey (2MASS) catalogue(Skrutskie et al. 2006).
Our observations do not reveal any source inside theSwift/XRT error circle, nor in the Chandra error circle(De Luca et al. 2008) and no NIR flashes at the Chandraposition are detected in 1-min images. In comparison to
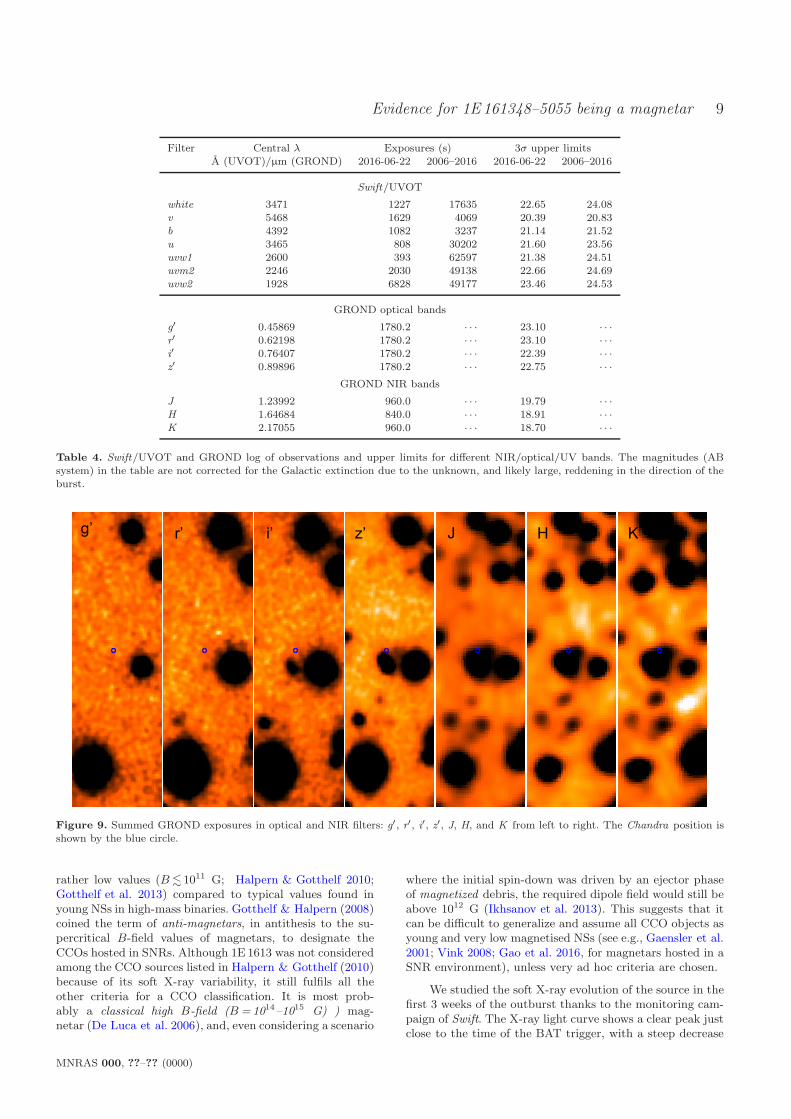
the deep infrared images of that publication, we detect thebright complex of multiple sources to the south of the er-ror circle starting in the i′ band. We show in Fig. 9 thefield around 1E 1613, for each examined band. Source 2 inDe Luca et al. (2008) is detected in our imaging starting inthe z′ band. None of these sources is seen to vary betweenour observation epochs. No source is detected at the pre-cise position of 1E 1613, especially not the sources 3 - 7 ofDe Luca et al. (2008), in any GROND band at any timewith 3σ upper limits on the magnitudes (AB system) forthe stacked images of June 22 as reported in Table 4.
Using the best-fitting NH from the X-ray spectral fitand adopting the Galactic AV/NH ratio, we infer AV =5.8mag. Using AK =0.12 AV , our K-band upper limit corres-ponds to flux limit of < 2× 10⁻¹³ erg cm−2 s−1 or a K-bandluminosity limit of < 3× 1032 D2
3.3kpc erg s−1. Using an X-ray flux at the time of the GROND observation of ∼3× 1035
erg s−1 (interpolated between the Swift/XRT observations),this implies a flux ratio of fx/fK ∼ 1000. We note that theK-band flux limits are substantially smaller than the ∼ 1035
erg s−1 optical flares seen from Swift J195509.6+261406,speculated to stem from a magnetar (Stefanescu et al. 2008;Castro-Tirado et al. 2008).
3 DISCUSSION
We have reported on the characteristics of the Swift/BATbright X-ray burst coming from the direction of the RCW103 nebula observed on 2016 June 22. At the same time,we have also presented spectral and timing results con-cerning the X-ray activation of the CCO at the centre ofthe RCW 103 nebula, 1E 1613, and the rapid follow-up inNIR, optical, and UV bands in our search for a possiblecounterpart at these wavelengths. The long-term X-ray his-tory of this source has already established flux variationsof about two orders of magnitude on a years-long time-scale (Gotthelf et al. 1999; De Luca et al. 2006). The lastoutburst of this source happened between 1999 and 2001,when the source reached an intensity possibly similar to theone observed here (Garmire et al. 2000), and then began aslow return to its pre-outburst luminosity on a years-longtime-scale (see fig. 2 in De Luca et al. 2006).
This time we had the chance to closely monitor thestart of the outburst and its short-term evolution, becauseSwift was triggered by the detection of an X-ray burst inthe direction of 1E 1613. As the characteristics of this burst(duration, spectral shape, and total fluence) are typical ofsoft gamma repeaters (SGR; whereas for the same reas-ons an association with a type-I X-ray burst is ruled out),and, at the same time, 1E 1613 showed a dramatic changein flux, spectral shape and folded profile, we shall consider1E 1613 as the source originating the burst detected by BATand take this as evidence for associating this peculiar CCOwith the class of the magnetars (Duncan & Thompson 1992;Thompson & Duncan 1993, 1995). We note that a very sim-ilar line of evidence was sufficient to grant the magnetarstatus to a relatively low (B ∼ 5× 10¹³ G) magnetic fieldpulsar, PSR J1846–0258, in Kes 75 (Gavriil et al. 2008).
This discovery makes the small group of CCO objectsrather inhomogeneous based on the values of their inferredmagnetic fields. CCO sources with B-field estimates show
MNRAS 000, ??–?? (0000)
Evidence for 1E 161348–5055 being a magnetar 9
Filter Central λ Exposures (s) 3σ upper limitsA (UVOT)/µm (GROND) 2016-06-22 2006–2016 2016-06-22 2006–2016
Swift/UVOT
white 3471 1227 17635 22.65 24.08v 5468 1629 4069 20.39 20.83b 4392 1082 3237 21.14 21.52u 3465 808 30202 21.60 23.56uvw1 2600 393 62597 21.38 24.51uvm2 2246 2030 49138 22.66 24.69uvw2 1928 6828 49177 23.46 24.53
GROND optical bands
g′ 0.45869 1780.2 · · · 23.10 · · ·
r′ 0.62198 1780.2 · · · 23.10 · · ·
i′ 0.76407 1780.2 · · · 22.39 · · ·
z′ 0.89896 1780.2 · · · 22.75 · · ·
GROND NIR bands
J 1.23992 960.0 · · · 19.79 · · ·
H 1.64684 840.0 · · · 18.91 · · ·
K 2.17055 960.0 · · · 18.70 · · ·
Table 4. Swift/UVOT and GROND log of observations and upper limits for different NIR/optical/UV bands. The magnitudes (ABsystem) in the table are not corrected for the Galactic extinction due to the unknown, and likely large, reddening in the direction of theburst.
g’ Jr’ i’ z’ H K
Figure 9. Summed GROND exposures in optical and NIR filters: g′, r′, i′, z′, J, H, and K from left to right. The Chandra position isshown by the blue circle.
rather low values (B. 1011 G; Halpern & Gotthelf 2010;Gotthelf et al. 2013) compared to typical values found inyoung NSs in high-mass binaries. Gotthelf & Halpern (2008)coined the term of anti-magnetars, in antithesis to the su-percritical B-field values of magnetars, to designate theCCOs hosted in SNRs. Although 1E 1613 was not consideredamong the CCO sources listed in Halpern & Gotthelf (2010)because of its soft X-ray variability, it still fulfils all theother criteria for a CCO classification. It is most prob-ably a classical high B-field (B=1014–1015 G) ) mag-netar (De Luca et al. 2006), and, even considering a scenario
where the initial spin-down was driven by an ejector phaseof magnetized debris, the required dipole field would still beabove 1012 G (Ikhsanov et al. 2013). This suggests that itcan be difficult to generalize and assume all CCO objects asyoung and very low magnetised NSs (see e.g., Gaensler et al.2001; Vink 2008; Gao et al. 2016, for magnetars hosted in aSNR environment), unless very ad hoc criteria are chosen.
We studied the soft X-ray evolution of the source in thefirst 3 weeks of the outburst thanks to the monitoring cam-paign of Swift. The X-ray light curve shows a clear peak justclose to the time of the BAT trigger, with a steep decrease
MNRAS 000, ??–?? (0000)
10 A. D’Aı et al.
in the following hours, until a plateau is reached within 1d from the X-ray burst. The flux evolution in the followingweeks did not show any evident sign of fading, suggesting,as in the previous outburst, a possible slow decay to thepre-outburst luminosity levels. The initial steep decay, andthe flatter evolution is similar to what observed in the caseof other magnetars outbursts (see e.g. the decay of the SGR1E 2259+58 in its 2002 June outburst; Woods et al. 2004),and, more generally, closely resembles the behaviour of tran-sient magnetars like the SGR 1627–41, that shows similarflux variations on similar time-scales (Esposito et al. 2008).We tracked the most significant spectral changes using as abenchmark the time-averaged quiescent spectrum of 1E 1613from the Swift/XRT observations taken about 2 yr prior to2016 June 22. We did not choose to disentangle the 1E 1613emission from the contribution of its nebula, because of theintrinsic bias and dependence of the results from the choiceof the source and background extraction regions. Insteadwe modelled both components in a single fit to the data,using the results from the extensive work on the SNR emis-sion made by Frank et al. (2015). In this way, we obtained astatistically acceptable description of the data, and we couldconstrain at much higher confidence the parameters determ-ining the spectral state of the source. The 1E 1613 emissionalong all the outburst showed little variation in the time-averaged spectral shape, characterized by a soft thermalcomponent of temperature ∼ 0.6 keV and a hard X-ray tail,carrying about 10% of the total source emission. The spec-tral shape in the first observation of June 22, 20 min earlierthan the BAT burst, seems to be harder than the other late-time spectra, but we also note that observations performeda few hours after the BAT event showed a rapid return tothe temperature of ∼ 0.6 keV that also characterized thepre-outburst spectrum. The outlined spectral characterist-ics such as peak thermal temperature, harder flux excessduring the outburst, time-scale of flux variations are all inagreement with the general properties shown by transientmagnetars (see e.g. Kaspi et al. 2003; Scholz & Kaspi 2011;Scholz et al. 2012, or these general reviews: Rea & Esposito2011; Mereghetti et al. 2015; Turolla et al. 2015).
We studied the timing characteristics of the pulsed pro-file of 1E 1613, comparing the profiles at different times. Weremark that, given the short time-span of the observationsduring the outburst, we were not able to clearly detect the6.67 h periodicity, however, it is evident that any reasonablechange in its value cannot have any statistically significanteffect on the folded profile.
A sort of bimodality in the pulsed profile was shownby the sparse observations of this source in the 1999–2005years, where it was already found that when 1E 1613 was in abrighter state the profile was remarkably different, and morestructured (De Luca et al. 2006). We have observed that thischange is not gradual, but it happens on a very short time-scale at the time of the outburst peak (Fig. 7). The fol-ded profile in outburst clearly shows that a significant phasechange took place, and similarly to other magnetars wherethe same phenomenology is present (Kaspi et al. 2003;Woods et al. 2004; Dib et al. 2009; Woods et al. 2011), itcould indicate a general re-arrangement of the magneticfield, which also caused the rapid dissipation of energy inthe burst event.
Clearly, it is comparatively much more difficult to as-
sess if the sudden change in the folded profile is also asso-ciated with a frequency glitch, as observed in many mag-netars (Dib et al. 2008), as the fractional frequency shiftsare generally less than a part in a million except in someexceptional cases (Palmer 2002). Future observations, span-ning a longer time-frame, will hopefully set a constrainton this issue. Because of this characteristic change in thepulsed profile, commonly observed after a burst in magnet-ars (Mereghetti et al. 2015), we believe that the 6.675 h peri-odicity cannot be of orbital origin as had being speculatedin Bhadkamkar & Ghosh (2009), but it must be associatedwith the NS spin period. Early suggestions for the presenceof dips in the folded profile (Becker & Aschenbach 2002)are ruled out, as the spectral hardening appears stronglycorrelated with the total flux over the entire flux range,and it is not localized in the bottoms of the folded profile(Fig. 5). This finding makes 1E 1613 the slowest pulsar toour knowledge (the second being RX J0146.9+6121, with aspin period of 1380 s; Haberl et al. 1998), and also makes1E 1613 a rather exceptional object among all the knownmagnetars, because the distribution of spin periods of theseobjects lies in only a decade of periods between ∼ 2 and 12 s(Olausen & Kaspi 2014). Because of this extreme slow spin,the present rotational energy stored in the NS would be ∼
3.4× 1037 erg (assuming a canonical moment of inertia 1045
g cm2), and this value is very close to the energy dissipatedin the burst event (∼ 2× 1037 erg), thus indicating that mag-netic dissipation of an intense field must be the main, if notthe only source responsible for the observed burst radiation.
If the spin period of the NS at its birth was similar tothat of other magnetars, some mechanism must have furi-ously braked it down on a time-scale comparable with theSNR age, which is only ∼ 2000 yr. Within the magnetarscenario, De Luca et al. (2006) proposed that the brakingcould be provided by a propeller effect due to a reservoirof mass formed from the SNR material fallback (a fossildisc, see also Wang et al. 2006), continuously expelled atthe magnetospheric radius of the NS. The only constraintwhich appears reasonable is that the NS initial period shouldhave been longer than 0.3 s to avoid the disc disruptionby the relativistic outflow of the newly born active radiopulsar. A magnetar with a magnetic field B=5× 10¹⁵ Gcould reach the period observed in 1E 1613, after having ex-pelled 3× 10⁻⁵ M⊙, in less than the age of the SNR. Itis interesting to note that Reynoso et al. (2004) found thepresence of an Hi depression region around 1E 1613 of radius64 arcsec, and a lack of evidence for a possible ionized Hii re-gion. The missing mass was evaluated to be ∼ 0.3 M⊙, thussuggesting that a strong sweeping of material at the centreof the SNR might have taken place. Li (2007) has furtherexplored this scenario through a Monte Carlo simulation ofa population of 106 NS magnetars interacting with a fall-back disc. The NS population differs in initial spin periods,axis orientations, B-field, and mass of the fallback disc. Hefound that most of the magnetars (∼ 99 per cent) would befound 2500 yr after their birth in the ejector phase (whenthe radiative pressure from the NS keeps the surroundingplasma away from the light cylinder and the spin-down canonly be provided by magnetic dipole emission), but that0.6% could be found in the propeller phase (when the discradius is between the magnetospheric and the light cylin-
MNRAS 000, ??–?? (0000)
Evidence for 1E 161348–5055 being a magnetar 11
der radius) and be effectively braked to periods > 103 s aspossibly happened for 1E 1613.
Alternatively, the 1E 1613 could be a binary systemformed by a very low mass star and a magnetar with a spin(quasi-)synchronous with the orbital period (Pizzolato et al.2008). In this scenario the torque needed to slow down theNS is provided by the interactions between the magneticfield and the surrounding material, similar to the case ofwhite dwarfs in intermediate polars. However, the presenceof a low-mass companion which could have survived the su-pernova explosion, is rather unlikely, given that such mass-lopsided system would have been prone to unbinding. Inthis context, it is relevant that De Luca et al. (2008) ruledout all but late M-type stars as possible companions, whileLi (2007) showed that, even in the case of survival, anirradiation-induced wind would not be able to power theobserved X-ray emission. In search of possible counterpartsat other wavelengths, we have also shown the results from arapid optical/NIR follow-up of 1E 1613 with GROND made0.26 h after the BAT trigger and by Swift/UVOT in theoptical/UV bands both at the time of the trigger and in thewhole set of Swift observations of the source. No significantcounterpart was detected in the stacked images consistentwith the position of 1E 1613. We derived a series of upperlimits on the magnitudes in the different bands from NIR toUV, thus supporting the absence of any irradiated close com-panion star, or distant accretion flow (Wang et al. 2007).
4 ACKNOWLEDGEMENTS
The authors are very grateful to Amy Y. Lien for her sup-port in the data reduction and analysis of the BAT data.PAE, APB, NPMK, and JPO acknowledge Swift fundingfrom the UK Space Agency.We acknowledge contract ASI-INAF I/004/11/0.Part of the funding for GROND (both hardware as well aspersonnel) was generously granted from the Leibniz-Prizeto Professor G. Hasinger (DFG grant HA 1850/28-1). Thiswork made use of data supplied by the UK Swift ScienceData Centre at the University of Leicester.This research has made use of the XRT Data Analysis Soft-ware (XRTDAS) developed under the responsibility of theASI Science Data Center (ASDC), Italy.
References
Asplund M., Grevesse N., Sauval A. J., Scott P., 2009, ARA&A,47, 481
Barthelmy S. D., Barbier L. M., Cummings J. R. e. a., 2005, SpaceSci. Rev., 120, 143
Becker W., Aschenbach B., 2002, in Becker W., Lesch H.,Trumper J., eds, Neutron Stars, Pulsars, and Supernova Rem-nants X-ray Observations of Neutron Stars and Pulsars: FirstResults from XMM-Newton. p. 64
Bhadkamkar H., Ghosh P., 2009, A&A, 506, 1297Burrows D. N., Hill J. E., Nousek J. A., Kennea J. A., Wells A.,
Osborne 2005, Space Science Reviews, 120, 165
Carter L. M., Dickel J. R., Bomans D. J., 1997, PASP, 109, 990Castro-Tirado A. J., de Ugarte Postigo A., Gorosabel J., Jelınek
M., 2008, Nature, 455, 506
Caswell J. L., Murray J. D., Roger R. S., Cole D. J., Cooke D. J.,1975, A&A, 45, 239
D’Aı A., Evans P. A., Gehrels N., Gronwall C., Kennea J. A.,
Lien A. Y., Marshall F. E., Maselli A., Sakamoto T., SiegelM. H., 2016, The Astronomer’s Telegram, 9180
D’Aı A., Gehrels N., Gronwall C., Kennea J. A., Lien A. Y.,Marshall F. E., Maselli A., Sakamoto T., Siegel M. H., 2016,GRB Coordinates Network, 19547
De Luca A., Caraveo P. A., Mereghetti S., Tiengo A., BignamiG. F., 2006, Science, 313, 814
De Luca A., Mignani R. P., Zaggia S., Beccari G., Mereghetti S.,Caraveo P. A., Bignami G. F., 2008, ApJ, 682, 1185
Dib R., Kaspi V. M., Gavriil F. P., 2008, ApJ, 673, 1044
Dib R., Kaspi V. M., Gavriil F. P., 2009, ApJ, 702, 614
Duncan R. C., Thompson C., 1992, ApJ, 392, L9
Esposito P., Israel G. L., Zane S., Senziani F., Starling R. L. C.,2008, MNRAS, 390, L34
Esposito P., Turolla R., de Luca A., Israel G. L., Possenti A.,Burrows D. N., 2011, MNRAS, 418, 170
Frank K. A., Burrows D. N., Park S., 2015, ApJ, 810, 113
Gaensler B. M., Slane P. O., Gotthelf E. V., Vasisht G., 2001,ApJ, 559, 963
Gao Z. F., Li X.-D., Wang N., Yuan J. P., Wang P., Peng Q. H.,Du Y. J., 2016, MNRAS, 456, 55
Garmire G. P., Garmire A. B., Pavlov G., Burrows D. N., 2000, inAAS/High Energy Astrophysics Division #5 Vol. 32 of Bul-letin of the American Astronomical Society, A High State inthe Central Object of RCW103. p. 1237
Gavriil F. P., Gonzalez M. E., Gotthelf E. V., Kaspi V. M., Liv-ingstone M. A., Woods P. M., 2008, Science, 319, 1802
Gehrels N., Chincarini G., Giommi P., Mason K. O., Nousek J. A.,Wells A. A., White N. E., 2004, ApJ, 611, 1005
Gotthelf E. V., Halpern J. P., 2008, in Bassa C., Wang Z.,Cumming A., Kaspi V. M., eds, 40 Years of Pulsars: Milli-second Pulsars, Magnetars and More Vol. 983 of AmericanInstitute of Physics Conference Series, CCO Pulsars as Anti-Magnetars: Evidence of Neutron Stars Weakly Magnetized atBirth. pp 320–324
Gotthelf E. V., Halpern J. P., Alford J., 2013, ApJ, 765, 58
Gotthelf E. V., Petre R., Vasisht G., 1999, ApJ, 514, L107
Greiner J., Bornemann W., Clemens C., Deuter M., 2008, PASP,120, 405
Haberl F., Angelini L., Motch C., White N. E., 1998, A&A, 330,189
Halpern J. P., Gotthelf E. V., 2010, ApJ, 709, 436
Ikhsanov N. R., Kim V. Y., Beskrovnaya N. G., Pustil’nik L. A.,2013, Ap&SS, 346, 105
Kaspi V. M., Gavriil F. P., Woods P. M., Jensen J. B., RobertsM. S. E., Chakrabarty D., 2003, ApJ, 588, L93
Kruhler T., Kupcu Yoldas A., Greiner J., Clemens C., McBreenS., Primak N., Savaglio S., Yoldas A., Szokoly G. P., Klose S.,2008, ApJ, 685, 376
Kuin N. P. M., Landsman W., Breeveld A. A., Page M. J., Lam-oureux H., James C., Mehdipour M., Still M., Yershov V.,Brown P. J., Carter M., Mason K. O., Kennedy T., MarshallF., Roming P. W. A., Siegel M., Oates S., Smith P. J., DePasquale M., 2015, MNRAS, 449, 2514
Li X.-D., 2007, ApJ, 666, L81
Mereghetti S., Pons J. A., Melatos A., 2015, Space Sci. Rev., 191,315
Olausen S. A., Kaspi V. M., 2014, ApJS, 212, 6
Palmer D. M., 2002, MmSAI, 73, 578
Pizzolato F., Colpi M., De Luca A., Mereghetti S., Tiengo A.,2008, ApJ, 681, 530
Rea N., Esposito P., 2011, Astrophysics and Space Science Pro-ceedings, 21, 247
Reynoso E. M., Green A. J., Johnston S., Goss W. M., DubnerG. M., Giacani E. B., 2004, Publ. Astron. Soc. Australia, 21,82
MNRAS 000, ??–?? (0000)
12 A. D’Aı et al.
Roming P. W. A., Kennedy T. E., Mason K. O., Nousek J. A.,
2005, Space Sci. Rev., 120, 95Schady P., Kann D. A., Greiner J., 2016, The Astronomer’s Tele-
gram, 9184Scholz P., Kaspi V. M., 2011, ApJ, 739, 94Scholz P., Ng C.-Y., Livingstone M. A., Kaspi V. M., Cumming
A., Archibald R. F., 2012, ApJ, 761, 66Skrutskie M. F., Cutri R. M., Stiening R., Weinberg M. D., 2006,
AJ, 131, 1163Stamatikos M., Barthelmy S. D., Cummings J. R., D’Ai A.,
Gehrels N., Krimm H. A., Lien A. Y., Markwardt C. B.,Malesani D., Palmer D. M., Sakamoto T., Ukwatta T. N.,2016, The Astronomer’s Telegram, 9183
Stefanescu A., Kanbach G., S lowikowska A., Greiner J., McBreenS., Sala G., 2008, Nature, 455, 503
Steiner J. F., Narayan R., McClintock J. E., Ebisawa K., 2009,PASP, 121, 1279
Thompson C., Duncan R. C., 1993, ApJ, 408, 194Thompson C., Duncan R. C., 1995, MNRAS, 275, 255Tody D., 1993, in Hanisch R. J., Brissenden R. J. V., Barnes
J., eds, Astronomical Data Analysis Software and SystemsII Vol. 52 of Astronomical Society of the Pacific ConferenceSeries, IRAF in the Nineties. p. 173
Turolla R., Zane S., Watts A. L., 2015, Reports on Progress inPhysics, 78, 116901
Verner D. A., Ferland G. J., Korista K. T., Yakovlev D. G., 1996,ApJ, 465, 487
Vink J., 2008, Advances in Space Research, 41, 503Wang Z., Chakrabarty D., Kaplan D. L., 2006, Nature, 440, 772Wang Z., Kaplan D. L., Chakrabarty D., 2007, ApJ, 655, 261Woods P. M., Kaspi V. M., Gavriil F. P., Airhart C., 2011, ApJ,
726, 37Woods P. M., Kaspi V. M., Thompson C., Gavriil F. P., Marshall
H. L., Chakrabarty D., Flanagan K., Heyl J., Hernquist L.,2004, ApJ, 605, 378
Yoldas A. K., Kruhler T., Greiner J., Yoldas A., Clemens C.,Szokoly G., Primak N., Klose S., 2008, in Galassi M., PalmerD., Fenimore E., eds, American Institute of Physics Confer-ence Series Vol. 1000 of American Institute of Physics Con-ference Series, First Results of GROND. pp 227–231
MNRAS 000, ??–?? (0000)