mnb bulletin january 2013 · 2013-02-27 · mnb bulletin • january 2013 3 published by: the...
TRANSCRIPT

MNB BulletiNJanuary 2013


MNB BulletiNJanuary 2013

Published by: the Magyar Nemzeti Bank
Publisher in charge: Dr. András Simon, Head of Communications
H-1850 Budapest, 8−9 Szabadság tér
www.mnb.hu
ISSN 1788-1528 (online)
The aim of the Magyar Nemzeti Bank with this publication is to inform professionals and the wider public in an
easy-to-understand form about basic processes taking place in the Hungarian economy and the effect of these
developments on economic players and households. This publication is recommended to members of the business
community, university lecturers and students, analysts and, last but not least, to the staff of other central banks
and international institutions.
The articles and studies appearing in this bulletin are published following the approval by the editorial board,
the members of which are Dániel Listár, Gábor P. Kiss, Róbert Szegedi and Lóránt Varga.
The views expressed are those of the authors and do not necessarily reflect the offical view
of the Magyar Nemzeti Bank.
Authors of the articles in this publication: Judit Brosch, Ágnes Csermely, Éva Divéki, Szilárd Erhart, Dániel Felcser,
Harald Uhlig, István Helmeczi, István Kónya, Imre Ligeti, Ádám Martonosi, Zoltán Molnár, Katalin Szilágyi, Zita Véber
This publication was approved by Lajos Bartha, Péter Benczúr, Ágnes Csermely, Áron Gereben, Katalin Simon

MNB BulletiN • JaNuary 2013 33
Published by: the Magyar Nemzeti Bank
Publisher in charge: Dr. András Simon, Head of Communications
H-1850 Budapest, 8−9 Szabadság tér
www.mnb.hu
ISSN 1788-1528 (online)
Contents
Summary 5
Ágnes Csermely: Who pays the ferryman? the story of the euro area from recession to political crisis to the revision of the institutional structure 7
Éva Divéki and istván Helmeczi: the effects of the introduction of the intraday credit transfer 14
Szilárd erhart, imre ligeti and Zoltán Molnár: Reasons for the liBOR review and its effects on international interbank reference rate quotations 23
Dániel Felcser: How should the central bank react to the VAt increase? 35
Ádám Martonosi: Factors underlying low investment in Hungary 42
Zita Véber and Judit Brosch: Can cash payment be limited in a modern payment system? 52
interview with Harald uhlig 62
Appendix 68
Publications of the Magyar Nemzeti Bank 72


MNB BulletiN • JaNuary 2013 5
DeAR ReADeR,
The Magyar Nemzeti Bank attaches great importance to
making central bank analyses on various current economic
and financial trends of general interest available to the wider
public. The January 2013 issue of the MNB Bulletin provides
an overview of the major stages of the euro-area crisis, takes
an account of the effects of intraday credit transfers,
examines the case of the LIBOR review, reports on the central
bank dilemmas related to the VAT increase, investigates the
causes of low investment rates in Hungary and summarises
the issues raised in relation to the limitation of cash
payments. In addition, the current issue features an interview
with Harald Uhlig, Professor at the University of Chicago.
The article by Ágnes Csermely provides an overview of the
road of the euro area from the recession through the crisis
to the reorganisation of the institutional structure. The
debt crisis has brought to the surface key weaknesses in the
institutional structure of the EU. The public securities
markets of the individual countries have turned out to be
potentially just as vulnerable to speculative attacks as fixed
exchange rates. It has emerged as an unmanageable
problem that, while governments themselves are struggling
with the sustainability of debt, banks operating on the
integrated money and capital markets are also relying on
the national governments for a bailout. The difficulties of
potential recovery are aggravated by the fact that the strict
fiscal policy serving as the institutional foundation of the
euro area needs to be restored at a time when the private
economy is also in the process of deleveraging, while
monetary policy is unable to boost growth through further
interest rate cuts. Calming down the escalating crisis would
have required rapid crisis management measures. However,
the measures adopted as a result of compromises between
economic rationality and political reality proved inefficient
for a long time. The institutional vacuum gave rise to the
emergence of self-generated negative spirals. It has now
become obvious that the institutional framework of the
monetary union needs to be reconsidered, including
increased risk sharing between member states, and that an
increasing number of fiscal and control functions need to
be elevated to the Community level. The emerging
institutional structure, which still lacks full political
support, is seen as a longer-term strategic goal.
Éva Divéki and István Helmeczi review the effects of
intraday credit transfers in operation since July 2012. In the
past half year, the new system operated reliably, without
any trouble. The central clearing of transactions is typically
performed within 10 minutes, and almost all transactions
are executed within 2 hours, i.e. the transferred amount is
credited to the beneficiary’s account within this time span.
Experiences of the first half year suggest that the
management of the liquidity needed for the settlement of
intraday credit transfers also does not cause any problems
for banks. According to the authors’ calculations, in line
with their preliminary expectations, banks implemented
only negligible hikes in their fees in connection with the
introduction of the intraday credit transfer. The new system
also offers advantages that will have favourable effects
over the medium and long terms as well. These favourable
effects include an expected increase in competition among
banks and the hoped wide spreading of automation from
customer to customer.
In their article, Szilárd Erhart, Imre Ligeti and Zoltán
Molnár analyse the reasons for and effects of the LIBOR
review. In 2012, news related the manipulation of LIBOR
directed the attention of authorities and the general public
to interbank reference rates. International reviews made it
clear that a reform of LIBOR and the numerous reference
rates that follow the methodology of LIBOR is necessary,
because changes in reference rates influence the payment
terms of thousands of billions in loans and other financial
agreements. Rapid and at the same time radical changes
cannot be expected in the short run, because preparation
of the changes poses a regulatory challenge that requires
complex, international cooperation. In order to restore
confidence, as of 2013 the British authorities intend to
strengthen LIBOR by the introduction of a statutory
regulation, and they are also planning to designate a new,
independent administrator and to drastically cut the
number of quotes. Overall, the article confirms the
findings of earlier analyses prepared by the Magyar
Nemzeti Bank, according to which BUBOR shows the real
market conditions as an average of longer periods, but at
present its ability to provide a short-term forecast of
interest rate steps is limited.
Summary

MAGYAR NEMZETI BANK
MNB BullETIN • JANuARY 20136
The article by Dániel Felcser seeks to answer the question
of how the central bank should react to the VAT increase.
With a VAT increase, prices go up in the economy as
businesses pass through the effects of the tax rise.
Technically, this means that the consumer price index
increases for one year; this is called the first-round effect.
If, however, the expectations of economic agents are not
completely rational or the inflation target of the central
bank is not credible, there is a risk that agents will consider
the additional inflation attributable to the VAT hike to be
persistent and future inflation to remain higher than it was
before the VAT rise in the long term. In this case, the effect
of the tax hike may also be present in the form of higher
wages and expectations. This latter, indirect process is
called the second-round effect. According to the
international best practice of central banks, monetary
policy disregards the one-off price level increasing shocks,
but attempts to offset second-round effects on inflation.
However, in countries where the inflation target had not
been met before the VAT rise, central banks are more
inclined to also react to direct price level increasing
measures, and risks relating to the anchoring of expectations
are highly articulated in the communication of the central
bank. As inflation in Hungary has persistently been above
the target, there is a possibility that the recurring cost
shocks may become incorporated into inflation expectations
and may cause stronger second-round effects.
Ádám Martonosi examines the causes and effects of low
domestic investment activity. Since the onset of the
economic crisis, an unprecedented downturn in investment
in the national economy has occurred in the past four years.
This marked decline has been registered in all sectors of
the economy, albeit to differing degrees. Investment is a
key aspect of convergence for the Hungarian economy as
the renewal and expansion of the capital stock determines
the magnitude of production capacities, and through that,
economic output. The lack of investment by the government
sector and households mainly reduces gross domestic
product in the short term, while the decline in corporate
investment not only directly reduces aggregate demand, it
also has a negative impact on Hungary’s potential growth in
the medium and long term. In a regional comparison,
investment trends in Hungary were already moving in the
wrong direction before the crisis, with the investment ratio
gradually declining as a percentage of GDP. The adjustment
of 2006 considerably reduced government expenditures,
and simultaneously the less favourable demand conditions
resulted in a general drop in corporate investment. As a
result of the above, at the onset of the crisis Hungary had
the lowest investment rate in the region. The combination
of the major economic slowdown, the substantial balance
sheet adjustment requirement for the public and private
sectors alike and the marked downturn in the lending
activity of banks caused a substantial decline in investment.
In Hungary, the decrease in accumulation by households has
been significant in international comparison, while the
government’s investment ratio has remained stable in
recent years, mostly as a result of the accelerated use of EU
funds. The drop in corporate investment proved to be
substantial primarily in sectors producing for the domestic
market and in the service sectors, while investment by
companies producing for exports was boosted considerably
by large projects in the manufacturing industry. Domestic
economic activity was largely consistent with trends in the
region, but the combination of an unfavourable initial
position, the negative outlook for the individual sectors as
well as the existing risks point to persistent investment
problems. Looking forward, the lack of investment may
reduce the speed of Hungary’s convergence to Europe and
the country may fall behind its neighbours in terms of
economic growth.
In their article, Judit Brosch and Zita Véber report on the
limitations of cash payment. In connection with the
interpretation of the legal tender status of banknotes and
coins, different views have been voiced in recent years:
whether cash or certain denominations of banknotes and
coins (large-denomination banknotes, small-denomination
coins) can be rejected as means of payment for products or
services; whether it is acceptable that a product or service
can be paid only through electronic payment instruments,
and whether cash surcharges can be applied. In the opinion
of the Magyar Nemzeti Bank as the body responsible for the
issuance of forint banknotes and coins, the legal tender
status of banknotes and coins does not mean their obligatory
acceptance for payment under all circumstances. The
article provides an overview of the various approaches to
the legal tender status and presents the technical arguments
which the authors believe support the position of the MNB.
Finally, the Bulletin contains an interview with Harald Uhlig,
Professor at the University of Chicago. Before joining the
University of Chicago, Professor Uhlig taught at Princeton
University, Tilburg University and at Humboldt University,
Berlin. His research areas include macroeconomics, financial
markets and Bayesian econometrics, with special regard to
their intersection. Between 2006 and 2010, he was Co-Editor
of Econometrica. He contributes as Advisor to the work of
the Deutsche Bundesbank and the Federal Reserve Bank of
Chicago. Currently, he is Leader of the Business Cycle Dating
Committee established by CEPR and Research Fellow of
CEPR and NBER. Professor Uhlig was awarded the Grand
Prize of the ‘Verein für Socialpolitik’ in 2003.
The Editorial Board

MNB BulletiN • JaNuary 2013 7
1 Based on the presentation delivered at the 20th Convention of the Hungarian Economic Association in Eger, on 28 September 2012.
tHe BASiC CONCePt OF tHe euRO AReA: MONetARy uNiON WitHOut A FiSCAl uNiON
Before the introduction of the single currency, the countries
of the euro area operated an exchange rate regime that was
pegged to the German mark (ERM, ERM-II). That period was
characterised by frequent currency crises and, consequently,
several participating currencies were repeatedly devalued
due to market forces. With the liberalisation of the
movement of capital, such speculative attacks became
increasingly common and more expensive. As the increasing
vulnerability of fixed exchange rate systems became
apparent in other parts of the world as well, economic
thinking began to reconsider the costs and the benefits of
strictly managed exchange rates. By the early 1990s,
“corner solutions”, i.e. the irreversible fixing of the
exchange rate and free floating, had become the exchange
rate systems preferred by the economic profession.
In keeping with the ever-closer economic integration,
member states of the European Union decided in favour of
adopting a single currency. The fact that, during the
previous decades, the Bundesbank had been the only
central bank to pursue an independent monetary policy,
was certainly conducive to making that decision. At the
same time, there was no political support for centralisation
or even harmonisation of fiscal policies. Therefore, it was
intended that the stability of the institutional structure
would be guaranteed by the budgetary discipline of the
individual countries. That idea fell in with the economic
thinking of the early 1990s as, at that time, the credibility
of the fixed exchange rate was mostly undermined by the
lack of budgetary discipline.
Accordingly, the Maastricht Treaty included a number of
institutional guarantees in order to ensure fiscal discipline
by the member states. First, a law was adopted banning
member states or the ECB from providing a “bail out”, i.e.
monetary financing, to another member state. The fiscal
policy of member states was monitored through the joint
discussion of convergence and stability programmes whereas
an excessive deficit procedure was initiated against
countries that did not comply with fiscal discipline.
Ágnes Csermely: Who pays the ferryman? the story of the euro area from recession to political crisis to the revision of the institutional structure1
The debt crisis has brought to the surface key weaknesses in the institutional structure of the EU. The public securities
markets of the individual countries have turned out to be potentially just as vulnerable to speculative attacks as fixed
exchange rates. It has emerged as an unmanageable problem that, while governments themselves are struggling with the
sustainability of debt, banks operating on the integrated money and capital markets are also relying on the national
governments for a bailout. The difficulties of potential recovery are aggravated by the fact that the strict fiscal policy
serving as the institutional foundation of the euro area needs to be restored at a time when the private economy is also
in the process of deleveraging, while monetary policy is unable to boost growth through further interest rate cuts. Calming
down the escalating crisis would have required rapid crisis management measures. However, the measures adopted as a
result of compromises between economic rationality and political reality proved inefficient for a long time. The
institutional vacuum gave rise to the emergence of self-generated negative spirals. It has now become obvious that the
institutional framework of the monetary union needs to be reconsidered, including increased risk sharing between member
states, and that an increasing number of fiscal and control functions need to be elevated to the Community level. The
emerging institutional structure, which still lacks full political support, is seen as a longer-term strategic goal.

MAGYAR NEMZETI BANK
MNB BullETIN • JANuARY 20138
MOSt PeRiPHeRAl COuNtRieS gOt iNtO tROuBle FOR ReASONS OtHeR tHAN A lACk OF FiSCAl DiSCiPliNe
While cracks in the architecture of the euro area had
already appeared before the crisis, including half of the
member states being subjected to the EDP at times, fiscal
discipline continued to exert its influence. With the
exception of Greece, the troubled countries managed to
meet the fiscal criteria. At the beginning of the crisis, Spain
and Ireland had the lowest public debts. While Italy and
Portugal had higher levels of debt, their budget deficits had
been reduced to acceptable levels and thus were not being
subjected to an excessive deficit procedure when the crisis
erupted.
In smaller countries, the rapidly increasing debt of the
private sector represented the fundamental problem.
Following their accession to the euro area, significant
amounts of capital began to move into these countries. The
resulting low interest rates, coupled with the “europhoric”
income expectations linked to their accession to the euro
area, encouraged the rapid increase of the indebtedness of
the private sector. Both a credit bubble and a real estate
bubble was generated, increasing the vulnerability of the
banking system. The rapid growth of foreign indebtedness
did not trigger a policy response as, according to the
prevailing opinion, debts between countries within the
monetary union did not matter.
In fact, private sector overheating caused fiscal indicators
to appear in a better light, as revenues from a growing rate
of employment, property taxes and extra profits continued
to improve the budgetary position for years. Therefore,
authorities in both Brussels and the member states were
unprepared for the speed at which these revenues
disappeared following the outset of the crisis and the
extent of the subsequent deterioration in the governments’
financial positions. The loss of temporary revenues
generated by the overheated economy and deep recession
resulted in a rapid increase in public debts. The
unmanageability of the situation was, however, greatly
aggravated by the escalation of the problems emerging in
the banking sector. On the one hand, this generated a
direct fiscal cost, while indirectly (due to the steadily
declining economic output as a result of the credit crunch),
it also marred the perception of the sustainability of public
debt.
tHe iNStitutiONAl PROBleMS OF tHe euRO AReA CONtRiButeD tO tHe DeePeNiNg OF tHe CRiSiS
Numerous earlier debt crises2 documented in economic
history typically resulted in a more serious and longer-
lasting economic slump compared to exchange rate crises.
The extent of the current debt crisis is outstanding even by
these standards, as many developed countries are
simultaneously affected globally, and consequently these
countries which are forced to cut their domestic demand
are unable to recover from the recession by increasing their
exports.
The protracted nature of the debt crisis has partly been due
to the fact that, at such times, the efficiency of traditional
economic policy instruments is extremely low, as decision-
makers tend to focus more on downsizing debt rather than
on maximising profits. Due to the vicious circles emerging
in the debt crisis, the recovery of economic growth
becomes extremely difficult. The interactions between the
financial sector and actors of the real economy contribute
to the emergence of a downward spiral. The behaviour of
the private sector tends to be mostly affected by the
increasingly unfavourable income expectations, growing
interest costs and a loss in the value of real estate and
holdings of securities, resulting in a substantial decline of
the propensity to consume, along with a reduction in
employment and the deferral of investments. The activity
of the banking system is impacted by the deteriorating
quality of portfolios, the loss of the value of collateral, the
increasing cost of borrowing and the tightening of external
financing conditions, which results in a reduction in the
general availability of loans. Through the so-called financial
accelerator effect, all of these also have repercussions for
the balance sheets of non-banking actors. The lending
shortage has a restraining effect on production, contributing
to the slump in the economy, the deterioration in the
perception of risk, the decline of asset prices and the rise
of interest expenses. All of this makes the outlook of
economic agents even gloomier, which in turn increases the
adaptation pressure.
In the countries caught up in the vicious circle of the debt
crisis, both governments and central banks play a key role
in stabilising the situation. However, deploying the
traditional instruments of stabilisation is not the most
important step to facilitate recovery from the crisis.
2 IMF (2009), World Economic Outlook, April, Chapter 2.

MNB BulletiN • JaNuary 2013 9
WHO PAyS THE FERRyMAN? THE STORy OF THE EURO AREA FROM RECESSION TO POLITICAL...
Monetary policy
The monetary policy of countries in a debt crisis responds
to the substantial decline of growth and the increase of
deflation risks by reducing interest rates. This, however,
has a small impact on household credit demand and thus on
consumption, as the primary goal is to reduce debt.
Similarly, low interest rates will not provide a strong enough
incentive for investors, due to the uncertainties in the
market. As the impact is low, central banks tend to use
their maximum latitude in order to improve monetary
conditions. In this type of crisis, however, the most
important task of central banks is to remove the obstacles
to the functioning of the financial system. To that end, they
help resolve the scarcity of bank financing through new
instruments to improve liquidity and attempt to restore
operation of the frozen segments of capital markets as soon
as possible, resorting to a wide array of unconventional
measures.
During the initial period following the onset of the crisis,
the monetary policy pursued by the ECB was similar to that
of the central banks of other developed countries. It
reduced key interest rates, in several steps, to virtually
zero, created new liquidity-generating opportunities for
banks and launched an asset purchase programme in order
to restore the functioning of frozen money markets.
However, as the crisis spread to European sovereigns, the
limitations of the institutional arrangement emerged. While
during the period prior to the crisis, the public securities
issued by member states of varying degree of indebtedness
had, from an investor point of view, been very close
substitutes of each other, from 2009, these sub-markets
which play a key role in the transmission of monetary policy
started to become increasingly segmented. Similarly, it
could be assumed that risk avoidance due to doubts
concerning the future of the euro area as well as speculation
were playing a part in the shaping of the extreme pricing.
Despite the key importance of public securities markets in
the preservation of the functionality of the financial
system, the ECB, bound by the ban on monetary financing,
was unable to play an active role in the stabilisation of
these markets.
Fiscal policy’s scope for action
Fiscal policy also plays an important part in the stabilisation
of the debt crisis. The most helpful forms of fiscal loosening
are ones intended to directly generate demand in the
economy (e.g. vehicle scrapping schemes, employment
programmes or investment in infrastructure). Another
government task of primary importance is the speedy
restoration of the lending ability of the banking system,
since lending is needed to enable the allocation of resources
and growth to resume. In earlier debt crises which were
successfully managed, the priorities of economic policy
have always included the cleaning of the balance sheets of
the banking system (e.g. Sweden 1992−1993, USA 2007−2009).
On the other hand, it took a long time to restore growth in
countries where economic policy turned a blind eye to the
bad loans that had accumulated on banks' balance sheets
(e.g. Japan's “lost decade” following the crisis of 1992).
Similarly to monetary policy, fiscal stabilisation in Europe
can be divided into two periods. In the first phase of the
crisis, when the centre of the crisis was still in the US, the
European Union announced the launch of a coordinated
fiscal stimulus package. The European Economic Recovery
Plan allowed a quick yet temporary fiscal relief in each
country considered to be free of concerns about fiscal
sustainability. This internationally coordinated programme
was successful. In 2009, it was expected that growth
would resume in both the US and Europe. However, as the
first results of stabilisation became apparent, the fiscal
policies of the US and Europe started to follow different
paths. While fiscal incentives continued in the US, the EU
opted for the gradual elimination of excessive deficits. In
2011 and 2012 budgets were severely tightened in most
countries. This could partly be due to the fact that the
Greek debt crisis had openly questioned the institutional
foundations of the euro area and increasing speculation
was surfacing in connection with a possible disintegration
of the euro area. Therefore, various European economic
policy-makers came to the conclusion that, in the current
situation, the most important task was to restore the most
important institutional foundation of the euro area, i.e.
the fiscal discipline of the member states as soon as
possible. Rapid fiscal consolidation also appeared to be
the appropriate remedy against the contagious effects of
the debt crisis.
The change in direction in European fiscal policy gave rise
to a serious debate both within the euro area and on
international fora. Core European countries with a
favourable risk rating were criticised3 for having reversed
fiscal policy too fast, removing the only support for growth
and thus helping Europe slump back into recession. Since
growth in peripheral countries can only be based on
exports, the countries which previously provided the
lending for the run-up of excessive debts should now
increase their internal demand in order to encourage the
economic adaptation of the peripheral countries.
3 IMF (2012), World Economic Outlook, April, Chapter 2.

MAGYAR NEMZETI BANK
MNB BullETIN • JANuARY 201310
An even more serious controversy took shape in connection
with the fiscal policy to be pursued by the member states
in trouble. While the European mainstream considered that
a multi-annual programme of reforms and dynamic fiscal
consolidation would be necessary, the delayed start of
economic growth raised increasing doubts concerning the
appropriateness of quick fiscal consolidation. The chief
argument of the advocates of increasing fiscal latitude4 was
that these countries were in a special situation where the
fiscal multiplier was substantially higher than usual5 and
therefore austerity would set back growth to such an extent
that the targeted budget deficit could not be achieved due
to the melting of tax bases and the extra expenditure as a
result of the decline in employment. In an extreme
situation, austerity can become self-destructive, i.e.
regardless of the measures taken, the decline in growth and
its adverse effect on market returns will result in the
perception of fiscal sustainability not improving at all.
A slower rate of fiscal consolidation is only viable if
someone is willing to finance it at an acceptable rate of
interest. Advocates of rapid fiscal consolidation argue that
the key to resolving the situation is the speedy restoration
of trust on the market, which can only be achieved by
attaining a sustainable budgetary position as early as
possible. As long as that is not achieved, high interest
premiums and the continuing decline of asset prices will
only aggravate the balance sheet position of the private
sector. According to this school of thought, a slowdown in
consolidation leads to long-term recession.
the intertwined fates of states and banks
Finally, as far as the management of the problems of the
banking system is concerned, the approach taken by
European countries was again different from that of the US.
In the United States, a substantial cleaning of portfolios and
the recapitalisation of major banks by the federal
government started in 2009. While a similar wave of
recapitalisation took place in Europe in 2009, the systemic
audit of the portfolios is still to be carried out. Moreover,
the European authorities left much greater scope for banks
to improve their capital position through balance sheet
adjustment, i.e. downsizing their assets.
The slow consolidation of the banking system may be due to
several factors. First, while banking activities have spread
across national borders, there was no unified surveillance of
their activities or a European institution with an overall
view of their relations and the potential contamination
channels. Concerns about potential rippling effects also
delayed the write-off of losses. Second, since the cleaning
of bank portfolios is typically carried out with substantial
state commitments, governments in a weakened budgetary
position were reluctant to take on added burdens. The
example of Ireland in particular, where the nationalisation
of failed banks was followed by an extremely fast increase
of public debt, put governments on guard.
The situation, however, continued to deteriorate due to the
postponement of bank consolidation. If the quality of a
bank's portfolio deteriorated, investors immediately
responded by downgrading the risk rating of the country
where the bank's headquarters were based since, if the
bank goes bankrupt, the state will ultimately have to cover
the depositors' money. Since the balance sheet totals of
numerous banks were very high compared to the size of
national budgets, investors also downgraded their
perception of fiscal sustainability. That also had
repercussions on the perception of banks as they had a
large amount of public securities in their possession. A
vicious circle was thus generated, resulting in an ever-
worsening investor perception of banks and governments.
The resulting uncertainty slowed down the performance of
the economy by curbing lending by banks and the ensuing
extremely high costs of financing. The recession in turn
added to the problems of both the banking system and
public finance.
the state has no lender of last resort
Finally, as an additional aspect of institutional problems,
mention must be made of the absence of the lender of last
resort function to the state. The crisis has revealed that, if
liquidity problems occur, member state governments are
unable to obtain funds as central banks are prohibited from
providing monetary financing to governments. That leaves
the states concerned in a situation similar to having a debt
denominated in a foreign currency. Paul de Grauwe6
illustrates the problem through a comparison of the
economies of Spain and the UK. Despite the similar
fundamentals of the two countries, there is a significant
difference in yields on the public securities market. This
may be related with the market perception whereby if a
government had liquidity problems, the Bank of England
would be both able and willing to provide temporary
4 Gros, D. anD r. Maurer (2012), “Can Austerity Be Defeating?”, Intereconomics, 3.5 Under normal circumstances, monetary policy is capable of compensating the impact of fiscal austerity, while economic operators aim to smooth their
consumption; such compensatory mechanisms do not work in the current situation.6 De Grauwe, Paul (2011), “Managing a fragile Eurozone”, Vox.Eu blog.

MNB BulletiN • JaNuary 2013 11
WHO PAyS THE FERRyMAN? THE STORy OF THE EURO AREA FROM RECESSION TO POLITICAL...
financing assistance, whereas the same is considered
unlikely as far as the ECB is concerned.7 Should such a
difference in behaviour really exist, it may increase the risk
of sovereign default in euro area countries under a worst-
case scenario. Therefore, apart from a crisis-driven market
behaviour that has tended to test potential economic policy
responses to extreme scenarios, the questions about the
lender of last resort function may have been an additional
factor feeding speculation on the public securities markets
of peripheral countries. The exposure of the public
securities markets of member countries to speculative
attacks is certainly considered a serious systemic risk.
Temporary liquidity problem could escalate into a solvency
crisis as sustainability indicators decline, due to the
prevailing interest rates and poor economic performance.
eCONOMiC POliCy ReSPONSeS
The euro area was caught unprepared for the spread of the
European sovereign debt crisis. Since the monetary union,
based on fiscal self-control, lacked institutions for crisis
management, the necessary measures could not be adopted
before the conclusion of a negotiation procedure between
the member states. By nature, this decision-making
mechanism is significantly slower than that of the United
States, for example, where the federal government and the
Fed were fully empowered to adopt decisions on emergency
measures, including immediate liquidity injections financed
by the central budget. The delay in the adoption of crisis
management measures, public discussion on contrary
opinions and interests and the uncertainty surrounding the
ultimate decision contributed substantially to the escalation
and the spread of the crisis to several countries within the
region.
The institutional reforms carried out during the crisis fall
into two categories. The first group includes measures
designed to prevent the emergence of potential crisis
situations in the future, while the second group includes the
institutions of crisis management. Since the measures in the
second category also involve direct financial transfers and
commitments to future liabilities, progress in that field has
been slower. A future risk-sharing framework is still work in
progress.
Preventive measures
To prevent the emergence of potential crises in the future,
the institutions to enforce fiscal discipline have been
reinforced in various phases and through several legislative
packages (six-pack, two-pack and the Fiscal Compact). The
extent of the adjustment expected of the member states in
order to eliminate the excessive deficit and excessive debt
procedure has thus been more accurately defined. Failure
to adjust leads to financial sanctions. Moreover, the
changing of the rules of procedure has made it substantially
more difficult for member countries to sabotage the
enforcement of the rules of fiscal discipline through
political compromises.
Since the lack of budgetary discipline was not the sole or
the primary factor contributing to the emergence of the
current crisis, a new institution, the excessive imbalance
procedure was developed to monitor the emergence of
macroeconomic imbalances and to coordinate economic
policy responses. It allows the Commission to continuously
monitor the balance and indebtedness indicators of the
member states and, if it concludes that financial imbalances
are accumulating, it will put forth suggestions for the
required financial adjustment. The European Semester
establishes the institutional framework that enables the
Commission to express, at an early stage of the budgetary
process, its opinion on the structural and stabilisation
measures, and economic policymaking. Finally, new
European bodies have also been set up with a view to
monitoring the lending trends that play a crucial role in the
emergence of financial imbalances. The tasks of the
European Banking Authority (EBA) include the coordination
of surveillance activities, the assessment of the processes
of the banking system from a microprudential point of view
and the formulation of recommendations, while the
European Systemic Risk Board (ESRB) was given the task of
carrying out macroprudential analyses. At the outset of the
crisis, however, these institutions did not exist and even if
they had existed, they would not necessarily have had an
opportunity to exert a significant influence on the situation
as these new bodies hardly have any actual power to adopt
decisions. The opportunity to intervene in and the
responsibility of managing the problems of the banking
system have been left at the national level.
Crisis management measures to control the debt crisis
The debt crisis can be brought under control if, as a result
of the appearance of a lender of last resort of sufficiently
high fire-power, market participants attribute very low
probability to the occurrence of sovereign default, which
would result in the inability of the state to finance its
maturing government bonds. At the outbreak of the crisis,
however, the function of the lender of last resort to the
state had not been institutionalised within the euro area.
7 In both countries, monetary financing is banned by the Maastricht Treaty.

MAGYAR NEMZETI BANK
MNB BullETIN • JANuARY 201312
Moreover, the no bail-out clause and the prohibition of
monetary financing also prevented the emergence of a
possible solution. The most severe obstacles, however,
were of a political nature. Since, at the time of the
establishment of the European Union, such an eventuality
was not included among the rules of the game, taxpayers
within the EU are very unwilling to grant financial support
to other countries. While political support for smaller
transfers was obtained, it became increasingly difficult with
the escalation of the crisis, as the possible grand total
became increasingly difficult to assess.
The establishment of the European System of Financial
Supervision (EFSF) was the first in a series of emergency
measures. Under the EFSF, rather than EU member states
providing direct lending, they contributed to the
establishment of a crisis management fund to provide
financial assistance to member states facing liquidity
problems subject to strict macroeconomic conditions. Later
on, in an attempt to set up a permanent institution,
member states decided to establish the European Stability
Mechanism (ESM), which is capable of involving money
market funds to finance consolidation programmes under
the guarantees granted by the member states. In 2010, the
ECB also announced its Securities Market Programme (SMP),
under which it purchased government bonds at the value of
€217 billion. The interventions by the ECB were designed to
restore the proper transmission of monetary policy, i.e. to
enable low interest rates on the public securities markets
of troubled member states. Since, however, the volume of
the intervention was not significant, it was unable to
achieve a substantial reduction of risk premia. Later on, at
the turn of 2011 and 2012, the ECB also employed indirect
means to help restore the public securities markets of
peripheral countries. Under the LTRO (Long Term
Refinancing Operation) programme, it made available
multi-annual credit lines to banks. These were primarily
used by commercial banks in troubled countries partly for
purchasing public securities issued by their respective
countries.
Despite the measures adopted in order to manage the
crisis, these interventions lacked sufficient fire-power to
prevent the spread of the crisis. On the contrary, the
escalation of the crisis was accompanied by market hysteria
concerning the potential sufficiency of the available funds.
These solutions also failed to address the problem arising
from the joint assessment of the position of banks and
governments. In fact, it is possible that the LTRO, despite
providing effective relief to the liquidity crisis in the
banking sector, made the problem of related risks even
worse. A number of suggestions have been put forward on
the possible means to increase the magnitude of Community-
level interventions on the public security markets in
addition to the commitments of the member states through
contributing to the EFSF and the initial capital of the ESM.
None of these suggestions have, however, been given the
required political support as both the simple and the
complex schemes were implicitly based on the sharing of
costs on a Community level. The fact that it was apparent
which countries would be the payers and the beneficiaries
in the short term was not the only obstacle that prevented
the broad political support of these schemes. Another
factor playing an important role in the protracted
negotiations has been that such a risk-sharing mechanism
goes far beyond the framework of cooperation envisaged by
the Maastricht Treaty.
A breakthrough in the suppression of market speculations
concerning the appearance of a lender of last resort was
achieved in summer 2012. On the one hand, the legal
concerns about the operation of the ESM were resolved and
even the contributions by the member states were
increased. yet, even more importantly, the ECB announced
its OMT (Outright Monetary Transaction) programme. Under
the latter, the ECB is willing to purchase an unlimited
amount of public securities issued by countries under an
ESM programme, provided that these countries meet the
criteria set by the programme. While only verbal intervention
has occurred so far , the possibility of unlimited intervention
resulted in a significant decline in returns on the public
securities markets of the countries concerned, despite the
fact that participation in the programme has been subject
to stricter conditions than was first thought by the markets.
Unfortunately, this has not brought an end to the debt
crisis. It remains to be seen whether the countries in need
of financial assistance will be able (and willing) to push
through the required strict fiscal consolidation programmes
under the deteriorating economic conditions and increasing
social tensions or whether they will arrive at a point where
leaving the monetary union has smaller costs.
Separating the risks of banks and governments
A crucial aspect in the escalation of the crisis was that the
risks of banks and sovereigns have been linked and have
mutually reinforced each other, due to banks operating on
a multinational basis, whilst the bank bail-out functions
have been delegated to the level of the member states.
Prior to the crisis, no institutional solution had been
established for bank surveillance beyond the member state
level or for the sharing, between the countries concerned,
of the costs of the management of the banking crisis. If, as
a consequence of the crisis, the banking system to be
established in the future requires an accord between the
activities of banks and the magnitude of crisis management

MNB BulletiN • JaNuary 2013 13
WHO PAyS THE FERRyMAN? THE STORy OF THE EURO AREA FROM RECESSION TO POLITICAL...
capacities, there are two possible alternatives for the
development of the euro area. Either banks must return to
the confines of the individual member states or, if the
benefits of the increased efficiency of a single monetary
market are to be preserved, the institutions of Community-
level bank bail-out instruments and Community-level
deposit insurance must be established. As a condition
precedent for the increased sharing of the inherent risks of
the banking system, however, both prevention and bank
surveillance must also be raised to the Community level in
order to eliminate the problem of free riders. That new
institutional setup has been outlined by the proposal for a
banking union.
The banking union would be based on four pillars. The first
pillar is the common regulatory framework, i.e. the “single
rulebook” of prudential rules. Supervision and prevention
would be transferred to a central surveillance body headed
by the ECB. While essentially functioning as a microprudential
authority, according to the current ideas it would also have
macroprudential powers. On the longer run, the safe
operation of a collectively supervised banking system could
potentially be supported by a joint bail-out fund, which
would be established mainly with contributions of the
banking sector, but which would, ultimately, have access to
the financial instruments of the ESM. On the other hand,
potential sharing of the current costs of the consolidation of
banks has no political support. Finally, there have been
negotiations on the potential establishment of a deposit
insurance fund, to be financed by the contributions of
banks. Such an institution, however, would also be unable to
exert effective influence on the behaviour of the depositors,
unless it is backed by Community-level funding. For the time
being, greater progress has been achieved as far as the
establishment of common surveillance is concerned, while
no political consensus has yet been outlined in terms of the
framework of the common sharing of risks.
Quo vadis, eurozone?
The crisis has demonstrated that the concept of a “monetary
union without a fiscal union” which serves as the institutional
basis of the euro area is ineffective in dealing with
situations that endanger financial stability and, therefore, a
crisis management framework at the level of the monetary
union is required. As a condition precedent for sharing
financial stability risks, however, joint institutions must also
be established to prevent the accumulation of risk. This
situation requires various aspects of the treaty between the
member states to be reconsidered. Various functions
currently within the competence of the individual member
states should be centralised and a substantial risk-sharing
should be established between the European countries.
That would represent a different quality of the framework
of cooperation, which can only be achieved through a
reinforced political mandate rather than a series of minor
technical steps of institutional reform. Since the summer of
2012, various European leaders have disclosed their ideas
concerning the future of the euro area, all of which were
based on the establishment of a restricted fiscal federation
legitimated by a political union. While due to political
reasons these ideas are very unlikely to be achieved in the
short term, the vision of the future of the euro area may
play an important role by encouraging the union to choose
solutions pointing toward a deepening integration during
the management of the crisis.

MNB BulletiN • JaNuary 201314
iNtRODuCtiON
In Hungary, the regulation of payment systems is included
in the scope of duties of the Magyar Nemzeti Bank (MNB).
Accordingly, for the public good, the MNB performs
continuous monitoring of the quality of the services that
can be used by real economy customers and the development
of technology. Development proposals are elaborated with
focus on customers’ interests, but taking account of
technological reality.
In June 2010, the MNB decided to amend MNB Decree No.
18/2009 (VIII. 6.) on the Execution of Payment Transactions
(hereinafter: the Decree). Following consultations with the
stakeholders, the amendment was published in October
2010, with entry into force on 1 July 2012, in line with the
planned launch of the intraday credit transfer system. The
objective of the amendment of the Decree was to ensure
with legal means that customers in Hungary receive up-to-
date payment service at reasonable price. Pursuant to the
provision of the Decree (the so-called 4-hour rule), credit
institutions (hereinafter: banks) must forward the sum of
the forint electronic credit transfer orders by customers to
the beneficiary’s account-holding bank within 4 hours from
debiting the customer’s account. It has been an effective
rule for years that the beneficiary’s bank must credit the
sum of the payment orders received to their customers’
account immediately.
Our article presents the experiences of the first half year of
operation of the intraday credit transfer system, with
special regard to the changes in bank charges attributable
to the introduction of the new system.
tHe iNtRADAy CReDit tRANSFeR PROJeCt
Domestic payments were previously served by two clearing
systems:
• The so-called VIBER (Real-time Gross Settlement System)
operated by the MNB (since 1999): payments in this
system may be settled in a few minutes, and its primary
function is the risk-free settlement of very high-value
interbank money market transactions.
• The night platform of the ICS (Interbank Clearing System)
operated by GIRO Zrt. (since 1994); this system was
designed to clear the payment transactions of the real
economy (households and corporates), and it ensures that
the beneficiary receives the transferred amount on the
next day.
Although VIBER also allows the settlement of real economy
transactions, in practice the number of such items moving
therein is relatively low. This is primarily attributable to the
high bank charges (often starting from HUF 10,000), due to
Éva Divéki and istván Helmeczi: the effects of the introduction of the intraday credit transfer
In Hungary, the overwhelming majority of credit transfers have been executed in the course of the day since July 2012. In
the past half year, the new system operated reliably, without any trouble. The central clearing of transactions is typically
performed within 10 minutes, and almost all transactions are executed within 2 hours, i.e. the transferred amount is
credited to the beneficiary’s account within this time span. Experiences of the first half year suggest that the management
of the liquidity needed for the settlement of intraday credit transfers also does not cause any problems for banks.
According to our calculations, in line with our preliminary expectations, banks implemented only negligible hikes in their
fees in connection with the introduction of the intraday credit transfer.
The new system also offers advantages that will have favourable effects over the medium and long terms as well. These
favourable effects include an expected increase in competition among banks and the hoped wide spreading of automation
from customer to customer.

MNB BulletiN • JaNuary 2013 15
THE EFFECTS OF THE INTRODUCTION OF THE INTRADAy CREDIT TRANSFER
which the use of this system is extremely uneconomical for
customers (except for the cases when a high bank fee is still
better than the effect of the consequences of a default in
payment). Banks send the items into the night platform of
the ICS in bulk, in the afternoon and evening. The items are
already received by the receiving banks in the early hours
of the next morning, and are typically credited to customers’
bank accounts by the time when branches open in the
morning. In 1994, this service level was considered state-of-
the-art, but the MNB thought that compared to today’s
technology it did not provide an acceptable service level
any longer. Therefore, it examined whether intraday
clearing of real economy transactions entails any financial
risks that would still justify the maintenance of the older
clearing infrastructure. The analysis concluded that banks’
liquidity is completely sufficient for the settlement of the
result of intraday clearing of real economy items.1
In addition, in the past decade, credit transfers settled on
the same day have become a basic service in most Eastern
and Western European countries as well, which also pointed
to the necessity of raising the domestic service level. This
has an impact on interbank competition as well, because
previously banks with a larger clientele were able to obtain
customers more easily, as there was a fair chance that a
customer’s partners also had their accounts at the given
bank (allowing cheaper, faster settlement of transfers to
them).
With introduction of the 4-hour rule, the MNB intended to
achieve that banks jointly create a flexibly parameterable
clearing system, in which a given amount can turn round
several times in a day (‘A’ pays to ‘B’, who pays from this
amount to ‘C’), and that this be the minimum service in
Hungary (i.e. banks should not provide it as a premium
service with a pricing similar to that of VIBER for their
customers). The 4-hour rule ensures that most of the
payment orders contribute to the return on the development,
and thus the bank costs of the investment are distributed
across a large number of transactions, so that the increase
in production cost per transaction can also be kept at a low
level.
Analysing domestic customers’ activity − based on the
March 2007 per minute data − we can see that customers
mainly give credit transfer orders to their banks during the
daytime, primarily during working hours. The clearing cycle
periods have been determined accordingly (see Table 1). In
addition to amending the Decree, the MNB used other
means as well to facilitate implementation of intraday
credit transfers. In addition to initiating a nationwide
project to coordinate the preparations of the banking
sector, it also extended the operating hours of its own real-
time system so that the clearing and settlement systems
can be open in the periods when customers’ activity is the
highest.
The 4 hours set forth in the Decree is the MNB’s minimum
requirement, which can be met with bi-hourly clearing
even if one of the banks has a minor operating problem
during the day or at the time of the clearing cycle just
does not have sufficient funds on its account held with the
MNB.
In 2008, the MNB requested the banks that account for the
most part of the turnover to estimate the expected costs of
the project on the basis of the preliminary concept of the
intraday credit transfer system. Banks’ estimates varied
very widely: as great as tenfold differences occurred
between the estimates of banks with similar sizes and
turnovers. However, as retail payment transactions
represent a very high number of credit transfers, the
investment cost can be distributed across a huge amount of
transactions. Accordingly, based on the MNB’s calculation
− writing the banking sector’s investment off as depreciation
in 5 years (distributed over a transaction turnover of five
years) − the increase in banks’ production cost per
transaction was estimated to amount to HUF 3.40.
CHANgeS iN iNCOMeS FROM PAyMeNt SeRViCeS AND tHe uSuAl MAgNituDe OF BANk FeeS AND CHARgeS
The most uncertain issue for the MNB in connection with
the introduction of the intraday credit transfer was how
banks would actually determine the fees and charges of
credit transfers (hereinafter jointly: fees). However, before
specifically discussing this question, it is worth examining
the sources of banks’ incomes from payment services and
the types of fees applied by them in the pricing of credit
transfers.
Incomes related to payment services may originate from:2
• the fees of payment services,
• the interest income from the balances in the accounts,
and
• the float.3
1 At the same time, it means that the justification for the high price of VIBER items also cannot be accepted in each case.2 Divéki and Olasz (2012).3 Float is the interest income produced at banks on the credit transfers in transit and the settlement of which takes more than a day.

MAGYAR NEMZETI BANK
MNB BullETIN • JANuARY 201316
According to statistics available to the MNB, the value of
banks’ fee income from payment services amounted to an
annual HUF 147−247 billion in the period between 2005 and
2011 (see Chart 2). This revenue is from the fees paid by
customers to banks for using payment services. Examining
the fees, it is worth analysing the fees of domestic forint
credit transfers separately as well, since most of the
transactions initiated by customers belong to this category.
Looking at the pricing of domestic forint credit transfers, a
distinction must be made between the fees applied to the
credit transfers of households and corporates. Considering
that the pricing of credit transfers is combined and not the
same in the case of various account packages, it is
important to examine the types of fees of credit transfers.
We mainly focus on the fee types applied in the case of
electronically submitted credit transfers, because the
4-hour rule of the Decree also relates to electronically
submitted credit transfers.
For households, banks apply fees based on value (per cent,
per thousand), and they also apply minimum, maximum and
fixed fees or free of charges; they may even be combined
in various manners, depending on the given bank. A typical
pricing method is the application of fees based on value,
combined with minimum and maximum values. Fees based
on value have been used by banks for credit transfers for
years, so this type of fee is not unusual for customers.
Looking at account packages for households,4 fees based on
value (combined with minimum and maximum values) are
applied in 44 per cent of electronic credit transfers. In the
case of electronic credit transfers, the second most
frequent is the free of charge type (22 per cent), followed
by the fixed-fee category (12 per cent).
The main difference between the pricing of corporate and
household credit transfers is that although there are
announced and public conditions in the medium and large
company segments, these customers (mainly the large
corporates) are granted special prices by their banks, and it
is difficult to obtain information about these prices.
Therefore, fee types for the credit transfers of large
corporations are not discussed in this article. In the case of
small enterprises, in the pricing of credit transfers submitted
via the electronic channel to outside the bank, banks
typically apply fees based on value combined with minimum
fee (78 per cent), followed by the joint application of the
fixed fee and the fee based on value (10 per cent).
In addition to the fees income from payment services,
income from payment services also include the interest
income originating from the fact that the interest paid by
payment service providers on the sight balance of bank
accounts is typically lower than BUBOR, but by lending this
same amount they can attain a higher yield. This type of
income is estimated to have reached an annual amount of
HUF 147−224 billion in the period between 2005 and 2011
(see Chart 2).
Until the introduction of the intraday credit transfer, the
banking sector had another interest-type income as well
from payment services, which is called float. Float meant
the interest income from the money in transit. It originated
Chart 1Fee types for electronic transfers in retail account packages
12%
8%
8%
6%
44%
22%
Fixed feeFixed fee+fee based on value (combined with maximum fee)Fixed fee+fee based on value (combined with maximum andminimum fees)
Fee based on value (combined with minimum and maximum fees)
Fee based on value (combined with minimum fee)
Free of charge
Note: Our charts examining fee types were prepared by taking banks’ fee packages collected from the Internet as a basis in the period under review. For each fee package we checked which type of fee is typical of the electronic credit transfer in the given fee package; individual account packages were classified into categories corresponding to the type of fee accordingly.Source: Payment service providers’ conditions.
4 The account packages were analysed on the basis of lists of conditions collected from the Internet between April and October 2011. It was not possible to weight the individual types by the number of customers, because we did not have information on the number of customers that use the individual account packages at banks.

MNB BulletiN • JaNuary 2013 17
THE EFFECTS OF THE INTRODUCTION OF THE INTRADAy CREDIT TRANSFER
from the fact that banks debited their customers’ accounts
on the day of giving the payment order or on the date due,
but the money remained with them, and they had to pass it
on to the bank where the beneficiary had its bank account
only at a later date − typically on the day when the other
customer also received the money. Banks did not pay any
interest to their customers for this period, but produced
interest income for themselves. In Hungary, between two
banks this period was typically 1 day, which increased to 3
days at weekends (or could even reach 4−5 days around
holidays or upon a reorganisation of working days).
Accordingly, float is the interest on current account for 1
working day not paid by the bank to its customer. The
introduction of the intraday credit transfer practically
terminated banks’ float income.
In summary, (partly according to our estimates) payment
service providers’ incomes from fees, charges and interests
related to payment services amounted to an annual HUF
301−428 billion in the period between 2005 and 2011. Of
this, the value of fee incomes from payment services was
HUF 147−247 billion, while interest incomes are estimated
to have amounted to HUF 147−224 billion. Total income from
payment services in the period under review amounted to
1.34−1.6 per cent of GDP at current prices. Incomes from
payment services reached their highest level in 2011,
amounting to nearly HUF 428 billion in total. Within incomes
from payment services, in the period between 2005 and
2011, interest incomes of payment service providers
represented a total share of 37−55 per cent, while the share
of fee incomes was 45−63 per cent. Compared to them,
float income was low and estimated to be somewhat higher
than HUF 3 billion in 2010 (however, Chart 2 does not
include this income).
The following section discusses the changes in credit
transfer fees after the introduction of the intraday credit
transfer.
CHANgeS iN CReDit tRANSFeR FeeS uPON tHe iNtRODuCtiON OF tHe iNtRADAy CReDit tRANSFeR
The money market crisis that started in the autumn of
2008, the surtax imposed on banks and the preferential
prepayment of foreign currency loans resulted in a decline
in banks’ lending activity, a considerable deterioration in
the quality of the existing portfolio and a significant fall in
the profit of the banking sector. Economic factors other
than the introduction of the intraday credit transfer (such
as the introduction of the financial transaction tax) further
increase the chance that banks will offset their lost incomes
by raising their fees. The fall in float due to the 4-hour rule
also results in a decline in profit, and prompts banks to
raise their fees. Although it can be concluded that many
factors point to price rises, our analysis below is limited
only to the possible fee increase resulting from the
introduction of the intraday credit transfer.
As the bank fee charged for a specific credit transfer may
depend on many parameters (minimum, maximum fees and
fees based on value), there are many ways to implement a
price increase. For example, banks may increase the
minimum fee and reduce the maximum fee, emphasising
the latter to their customers. As the information about the
volume and value of their customers’ credit transfers is
available for banks, they can make precise calculations,
whereas customers typically do not prepare such deep
calculations regarding their own turnover.
It is extremely difficult to estimate at banking sector level
the magnitude of the fee increase due to the introduction
of the intraday credit transfer. The underlying reason for
this is the existence of a high number of fee packages and
individual conditions and the fact that only the individual
banks know (1) how many customers use the individual fee
packages, (2) what size of turnover the customers belonging
to each account package have, and (3) what the composition
of this turnover is. In addition, difficulties are raised by the
existence of cross subsidisation across various services,
which allows banks to make their customers pay their costs
through the prices of other bank services, instead of
account management services.
Chart 2Payment service providers’ incomes related to payment services
(2005−2011; HUF billion)
1.2
1.3
1.4
1.5
1.6
1.7
0
100
200
300
400
500
2005 2006 2007 2008 2009 2010 2011
Income from feesIncome from interestsTotal income Income rate as of GDP (right-hand scale)
Per cent
Note: The methodology of data collection regarding fee incomes changed from 2010.Source: MNB.

MAGYAR NEMZETI BANK
MNB BullETIN • JANuARY 201318
Relying on the data available, below we try to estimate the
size of the price increase due to the introduction of the
intraday credit transfer. Looking at the fee types described
above, we can conclude that there are several types of fee
increases. For example, raising only the minimum fees may
also result in a fee increase for customers, depending on the
value band the amount intended to be transferred falls into.
We strived to take all of this into account in our estimation.
The distribution of the values of interbank transactions is
available for the MNB, and so we calculated what price
increase this may mean at individual banks in the case of the
fee packages with the lowest monthly fee. The reason why
we analysed these ones is that there are many packages that
contain free of charge services in exchange for a fixed
monthly fee. In the case of these packages, it would be
difficult to prove which service included in the package
caused the change in the fee. We think that the change in
prices can better be observed in the case of fee packages
where the monthly fixed fee is minimal, so the possibility of
cross subsidisation across services is lower.
In the case of these fee packages, banks increased their
credit transfer fees per one transaction from HUF 143.16 to
HUF 146.66, i.e. by HUF 3.5, corresponding to a total 2.45
per cent. Although this size of increase equals the estimate
prepared on the basis of the cost survey concerning the
introduction of the system conducted prior to the project,
the situation is in fact more favourable due to the
preferential/fixed-fee packages. We cannot speak about a
fee increase in the case of the zero-cost account packages,
where customers are granted free payment services and
credit transfers in exchange for a regular monthly credited
sum directed to their bank account (here the bank also
covers its costs from incomes from cross subsidisation). This
points to the fact that the total average fee increase
related to the intraday credit transfer is in fact lower than
the HUF 3.5 quantified in the case of the selected account
packages. Our estimate also leads to the conclusion that
banks have not even shifted a part of the ceasing of their
float income to their customers, as (according to our
calculations) they would have been able to do so only
through a much higher fee increase, exceeding HUF 20.
Accordingly, the ceasing of the float income, which used to
amount to some HUF 3 billion a year, has turned into savings
for banks’ customers.
Banks must announce changes in their general terms and
conditions and lists of conditions to their customers 60 days
prior to entry into force. As the 4-hour rule resulted in
considerable changes in the operation of banks, they
already published the amendments to their general terms
and conditions at end-April 2012.
It is a statutory regulation for banks5 that fees and costs
may only be amended due to a reason that has an actual
impact on the size of the given fee or cost. Therefore, for
banks it is expedient to increase their fees when their costs
change, otherwise it becomes much more difficult for them
to prove justifiability. Accordingly, numerous banks
amended their lists of conditions at end-April 2012 (with
entry into force in July). Therefore, we believe that a
comparison of the 2011 lists of conditions and the ones
amended between April and July 2012 allows well-founded
conclusions to be drawn regarding the sizes of increases in
the fees to be paid by customers due to the introduction of
the intraday credit transfer.
The comparison of the previous conditions valid between
April and October 2011 and the new conditions reveals that
there was some increase in credit transfer fees at some
banks, but several banks left their conditions unchanged. It
is interesting that although several banks raised the fees
for bank branch (paper-based) credit transfers in the
case of certain account packages, their fees for electronic
transfers remained unchanged compared to 2011. However,
there was a bank that increased the fees of electronic
transfers.
Payment services fees were raised again in early 2013, but
these increases are typically attributable to the introduction
of the financial transaction tax and not to the intraday
credit transfer.6
eXPeRieNCeS OF tHe iNtRADAy CReDit tRANSFeR
The intraday ICS clearing that allows for compliance with the
Decree started at the time set by the MNB, i.e. upon the
entry into force of the 4-hour rule. As this was a very radical
change in the operation of banks and GIRO Zrt., minor
incidents occurred, but those concerned were able to solve
them, so banks’ customers did not even perceive them.
In terms of its operation, the new system passed the exam.
Clearing of a cycle typically took 8−10 minutes (including
waiting for the arrival of the cover funds as well); the cycle
with the highest turnover (497,000 items) to date also
remained within 15 minutes. Clearing takes longer only if
the provision of cover funds has to be waited for (but, as
described below, it happens rarely).
5 Article 210 (4) of Act CXII of 1996 on Credit Institutions and Financial Enterprises.6 It was observed in this case as well that banks scheduled their fee changes in line with the changes in circumstances.

MNB BulletiN • JaNuary 2013 19
THE EFFECTS OF THE INTRODUCTION OF THE INTRADAy CREDIT TRANSFER
Based on September data, of all the transactions cleared in
the ICS, 60 per cent in terms of volume and 80 per cent in
terms value were settled in the course of the day. At the
same time, the 4-hour rule does not apply to the Hungarian
State Treasury (MÁK). Excluding the Hungarian State
Treasury, 76 per cent of all transactions in volume and 93
per cent of them in value were settled in the course of the
day (the rest comprises paper-based and debit type
transactions, e.g. direct debits).
Although no increase in volume can be detected, the
turnover of the ICS in value increased considerably, by HUF
1,000 billion per month on average. Previously, banks were
concerned that the ICS would take items from the VIBER
turnover. These concerns were justified as there are many
high-value corporate transfers that require intraday
settlement, but not necessarily a real-time one. A detailed
review of the turnover data reveals that there was a
considerable increase in the number of very high-value
(above HUF 1 billion) transactions; therefore, in all
probability, these items had previously typically been
settled in VIBER. However, this cannot be detected in the
turnover of VIBER (as it amounts to approx. HUF 1,300,000
billion a year, and the change is much smaller than the
natural monthly fluctuation observed in VIBER).
As early as in 2007, the MNB requested ad hoc data supply
from the largest banks regarding the intraday distribution of
the number of transactions.
In the first months it is already worth examining what
picture of customers’ intraday credit transfer activity is
drawn on the basis of the turnover of individual cycles of
the intraday clearing, and how it compares to the practice
observed earlier (Table 1).
The data show that the only significant change between the
two years under review is that a lower percentage of
customers submit their credit transfer orders early in the
afternoon, while the percentage of the number of orders
given later or only at the beginning of the next day
increased considerably. Accordingly, on the basis of the
table we may conclude that the greatest portion of retail
customers’ transfers is executed in the first cycle in the
intraday credit transfer system. The exact reason for the
intraday rearrangement of the times of orders is unknown,
but as the data of comparison are old (2007), it is not
necessarily attributable to the intraday credit transfer
system. It is more likely that the number of non-paper
based retail credit transfers has grown continuously since
2007, and as a significant portion of retail customers
(especially those who apply Internet banking solutions)
submit their credit transfer orders late in the afternoon or
in the evening, this process naturally resulted in the shift
seen in the table. This is also shown by the fact that the
average value of transactions (around HUF 170,000) is the
Chart 3intraday clearing in the iCS in September
75.95%
60.2%
93.25%
79.9%
0 20 40 60 80 100
w/o StateTreasury
Total turnover
ValueVolume
Per cent
Source: MNB.
Chart 4intraday distribution of customer transactions in March 2007
0:00
0:50
1:40
2:30
3:20
4:10
5:00
5:50
6:40
7:30
8:20
9:10
10:0
010
:50
11:4
012
:30
13:2
014
:10
15:0
015
:50
16:4
017
:30
18:2
019
:10
20:0
020
:50
21:4
022
:30
23:2
0
HUFNumber of transactions Value of transactions
0:00
0:52
1:44
2:36
3:28
4:20
5:12
6:04
6:56
7:48
8:40
9:32
10:2
411
:16
12:0
813
:00
13:5
214
:44
15:3
616
:28
17:2
018
:12
19:0
419
:56
20:4
821
:40
22:3
223
:24

MAGYAR NEMZETI BANK
MNB BullETIN • JANuARY 201320
lowest in the first cycle, suggesting a preponderance of
retail orders, whereas the much higher average value of the
last cycle (approx. HUF 601,000) indicates the dominance of
corporate orders.
An important question in intraday clearing was how able
banks would be to manage their liquidity. Preliminary
liquidity simulations showed that this would not cause any
problem, although there are many banks that circulate the
multiple of their respective account balances on the same
day in VIBER. In spite of the fact that the credit line
provided by the MNB against securities collateral greatly
facilitates the performance of the turnover, and the
turnover value of the ICS is negligible compared with that
of VIBER, theoretically it may still happen that money
market items ‘take away’ the funds from the low value
clearing (and the temporarily uncovered position may delay
ICS clearing). Of the 310 cycles completed in the period
between July and September 2012:
• it happened on 3 occasions that the funds did not arrive
during the day in the designated 10-minute period; in this
case the items of the bank concerned7 are executed in
the next cycle (but even in these cases, the 4-hour rule
was not breached);
• it happened on 2 occasions that the provision of funds had
to be waited for at the end of the day (in the most
important period for treasuries).
Accordingly, we think that the system’s parameters related
to the provision of funds are adequate and work well.
OtHeR FAVOuRABle eFFeCtS OF tHe iNtRADAy CReDit tRANSFeR
We explained in the previous chapter that there are effects
of the intraday credit transfer that can already be measured.
In addition, however, there are future effects that are
difficult to measure, which are also expected to belong to
the group of favourable effects. They are outlined below.
The main objective of the 4-hour rule was to attain a
significant increase in service level in payment systems.
The increase in the service level is an effect that can be
quantified only partly, although everyone ‘feels’ its positive
consequences.
For the time being, the use of the system only covers the
simplest transactions. The underlying reason is that the
special Hungarian payment methods (transfer of funds by
the order of authorities, direct debit) also have to be
adjusted to the international message standard. As they
account for a smaller portion of the turnover, the MNB did
not want any delay in launching the intraday credit transfer
because of the adaptation of these payment methods.
However, within not more than 3−4 years it will be
expedient to clear all types of transactions in the new
system. Then the night clearing will become empty and
cease to exist, and debit type transactions will also be
executed in the course of the day.
The shortening of execution has a risk-reducing effect, as it
may be able to substitute for cash in higher-amount
transactions. With regard to this issue, the MNB is of the
table 1intraday distribution of the transfer turnover in 2007 and 2012
Cycle*2007** 2012*** Difference
ea (%) HuF (%) ea (%) HuF (%) ea (%) HuF (%)
Items submitted between approx. 16:00 hours and approx. 08:00 hours next morning (at present, they are executed in cycle 1 [08:30]of the intraday credit transfer)
24.13 11.29 32.33 15.07 8.2 3.78
Items submitted between approx. 08:00 and 10:00 hours (at present, they are executed in cycle 2 [10:30] of the intraday credit transfer)
15.16 12.9 15.69 14.87 0.53 1.97
Items submitted between approx. 10:00 and 12:00 hours (at present, they are executed in cycle 3 [12:30] of the intraday credit transfer)
19.52 18.92 18.13 20.74 −1.39 1.82
Items submitted between approx. 12:00 and 14:10 hours (at present, they are executed in cycle 4 [14:40] of the intraday credit transfer)
19.52 27.63 19.18 25.2 −0.34 −2.43
Items submitted between approx. 14:10 and 16:00 hours (at present, they are executed in cycle 5 [16:30] of the intraday credit transfer)
21.68 29.26 14.67 24.13 −7.01 −5.13
* The cut-off times indicated in the table are for guiding purposes only; individual banks may depart from them.** Estimate on the basis of a March 2007 survey.*** Based on actual data of September 2012 (but other months also show a similar picture).
7 The number of transactions here is only in the magnitude of a hundred.

MNB BulletiN • JaNuary 2013 21
THE EFFECTS OF THE INTRODUCTION OF THE INTRADAy CREDIT TRANSFER
opinion that it will be worthwhile to further increase the
frequency of clearing in the future, because this reduces risks.
As intra-bank items will not be received (significantly)
earlier than now, larger banks’ competitive advantage due
to the time factor will cease to exist. Since the ICS fee is
much lower than what typically appears as a difference in
bank fees between intra- and extra-bank transfers, the
MNB expects a strengthening in interbank competition.
Intraday credit transfers may provide an opportunity for
corporations to reduce the balance of their current account
and take it over to another instrument that has a better
yield, provided that they have a credit limit at their banks.
As there is no interest on the intraday credit limit, if the
balance of the account is positive again at the end of the
day, the account balance held previously because of the T+1
turnover can be reduced. However, as our statistics show,
customers do not use this opportunity yet.
The intraday credit transfer is based on a message standard
that has a much wider data content and can be much more
flexibly shaped than the previous one. This allows companies
as well to change their accounts receivable and payable
analytics in a way to considerably reduce manual work.
Accordingly, intraday clearing may have numerous positive
impacts, whose magnitude cannot yet be precisely
determined due to the complexity of the issue and the
shortness of time that has elapsed.
CONCluSiONS
The MNB launched the project that aimed at the reform of
bank and interbank systems after lengthy preparatory work.
During the project, the systems of more than 150 financial
service providers concerned had to be modified and tested.
This required both significant investment and considerable
external and internal human resources investments from
the participants, entailing a cost increase for banks.
However, due to the enormous number of transactions that
bear these costs we thought that the cost increase would
be insignificant. Based on the investment costs estimates
requested from banks, the MNB estimated the production
cost increase per transaction to amount to HuF 3.4. It
was uncertain for the MNB as well whether due to lower
profits as a result of the financial crisis and due to other
burdens carried by banks they would considerably raise the
fees to be paid by customers, so we wanted to measure it
in any case. This is not a simple task because of the
significant cross subsidisation and the fee packages the
monthly charge of which is higher but which contain many
‘free’ transactions in exchange, as sufficiently detailed
information is not available. According to our calculations,
in the packages with a minimum monthly fee (containing no
‘free’ transactions) the cost of transfers increased by an
average HuF 3.5, which is very close to our earlier
estimate. This figure seems to be especially good considering
that banks lost most of their income from the money in
transit (float) when the system was launched.
The past half year demonstrated that the completed system
passed the exam, works reliably and its operation has
become a routine. The MNB considers it a great achievement
that banks chose a 2-hour clearing period instead of the
4-hour one required by the MNB Decree, which practically
means that in normal operation transactions reach
recipients in not more than 2 hours. Transactions
submitted at the ‘luckiest’ time might as well reach the
other bank account in 10−20 minutes. As a result, the
execution time of transfers shortened considerably, and
customers also seem to have adjusted themselves to it:
firstly, submission practices changed to some extent;
secondly, the value of transactions performed through the
ICS increased significantly.
In our opinion, the shorter execution time will strengthen
interbank competition for customers against the execution
within the same bank, which has been a real-time operation
for long.
As interbank transactions are already based on the flexibly
changeable xml standard, which is applied in the SEPA
payment methods as well, this allows the wide spreading of
automation from customer to customer in the case of
transfers as well.
ReFeReNCeS
Divéki éva anD olasz Henrietta (2012), “A pénzforgalmi
szolgáltatások árazása”, [The pricing of payment services],
MNB-tanulmányok, 101.
kovács levente (2011), “A T-napos utalás gazdasági hatásai.
Előadás a Magyar Közgazdasági Társaság Pénzügyi
Szakosztályának konferenciáján, 2011. február 8., Budapest”,
[Economic effects of the T-day transfer. Presentation at the
conference of the Financial Section of the Hungarian
Economic Association], in: InterGIRO2 − Napon belüli
elszámolás konferencia tanulmánykötet, [Intraday clearing
conference, volume of essays and studies], pp. 20−30.

MAGYAR NEMZETI BANK
MNB BullETIN • JANuARY 201322
kovács levente (1999): “A pénzforgalmi jutalékbevétel
növelésének lehetősége”, [The possibility of increasing the
commission income from payment services], Bankszemle,
10−11. sz., pp. 96−101.
Milne, alistair anD leilei tanG (2005), An economic analysis of
the potential benefits and dis-benefits of faster payments
clearing, Office for Fair Trading, 2005.
MNB BulletiN • JaNuary 2013 23
iNtRODuCtiON
LIBOR and similar interbank reference rates were originally
created in the 1980s in order to facilitate the pricing of
syndicated dollar loans. Prior to that, US Treasury bill rates
had been used for pricing, but fluctuations in issued
quantities and risk appetite diverted the Treasury bill rates
from banks’ real costs of funds. Later, LIBOR, which
satisfied market needs to a high degree, and other
reference rates that followed the methodology of LIBOR,
gradually became increasingly popular. In 2011, the value of
contracts based on LIBOR was close to USD 270 trillion
(almost the quadruple of the total GDP of the world).
However, due to tight market liquidity, the setting of
interbank rates has been difficult since 2008, which may
hinder the precise pricing of loans and derivative contracts.
At the same time, in the summer of 2012, confidence in
interbank reference rates continued to decline due to the
manipulations of LIBOR and EURIBOR.3 All of this made it
necessary to review the international rate quotation
methodology and BUBOR, which is determined in line with
that.
Our analysis presents the role of LIBOR and BUBOR in
financial markets. We describe the reasons for and
consequences of the LIBOR affair, as well as the questions
and conclusions of international reviews formulated to
date. There is agreement among the domestic and
international professional audience that due to interbank
market constraints as well as the anomalies of quoting
procedures and the LIBOR affair, a review of the reference
rates is necessary, and the reforms following the
investigations will have to be implemented in an
internationally coordinated manner. In connection with
that, we summarise the LIBOR regulation proposals set out
in the Wheatley Review (2012b) and entering into effect in
2013, which relate to the designation of a new, independent
administrator and the introduction of quotes based on
transaction data in order to eliminate distortions stemming
from expert estimates. A further plan is a drastic reduction
of the number of LIBOR currencies and tenors.
The review of the BUBOR setting methodology started in
recent months, in parallel with the international reforms.
In terms of both monetary policy and financial stability, it
is of key importance that the BUBOR quotes remain
Szilárd erhart, imre ligeti and Zoltán Molnár: Reasons for the liBOR review and its effects on international interbank reference rate quotations
In 2012, news related the manipulation of LIBOR1 directed the attention of authorities and the general public to interbank
reference rates. International reviews made it clear that a reform of LIBOR and the numerous reference rates that follow
the methodology of LIBOR is necessary, because changes in reference rates influence the payment terms of thousands of
billions in loans and other financial agreements. Rapid and at the same time radical changes cannot be expected in the
short run, because preparation of the changes poses a regulatory challenge that requires complex, international
cooperation. In order to restore confidence, as of 2013 the British authorities intend to strengthen LIBOR by the introduction
of a statutory regulation, and they are also planning to designate a new, independent administrator and to drastically cut
the number of quotes. Overall, our study confirms the findings of earlier analyses prepared by the Magyar Nemzeti Bank,
according to which BUBOR2 shows the real market conditions as an average of longer periods, but at present its ability to
provide a short-term forecast of interest rate steps is limited.
1 LIBOR: London Interbank Offered Rate.2 BUBOR: Budapest Interbank Offered Rate, a forint-denominated Budapest interbank reference rate.3 EURIBOR: Euro Interbank Offered Rate, an interbank reference rate denominated in euro.

MAGYAR NEMZETI BANK
MNB BullETIN • JANuARY 201324
reliable indicators of interest rate conditions. Our current
study confirms the findings of earlier published analyses
prepared by the Magyar Nemzeti Bank, according to which
BUBOR quotes show the real market conditions as an
average of longer periods, but since 2009 their ability to
provide a short-term forecast of interest rate steps has
been limited.
tHe ROle AND QuOtAtiON MetHODOlOgy OF iNteRBANk ReFeReNCe RAteS
the role of liBOR and BuBOR in money markets and the economy
LIBOR, as a reference rate quoted for the leading currencies
of the world for various maturities, influences the pricing
of financial products amounting to approximately USD 300
trillion (300×1012) (Table 1). Within that, interest rate swaps
(IRS) account for a dominant share.
In Hungary, starting from the introduction of BUBOR in
1996, banks have essentially priced their corporate and
mortgage loans on the basis of BUBOR. According to the
MNB’s estimates, the majority of corporate forint loans,
which presently amount to HUF 2,700 billion, have variable
interest rates tied to BUBOR, while the share of such rates
in household forint loans,4 which amount to HUF 4,000
billion, is low, and has started to increase only recently.5 In
the past decade, BUBOR played an important role in
determining the contract terms and conditions of derivative
products (forward rate agreements, interest rate swaps
etc.) as well. While no highly reliable data on the BUBOR
exposure of domestic banks’ loans are available, based on
the central bank K14 statistics we have detailed data on the
interest rate swaps recorded off-balance-sheet. Of the
Chart 1Past, present and future of liBOR and interbank reference rates
…. 2012… 2008 2013 ….
PAST PRESENT FUTURE
…~1980
Birth of LIBOR
for pricing syndicated loans
instead of applying treasury
bill rates
„Golden years”
creating reference rates based on LIBOR principles and their becoming popular
Drying up ofinterbank markets
liquidity of underlyingmarkets decreases,
quotation is encumbered
LIBOR-scandal
beginning ofthe review
Reform of LIBOR/EURIBOR
and other reference rates
reforming the methodology,
transparency and regulation
4 Reference is made to BUBOR, inter alia, in Act CXII of 1996 on Credit Institutions and Financial Enterprises, Act LXXV of 2011 on the Fixing of Exchange Rates Used for Repayments of Foreign Exchange-denominated Mortgage Loans and the Administration of Forced Sales of Residential Property, Act IV of 2009 on Government Guarantee on Non-performing Home Purchase Mortgage Loans, Act CVI of 2007 on State-owned Assets, Government Decree No. 250/2000. (XII. 24.) on Special Provisions Regarding the Annual Reporting and Book-keeping Obligation of Credit Institutions and Financial Enterprises, Government Decree No. 215/2000. (XII. 11.) on the Special Provisions Regarding the Annual Reporting and Book-keeping Obligations of Investment Funds, Government Decree No. 251/2000. (XII. 24.) on the Special Provisions Regarding the Annual Reporting and Book-keeping Obligations of Investment Enterprises.
5 The above values are from the publication ‘MNB (2012)’.
table 1Value of contracts based on liBOR
(USD trillion)
instruments Value
Exchange-traded interest rate futues and options 30
Floating rate notes 3
Forward rate agreements (FRA) 28
Interest rate swaps (IRS) 198
Syndicated loans 10
Total 269
Source: Wheatley Review, 2012b.

MNB BulletiN • JaNuary 2013 25
REASONS FOR THE LIBOR REVIEW AND ITS EFFECTS ON INTERNATIONAL INTERBANK REFERENCE...
products based on BUBOR, FRA transactions,6 and within
that the 3-month ones tied to BUBOR, have the highest
turnover; in terms of the amount, however, interest rate
swaps (IRS) are determining.7
Interbank reference rates are of key importance for the
central bank, not only in terms of the pricing of financial
products but also as indicators of short-term interest rate
expectations. This is due to the fact that the initial step of
monetary policy intervention is the influencing of market
interest rate conditions and interest rate expectations.
(Regarding the role of BUBOR in measuring interest rate
expectations see the part entitled Market functioning
constraints and the impact of the LIBOR affair on interbank
reference rates below.)
Current international practices in the setting of reference rates
Starting from the 1980s, the appreciation of the London
market and LIBOR have been facilitated by both the position
of the London time zone between the major markets and
the development of the euro financial markets. Later,
interbank reference rates relying on the LIBOR methodology
were introduced in very many countries.
The most important features of interbank quotes: the term
of the interbank transaction they apply to, the institutions
whose quotes are used and the applied calculation
methodology. Another important aspect in comparing
quotes is whether the quote relates to the lending or
borrowing of interbank funds and whether there is an
obligation to contract in connection with the quotes.
LIBOR − by definition − gives the costs of funds of market
maker banks, whereas other interbank reference rates
provide information about the interest rates of interbank
deposits of market makers (see the box below). A further
difference is that in some countries the transactions between
the best, premium banks have to be taken into account (euro
area, Japan), whereas in other cases the transactions of the
market maker bank are taken into account.
6 FRA: forward rate agreement.7 An analysis by Kocsis et al. (2012) is expected to be published in the MNB Occasional Papers series in 2013.
table 2Domestic interest rate derivative turnover and contract sizes
(January 2009−September 2012)
FRA iRS CiRS
totalBuBOR
(3 month)BuBOR
(6 month)total
BuBOR (3 month)
BuBOR (6 month)
totalBuBOR
(3 month)BuBOR
(6 month)
Value of transactions (HUF Bn/year) 13,630 9,268 4,361 5,716 1,180 4,536 1,679 1,617 62
Number of transactions per year 900 540 360 1,475 150 1,325 161 157 4
Average value of a transaction (HUF Bn) 15 17 12 3.9 7.9 3.4 10.4 10.3 15.1
Average number of transactions per day 3.5 2 1.5 5.9 0.6 5.9 0.6 0.6 0.01
Total value (HUF Bn, 30 June 2012) 10,050 19,600 5,420
BuBOR (Hungarian Forex Association): the interest rate an interbank loan offered by the reporting agent.
euRiBOR (european Banking Federation): EURIBOR is the rate at which euro interbank term deposits are being offered within the
EMU zone by one prime bank to another at 11:00 a.m. Brussels time ("the best price between the best banks"). It is quoted for spot
value (two Target days) and on actual / 360 day basis.
liBOR (British Bankers’ Association): At what rate could you borrow funds, were you to do so by asking for and then accepting inter-
bank offers in a reasonable market size just prior to 11 am.
Definition of interbank interest rate quotations

MAGYAR NEMZETI BANK
MNB BullETIN • JANuARY 201326
MAtuRitieS: The banks of the contributor panel submit the
quotations for numerous maturities (15 maturities from O/N
to 12-month in the case of LIBOR/BUBOR/EURIBOR). In
some countries, however, the reference interest rates apply
only to fewer, 8−10 maturities of up to one year (Table 3).
During quoting, the most frequent maturities are the
1-week, 1-month, 3-month, 6-month, 9-month and 12-month
maturities, as the majority of the underlying financial
products (loans, derivatives etc.) are priced according to
these maturities. International surveys suggest that usually
the 3-month and 6-month maturities are the most important.
PANel BANkS: In setting the quotations, a large sample (of
8−45 banks) is usually taken, compared to the size of the
given market. Fundamentally, the banks are selected on the
basis of their market turnover. Quoting is always carried out
with the involvement of domestic banks. However, quotes
of foreign banks are also often taken into account.
Theoretically, a larger sample has better statistical
properties. However, due to the market concentration,
taking account of the quotes of inactive banks in the
calculation of the mean value is not necessarily
advantageous. The composition effect may greatly influence
the value of interbank reference rates − especially in the
interbank market, which becomes segmented in stress
situations. For example, during EURIBOR submission, market
makers have to give account of the pricing of premium
banks’ depositing, while non-premium banks, which face
higher credit risk premiums, constitute an increasing
portion of the euro area financial system. In the case of
LIBOR, submitting banks have to give account of their own
costs of funds. The definition of BUBOR is very similar to
that of EURIBOR, as in both cases it is the given market
maker’s offer rate for unsecured lending.
tRiMMiNg: Most quoting procedures ignore the extremely
low and high quotes during the setting of the interest rate
(trimming), which reduces the possibility of manipulation
and the pass-through of the volatility of individual banking
transactions. If the number of market makers is low, the
institution that coordinates the quoting also has less room
for manoeuvre to apply trimming. Therefore, in Sweden and
some Asian countries they calculate non-trimmed averages,
and the extent of the trimming depends on the number of
market makers.
ONSHORe AND OFFSHORe MARketS: In the case of LIBOR,
in addition to the domestic currency, quotes for foreign
currencies are also published. In the cases of the euro, the
Japanese yen and the Swedish crown, domestic as well as
foreign quotes exist, with different market makers. In
certain countries, the offshore London market has even
become more important. For example, the operational
interest rate target of the Swiss National Bank (SNB) refers
to the LIBOR CHF interest rate quotations. An advantage of
the offshore market may be that it is less exposed to
regulations (capital constraint, minimum reserve, etc.), and
it is easier to leave or enter (Gyntelberg and Wooldridge,
2008).
CONtRACtiNg OBligAtiON: Considering that the quoting
is not based on real market transactions, certain regulations
impose a contracting obligation on the partners. Pursuant
to the quotation rules of the Polish (WIBOR) and Romanian
(ROBOR) reference rates, the quoting obligation amounts to
HUF 120−2,100 million (WIBOR: PLN 5−30 million; ROBOR:
RON 2−5 million). The amount of the quoting obligation
declines as a function of the tenor.
QuOtiNg DiReCtiON: Quotes in the case of certain
reference rates indicate how much it would cost the given
bank to borrow (LIBOR), whereas in other countries they
show the price of its lending (BUBOR, CIBOR,8 EURIBOR and
NIBOR9). The Czech, Polish and Romanian reference rates
are quoted in both directions (borrowing and lending rates),
and the Polish and Romanian Central Banks require a 20−75
basis point maturity-dependent maximum spread as well.
ReFeReNCe: Market participants’ choices in certain cases
may show how liquid they consider individual segments of
the money market to be. In the case of IRS products, for the
largest currencies the interbank quotes mean the reference
rate. At the same time, this role is played by other interest
rates in the Asian and Pacific region, the expected interest
rate of bank bills in Australia, the implied interest rate of
FX swaps in the Philippines, Singapore and Thailand, while
in China the reference is the interest rate of repurchase
agreements (Gyntelberg and Wooldridge, 2008).
Chart 2 depicts the four main stakeholders of the quoting
of reference rates and its six-step process. Stakeholders in
the quoting are (I) the issuer of the reference rate (the
Hungarian Forex Association (MFT) in the case of BUBOR),
(II) the members of the contributor panel, (III) the institution
that carries out the calculation and the publication (the
MNB in the case of BUBOR) and (IV) the users of the
reference rate (financial market participants, households
and corporations that rely on the reference rates upon
elaborating the conditions of financial contracts). The
issuer is responsible for the development of the methodology
8 CIBOR stands for Copenhagen Interbank Offered Rate, i.e. the Copenhagen interbank reference rate denominated in Danish crowns.9 NIBOR stands for Norway Interbank Offered Rate, i.e. the Norwegian interbank reference rate denominated in Norwegian crowns.

MNB BulletiN • JaNuary 2013 27
REASONS FOR THE LIBOR REVIEW AND ITS EFFECTS ON INTERNATIONAL INTERBANK REFERENCE...
(step 1) as well as for the selection of the contributor panel
and the institution that does the calculation and the
publication (steps 2 and 3). The market makers are
responsible for the submission of the interbank interest rate
quotes that comply with the regulation (step 4), while the
institution that performs the calculation is responsible for
the completion of the necessary calculations and the formal
control of the quotations (step 5) as well as for the
publication of the reference rate (step 6). In international
practice, the work of the contributor panel as well as the
work of the issuing institution and the calculating institution
are usually unofficially regulated. In Hungary, the regulation
prepared by the MFT, which works as an NGO, contains the
rules of procedure. However, in the opinion of the European
Securities and Markets Authority (ESMA), it may be necessary
to regulate the process of quoting in provisions of law −
table 3interbank interest rate quotes in international comparison
instrument BuBOR liBOR PRiBOR euRiBOR WiBOR ROBOR CiBOR NiBOR StiBOR tiBOR
Country HungaryUnited
KingdomCzech
RepublicEurozone Poland Romania Denmark Norway Sweden Japan
Currency HUF
10 currencies (JPy, USD, GBP, EUR, CHF, CAD, AUD, NZD, DKK, SEK)
CZK EUR PLN RON DKK NOK SEK JPy
Size of panel (Sep. 2012)
16
8-16 (depends on the
currency)
8 44 13 9 6 6 16
Type quotation quotation quotation quotation
quotation can be traans- acted
(between 5 and 30 PLN
million depending
on the maturity)
quotation can be traans- acted
(between 2 and 5 RON
million)
quotation quotation quotation** quotation
Number of maturities
15 15 9 15 9 8 14 10 8 13
Key maturity*
3 month 3 month 6 month 6 month 6 month 3 month 3 month
Trimming~ Lower / Upper 25%
~ Lower / Upper 25%
depends on the numer of quoters
Lower / Upper 15%
~ Lower / Upper 25%
−
Lower / Upper 15%, average if number of quoters is
less than 11
Lower / Upper 25%, average if number of quoters is less than 5
if difference between maximum and mini-mum is
more than 25 bp
Lower / Upper 12,5%
IRS reference rate
yesdepends on
the currency
yes yes yes yes yes
no (reference rate is JPy
LIBOR)
Sanctionsdisqualifi-
cationdisqualifi-
cationdisqualifi-
cationdisqualifi-
cationdisqualifi-
cationdisqualifi-
cation
the case is proposed
to the bank association
Lending or borrowing
lending borrowingborrowing/
lending
lending (among
premium banks)
borrowing/lending
(spread is maximised)
borrowing/lending
(spread is maximised)
lending lending lending
transaction between premium
banks
* Based on Gyntelberg and Wooldridge (2008).** Quoting obligation was in force until 29 October 2008 (SEK 500 million up to 6-month maturity; SEK 100 million for maturities of 9–12 months).Sources: Banking associations, central banks, BIS.

MAGYAR NEMZETI BANK
MNB BullETIN • JANuARY 201328
reacting to the criticism expressed in connection with the
LIBOR affair.
MARket FuNCtiONiNg CONStRAiNtS AND tHe iMPACt OF tHe liBOR AFFAiR ON iNteRBANk ReFeReNCe RAteS
In an optimal situation, in addition to the expected central
bank interest rate path, reference rates similar to BUBOR/
LIBOR are also influenced by other factors that arise during
interbank market transactions (counterparties’ credit risk,
liquidity and term premiums) and by the quotation
procedure10 (rate-setting methodology, transparency, etc.).
At the same time, the bias-free setting of LIBOR/BUBOR is
hindered by several factors in the procedure:
− limited market liquidity and mobility between markets,
− manipulations, LIBOR affair.
Market liquidity and mobility between markets are limited
Especially since the 2008 crisis, the liquidity of interbank
markets relevant in terms of the setting of BUBOR/LIBOR
has been concentrated on maturities shorter than 1 month11
(Table 4). In the 2008−2009 stress period, the intermediate
role of interbank markets was taken over by central banks
by changing their liquidity management instruments, and
although the functioning of markets has been re-established,
the role of central bank liquidity management instruments
has remained more important compared to the pre-crisis
period. The preparation of quotations has also become
more difficult by the fact that passage between markets
has become more hindered. As a result, ‘expert estimates’
have become increasingly important in the preparation of
quotations, especially in the case of maturities longer than
1–2 months, and the risk of distortion of the reference rate
has increased considerably. All of this limits the reference
rates in meeting market needs, because the related
financial pricing activity is tied to the 3−6-month maturity.
Chart 2Stakeholders and flow chart of quoting
II. REFERENCE-RATE PANEL
III. Calculatingand publishingagent (MNB)
IV. Users of reference ratesfinancial market participants, enterprises, households
(pricing credits, pricing derivatives, financial contracts, estimating interest rate exceptations)
3
2 45
6
Regulated entities
Non-regulated process
Non-regulated entities and
processes
Regulated entities and markets
Reporting bank Reporting bank Reporting bank Reporting bank
I. Reference-rate issuer (BBA − UK, Hungarian Forex
Association − HU)
− definition of calculation method, constructing regulation and procedure (1)− selection of panel participants (2)− appointment of calculating and publishing agent (3)
− collection of data (4)− verification of data, asking for modification if necessary (5)− calculation of reference rate− publication of reference rate (6)
Source: ESMA.
10 The quotation procedure is described in detail in the previous section.11 In Hungary, overnight transactions dominate, 99 per cent of which are shorter than 2 weeks.

MNB BulletiN • JaNuary 2013 29
REASONS FOR THE LIBOR REVIEW AND ITS EFFECTS ON INTERNATIONAL INTERBANK REFERENCE...
Manipulations, liBOR affair
Interest rate quotations were especially unfavourably
affected by the eruption of the scandal related to LIBOR
and EURIBOR quotes in the summer of 2012. The British
Financial Services Authority (FSA) fined Barclays Bank
because it breached several Principles for Businesses of the
former:
1. taking account of derivative positions: during setting its
quotations, the Barclays took into consideration the
revaluation of derivative positions in the period between
early 2005 and mid-2008;12
2. fear of stigma, distorting the quotes in order to
improve the reputation of the bank: as the LIBOR
quotes are based on the costs of funds of the market
maker bank (see the definition of LIBOR in the previous
section), in the crisis situations between September 2007
and May 2009 Barclays attempted to paint a better
picture of its credit risk than the real one by reporting
lower borrowing costs than the actual costs (this risk
does not exist in the case of EURIBOR and BUBOR,
because banks report the interest rates of the loans they
extend and not of their costs of obtaining funds);
3. intention to influence the pricing of other market
makers: the misdemeanour of abuse was exacerbated by
the fact that the bank instigated other market makers as
well to behave unethically;
4. lack of risk management controls: according to the
findings of the FSA, Barclays did not have effective risk
management controls upon setting LIBOR and EURIBOR.
tHe FiRSt StePS OF tHe ReVieW OF ReFeReNCe RAteS
There is agreement among the domestic and international
professional audience that, due to the anomalies of
interbank market constraints and quoting procedures as
well as the LIBOR affair, a review of the reference rates is
necessary, and that the reforms following the investigations
will have to be implemented in an internationally
coordinated manner. The primary objectives are to
eliminate the possibility of manipulation and to increase the
transparency and accountability of the process in order to
restore confidence in interbank interest rate quotes.
Of the international investigations conducted to date, the
Wheatley Review concerning the LIBOR affair is summarised
and the first steps of the BUBOR review are described
below. Further reviews were initiated by the European
Commission, the European Banking Authority (EBA), the
European Securities and Markets Authority (ESMA) and the
Bank for International Settlements (BIS). No information on
the findings of these ongoing reviews has been published to
date, but the objective of the reviews is basically similar to
that of the LIBOR review; they raised the issues of the
functions and methodology of reference rates as well as
supervisory and regulatory issues related to them.
table 4transactions underlying liBOR and BuBOR in 2011
O/N1
week2
week1
month2
month3
month4
month5
month6
month7
month8
month9
month10
month11
month12
month
USD
GBP
EUR
JPy
CHF
CAD
AUD
NZD
SEK
DKK
BUBOR (HUF)
low activity
moderate-low activity
moderate activity
high activity
Source: Wheatley Review, The (2012b), MNB.
12 In December 2011, the Citigroup and UBS were condemned for similar reasons by the financial supervisory authority in Japan. In their case, the punishment was less severe; they were only excluded from quoting for 1 and 2 weeks, respectively.

MAGYAR NEMZETI BANK
MNB BullETIN • JANuARY 201330
the Wheatley Review
The draft of the Wheatley Review aiming at the independent
review and reform of the LIBOR quoting system was made
available for public consultation in August 2012 (Wheatley
Review, 2012a), in order to assess the money market role of
LIBOR, explore the deficiencies of the current quoting
system and identify alternative reference rates that are
suitable for replacing LIBOR. The public consultation
conducted with the involvement of the market makers and
those concerned by the quotes was closed on 7 September,
and the final report (Wheatley Review, 2012b) on the
findings of the review was published on 28 September; it
also defined a 10-point reform plan (see below).
An important conclusion of the review was that a
comprehensive reform of LIBOR is necessary. However,
LIBOR cannot be replaced in the near term or it would
entail considerable financial stability risks.
Those who expressed their opinions during the consultation
clearly argued for the continuation of LIBOR quotes,
referring to the legal challenges of a change,13 to the
international coordination difficulties stemming from the
global role of LIBOR and to the lack of an alternative. In the
future, the writers of the Wheatley Review intend to base
LIBOR more on transaction data instead of expert
judgement. However, there are clear market constraints to
it over the short run.
the 10-point liBOR reform plan of the Wheatley Review
1. introduction of statutory regulation for mandatory
submission, the selection of the persons of market
makers (Approved Persons), civil and criminal sanctions
as well as the provision of credible and independent
supervision in the British Financial Services and Markets
Act (2000) − as of 2013, if approved by the British
legislator.
2. Selection of a new administrator instead of the British
Bankers’ Association (BBA)14 to issue the reference
rate; it would be responsible for compiling and distributing
the rate as well as for providing oversight. The new
entity should be selected through a tender process to be
run by an independent committee designated by the
regulatory authorities.
3. In order to ensure transparency and non-discriminatory
access to the benchmark, the new administrator is
responsible for the surveillance, review, statistical
examination and periodic monitoring of submissions so
that LIBOR can meet market needs effectively and
credibly.
4. expectation concerning the use of transaction data in
line with the submission guidelines of the Wheatley
Review presented below. Based on their interbank
experiences, submitters have to determine the
submissions based upon the following hierarchy, primarily
relying on transaction data:
• contributing banks’ transactions in
− the unsecured interbank deposit market;
− other unsecured deposit markets (CD, CP);
− other markets (OIS, repurchase agreements, FX
forwards, interest rate futures and options and
central bank operations);
• contributing banks’ observations of third-party
transactions in the same markets;
• quotes by third parties offered to contributing banks
in the same markets;
• expert judgement, in the absence of transaction
data.
5. the new administrator is obliged to introduce a new
code of conduct, which includes guidelines for the use
of transaction data, systems and controls for submitting
firms, transaction record keeping responsibilities
(submitting firm’s name, communication with other
partners, transaction data) and a requirement for regular
external audit of submitting firms.
6. Suspension of tenors and currencies. The BBA is
obliged to cease the compilation and publication of
LIBOR for those tenors and currencies for which there are
insufficient trade data. The changes must be implemented
within 1 year. The Wheatley Review recommends the
discontinuation of the AUD, CAD, DKK, NZD and SEK
quotations as well as of the publication of LIBOR for the
4-, 5-, 7-, 8-, 10- and 11-month tenors. Continued
publication of 1- and 2-week as well as 2- and 9-month
13 Changing the reference rate, which is widely used in private law contracts as well, is difficult.14 British Bankers’ Association, the organisation currently responsible for LIBOR quotations.

MNB BulletiN • JaNuary 2013 31
REASONS FOR THE LIBOR REVIEW AND ITS EFFECTS ON INTERNATIONAL INTERBANK REFERENCE...
tenors would be re-considered. As a result, the number
of LIBOR benchmarks published daily could be reduced
from 150 to 20. Immediate consultation with the
submitters on the issues of implementation should be
launched.
7. Publication of individual liBOR submissions after 3
months, to reduce the risks stemming from the stigma
effect of quotations. (The stigma effect is described in
the chapter entitled Current international practice in the
setting of reference rates of this article.)
8. increasing the number of submitters, if necessary
through new powers of regulatory compulsion as well, in
order to increase the representative character of the
contributor panel.
9. encouragement of liBOR users to examine − in view of
their economic objectives − whether LIBOR is the most
appropriate benchmark in the given legal relationship or
the use of alternative reference rates would be justified,
and whether they should prepare for a possible ceasing
of LIBOR quotations.
10. Consultation with european and international
authorities. UK authorities should discuss the future of
LIBOR as an international benchmark and the principles
for effective global benchmarks in close cooperation
with international institutions.
Questions of introducing alternative reference rates
The draft of the Wheatley Review contained a detailed list
of the requirements that reference rates must meet
(representativeness, coverage of the short end of the yield
curve, being up-to-date, credit risk, standardisation, deep
and liquid markets, long time series, interest in participation,
etc.). Of the possible market segments suitable for producing
an alternative reference rate (unsecured lending, treasury
bills, repurchase agreements, interest rate on central bank
instruments, CDs and CPs), in the draft of the Review
mainly treasury bills and OIS (overnight indexed swap)
markets were considered to be market segments that may
serve as possible alternatives to the unsecured interbank
market.
During the consultation, the OIS market15 was considered a
possible reference rate by most of the participants. Credit
risk is much lower in the case of OIS transactions, thus
interest rate quotes are lower. At the same time, for the
pricing of interest rate derivative contracts, which are
perhaps the most important of the financial contracts that
refer to LIBOR, the reference rate does not need to contain
the credit risk as well. In connection with this, it is worth
to call attention to the amendments carried out in Denmark
in September 2012: namely, for the pricing of mortgage
loans the authorities recommended the use of an OIS type
reference rate (CITA) instead of the interbank reference
rate (CIBOR). In Denmark, the supervisory inspections in
September 2012 excluded the possibility of manipulation,
but at the same time they found it a serious deficiency that
market quotations are not adequately confirmed due to
lack of concrete transactions. The role of market maker will
be taken over from the Danish Bankers Association by the
Danish Financial Supervisory Authority, if the regulatory
proposal receives the green light. In Denmark, there are
actual transaction data behind the CITA, as opposed to the
HUFONIA OIS swap, which is based on quotations.
First steps of the revision of BuBOR
thematic investigation launched by the HFSA in September focuses on internal controls and BuBOR exposure
Reacting to the criticism related to the LIBOR quotations,
the HFSA launched a thematic investigation of the BUBOR
quotations on 10 September 2012. The thematic investigation
is expected to take a few months.
BuBOR follows real market conditions, but does not forecast short-term central bank interest rate steps
Several empirical central bank analyses have been prepared
on the BUBOR quotations in recent years. In 2009, at the
Money Market Consultative Forum the MNB discussed its
analysis related to the developments in the liquidity of
interbank forint markets and in the information content of
interbank reference rates with the liquidity managers of
commercial banks. The analysis covered the turnover of
various market segments and the comparison of their
yields. In addition, due to the effects perceived in
connection with BUBOR, the MNB also raised the possibility
of a transacting obligation. (The discussion material for the
Consultative Forum is available in Kuruc and Pintér, 2009;
the minutes of the Forum are available in MNB, 2009.)
15 Detailed analysis of the international trends of OIS markets and of the forint-denominated HUFONIA swap market is provided in the study by Erhart and Kollarik (2011).

MAGYAR NEMZETI BANK
MNB BullETIN • JANuARY 201332
The article by Pintér and Pulai (2009) published in the MNB
Bulletin compared the BUBOR quotations to other market
yields, government securities market, swap and analyst
expectations in relation to the quantification of market
interest rate expectations. The analysis concluded that the
result of the limited information content of BUBOR is that
the yield curve estimated from the yield of interbank
market instruments provides a more precise picture of
expectations if the data of the BUBOR quotations are not
used.
In addition to being strongly embedded in the pricing of
financial products, BUBOR plays a key role in terms of
market interest rate expectations as well. Therefore, the
reliability of the quotation procedure of BUBOR and through
that the undistortedness of the information content of
BUBOR are important issues for the MNB in formulating the
monetary policy as well.
Due to the peculiarities of domestic money market
instruments,16 the use of BUBOR and the interest rate
derivatives based on it has become the most accepted in the
central bank practice of capturing short-term market interest
rate expectations. Until December 2008, in addition to the
effect of the counterparty and liquidity risk premium, BUBOR
did contain market participants’ expectation regarding the
central bank base rate. During the cycle of interest rate cuts
between 2004 and 2006, amid strong volatility, the spread
between the 3-month BUBOR and the current base rate
stayed in the negative domain, which was a good indicator of
the expectation of a cycle of easing. Similarly, in the period
of tightening that started in mid-2006 and during the
preceding nearly three-quarter period of maintaining the
base rate also mostly the expectations influenced interbank
lending rates; this is shown by the strongly fluctuating
positive BUBOR–base rate spread (Chart 3).
This period ended around the extraordinary interest rate
increase that took place in the autumn of 2008, and as a
result of the crisis − as well as the decline in liquidity and
the elevated counterparty risk − the reliability of BUBOR in
terms of short-term interest rate expectations declined
considerably. Due to lack of a benchmark, submittals
indicated participants’ expectations to a decreasing degree.
Following the turbulent period, BUBOR actually followed
the changes in the base rate; the fluctuation in the BUBOR–
base rate difference observed earlier shrank to a minimum.
The disappearance of the interest rate expectations
contained in BUBOR is spectacularly illustrated by the fact
that starting from mid-2010 the spread between BUBOR and
the base rate became practically smooth; the constant
minimum difference can be considered a kind of stuck
liquidity risk (Chart 3, first green band).
The correlation observed since 2009 changed temporarily
at end-2011, when BUBOR departed from the base rate in a
spectacular manner. This period coincided with the cycle of
interest rate hikes that started in early December; the
elevated level of the BUBOR–base rate difference remained
in place following the January maintenance as well (Chart
3, red and second green band). All of this showed that the
information content of BUBOR had changed compared to
the period that had lasted since 2009.
Following the two interest rate hikes of 50 basis points each
and the turbulence in early January 2012, the 3-month
BUBOR declined gradually, until finally the BUBOR–base rate
difference became stable around 20–25 basis points at the
beginning of April. This difference can rather be interpreted
as a liquidity premium that consolidated at a higher than
earlier level than the pricing of a new interest rate hike, as
in this period other money market instruments (FRA,
discount treasury bill) did not indicate any expected change
in the interest rate environment.
The latest ‘test’ of the interest rate expectation information
contained in BUBOR was around the time of the August and
September interest rate cuts, when at the end of the
summer the participants of the FRA market started to price
monetary easing for the second half of the year, and the
16 In the discount treasury bill yields, the sovereign risk premium and the market liquidity premium hinder the reliable determination of interest rate expectations, while the OIS market is a relatively fresh segment in Hungary and trading therein cannot be considered active.
Chart 3Changes in the base rate and related financial market variables
−1
0
1
2
3
4
5
6
0
2
4
6
8
10
12
14
1 Ja
n. 0
41
Apr
. 04
1 Ju
ly 0
41
Oct
. 04
1 Ja
n. 0
51
Apr
. 05
1 Ju
ly 0
51
Oct
. 05
1 Ja
n. 0
61
Apr
. 06
1 Ju
ly 0
61
Oct
. 06
1 Ja
n. 0
71
Apr
. 07
1 Ju
ly 0
71
Oct
. 07
1 Ja
n. 0
81
Apr
. 08
1 Ju
ly 0
81
Oct
. 08
1 Ja
n. 0
91
Apr
. 09
1 Ju
ly 0
91
Oct
. 09
1 Ja
n. 1
01
Apr
. 10
1 Ju
ly 1
01
Oct
. 10
1 Ja
n. 1
11
Apr
. 11
1 Ju
ly 1
11
Oct
. 11
1 Ja
n. 1
21
Apr
. 12
1 Ju
ly 1
21
Oct
. 12
BUBOR − base rate difference (right-hand scale)Base rate3 month BUBOR1x4 FRA
Per cent Percentage point

MNB BulletiN • JaNuary 2013 33
REASONS FOR THE LIBOR REVIEW AND ITS EFFECTS ON INTERNATIONAL INTERBANK REFERENCE...
number of those who expected a cut increased among
analysts as well. By contrast, practically no interest rate cut
expectation was shown in BUBOR. BUBOR reacted to the
interest rate cuts in August and September by immediate
changes each time, as had been seen in the period between
2009 and 2011 (first green band). This is well illustrated by
the fact that there was only a minimum change in the
BUBOR–base rate difference, and it continued to include the
constant premium.
Overall, BUBOR in itself still cannot be considered a suitable
short-term market interest rate expectation indicator, and
in recent months its behaviour has been similar to that
between 2009 and 2011. Against this background, the
extremely moderate decline in interest rate fixing makes it
somewhat more difficult to interpret the FRA based on the
reference rate, as it is not excluded that the declining
quotations also reflect the interest rate expectations to a
certain extent. It is also not excluded that this rather
reflects an easing of the liquidity tension of the interbank
market.
Quantitative analysis of the different BUBOR quoting
practices of the two long periods presented above
(preceding and following the 2008 global money market
turbulence) also leads to a similar conclusion. The time
series of the 3-month BUBOR shows strongly autoregressive
properties; accordingly, an AR(1)17 process captures the
changes in the level of the reference rate well. If the one-
day lag of the change in the level of the central bank base
rate is also included in the OLS18 regression, it can well be
seen that in the period before October 2008 the variable
takes a much lower coefficient than in the still ongoing
period following the Lehman bankruptcy. All of this shows
that in the pre-crisis period actual interest rate decisions
had a much lower effect on the level of BUBOR than as of
November 2008, i.e. the 3-month BUBOR priced the
expected interest rate steps to a greater extent. In Chart 3,
in the hatched green periods, the extent of BUBOR fixing
typically changed gradually on the basis of the interest rate
decisions, i.e. the expectation effect was much less
dominant (as indicated by the 0.77 coefficient of the
interest rate step in Table 5).
Overall, our current study confirms the findings of earlier
published analyses prepared by the Magyar Nemzeti Bank,
according to which BUBOR quotations show the real market
conditions as an average of longer periods. However, since
2009 − in the period of central bank rate cuts and hikes −
their ability to provide a short-term forecast of interest rate
steps has been limited.
ReFeReNCeS
euroPean coMMission (2012), Consultation Document on the
Regulation of Indices, 5 September 2012, URL.
erHart, szilárD anD anDrás kollarik (2011), “The launch of
HUFONIA and the related international experience of
overnight indexed swap (OIS) markets”, MNB Bulletin, April,
URL.
GyntelberG, J. anD woolDriDGe, P. D. (2008), “Interbank Rate
Fixings during the Recent Turmoil”, Quarterly Review,
March, BIS, URL.
HorvátH, cs., J. krekó anD a. naszóDi (2004), “Interest rate
pass-through: the case of Hungary”. MNB Working Paper,
2004/8. URL.
kocsis zalán, csávás csaba, Mák istván anD Pulai GyörGy (2012),
Kamatderivatíva piacok Magyarországon 2009 és 2012
között a K14-es adatszolgáltatás tükrében, [Interest rate
derivative markets in Hungary between 2009 and 2012 in
table 5Result of the OlS regression for the level of the 3-month BuBOR, where the explanatory variables are the first-order lag value of BuBOR and the also first-order lag of the change in the interest rate level
Sample period
Dependent variable explanatory variables estimation statistics
BuBOR (3 month)
BuBOR (3 month) (1st lagged)
interest rate step Modified R 2 F statistics
November 2004− October 2008
Coefficient 0.996 0.1110.998 0.00
P value 0.000 0.000
November 2008−October 2012
Coefficient 0.998 0.7700.999 0.00
P value 0.000 0.000
17 The AR(1) is an autoregressive process, where the time series is explained with its previous day value. In this case, Xt = c + λXt−1 + εt, where Xt is the tth observation, λ is the related coefficient, c is constant, εt is the error term of the equation.
18 The OLS (Ordinary Least-Squares Regression) is a linear regression method in which the sum of the squares of the error terms is minimised.

MAGYAR NEMZETI BANK
MNB BullETIN • JANuARY 201334
the light of the K14 data reporting], manuscript, Magyar
Nemzeti Bank.
kuruc eMese anD Pintér klára (2009), A bankközi forintpiacok
likviditásának és a bankközi referenciakamatok
információtartalmának alakulása, [Developments in the
liquidity of interbank forint markets and in the information
content of interbank reference rates], Pénzpiaci Konzultatív
Fórum, 2009. október 1., URL.
MaGyar Forex társasáG (2012), Hivatalos BUBOR szabályzat,
[Official BUBOR Regulation], 2012. dec. 1., URL.
MaGyar neMzeti bank (2009), Emlékeztető a Magyar Nemzeti
Bank Pénzpiaci Konzultatíc Fórumáról, [Reminder on the
Money Market Consultative Forum of the Magyar Nemzeti
Bank], URL.
MaGyar neMzeti bank (2012), Report on Financial Stability,
November, URL.
Mutkin, l. anD e. lin (2012), What Future for Libor?, Morgan
Stanley Research, London, URL.
Pintér, k. anD Gy. Pulai (2009), “Measuring interest rate
expectations from market yields: topical issues”, MNB
Bulletin, July, URL.
wHeatley review, tHe (2012a), The Wheately Review of
LIBOR: Initial Discussion Paper, August, URL.
wHeatley review, tHe (2012b), The Wheatley Review of
LIBOR: Final Report, September, URL.

MNB BulletiN • JaNuary 2013 35
INTRODUCTION
These days, the central banks of developed countries and
of a number of emerging countries set the maintenance of
price stability as their primary objective. According to
modern economic theory, monetary policy can most
efficiently contribute to increasing welfare by ensuring the
predictability of the economic environment, maintaining
price stability and the stability of the financial system.
Numerous central banks have chosen so-called flexible
inflation targeting as the framework for this. Inflation
targeting (IT) is a monetary policy strategy whereby the
central bank strives to achieve its primary objective of
price stability through a publicly announced inflation
target. Under this regime, the central bank strives also to
decrease economic volatility arising from different sources
and reducing social welfare, exploiting the fact that
inflation targeting provides it with a sufficiently flexible
strategy. This is one of the reasons that at the international
level IT has proven successful in curbing high inflation and
anchoring expectations.1
The maintenance of price stability is hindered by shocks to
the economy, which may divert inflation from the desirable
level. The response of monetary policy depends on the
causes underlying the change in inflation; consequently, the
nature of the shock and the credibility of the commitment
of the central bank to price stability need to be taken into
consideration. If the shock has opposite effects on inflation
and output (a so-called supply shock), then the short-term
inflationary effect of the shock may be offset only at the
cost of significant real economic sacrifices, and central
banks try to achieve price stability in the medium term in
such cases. If monetary policy is credible, the central bank
has more leeway to refrain from offsetting swings which are
considered to be temporary, because economic agents
believe in the commitment of the central bank and expect
inflation to subside later. Consequently, the temporary
spike does not have any long-term effect on the pricing
decisions of businesses. If, however, the expectations of
economic agents are not completely rational or the inflation
target of the central bank is not credible, there is a risk that
agents will consider the additional inflation attributable to
the one-off shock to be persistent and future inflation to be
higher in the long term as well. In this case, the effect of
the tax hike may also be present in the form of higher
wages and expectations. This latter, indirect process is
called the second-round effect. The second-round effect
Dániel Felcser: How should the central bank react to the VAT increase?
With a VAT increase, prices go up in the economy as businesses pass through the effects of the tax rise. Technically, this
means that the consumer price index increases for one year; this is called the first-round effect. If, however, the
expectations of economic agents are not completely rational or the inflation target of the central bank is not credible,
there is a risk that agents will consider the additional inflation attributable to the VAT hike to be persistent and future
inflation to remain higher than it was before the VAT rise in the long term. In this case, the effect of the tax hike may
also be present in the form of higher wages and expectations. This latter, indirect process is called the second-round
effect. According to the international best practice of central banks, monetary policy disregards the one-off price level
increasing shocks, but attempts to offset second-round effects on inflation. However, in countries where the inflation
target had not been met before the VAT rise, central banks are more inclined to also react to direct price level increasing
measures, and risks relating to the anchoring of expectations are highly articulated in the communication of the central
bank. As inflation in Hungary has persistently been above the target, there is a possibility that the recurring cost shocks
may become incorporated into inflation expectations and may cause stronger second-round effects.
1 Inflation targeting had typically been a regime for small, open economies. However, early in 2012 two central banks of global significance, the Federal Reserve Bank of the U.S. and the Bank of Japan took additional steps towards inflation targeting (for more details, see Felcser and Lehmann, 2012).

MAGYAR NEMZETI BANK
MNB BullETIN • JANuARY 201336
may lead to a persistently higher inflation, which, all else
being equal, may require a firmer monetary policy response.
A change in the rate of the value added tax (VAT), an
indirect tax, can be considered as a special supply shock
where the source, the timing and the initial size of the
shock (the change in the tax rate) are easy to identify.2 With
a VAT raise, the price level increases in the economy as
businesses pass through the effects of the tax rise, but as
VAT is a consumption tax, it does not typically result in any
additional effect through the cost structure of businesses.3
Technically, this means that the consumer price index
increases for one year; this is called the first-round effect,
while in 12 months’ time the one-off price level increasing
effect drops out of the annual price index. In the case of a
one-off tax measure, the risk of a second-round effect may
be lower than in the case of typical cost shocks (e.g. oil
price increases). Therefore, if monetary policy is credible,
the central bank can typically dispense with offsetting the
inflationary effect of a VAT increase. If, however, the
consumption tax rates are changed frequently, the
aforementioned second-round effect is more likely to
appear, which may require a monetary policy response.
In the following, we use various scenarios to present the
potential effects of a VAT rate increase, and then go on to
survey international experiences. Finally, we discuss the
characteristics of the current Hungarian situation.
THE GOOD, THE BAD AND THE UGLY
The VAT increase may cause the price index to rise
significantly while the inflation rate adjusted for the direct
effect of the tax change remains moderate, which poses a
challenge to the central bank both from a monetary policy
and communication standpoint. As mentioned earlier, the
monetary response essentially depends on the inflationary
effects of the VAT increase. To illustrate this point, we first
present two cases in the one-off VAT increase scenario,
depending on whether the shock has any second-round
effect. In our example, the VAT rise caused a close to two
percentage point increase in inflation in the initial period,
as the effect of the tax change is immediately built into
prices (Chart 1).4 We assume that before the VAT shock the
inflation target of the central bank had been met and no
other inflation shock is affecting the economy, that is, the
central bank faces only the inflationary effects of the VAT
hike. Then we examine what additional risks arise if the
economy is subjected to a series of shocks, instead of a
one-off occurrence.
In the first case, the VAT increase has only first-round effect:
the prices of the products affected rise and remain at the
higher level persistently, while inflation falls to the inflation
target of the central bank after a year, provided that
expectations are anchored, as soon as the effect of the tax
increase drops out of the annual price index. Economic
agents consider the deviation of inflation from the target to
be temporary and align their pricing and wage decisions to
the medium-term target. Central banks do not tend to offset
Chart 1Inflation scenarios after a VAT increase
(YoY indices)
0
1
2
3
4
5
6
0 1 2 3 4 5 6 7 8 9 10 11 12 13 14 15 16 17 18 19 20 21 22 23 24
Per cent
month
First-round effectFirst- and second-round effectsSeries of shocks
2 Other price shocks may also result from government measures, but in this article we concentrate on VAT increases due to their aforementioned features and because of the fact that inflation targeting central banks (IT central banks) examined typically refer to this factor in their communication.
3 Increases of the rates of taxes on consumption directly increase the price of the part of the consumer basket subject to the tax change and they may also indirectly affect consumer prices (for instance, through their effect on aggregate demand). Thus, when households bring forward some of their consumption before a VAT hike to make use of the lower tax rate, the one-off increase in demand may also result in higher price levels. We should note that according to the results Gábriel and Reiff (2006) obtained for Hungary, the effects of VAT increase and VAT decrease are not symmetrical. We concentrate on VAT increases in the following.
4 In the example we disregard the possibility that businesses may incorporate the VAT increase in their prices in advance, in the period between the announcement and implementation of the VAT increase depending, inter alia, on the cost of the price change and the level of competition on the market. This happened at the time of the VAT hikes of 2007 and 2012 in the Czech Republic when, according to the Czech central bank, more than half of the short-term effects appeared in prices in the 2−3 months preceding the tax rise (CNB, 2012). In respect of Hungary, a previous study found no signs of that happening (Gábriel and Reiff, 2006). Furthermore, the short-term effect of the VAT increase may actually exceed the longer-term increase in the price level as shops may implement some price increases originally proposed for later simultaneously with the price rise caused by the VAT hike.

MNB BulletiN • JaNuary 2013 37
HOW SHOULd THE CENTRAL BANk REACT TO THE VAT INCREASE?
such temporary inflation shocks. An argument for this
approach is the temporary nature of the direct inflationary
effect of the shock: by the time the monetary policy measure
could have an effect, the shock has already unwound, while
monetary tightening would raise the risk of undershooting the
inflation target. An argument against this approach is the
possibility that − as a result of the higher-than-targeted
inflation − the anchoring of expectations may weaken and
second-round effects may emerge after a while. That is, the
stronger the medium-term anchoring of expectations and the
credibility of monetary policy is assumed to be, the more the
central bank can afford to forego offsetting the primary
inflationary effect of the shock.
In the second, less favourable scenario, the one-off price
increase is accompanied by second-round effects. While the
central bank may decide not to offset the direct effects of
the VAT shock on inflation, the presence of second-round
effects may necessitate monetary policy action. The
second-round effect is closely related to the inflation
expectations of economic agents. If businesses expect
inflation to persistently be above the target, they may
increase their prices more than they would otherwise. If
employees expect inflation to be persistently above the
target, they will put forward higher nominal wage increase
demands to maintain the purchasing power of their income.
Businesses may be prompted to increase their prices to be
able to finance wage increases. Meanwhile, higher income
and the resulting higher consumption also generate
inflationary pressure. Consequently, the increase of
expectations for future inflation may affect the pricing and
wage decisions of economic agents; inflation on the whole
rises at a higher rate and more persistently than in the first
scenario and, all else being equal, more monetary tightening
may be required to curb inflation.
The situation is aggravated if instead of a one-off shock, a
series of VAT rises keep inflation high, increasing the risk of
second-round effects. One-off price level increasing shocks
are generally considered to be relatively rare events; in
such a scenario, the probability of cost shocks diverting
inflation from the central bank target is the same as the
probability of downward shocks (shocks are symmetrical),
therefore, they are not expected to feed into the
expectations of economic agents. If, however, consumption
tax rates are changed frequently, there is an increased risk
that economic agents will not think of such government
measures as rare shocks with zero effect on average, and
second-round effects will follow. Therefore, monetary
policy may not necessarily be in the position to refrain from
offsetting the VAT shocks if they are frequent and point in
the same direction − for instance due to a rearrangement
between direct and indirect taxes.
Consequently, the optimal monetary policy response to a
VAT rise depends on the level of trust of monetary
policymakers in the anchoring of inflation expectations.
Typically, surveys are used to attempt to quantify inflation
expectations, but due to various measurement difficulties
reliable indicators are hard to generate.5 In general, the
more a shock can be considered temporary and the less
second-round effects are to be feared, the less monetary
policy needs to respond.
INTERNATIONAL EXPERIENCE
during the crisis, VAT rates (mostly the standard rate) have
been increased in several countries where the central
bank follows inflation targeting. In most cases, the tax
increase resulted in above-target inflation, as the price
increases kept the price index high for 12 months. As we
Table 1Selected VAT rate increases in recent years
Country Date of raise Extent of raise Monetary policy response
Czech Republic
1 January 20101 percentage point(general) Risk of second-round effects was
deemed insignificant, no interest rate increase followed.1 January 2012
4 percentage points(reduced rate)
United kingdom
1 January 20102.5 percentage points(standard rate) Expectation risk became a
recurring element in communication.4 January 2011
2.5 percentage points(standard rate)
Romania 1 July 20105 percentage points(standard rate)
Ongoing easing cycle came to a halt.
Poland 1 January 20111-2 percentage points(various rates)
One of the reasons for tightening.
5 For example, the expectations of households may be distorted by the tendency of households to assign a greater weight to products purchased more frequently, such as food and petrol.

MAGYAR NEMZETI BANK
MNB BullETIN • JANuARY 201338
saw above, central banks tend to focus on the risk of
second-round effects rather than the temporary spike in
inflation. However, the responses of central banks may
cover a broad spectrum. To illustrate this, we looked at
the monetary responses to six VAT increases of recent
years by regional central banks and the Bank of England
(Table 1).
The Czech central bank did not respond to VAT increases,
considering the risk of second-round effects to be
insignificant both in 2010 and 2012. In 2010, the inflation
forecast showed inflation increasing slightly in the short
term, whereas on the horizon of monetary policy the target
was reached and inflation adjusted for the effects of tax
changes approached the target from below. Whereas in
January Czech policymakers unanimously decided to keep
the interest rate unchanged, in February, as a result of
inflation being lower than expected (partly for
methodological reasons) they saw a downward inflation risk
and a rate cut was also considered in the Board. At the time
of the VAT increase of 2012, the price index was expected
to temporarily rise above 3 per cent, which significantly
exceeded the 2 per cent target of the Česká národní banka
(Czech National Bank), but the price index is expected to
fall early in 2013. Inflation adjusted for tax effects is
forecast to be around the target throughout the horizon.
The Board perceived an upward inflation risk in the
development of food prices; on the whole, their assessment
of the risks was balanced. The potential second-round
effects in inflation expectations and wages were deemed
insignificant, which was confirmed by anecdotal evidence
and the development of expectations. In the alternative
scenario of their inflation report in May they reckoned with
more VAT increase to come, but based on past experience
and the subdued economic climate, they still did not expect
any significant second-round effects.
In the case of the VAT hike of the Uk early in 2010 (which
was a re-raise of the rate after the VAT rate cut at end-
2008), there were signs indicating that the pass-through of
the VAT hike may be somewhat greater than previously
expected. Moreover, the fuel price rise also increased
inflation. If inflation remains persistently above the target
for years, expectations may also increase − but on the
whole the Bank of England saw little evidence that the
inflation expectations of households or of money market
participants had changed significantly in the second half of
2009. In addition to the disciplinary power of unused
capacities on pricing, the forecasts for the period when the
effects of the weakening exchange rate and the VAT
increase would end indicated that inflation would fall below
the target. Consequently, no monetary tightening was
deemed necessary.
Early in 2011 inflation was considerably above the target
due to the repeated increase of the standard VAT rate and
the higher energy and import prices. According to the
Board, medium-term inflation risks had also risen (Bank of
England, 2011). The central bank emphasised that in such an
environment it was particularly important how much
economic agents relied on past inflation when formulating
their expectations and how long they envisage the horizon
over which the Bank of England can meet its target again.
In its communication, the Bank of England emphasised the
risk of second-round effects repeatedly in view of the
inflation being persistently above target. The inflation
expectations of households started increasing in previous
months whereas the expectations of businesses, and
expectations derived from money market prices and wage
growth remained stable. Eventually, the VAT rate hike
dropped out of the basis early in 2012, the incoming data
indicated a significant decline in inflation, which reduced
the expectation risk.
The above cases share the common element that inflation
expectations can be assumed to be anchored in both
countries. Where the inflation target had been met on
average for a longer period, second-round effects gave less
cause for concern and the central bank ‘looked through’ the
one-off spike in inflation. However, in countries where the
inflation target had not been achieved, central banks were
more inclined to also react to direct price level increasing
measures, and thus the tax change had an impact on their
interest rate decisions.
One such central bank is the Banca Naţională a României
(National Bank of Romania), whose decision making body, at
its meeting at the end of June 2010, abandoned the interest
rate cut cycle started at the beginning of the year, in the
course of which it had reduced the base rate by 175 basis
points in total. The decision was motivated mainly by the
expected rise in inflation as a result of the VAT increase and
the need to anchor expectations so that the appearance of
second-round effects in consumer prices can be avoided.
Against the backdrop of a significant, but temporary spike
in inflation, the central bank continuously emphasised
during the summer that it was striving to mitigate second-
round effects and anchor inflation expectations at a low
level. Taking into account the inflation reducing effect of
the negative output gap, decreasing inflation towards the
target was expected for the end of 2011, after the first-
round effect of the tax change drops out of the price index.
In the medium term, however, they called attention to the
risk of second-round effects through rising expectations.
The risk remained despite the inflation figure in September
being slightly less than expected, while the base rate was
not modified again during 2010. The first-round effect of

MNB BulletiN • JaNuary 2013 39
HOW SHOULd THE CENTRAL BANk REACT TO THE VAT INCREASE?
the VAT rise petered out in one year; as a result, inflation
had subsided to 3.5 per cent, which is close to the target,
by September 2011. After this, the Board embarked on
another interest rate cut cycle in November.
In the case of the Narodowy Bank Polski (National Bank of
Poland), the motives underlying the rate increase may have
included fears of rising inflation expectations. The rise in
the inflation rate in Poland early in 2011 was attributable
mainly to the VAT rate increase, the global rise in
agricultural commodity prices and oil prices as well an
increase in regulated prices. Parallel with the inflation rate,
core inflation and the inflation expectations of households
also rose. The Board decided on a 25-basis point base rate
increase in January already, citing inflation risks. Because
of rising inflation, there was a risk that expectations would
be stuck at a higher level, which would call for further
monetary tightening. At its next meeting in early March, the
Board did not see such a measure justified: in its assessment,
the interest rate increase of January in combination with
the subdued economic climate, the moderate wage pressure
of businesses and rising unemployment had sufficiently
reduced the inflation risks. In April, however, it was already
evident that core inflation and expectations had both
continued rising, and the incoming real economic data
showed that increasing inflation pressure was to be
expected from the demand side. Consequently, the Board
decided to continue monetary tightening to mitigate the
risk of inflation being above the target in the medium term.
The tightening cycle started in response to the rising
inflation may have also played a part in the current
anchoring of expectations. More firmly anchored
expectations also mean that the latest rate cut may incur
less inflation risk.
Chart 2Inflation, expectations and the policy rate in the countries analysed
−1
0
1
2
3
4
5
6
7
8
−1
0
1
2
3
4
5
6
7
8
Jan.
08
Apr
. 08
July
08
Oct
. 08
Jan.
09
Apr
. 09
July
09
Oct
. 09
Jan.
10
Apr
. 10
July
10
Oct
. 10
Jan.
11
Apr
. 11
July
11
Oct
. 11
Jan.
12
Apr
. 12
July
12
Oct
. 12
Jan.
08
Apr
. 08
July
08
Oct
. 08
Jan.
09
Apr
. 09
July
09
Oct
. 09
Jan.
10
Apr
. 10
July
10
Oct
. 10
Jan.
11
Apr
. 11
July
11
Oct
. 11
Jan.
12
Apr
. 12
July
12
Oct
. 12
Jan.
08
Apr
. 08
July
08
Oct
. 08
Jan.
09
Apr
. 09
July
09
Oct
. 09
Jan.
10
Apr
. 10
July
10
Oct
. 10
Jan.
11
Apr
. 11
July
11
Oct
. 11
Jan.
12
Apr
. 12
July
12
Oct
. 12
Jan.
08
Apr
. 08
July
08
Oct
. 08
Jan.
09
Apr
. 09
July
09
Oct
. 09
Jan.
10
Apr
. 10
July
10
Oct
. 10
Jan.
11
Apr
. 11
July
11
Oct
. 11
Jan.
12
Apr
. 12
July
12
Oct
. 12
Per centPer centCzech National Bank Bank of England
National Bank of Poland National Bank of Romania
0
1
2
3
4
5
6
0
1
2
3
4
5
6Per centPer cent
Inflation (YoY)Inflation targetInflation expectationsPolicy rate
0
2
4
6
8
10
12
14
0
2
4
6
8
10
12
14Per centPer cent
0
1
2
3
4
5
6
0
1
2
3
4
5
6Per centPer cent
Note: The vertical lines indicate the VAT rate increases analysed. The broken lines indicate the tolerance interval around the inflation target. Inflation expectations quantified from the survey of the European Commission, based on Gábriel (2010).Sources: IFS, MNB, central banks and national statistical offices.

MAGYAR NEMZETI BANK
MNB BullETIN • JANuARY 201340
It is notable in the inflation history of the countries
analysed that they typically considered firmer monetary
policy responses necessary in cases where the inflation
target had not been met in the prior period and consequently
there was a higher risk of increasing inflation expectations
(Chart 2). In contrast, where the target had been met,
there was more confidence in the anchoring of expectations,
and thus there was less fear of second-round effects.
OVERVIEW OF THE SITUATION IN HUNGARY
Inflation in Hungary has been significantly above target for
a considerable length of time. Since the introduction of the
continuous inflation target early in 2007, inflation has been
above 5 per cent on average. The so-called constant tax
rate index calculated by the Hungarian Central Statistical
Office (HCSO) to filter out the immediate direct effect of
changes in indirect taxes was approximately 1 percentage
point lower on average during the period but it was still
above the 3 per cent target. According to policymakers,
when assessing the achievement of the inflation target,
fluctuations resulting from unexpected effects must also be
taken into consideration, and therefore a consumer price
index departing from the 3 per cent target by no more than
±1 percentage point is acceptable ex post for purposes of
price stability. However, inflation was above the 4 per cent
ceiling thus calculated in three quarters of the period. In
the case of the constant tax rate index, this ratio is below
40 per cent, which is still not negligible and shows the
importance of indirect tax rises in the development of
inflation.
Inflation remaining persistently above target may endanger
the anchoring of expectations. This risk arises because
economic agents, perceiving inflation to significantly
exceed the target of the central bank, may conclude that
the central bank is more tolerant of short-term deviations
in inflation or doubts may arise concerning the commitment
of the central bank or its ability to bring inflation back to
target in the medium term (Macallan et al., 2011). This may
cause their inflation expectations to rise, which in turn will
be reflected in their pricing and wage decisions. The more
credible the central bank is, that is, the longer the period
that it was able to maintain price stability, the less likely
the above risk is to materialise.
International experience also shows that persistent
deviation from the target raises inflation expectations,
which start declining only when inflation is back around the
target again (Corder and Eckloff, 2011). Research findings
indicate that short and medium-term inflation expectations
are slower to shift than inflation itself, and they gradually
return to their previous level once inflation is back on
target. However, the return of (medium-term) expectation
takes time. In half the cases investigated, where inflation
was persistently off-target, inflation deviated from the
inflation target for 9 quarters at the most − the Hungarian
figure is significantly higher than that. This also seems to
indicate that in Hungary there is a considerable risk that
Chart 3Inflation, expectations and the policy rate in Hungary
0
2
4
6
8
10
12
0
2
4
6
8
10
12Per centPer cent
Inflation (YoY)Inflation targetInflation expectationsPolicy rate
Jan.
08
Apr
. 08
July
08
Oct
. 08
Jan.
09
Apr
. 09
July
09
Oct
. 09
Jan.
10
Apr
. 10
July
10
Oct
. 10
Jan.
11
Apr
. 11
July
11
Oct
. 11
Jan.
12
Apr
. 12
July
12
Oct
. 12
Note: The vertical lines indicate the VAT rate increases analysed. The broken lines indicate the ex post tolerance interval around the inflation target. Inflation expectations quantified from the survey of the European Commission, based on Gábriel (2010).Sources: IFS, MNB.
Chart 4Frequency of changes to the standard VAT rate in EU Member States between 2001 and 2012
0
1
2
3
4
5
6
PT
IE EL HU
SK UK
CZ
CY
LT LV DE
EE ES FI IT MT
NL
PL
RO
SI AT
BE
BG
DK
FR LU SEFrequency of changes between 2001−2012 (number)
Note: The countries analysed are highlighted.Source: European Commission.

MNB BulletiN • JaNuary 2013 41
inflation expectations are not anchored, as in the past 5
years monetary policy has been unable to stabilise inflation
for a longer period around the 3 per cent target (Chart 3).
This is also suggested by the results of Gábriel (2010), to the
effect that in Hungary expectation shocks have played an
important part in explaining the volatility of inflation and
the development of inflation and wages. Accordingly, the
inflation target of the central bank probably fails to
sufficiently coordinate the expectations of economic
agents; therefore, there is greater probability of temporary
inflation shocks having second-round effects.
High inflation is partly attributable to frequent and
substantial cost shocks: in recent years food and oil price
increases and tax measures with inflationary effects have
come one after the other. The changes in the Hungarian
VAT rates would be considered frequent by international
standards, and thus the outstanding volatility of the
standard tax rate did not contribute to a predictable
economic environment and the evolution of firmly anchored
inflation expectations (Chart 4). Accordingly, there is a risk
that of the scenarios described above, the one containing a
series of shocks will materialise.
CONCLUSIONS
The illustrative scenarios and international experience
outline the typical response of central banks to VAT
increases: where inflation expectations are anchored, it
may be assumed that government measures directly
increasing price levels have no persistent effect on inflation,
and monetary policy does not respond to them, while it
does offset any second-round effects appearing in wages
and expectations. The international best practice of central
banks relies on the assumption that price level increasing
shocks are relatively rare and symmetrical. This assumption
is the reason that central banks may be justified in thinking
that such shocks are not built into the inflation expectations
of economic agents. In the case of Hungary, however, there
are arguments that the risk of second-round effects is
greater. On the one hand, based on the persistently above-
target inflation and survey results, the anchoring of
inflation expectations around the target is questionable. On
the other hand, in recent years economic agents may have
become accustomed to the rearrangement of Hungarian
consumption tax rates; therefore, it may be reasonable that
they do not think of the government’s price increasing
measures as rare shocks with zero average effect.
REFERENCES
Bank of England (2011), Minutes of the Monetary Policy
Committee meeting 12 and 13 January 2011.
CNB (2012), Inflation Report, I/2012, Czech National Bank.
CordEr, MatthEw and daniEl ECkloff (2011), “International
evidence on inflation expectations during Sustained Off-
Target Inflation episodes”, Quarterly Bulletin, Q2, Bank of
England, pp. 111−115.
fElCsEr, dániEl and kristóf lEhMann (2012), “The Fed’s
inflation target and the background of its announcement”,
MNB Bulletin, October, Magyar Nemzeti Bank, pp. 28−37.
gáBriEl, PétEr (2010), “Household inflation expectations and
inflation dynamics”, MNB Working Papers 2010/12, Magyar
Nemzeti Bank.
gáBriEl, PétEr and ádáM rEiff (2006), “The effect of the
change in VAT rates on the consumer price index”, MNB
Bulletin, december, Magyar Nemzeti Bank, pp. 14−20.
MaCallan, ClarE, tiM taylor and toM o’grady (2011), “Assessing
the risk to inflation from inflation expectations”, Quarterly
Bulletin, Q2, Bank of England, pp. 100−110.
HOW SHOULd THE CENTRAL BANk REACT TO THE VAT INCREASE?
MNB BulletiN • JaNuary 201342
iNtRODuCtiON
Whole-economy investment is of outstanding importance
for several reasons. On the one hand, 20 to 25 per cent of
aggregate demand is generated by investment projects in
the region, and thus they make a significant contribution to
GDP in the short term. On the other hand, investment
allows the domestic capital stock to expand and renew. The
potential growth of the economy is determined by the
combination of the available labour force, the volume of
physical capital1 and the efficiency of their combined use.
Consequently, on the supply side of the economy, investment
is the basis of growth mainly in the medium and long term.
This is why it is important to understand the processes
underlying the investment activity of recent years, the
channels through which the crisis exerted its adverse
effects, the factors that have determined and will continue
to determine the investment-related decisions of economic
agents and the probable duration of this negative trend.
The dynamic investment growth seen in Hungary in the
2000s came to a halt by the middle of the past decade
(Chart 1). In the two years following the 2006 fiscal
consolidation, the decelerating economic growth was
supported only by the subdued growth in investment. After
the outbreak of the global economic crisis, however,
Ádám Martonosi: Factors underlying low investment in Hungary
Since the onset of the economic crisis, an unprecedented downturn in investment in the national economy has occurred in
the past four years. This marked decline has been registered in all sectors of the economy, albeit to differing degrees.
Investment is a key aspect of convergence for the Hungarian economy as the renewal and expansion of the capital stock
determines the magnitude of production capacities, and through that, economic output. The lack of investment by the
government sector and households mainly reduces gross domestic product in the short term, while the decline in corporate
investment not only directly reduces aggregate demand, it also has a negative impact on Hungary’s potential growth in
the medium and long term.
Our analysis examines the development of investment in a regional comparison, in a breakdown by sectors, starting from
the pre-crisis years and primarily focusing on the period of the crisis.
In a regional comparison, investment trends in Hungary were already moving in the wrong direction before the crisis, with
the investment ratio gradually declining as a percentage of GDP. The adjustment of 2006 considerably reduced government
expenditures, and simultaneously the less favourable demand conditions resulted in a general drop in corporate investment.
As a combined result of the above, at the onset of the crisis Hungary had the lowest investment rate in the region. After
2008, the combination of the major economic slowdown, the persistently weaker demand prospects, the substantial
balance sheet adjustment requirement for the public and private sectors alike and the marked downturn in the lending
activity of banks caused a substantial decline in investment. In Hungary, the decrease in accumulation by households has
been significant in international comparison, while the government’s investment ratio has remained stable in recent years,
mostly as a result of the accelerated use of EU funds. The drop in corporate investment proved to be substantial primarily
in sectors producing for the domestic market and in the service sectors, while investment by companies producing for
exports was boosted considerably by large projects in the manufacturing industry. As a result, the investment situation is
more favourable in this segment.
1 The level of the capital stock is affected not only by investment but also by depreciation. In this paper, we focus on understanding the investment processes.
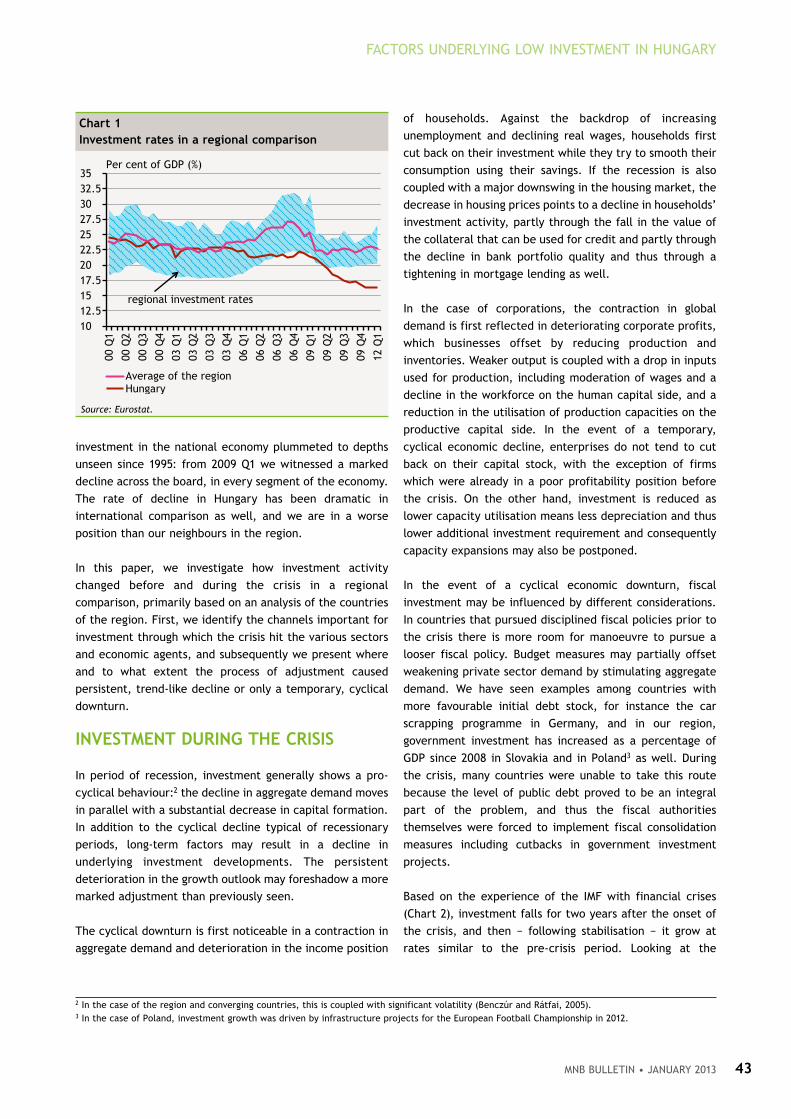
MNB BulletiN • JaNuary 2013 43
FACTORS UNDERLyING LOW INVESTMENT IN HUNGARy
investment in the national economy plummeted to depths
unseen since 1995: from 2009 Q1 we witnessed a marked
decline across the board, in every segment of the economy.
The rate of decline in Hungary has been dramatic in
international comparison as well, and we are in a worse
position than our neighbours in the region.
In this paper, we investigate how investment activity
changed before and during the crisis in a regional
comparison, primarily based on an analysis of the countries
of the region. First, we identify the channels important for
investment through which the crisis hit the various sectors
and economic agents, and subsequently we present where
and to what extent the process of adjustment caused
persistent, trend-like decline or only a temporary, cyclical
downturn.
iNVeStMeNt DuRiNg tHe CRiSiS
In period of recession, investment generally shows a pro-
cyclical behaviour:2 the decline in aggregate demand moves
in parallel with a substantial decrease in capital formation.
In addition to the cyclical decline typical of recessionary
periods, long-term factors may result in a decline in
underlying investment developments. The persistent
deterioration in the growth outlook may foreshadow a more
marked adjustment than previously seen.
The cyclical downturn is first noticeable in a contraction in
aggregate demand and deterioration in the income position
of households. Against the backdrop of increasing
unemployment and declining real wages, households first
cut back on their investment while they try to smooth their
consumption using their savings. If the recession is also
coupled with a major downswing in the housing market, the
decrease in housing prices points to a decline in households’
investment activity, partly through the fall in the value of
the collateral that can be used for credit and partly through
the decline in bank portfolio quality and thus through a
tightening in mortgage lending as well.
In the case of corporations, the contraction in global
demand is first reflected in deteriorating corporate profits,
which businesses offset by reducing production and
inventories. Weaker output is coupled with a drop in inputs
used for production, including moderation of wages and a
decline in the workforce on the human capital side, and a
reduction in the utilisation of production capacities on the
productive capital side. In the event of a temporary,
cyclical economic decline, enterprises do not tend to cut
back on their capital stock, with the exception of firms
which were already in a poor profitability position before
the crisis. On the other hand, investment is reduced as
lower capacity utilisation means less depreciation and thus
lower additional investment requirement and consequently
capacity expansions may also be postponed.
In the event of a cyclical economic downturn, fiscal
investment may be influenced by different considerations.
In countries that pursued disciplined fiscal policies prior to
the crisis there is more room for manoeuvre to pursue a
looser fiscal policy. Budget measures may partially offset
weakening private sector demand by stimulating aggregate
demand. We have seen examples among countries with
more favourable initial debt stock, for instance the car
scrapping programme in Germany, and in our region,
government investment has increased as a percentage of
GDP since 2008 in Slovakia and in Poland3 as well. During
the crisis, many countries were unable to take this route
because the level of public debt proved to be an integral
part of the problem, and thus the fiscal authorities
themselves were forced to implement fiscal consolidation
measures including cutbacks in government investment
projects.
Based on the experience of the IMF with financial crises
(Chart 2), investment falls for two years after the onset of
the crisis, and then − following stabilisation − it grow at
rates similar to the pre-crisis period. Looking at the
2 In the case of the region and converging countries, this is coupled with significant volatility (Benczúr and Rátfai, 2005).3 In the case of Poland, investment growth was driven by infrastructure projects for the European Football Championship in 2012.
Chart 1investment rates in a regional comparison
1012.51517.52022.52527.53032.535
00 Q
1
00 Q
2
00 Q
3
00 Q
4
03 Q
1
03 Q
2
03 Q
3
03 Q
4
06 Q
1
06 Q
2
06 Q
3
06 Q
4
09 Q
1
09 Q
2
09 Q
3
09 Q
4
12 Q
1
Per cent of GDP (%)
Average of the regionHungary
regional investment rates
Source: Eurostat.

MAGYAR NEMZETI BANK
MNB BullETIN • JANuARY 201344
Hungarian data, two important differences can be observed:
first, in the case of domestic investment the deviation from
the pre-crisis trend is greater than what is experienced
internationally; second, no turning point is seen in the
domestic data for the time being.
In many European countries, the excessive indebtedness of
the government and/or the private sector proved to be one
of the main causes of the problems, which may suggest not
only a cyclical downturn in investment but may foreshadow
a trend-like decline in investment due to the protracted
balance sheet adjustment of the various actors. In the
following, we present the causes that may suggest a
persistent downturn in investment.
The overspending of prior years/decades led to high public
or private debt in a number of countries, and fears
concerning their repayment mounted gradually after 2008.
Faster adjustment was observed in the countries where the
debt-to-GDP ratio was higher, and thus the decline in
investment was more significant (Chart 3).
The general weakening of confidence rendered the
refinancing of existing debt more expensive if not impossible
for the states, while the strengthening coordination within
the European Union imposed much more severe requirements
for the consolidation of public finances. The European
Central Bank attempted to remedy the financing problems
of distressed countries by various means, and several
countries are still using these facilities. Nevertheless,
seriously indebted countries face higher financing costs
than prior to the crisis. Against that backdrop, the countries
that implemented fiscal consolidation became part of the
investment problem themselves, as the persistent decline
in the level of government investment may reduce the
investment rate in the long term.
The level of household indebtedness has played a similarly
important role in the investment activity of recent years.
Mortgage loans, which were available at low interest rates
before the crisis, resulted in a rapid growth in housing
investment in a number of European countries and
contributed to the development of a real estate market
bubble in several cases (Spain, Ireland). In most countries,
the tightening of credit conditions, the deterioration in the
income position and the bursting of the housing price
bubble resulted in a substantial drop in the output of the
construction industry, and investment shrank to a fraction
of their previous levels. Although no real estate market
bubble developed in Hungary, a rapid increase in households’
mortgage-backed indebtedness mostly denominated in
foreign currency was typical here as well. The balance
sheet adjustment of households due to the accumulated
debts has been ongoing in these countries since the onset
of the crisis, but its rate is slow and − compared to the rate
seen in the pre-crisis period − it will result in a lower
investment rate in the long term.
The magnitude of indebtedness represented a less significant
problem in the corporate sector: compared to the other
Chart 2investment during financial crises
(Hungarian investment is shown for 2008−2012)
−70
−60
−50
−40
−30
−20
−10
0
10
−70
−60
−50
−40
−30
−20
−10
0
10
−1 0 1 2 3
2012
4 5 6 7
Deviation from pre-crisis trend (per cent)
Deviation from pre-crisistrend (per cent)
90% confidence intervalHungaryAverage of countries examined
Note: In the figure, the data for Hungary represent the time series of the total gross fixed capital formation, which contains the forecast presented in the MNB’s December Report on Inflation for 2012 in the last data point.Sources: IMF (2009), MNB.
Chart 3Relationship of debt and investment in international comparison
Hungary
Belgium
Bulgaria
Czech RepublicDenmark
Germany
Estonia
Ireland
Greece
Spain
France
Italy
Cyprus
Latvia
LithuaniaMalta
Netherland Ausztria
Poland
Portugal
Romania
Slovenia
Slovakia
Finland
SwedenNorway
Croatia
−14
−12
−10
−8
−6
−4
−2
0
2
−100 −50 0 50 100 150
Gross fixed capital formation/decline in GDP, (between theaverage of 2001−2008 and 2011)
Net foreign debt/GDP, 2008
Source: Eurostat.

MNB BulletiN • JaNuary 2013 45
FACTORS UNDERLyING LOW INVESTMENT IN HUNGARy
two sectors, the balance sheet adjustment requirement
was lower in connection with the reduction of debts.
Accordingly, cyclical channels may have limited corporate
investment activity more strongly here.
Alongside with and in close relationship to the debt,
another important consideration is the issue of financing.
Investment is typically implemented with a high proportion
of credit, but the negative impacts of the crisis on the
financial system made it difficult if not impossible to obtain
funding, and funding costs rose significantly. The lending
capacity of banks and other credit institutions weakened as
the losses suffered on their loan portfolios and the negative
revaluation of the remaining portfolio significantly worsened
the balance sheets of banks. The contraction of funding
sources and banks’ declining risk tolerance still represent
severe constraints to private sector entities, which therefore
cut back on their investment. Governments find it easier to
obtain financing than private sector entities. Most countries
are still able to raise funding in the government bond
markets, albeit at elevated interest rates, and where this
becomes temporarily or permanently impossible, the credit
facilities of international organisations offer a solution. In
Europe, the EU’s development funds may present additional
sources of financing for converging countries including
Hungary. Most of these funds are provided to the various
countries for investment purposes, and they can mitigate
the financing difficulties of the public and private sectors
alike, due to their low own funding requirement. On the
whole, however, the lending capacity of the financial
system has weakened compared to the pre-crisis era, which
may persistently reduce investment activity in both the
corporate and household sectors.
The third element of the stubborn investment problem is
the issue of forward-looking expectations relating to the
economic situation. In Europe, the public and private
sectors struggling to reduce the debt are only able to
stimulate the supply side of the economy at a very slow
pace, which in turn elevates the financing constraints in
place on the side of the financial system. Furthermore, the
profitability of businesses is undermined by the corporate
tax burdens increased in the course of crisis management,
while the frequent changes in the regulatory environment
reduce predictability and risk tolerance. In combination,
these factors create an uncertain business environment for
the corporate sector, which may lead to a permanent
backlog in investment by companies producing for the
domestic market or providing services. Enterprises
producing for exports are in a better position, as other
actors in the global economy, particularly Asia, have
generated significant demand even during the crisis, but
risks relating to a global slowdown point to more restrained
investment activity in the case of exporting companies as
well, and other risks (funding, taxation, regulatory changes)
also affect enterprises producing for external markets.
iNVeStMeNt tReNDS iN HuNgARy AND tHe RegiON
The level of economic development of Hungary and other
countries in the region is below the EU average. The lower
per capita capital stock and lower average wage level
typical in converging countries promise a higher return to
investors, and thus the capital stock may grow faster than
in developed countries. However, the outbreak of the
economic crisis reduced the speed of convergence, and the
investment rate declined considerably in all countries of the
region. In the following, we attempt to identify the
differences and similarities in the investment trends of
Hungary and its regional peers.
In international comparison, the investment-to-GDP ratio
can be used to compare the proportion of gross domestic
product each country uses to renew or expand its capital
stock. Of the countries in the region, only Poland and
Romania had lower investment ratios in the first half of the
2000s than Hungary. However, in the pre-crisis years
Hungary was already below the regional average, and at the
onset of the crisis the difference was 4–5 percentage points
compared to its better positioned regional neighbours
(Chart 1). We should note that prior to the crisis the fiscal
consolidation of 2006 in itself reduced the Hungarian
investment rate by one percentage point and in the
subsequent two years we only saw stagnation, while
Chart 4Changes in investment
60708090
100110120130140150160170180190
2005 2006 2007 2008 2009 2010 2011
2005 = 100
Czech RepublicHungaryPolandRomaniaSloveniaSlovakia
Source: Eurostat, national statistical offices.

MAGYAR NEMZETI BANK
MNB BullETIN • JANuARY 201346
investment expenditure as a percentage of GDP continued
to increase in almost every neighbouring country until
2008. Investment plummeted everywhere in 2009. In the
period since 2010, the investment rate has stagnated or
increased in the majority of the countries of the region,
while compared to 2005, investment activity in Hungary in
2011 was some 20 per cent lower, which is the lowest figure
in the region, together with Slovenia.
In its own right, the investment rate being lower than that
of our neighbours in the region for an extended period of
time may indicate a persistent investment problem; the
question is which economic segment is responsible for this
deficiency. Looking at the breakdown of investment by
material-technical content,4 a strong duality is seen, which
may indicate differences in behaviour across the various
sectors of the economy (government, households,
businesses).
The growth of building investment has been very
heterogeneous in the region since the onset of the crisis
(Chart 5). Hungary’s performance is among the poorest, a
similar decline is found only in Slovenia, where this process
happened faster and more drastically in recent years. In the
case of machinery investment, after the decline of 2009,
signs of slow stabilisation are seen in Hungary, the Czech
Republic, Poland and Slovenia, while Slovakia expanded its
capacities dynamically. Machinery investment in Hungary is
at its 2005 level. All of this indicates that the investment
performance of Hungarian companies was already lower
before the crisis, whereas during the crisis the dynamics
observed in terms of corporate investment did not deviate
from the regional average.
Chart 5Building-type investment
60
80
100
120
140
160
180
200
2005 2006 2007 2008 2009 2010 2011
2005 = 100
Czech RepublicHungaryPolandRomaniaSloveniaSlovakia
Source: Eurostat, national statistical offices.
Chart 6Machinery-type investment
60
80
100
120
140
160
180
200
2005 2006 2007 2008 2009 2010 2011
2005 = 100
Czech RepublicHungaryPolandRomaniaSloveniaSlovakia
Source: Eurostat, national statistical offices.
Chart 7Sectoral investment trends in regional comparison
Per cent Per cent
0
2
4
6
8
10
12
14
16
18
20
0
2
4
6
8
10
12
14
16
18
20
2005
−200
8 av
erag
e20
0920
1020
1120
05−2
008
aver
age
2009
2010
2011
2005
−200
8 av
erag
e20
0920
1020
1120
05−2
008
aver
age
2009
2010
2011
2005
−200
8 av
erag
e20
0920
1020
11
Hungary CzechRepublic
Poland Slovenia Slovakia
Corporate investment/GDPGovernment investment/GDPHousehold investment/GDP
Source: Eurostat, national statistical offices.
4 Two large groups of investment are building-type and machinery-type investment, covering 95−98 per cent of investment activity as a whole. In terms of sectors, the government and households tend to implement mostly building-type investment while the capital expenditures of businesses are mostly in machinery and equipment.

MNB BulletiN • JaNuary 2013 47
FACTORS UNDERLyING LOW INVESTMENT IN HUNGARy
Moving on to the detailed analysis of the various sectors,
the Czech Republic and Slovenia led the way in government
expenditure reductions following the outbreak of the crisis,
with the ratio of government investment falling by one-fifth
as a percentage of GDP. The rate of government expenditures
did not change materially in Hungary and Romania; it should
be noted, however, that Hungary had already implemented
a fiscal consolidation round between 2006 and 2008,
whereby investment expenditures fell by one-third as a
percentage of GDP. By contrast, Poland and Slovakia
increased their government investment to GDP ratio
significantly despite the crisis, expanding their expenditures
by one-fifth in three years on average.
In Hungary, the government sector is responsible for 15−20
per cent of whole-economy investment. Government-
related investment covers a broad range: in addition to
direct public involvement (central agencies, local
governments, state-owned enterprises), investment
involving the public sector is also present in the business
sector (public utilities, quasi-fiscal institutions, PPP
projects, EU projects). In general, the largest share of
capital formation of the government consists of
infrastructure projects, which had been a major addition
to investment in Hungary before the crisis. In the course of
the fiscal consolidation of 2006, the investment rate of the
government declined significantly, mostly due to the lack
of the previously significant infrastructure projects. During
the crisis, expenditure cuts meant reducing investment in
all areas of the government sector; still, the government
investment rate as a percentage of GDP did not decrease
as compared to the pre-crisis level. This was mainly
attributable to the significant inflows of EU development
funding.
Hungary receives funding from the EU in several forms. In terms
of investment, the most important ones are the funds present in
the budget; of these, the amounts coming from the Structural
Funds and the Cohesion Fund, and the amounts for rural
development are the most substantial.
In the 2004−2006 period, the funding available to Hungary was
considerably smaller, but in the 2007−2013 period the annual
financial allocations increased. The available figures indicate that
in 2007−2008 only one quarter of the funds available were
utilised, while this ratio rose to one half of the annual financial
allocation in 2009, in 2010−2011 it was close to the total allocation
available for the year, and this year it is expected to exceed that
amount. It should be noted that the financial allocation for the
current year is not lost if it is not utilised in the given year; EU
rules allow for the use of funding across years.
The role of EU funds in the real economy is particularly important
in the case of whole-economy investment as the magnitude of the
available financial allocations may amount to 10−15 per cent of
the investment volume in the given year. It should be noted that
not all inflows of funds to Hungary can be used for gross capital formation; only those items can be taken into account that are not
used towards operation of the institutional system or for various HR projects.
The use of EU funds is not restricted to the government sector in the narrow sense, as they can be applied for by every sector of the
economy. In terms of investment, funds can primarily be applied for financing infrastructure projects and for enterprise development.
They are of outstanding importance in government investment as the fiscal consolidation has diverted the government’s investment
activity towards projects that can be implemented with EU funding; thus the government’s investment rate has not declined in recent
years, despite the gradually shrinking own funds provided by the government.
Role of eu funds in investment in Hungary
Chart 8Proposed and actual use of eu funds
0
200
400
600
800
1,000
1,200
1,400
2007 2008 2009 2010 2011 2012 2013
HUF Bn
Planned annual overall amount Funds for investment activityFunds for operational purposes
Actual data Preliminarydata
Planned framework
amount and usage
Source: NGM

MAGYAR NEMZETI BANK
MNB BullETIN • JANuARY 201348
Household investment declined significantly mainly in
Hungary and Slovenia. Between 2008 and 2011, the
investment rate of households as a percentage of GDP
dropped by 35−40 per cent. By contrast, in Slovakia and
Poland there was a slight decline of 10−15 per cent in this
three-year period, while in the Czech Republic and Romania
household investment did not decline to any appreciable
extent.
In Hungary, capital formation of households represents
20−25 per cent of total investment, with the overwhelming
majority5 of this relating to the real estate market (purchase
of new home, renovation of old property). Proportionally,
household investment showed the steepest decline during
the crisis: in the case of the housing market, the number of
new homes completed per year shrank to one third by 2011,
the lowest level since the political transition. The drastic
decline in demand entailed a persistent drop in housing
prices.
The decline is attributable to several causes. On the one
hand, dynamic growth started in the Hungarian housing
market early in the 2000s, initially driven by the government-
subsidised forint denominated housing loan programme and
later by the explosive growth in foreign currency lending.
After the onset of the crisis, the exchange rate of the forint
weakened considerably and the foreign currency
denominated housing loan stock placed a severe additional
burden on households. With an increase in repayment
burdens, a further deterioration took place in the income
position of households. In parallel with the setback in
aggregate demand, businesses reduced their costs through
wage cuts and layoffs, and thus unemployment grew and
the real income of households decreased. As a first step,
households reacted to the recession environment by a rapid
reduction in consumption. Subsequently, after 2009, their
consumption rate stabilised, and even increased slightly.
However, a sustained decline has been observed in the
investment rate. As a proportion of disposable income, the
investment rate halved during the crisis years, and thus the
postponement of investment has become one of the most
important channels of adjustment for Hungarian households.
In addition to the blanket ban on foreign currency lending,
forint lending was also suppressed, which also led to a drop
in home purchases (Chart 10).
Corporate investment constitutes some 55−70 per cent of
total investment in the countries of the region; consequently,
this was the sector that typically suffered the greatest
setback. The situation appears to be worst in Romania and
Slovenia, where corporate investment continued to decline
in 2011, while in other countries including Hungary the
corporate investment rate improved to some extent last
year, but it has not reached the pre-crisis levels in any
country as yet. While the decline in government and
household investment typically reflects weaker longer-term
underlying trends in the region, in the case of businesses a
minor decline was observed, which was partly attributable
to the favourable investment performance of exporting
5 Machinery investment of agricultural sole proprietors is also classified in the household sector and it represents 25 per cent of investment activity.
Chart 9Households’ investment, consumption and net financial savings rates
71
74
77
80
83
86
89
92
95
−4−202468
101214161820
2005 2006 2007 2008 2009 2010 2011 2012
Ratio of disposable income (per cent)
Ratio of disposableincome (per cent)
Net financial saving rateInvestment rateConsumption rate (right-hand scale)
Note: The surge in the net financial savings rate and the decline in the consumption rate in 2011 are explained by the disbursement of the private pension fund real yields.Sources: MNB and CSO.
Chart 10Net borrowing of households and businesses
−2,000
−1,500
−1,000
500
0
500
1,000
1,500
2,000
2,500
3,000
3,500
2005 2006 2007 2008 2009 2010 2011
HUF Bn
Household sector loans for house purchaseHousehold sector loans for other purposesTotal external financing of the corporate sectorTotal domestic borrowing of the corporate sector
Forrás: MNB.

MNB BulletiN • JaNuary 2013 49
FACTORS UNDERLyING LOW INVESTMENT IN HUNGARy
foreign companies that moved to the region before or
during the crisis. Breaking down corporate investment to
industries, different trends emerge in industries producing
primarily for exports (manufacturing, agriculture),
producing mostly for the domestic markets and service
industries (e.g. trade, catering, communication, financial
services) and quasi-fiscal6 corporations.
The investment activity of exporting companies has been
improving in every country, which is explained primarily by
the high export demand from Asia and the new manufacturing
capacities moving into the region. In the case of the group
producing or providing services for the domestic market,
corporate accumulation fell considerably, in line with weak
domestic demand. Considering that demand prospects have
been extremely uncertain for quite a long time, we
continue to expect poor investment performance from this
group of businesses. For quasi-fiscal sectors that are partly
commercial but also contain a significant government
element, regional trends reveal a mixed picture. In general,
compared to the outbreak of the crisis, a slight decline is
observed in Slovakia and the Czech Republic, whereas in
the case of Poland the figures reflect the infrastructure
projects for the European football championship of 2012. By
contrast, the downturn was more significant in Hungary.
Investment by quasi-fiscal corporations is strongly linked to
EU funds, which explains their more moderate decline.
A detailed examination of Hungarian trends shows that
55–60 per cent of total investment comes from corporate
investment, approximately two-thirds of which is used for
the purchase of machinery and equipment, with only one
third relating to buildings and other structures. After the
onset of the crisis, investment declined substantially both
in industries producing for the domestic market or providing
services, and in exporting industries. Negative expectations
relating to poor demand are shown by the fact that in the
manufacturing industry, which accounts for some half of
corporate investment, there was 15 per cent less investment
in 2009 than in the previous year. In addition to the
contraction of aggregate demand, the sharp drop in
corporate lending (Chart 10) and the more expensive
purchase of imported machinery due to the weakening of
the exchange rate also hindered corporate investment. The
special taxes imposed due to the fiscal consolidation
further reduced the profitability of certain sectors (trade,
financial sector, energy, telecommunication) and thus also
their willingness to invest.
The decline in corporate investment may be partly explained
by the substantial excess capacity in producing sectors. In
the case of industries producing mostly for the domestic
market, capacity utilisation has been on a downward trend
since 2006, and it has departed even more from the
capacity utilisation indicators typical for exporters.
Despite the generally unfavourable investment climate,
some positive signs were seen in the exporting sectors even
during the crisis. In recent years, several large investment
projects were started in Hungary and as it was noted
earlier,7 the appearance of a major foreign-owned
manufacturing company in itself can improve the investment
scene considerably. The favourable effects of investment by
foreign companies in the machinery and transport
equipment industries (Audi, Mercedes, Opel, Hankook)
appeared in the second half of 2010 and remained substantial
until the end of 2012. However, it should be noted that
despite these large individual projects, underlying trends
continue to be weak in the manufacturing industry. The
investment activity of manufacturing sectors producing for
the domestic market has fallen by one quarter from its 2005
level.
Chart 11Corporate investment in the region by industry
40
60
80
100
120
140
160
180
200
220
240
2005
2007
2009
2011
2006
2008
2010
2005
2007
2009
2011
2006
2008
2010
CzechRepublic
Hungary Poland Slovakia
2005 = 100
TradeableNon tradeableQuasi-fiscal
Source: Eurostat.
6 The problem with industry classification is that even a detailed breakdown will contain both government-induced and purely commercial investment, e.g. motorway construction, railway renovation, energy projects. To address investment outside the government sectors in the narrow sense, we prepared our own classification for industry groups where the quasi-fiscal industry group contains the energy sector, water management, transportation and several minor service industries.
7 In 2007, the tyre manufacturing plant of the South Korean Hankook substantially improved the growth rate of manufacturing industry investment.

MAGYAR NEMZETI BANK
MNB BullETIN • JANuARY 201350
In a regional comparison, the picture is quite favourable for
exporting industries, thanks to large capital projects, while
Hungary registered the steepest drop in the region in other
industries. Industries producing for the domestic market or
providing services invested almost 40 per cent less than in
2005, which is partly attributable to weak domestic demand
and the poor economic outlook, though it should be noted
that the special levies imposed on certain sectors (trade,
communication, financial services) may also have
contributed to the weak investment activity.
Economic agents’ expectations play an important role in
developments in corporate investment. In the regional
competition for investment, the assessment of the
competitiveness of the given economy is important. The
indicators of various rankings of the business environment
evaluate individual countries on the basis of a number of
criteria (economic growth, due process of law, taxation,
administrative burdens, labour quality, etc.).
Based on the Growth and Competitiveness Index of the
World Economic Forum of Davos, Hungary is in the middle
group within the region. The index takes into account a
number of variables; competitiveness does not depend
exclusively on the business environment. Hungary’s relative
position within the region was at its worst in 2008,
improving slightly by 2012. Of the sub-indices relevant for
the business environment, the assessment of the
macroeconomic environment improved significantly
between 2006 and 2012, while in the case of the sub-indices
for public and private institutions, education, the labour
market and technology, the position of the country
deteriorated markedly both in regional and global
comparison.
Another international survey, the World Bank’s ‘Doing
Business in’, focuses mostly on the business environment
and the underlying institutional conditions such as: starting
a business, protection, administrative cost of and tax
payment by investors, or due process of law. In 2006,
Hungary was second among the six countries under review.
According to the most recent ranking, Hungary is the last in
the region at present, and the country’s assessment is
particularly unfavourable in the case of the sub-indices that
compare the protection of investors and tax payment.
Although in the case of some of the components under
review the assessment of the country has improved, its
relative assessment in the case of several criteria relevant
in terms of investment has deteriorated, which carries
downside risks to new investment.
CONCluSiONS
In a regional comparison, Hungary’s position is weak in
terms of investment. The investment rate was among the
lowest in the region at the onset of the crisis and has
remained so ever since. Most of this shortfall already
existed in the pre-crisis period, and it has increased
somewhat since the outbreak of the crisis. In the pre-crisis
years, the decline in the investment rate was mostly caused
by the decline in government and corporate investment.
The adjustment in 2006 resulted in a major fall in the
government investment rate, which was stabilised by an
increased inflow of EU funds following the crisis. Although
in terms of dynamics, developments in domestic corporate
investment have been similar to the regional average since
the crisis, regarding corporate investment as a proportion
of GDP, Hungarian enterprises continue to spend 3−5
percentage points less on accumulation than Hungary’
neighbours in the region. Persistently lower corporate
investment may present a lasting investment problem; the
shortfall is most obvious in the case of the sectors
producing and providing services for the domestic market,
while in the case of exporting companies investment
activity was maintained by the large investment projects of
recent years. Apart from this significant individual item,
underlying developments are weak in this segment as well.
Although prior to the crisis there were no signs of evolution
of a housing market bubble in the domestic housing market,
Hungary has seen household investment decline the most in
recent years. The restraining of investment expenditures
has become one of the most important channels of
households’ balance sheet adjustment. Considering that
due to the significant revaluation of foreign currency
denominated debts household indebtedness − as a
proportion of disposable income − is still close to the 2008
level, the absence of household investment may remain a
protracted process for years to come.
ReFeReNCeS
Gál, Péter (2007), “Unfavourable investment data − risks to
economic growth?”, MNB Bulletin, June, Magyar Nemzeti
Bank, pp. 12-21.
benczúr, Péter anD attila rátFai (2005), “Economic
Fluctuations in Central and Eastern Europe − the Facts”,
MNB Working Papers, 2005/02, Magyar Nemzeti Bank.
MaGyar neMzeti bank (2012), Quarterly Report on Inflation,
June 2012.

MNB BulletiN • JaNuary 2013 51
FACTORS UNDERLyING LOW INVESTMENT IN HUNGARy
MaGyar neMzeti bank (2012), Quarterly Report on Inflation,
September 2012.
MaGyar neMzeti bank (2012), Quarterly Report on Inflation,
December 2012.
MaGyar neMzeti bank (2012), Report on Financial Stability,
November 2012.
international Monetary FunD (2009), World Economic Outlook,
Sustaining the Recovery, October 2009.

MNB BulletiN • JaNuary 201352
iNtRODuCtiON
In the past decade, the advance of modern information
technologies has led to the spread of new electronic forms
of payment. As with any innovation, new solutions give rise
to new questions. It is no different in the case of payment
instruments. Because of the widespread use of electronic
payment instruments, private persons have approached the
MNB as the entity responsible for the issuance of money on
several occasions. They complained that they had been
unable to purchase certain products or services with cash;
they had to use some electronic payment instrument,
mostly a bank card. To mention but a few examples:
organisers of increasingly popular festivals like to issue
festival cards that can be loaded using cash or bank cards
at the festival location; this (and only this) card can be used
by festival visitors for payments; some airlines allow flight
tickets to be paid only through the internet using bank
cards; recently a café was opened accepting bank cards but
not cash. In all these cases, the question was whether it
was legitimate for retailers to refuse cash, so that persons
wanting to purchase the product or service concerned need
to have a bank card or need to load the card issued by the
event organizer for the purpose of payment.
It is no coincidence that the issue of mandatory acceptance
of cash has been raised just now. New non-cash payment
instruments have become common; in some market
segments their use has become so widespread that retailers
are no longer afraid that their competitiveness will suffer if
they accept only cashless payment. For them, this is safer
and cost effective; for their customers, it is safer, cheaper
and more convenient.
When cash was the only possible means of payment for daily
purchases, the provision of the Central Bank Act governing
the legal tender appeared to be self-explanatory.2 Today we
can choose from among several electronic payment methods
(deposit card, credit card, pre-paid card, reloadable card,
mobile payment, online payment, etc.). This situation has
put the provisions of the Central Bank Act on legal tender
in a new perspective and raised questions: What does the
legal tender status of banknotes and coins mean? Is it
compulsory to always accept any denomination of banknotes
and coins qualified as legal tender?
The European Commission has also addressed these
issues and other questions relating to legal tender and
issued a recommendation3 on this subject in 2010. The
position of the MNB on the mandatory acceptance of
legal tender is different from the recommendation of the
European Commission. The subject is particularly topical
as the Commission is expected to follow up on the
implementation of the recommendation in the first half
Zita Véber and Judit Brosch: Can cash payment be limited in a modern payment system?1
Is it acceptable that festivals allow payment by festival cards only but not by cash, and that some airlines will sell you flight
tickets only if you use your bank card to purchase online? In connection with the interpretation of the legal tender status of
banknotes and coins, different views have been voiced in recent years: whether cash or certain denominations of banknotes
and coins (large-denomination banknotes, small-denomination coins) can be rejected as means of payment for products or
services; whether it is acceptable that a product or service can be paid only through electronic payment instruments, and
whether cash surcharges can be applied. In the opinion of the Magyar Nemzeti Bank as the body responsible for the issuance
of forint banknotes and coins, the legal tender status of banknotes and coins does not mean their obligatory acceptance for
payment under all circumstances. In this article, we provide an overview of the various approaches to the legal tender status
and present the technical arguments which we believe support the position of the MNB.
1 We would like to thank Dr Ildikó Szeder Gubek for her useful legal comments.2 Act CCVIII of 2011 on the National Bank of Hungary, Article 27 (2).3 Commission Recommendation of 22 March 2010 on the scope and effects of legal tender of euro banknotes and coins (2010/191/EU).

MNB BulletiN • JaNuary 2013 53
CAN CASH PAyMENT BE LIMITED IN A MODERN PAyMENT SySTEM?
of 2013 and assess the need for any additional, legally
binding legislation.
From a legal aspect, we can establish that the retailer’s
refusal of cash payment and its practice of accepting
electronic payment instruments only does not violate the
provisions of the Central Bank Act. In this study, we
examine the meaning of legal tender status, review the
legislation of various countries to the interpretation of legal
tender and present the considerations that led the MNB − as
the entity exercising the right of issuer − to adopt its
position.
With the spread of ticket machines and vending machines accepting only coins, the question of interpretation of the concept of legal
tender arose quite some time ago. In this context, the Constitutional Court adopted the following position in response to a complaint
from a citizen to the effect that banknotes are also legal tender and that they must also be accepted as payment by operators of
parking meters:4 the “provision5 [in the Central Bank Act] does not rule out the possibility that the special characteristics of the various
payment methods shall prevail, within reasonable limits, when making payment for various goods or services. Instances where payment
can be made, alternatively or exclusively, at a machine is a special payment method”.
Box 1limitation of use of banknotes − Constitutional Court’s resolution
DeFiNitiON OF CASH AS legAl teNDeR iN tHe CeNtRAl BANk ACt AND iN tHe VieW OF tHe MNB ReSPONSiBle FOR tHe iSSuANCe OF CASH
In Hungary, the MNB has the right and responsibility to issue
banknotes and coins. In respect of the issue of cash, the
Central Bank Act contains the following key provisions:
Article 4 (2) The MNB shall be entitled to issue
banknotes and coins. Banknotes and coins − including
commemorative banknotes and coins − issued by the
MNB shall be legal tender of Hungary.
Article 27 (1) The Governor of the MNB shall declare
in a decree the issue of banknotes and coins, their
denominations and distinguishing features and their
withdrawal from circulation. The banknotes and
coins withdrawn from circulation shall lose their
function as legal tender as of the date specified in
the decree of the Governor of the MNB.
The Central Bank Act provides the following on the
acceptance of cash:
Article 27 (2) Each person shall be obliged to accept
banknotes and coins issued by the MNB at face value
for payments to be made in official Hungarian
currency until withdrawal.
This provision imposes the obligation to accept legal tender
at face value, i.e., if the payment is made in cash,
banknotes and coins shall not be accepted at a value
different from their face value (e.g. a 100-forint coin for the
value of 90 forints), while the provision quoted contains no
obligation as to the payment method. Nevertheless, in our
experience, the private persons complaining to the MNB as
issuer about their inability to pay with cash interpret Article
27 (2) of the Central Bank Act as requiring everyone to
accept cash for payment, that is, payment with any
denomination of banknotes or coins should be possible
under all circumstances.
Incidentally, the Central Bank Act itself also contains
provisions limiting cash payment to the effect that the
acceptance of coins in unlimited quantities is not obligatory
when cash payment is accepted. That is, economic agents
other than credit institutions and post offices are allowed
not to accept more than 50 coins in a single payment.
Article 27 (4) For cash payments, including cash
payments to a payment account, credit institutions
and institutions operating the postal clearing centre
shall be obliged to accept more than 50 coins.
4 Resolution No. 1063/B/2005. of the Constitutional Court.5 Act LVIII of 2001 on the National Bank of Hungary, Article 31 (2) as effective at the time.

MAGYAR NEMZETI BANK
MNB BullETIN • JANuARY 201354
CONCePt OF legAl teNDeR iN tHe legiSlAtiON OF DiFFeReNt COuNtRieS
Other countries have also given consideration to the
interpretation of the concept of legal tender in their acts
on the status of central banks or in other financial
legislation. In 2010, the European Commission set up an
expert group with the participation of the euro-area
Member States to discuss this issue. They established that
there were only a few Member States that had financial
legislation to define the elements of the concept of legal
tender, the reason being that national legislation consider
this concept to be ‘generally accepted’.6 In contrast,
outside the euro area, typically in Anglo-Saxon countries,
there are examples where the national legislation on legal
tender is more detailed and the central bank of the country
provides additional interpretation of the rules, publishing
its position on its website as the case may be.7
elements of the concept of legal tender
The comparison of the legislative provisions and
interpretations of the countries reviewed concerning legal
tender shows that the following three elements of the
concept of legal tender are present in the laws of most
countries.
Standardised medium of payment protected by the state
Legal tender is a standardised medium of payment issued
by the body authorised for this purpose8 in the denomination
structure corresponding to the requirements of cash
circulation. The issuer determines its physical appearance
and characteristics, issues it as a means of payment for
payment transactions, withdraws it from circulation and
protects it against counterfeiting with a number of laws and
printing processes. In modern economies, a standardised
cash system is a precondition for smooth payment
transactions.
Acceptance at face value
It is an important feature of the legal tender, that it must
be accepted at face value. This is stated in the legislation
of several countries.
Power to discharge monetary debt or obligation
The legal tender is the instrument for the payment of
monetary debt and obligations. Creditors may not refuse
the settlement of debt or obligations in cash except where
the parties agreed on other means of payment. A debtor
discharges a debt by transferring a means of payment with
legal tender status to creditor.
Acceptance of legal tender − can cash be rejected for payments?
There is also general consensus that the choice of the
payment method or instrument to be used for payment
depends primarily on the agreement between the parties,
just as the specification of other terms of payment (time,
location, etc.).
This follows from the principle of contractual freedom,
which means that the contractual parties are free to decide
whether to enter into contract and agree on all material
terms. In the scope of transactions between economic
entities (B2B transactions), the primacy of contractual
freedom is easy to understand as agreeing on the terms and
payment method is part of the bargaining process.
By contrast: in a retail transaction, would a retailer be
obliged to accept cash payment when a customer insists
on paying in cash or based on contractual freedom may
the retailer decide not to make a deal (informing customers
in advance that only cards are accepted at the shop)? In
other words: does legal tender mean that it must be
accepted at all times, except where the parties agreed
upon the use of a different payment method or payment
instrument in advance? On this issue, the position of the
Anglo-Saxon countries and four euro-area Member States
(Finland, the Netherlands, Ireland and Germany) is
different from the view of the majority of euro-area
countries.
The U.S. legislation defines legal tender as follows: “United
States coins and currency are legal tender for all debts,
public charges, taxes, and dues.”9 In other words, the legal
tender status means obligatory acceptance only in respect
of payments under contracts already concluded, discharging
existing debt or obligations (naturally except in cases where
parties had previously agreed to use some other payment
method or payment instrument). The relevant British
6 ELTEG (2010).7 http://www.federalreserve.gov/faqs/currency_12772.htm, http://banknotes.rba.gov.au/legaltender.html, http://www.royalmint.com/aboutus/policies-and-guidelines/legal-tender-guidelines8 Central banks are authorised to issue banknotes, while in a number of countries the Ministry of Finance has the right to issue coins.9 Article 31 U.S.C. 5103 of Coinage Act of 1965.

MNB BulletiN • JaNuary 2013 55
CAN CASH PAyMENT BE LIMITED IN A MODERN PAyMENT SySTEM?
legislation also contains a similar provision in respect of the
discharge of debt in legal tender.10
Based on these rules, the central banks of Anglo-Saxon
countries have clearly taken the view that retailers may not
be obliged to accept cash unless debt has been incurred.
“There is, however, no Federal statute mandating that a
private business, a person, or an organisation must accept
currency or coins as payment for goods or services” − the
Fed interprets the legal tender provisions of the Coinage
Act on its website.11 On the website of the Australian
central bank a similar position is stated.12
Four of the euro-area Member States (Finland, the
Netherlands, Ireland and Germany) are also of the opinion
that the legal tender provision applies to contracts already
concluded; therefore, the retailer is not obliged to accept
cash as payment for products or services.13 Under the
regulations effective in the Netherlands, a retailer may
refuse the use of cash for making payment if it is clearly
posted at the entrance of the shop that only cards are
accepted for payment.
According to the majority of euro-area Member States (with
the exception of the four countries mentioned previously),
however, the retailer is obliged to accept cash if the
customer wants to pay in cash. This view is reflected in the
Commission recommendation referred to above, which
states in point 2: “The acceptance of euro banknotes and
coins as means of payments in retail transactions should be
the rule. A refusal thereof should be possible only if
grounded on reasons related to the ‘good faith principle’
(for example the retailer has no change available)”.14 They
explained their position arguing that while in B2B
transactions the parties are deemed to have an equivalent
negotiation power, therefore the choice of the payment
method and payment instrument may be based on
contractual freedom, in business to consumer (B2C)
relationships the bargaining positions of the parties are not
equivalent, therefore the principle of contractual freedom
can be limited. In other words, retailers cannot decide at
their discretion and they must accept cash if the customer
insists on paying in cash.
As the introduction stated, the MNB as issuer has adopted a
position close to the views of Anglo-Saxon countries and the
four aforementioned Member States15 in considering that
the acceptance by a retailer of only electronic payment
instruments to pay for a product or service is not against
the Central Bank Act. Even though the exclusive acceptance
of electronic payment methods may be constrained by civil
law or consumer protection considerations in certain cases,
the examination of those considerations is beyond the
competence of the MNB.
In the following, we look at the considerations behind the
MNB’s decision to promote electronic payment instruments
and not to prohibit their exclusive use.
BeNeFitS OF eleCtRONiC PAyMeNt iNStRuMeNtS FOR tHe NAtiONAl eCONOMy
Electronic payment methods have a number of benefits
over cash payment; in the following, we highlight three of
these. The traceability of transactions, efficiency and
security are the key reasons that electronic payments are
more beneficial for society than cash payments. Using
these three dimensions, we present the features of cash
that lead to restrictions on the acceptance of cash in
European countries including Hungary. We also discuss
cases where the rule applied does not limit the use of cash
payment generally, only the acceptance of certain
denominations of coins or banknotes.
Restriction of the use of cash to combat the shadow economy
Cash is anonymous; this is why it is the ideal means of
payment in the black economy. In recent years, the MNB
has published several studies analysing the causes of the
high cash usage in Hungary in international comparison,16
concluding that the high cash intensity of the Hungarian
economy was partly due to the shadow economy as cash
transactions are easier to conceal from the tax authority.
For reasons of whitening the economy and combating illegal
activities, the MNB has urged the restriction of the use of
10 Legal tender has, however, a very narrow technical meaning in relation to the settlement of debt. If a debtor pays in legal tender the exact amount he/she owes under the terms of a contract (and in accordance with its terms), or pays this amount into court, he/she has good defence in law if he/she is sued for non-payment of the debt. http://www.bankofengland.co.uk/banknotes/Pages/about/faqs.aspx.
11 „There is, however, no Federal statute mandating that a private business, a person, or an organization must accept currency or coins as payment for goods or services.” http://www.federalreserve.gov/faqs/currency_12772.htm, http://www.richmondfed.org/faqs/currency/
12 http://banknotes.rba.gov.au/legaltender.html13 See ELTEG (2010).14 Commission Recommendation of 22 March 2010 on the scope and effects of legal tender of euro banknotes and coins (2010/191/EU).15 In addition to Germany, Finland, Ireland and the Netherlands, Scandinavian countries are also pioneers of the use of electronic payments, which is
reflected in their legislation (e.g. Leo Van Hove, 2003).16 Odorán and Sisak (2008), Bódi-Schubert (2010).

MAGYAR NEMZETI BANK
MNB BullETIN • JANuARY 201356
cash through the promotion of electronic payment
instruments in its publications as well as in government
forums.
Even though the majority of euro-area countries considers
the acceptance of cash mandatory for both the settlement
of monetary obligations and the execution of retail
payments, according to recital (19) of Council Regulation
(EC) No 974/98 on the introduction of the euro, the use of
cash can be restricted for public reasons: “limitations on
payments in notes and coins, established by Member States
for public reasons, are not incompatible with the status of
legal tender of euro banknotes and coins, provided that
other lawful means for the settlement of monetary debts
are available.”
A number of the Member States have enacted rules limiting
payment in cash above a certain ceiling in transactions
between businesses and/or private persons and requiring
the use of electronic payment methods.17 Furthermore,
some countries require taxes to be paid by bank transfer,
and public sector payments and transfers are also made
exclusively through electronic means of payment.18 In
Denmark, in addition to electronic payment being
compulsory above DKK 10,000 (approx. HUF 400,000), both
providers and purchasers are incentivised to comply as
both are held jointly and severally liable for any VAT or
other tax fraud.19 In Italy, incentives additional to the
limitation of cash payments have been enacted to promote
the spread of electronic payments. Since October 2012,
public administration bodies and public service providers
have been required to accept electronic payment methods
and from 2014 on every economic entity offering products
or services will be obliged to accept payment by debit
card.
The regulation entered into force on 1 January 2013 limits
cash payments above HUF 1.5 million in Hungary as well,
but only between persons regularly engaging in economic
activities.20
There are also regulations21 or practices restricting cash
payments to or from the Hungarian government:
1. The Act on the Rules of Taxation requires entities
regularly engaging in economic activities to make
cashless payments.22
2. The overwhelming majority of the remuneration of
public servants and government officials is paid into
payment accounts.23
3. Some public institutions limit the cash payments of
households; some universities, for instance, only accept
payments from students electronically and they pay
scholarships exclusively into bank accounts.
It should be noted, though, that one third of the payments
by and to the government, some 100 million transactions a
year, continue to be carried out in cash rather than
electronically.
The examples above indicate that states, including Hungary,
limit cash payment to combat the shadow economy, and
this effort is supported if the government promotes the
wide-spread use of electronic payment instruments in the
retail sectors.
the costs of cash payment are high
According the MNB’s survey of the social costs of payment
instruments,24 the Hungarian society could save some HUF
100 billion annually if cash payments were replaced by
electronic transactions and similar usage ratios of payment
methods were reached as in the Northern European
countries. At first sight, cash payment has no cost if
regarded from the aspect of the customer and only the
costs incurred at the time of payment are taken into
account. However, the study also assessed all social costs of
the electronic payment methods and cash payment and
demonstrated that the costs of cash payment exceed the
costs of electronic payment.
The fix costs of cash payment are lower than those of
electronic payment but the costs relating to cash payment
increase proportionately with the volume of cash
transactions (production, transportation, storage, control)
17 For more detail, see Turján et al. (2011), Odorán and Sisak (2008).18 MNB (2012b).19 If the customer is unable to pay electronically, he is relieved from the joint and several liability as long as he notifies the tax authority of the cash
transaction. See: Opinion of the European Central Bank on limitations on cash payments (CON/2012/37) Denmark, 10.5.2012, pdf20 Subsection (3a) of Article 38 of Act XCII of 2003 on the Rules of Taxation.21 Pursuant to Article 63 (3) of Act LXXXV of 2009 on the Pursuit of the Business of Payment Services, the mandatory use of any payment method can
be prescribed only in an Act of Parliament or government decree.22 Article 38 (1) of Act XCII of 2003 on the Rules of Taxation.23 Article 79/A of Act XXXIII of 1992 on the Legal Status of Public Servants, Article 143 of Act CXCIX of 2011 on Public Service Officials.24 Turján et al. (2011).

MNB BulletiN • JaNuary 2013 57
CAN CASH PAyMENT BE LIMITED IN A MODERN PAyMENT SySTEM?
while the unit cost of electronic payments on the level of
the national economy decreases with the increase in the
number of payment transactions. When choosing a payment
method or payment instrument, cost efficiency is an
important aspect for economic agents. Consequently, in the
future it is expected that more retailers will refuse payment
in cash. In recent years, the card acquiring network has
expanded dynamically but it is still considerably below the
level seen in most EU countries.25
The high cost of using large volumes of coins for payment
has been evident for quite some time. Consequently,
regulations issued by most central banks allow the limitation
of payment with coins. In the euro area Member States26
and also pursuant to the Hungarian Central Bank Act,27
parties are not obliged to accept more than 50 coins in cash
payment transactions with the exception of the issuing
bodies and certain designated institutions with a key role in
cash distribution (in Hungary: credit institutions and post
offices). The regulations in Australia, Canada and the UK
also limit the mandatory acceptance of certain coin
denominations, setting different ceilings for payment with
the different denomination coins28 (e.g. in the UK, 50p coins
can be used to settle payment up to 10 pounds).
The use and distribution of small-denomination coins is very
costly for economic agents in almost every country.
Consequently, the possibility of ceasing the issuance of or
withdrawing from circulation small-denomination coins not
circulating any more in the economy arises time and time
again (for more details, see Box 2).
25 MNB (2012a).26 Pursuant to Article 11 of Council Regulation 974/98/EC.27 Article 27 (4) of the Central Bank Act.28 http://laws-lois.justice.gc.ca/eng/acts/C-52/page-1.html29 Act III of 2008 on the Rules of Rounding Required as a Consequence of the Withdrawal of 1- and 2-forint Coins from Circulation.30 For more detail see Leszkó (2009).31 See ELTEG (2010): This is also the opinion of experts of countries with high per-capita GDP where the purchasing power of 1 and 2 eurocent coins is
so low that these denominations have effectively become ‘single-use’.
The issue of the use of small-denomination coins is also linked to the high cost of cash payment. Because of changes in price levels
and price structures, the problem every country encounters from time to time is that the purchasing power of small-denomination
coins drops too low, they no longer take part in cash circulation due to their low value, they are hoarded in jars, customers do not
re-introduce them into circulation: they increasingly become ‘single-use’. They are used mostly for the exact settlement of small-value
purchases. Consequently, the volume of issue of these denominations is by far more than that of larger denomination coins and the
cost of their production, distribution, processing and storage is very substantial. This process led the MNB to withdraw 1- and 2-forint
coins from circulation in 2008. Retailers did not re-price their products after the withdrawal of these coins; instead, they rounded the
final sum payable on goods in line with the rules laid down in the Act on Rounding.29 After withdrawal, the MNB carefully examined
the potential inflation effects of this measure, but no demonstrable price increasing effect was found. According to household surveys,
the overwhelming majority of the population supported the withdrawal of the inconvenient and costly small denominations that made
purses heavy. Small denomination coins were withdrawn in a number of countries in a similar manner.30
In some of the euro -area Member States the role of 1- and 2-cent coins is very similar to that of the 1- and 2-forint coins in Hungary.
Therefore, before introducing the euro, two euro-area Member States (Finland and the Netherlands) decided not to issue small-
denomination coins and to use rounding rules for payments. This does not mean, however, that 1- and 2-cent coins are not legal tender.
All it means is that the Finnish and Dutch central banks do not issue 1- and 2-cent coins, cashiers are not obliged to give change of 1
and 2 cents when they apply the rounding rules; however, if somebody (particularly a foreigner) wants to pay with those denominations,
the coins are accepted.
As small-denomination coins are responsible for a very substantial part of the cost of coin distribution, other countries in the euro area
also consider from time to time the possibility of withdrawing these denominations from circulation and introducing rounding rules.
However, in the expert group of euro-area Member States31 the majority was of the opinion that all remaining euro-area Member States
should refrain from withdrawing small denominations and introducing rounding rules. The main argument was that rounding rules
Box 2Small-value coins

MAGYAR NEMZETI BANK
MNB BullETIN • JANuARY 201358
Security
Security considerations may also motivate retailers to
refuse payment in cash. In addition to the personal safety
of persons working in the shops, the safekeeping, handling
and transportation of cash requires special security
equipment due to the risk of robbery. These investments
are not necessary when electronic payments are used. The
insurance premium is also lower for the business if no cash
is handled.
In the case of payment of large amounts in cash and in
respect of businesses operating at a large distance from any
credit institution or other deposit facility (post office) that
are unable to deposit cash receipts in their bank account on
the same day, refusal of cash payment is allowed based on
the ‘good faith principle’ even in the countries where the
refusal of cash is not acceptable in different circumstances.32
For a business, holding cash for the sole purpose of having
change for cash payments is a security risk. This
consideration is appreciated by the French regulations,
which make the acceptance of cash mandatory only if the
payer discharges his obligation by paying the exact amount
due.33
Sometimes customers find it difficult to pay with large-
denomination banknotes because retailers refuse to accept
them for security and/or efficiency reasons. Based on the
proportionality principle, the refusal of payment in large-
denomination banknotes is allowed in the jurisprudence of
most countries (for more details, see Box 3).
contradict the notion of legal tender of 1- and 2-cent coins. In its aforementioned recommendation of 2010, the European Commission
reflected the majority position. In view of the high social cost saving that would result from the withdrawal from circulation of small-
denomination coins, and the fact that rounding had no inflation effect in the countries that opted for it, the Commission will hopefully
change its position in this matter.
Serving customers who want to buy small-value goods using high-denomination banknotes, particularly early in the morning, is difficult
for retailers as they have already deposited their previous day’s receipts in their bank account for security and financial management
reasons and hold only change at the opening of the day. Therefore in most countries’ laws, based on the proportionality principle,
retailers are not obliged to accept large-denomination banknotes if their value is not in proportion to the amount to be paid.34
When withdrawing cash from an ATM, the withdrawer has no control over the denomination structure of the cash dispensed.
Consequently, the MNB requires in its decree credit institutions and post offices to exchange on one occasion a maximum of 50 pieces
of banknotes or coins into different denomination banknotes and coins, to make sure that economic agents have the appropriate
denomination of banknotes and coins necessary for their cash transactions.35 Most credit institutions and post offices offer this service
free of charge to their clients.
The denomination structure of euro banknotes includes two large denominations, 200 and 500 euro banknotes, the value of which far
exceeds the customary value of everyday payments. According to the ECB survey on the use of cash, over half of the population of
euro-area Member States have never seen a 500 euro banknote, and 44 per cent have never held a 200 euro banknote in their hands.36
As the public very rarely if ever sees such banknotes, their acceptance is uncertain. Consequently, the euro area Member States started
Box 3Acceptance of high-denomination banknotes
32 See ELTEG (2010).33 Art L112-5 du Code Monétaire et Financier: En cas de paiement en billets et pièces, il appartient au débiteur de faire l'appoint. The French financial
laws contain no definition of legal tender status. In the case of payment with banknotes or coins, the Act quoted above requires the debtor to pay the exact amount due. French criminal law provides for the offence of refusal to accept payment in cash, but this provision is enforced only if the debtor would pay the exact amount in cash and the merchant refuses to accept it. Such a court case is described at the following link: http://www.avocat-lingibe.com/question-reponse-juridique/entreprise/consomation-25.html.
34 See ELTEG (2010).35 Decree No. 11/2011. (IX. 6.) of the Governor of the MNB on the processing and distribution of banknotes and on technical tasks relating to the
protection of banknotes against counterfeiting.36 For more detail see ECB (2011).

MNB BulletiN • JaNuary 2013 59
CAN CASH PAyMENT BE LIMITED IN A MODERN PAyMENT SySTEM?
The above examples show that to some extent the
authorities of each country reviewed acknowledge the
attempts of businesses to restrict the acceptance of cash as
long as it is justified by security or efficiency reasons.
Within the euro area the majority of Member States
consider that the acceptance of cash should be restricted
solely on grounds of security. In addition, based on the
principle of good faith, they consider it legitimate to refuse
cash payment because the seller is temporarily short of the
required change.40 Nevertheless, endeavours by the
government to limit cash payments to combat the grey and
black economy have become more pronounced in the past
one year or two in almost every Member State.
ARe CASH SuRCHARgeS ACCePtABle?
The payment services directive41 (hereinafter referred to as
the ‘Directive’) provides that in order to encourage
competition and the use of efficient payment instruments,
Member States may decide at their discretion to forbid or
limit the levying of charges for the use of a certain payment
instrument by retailers.
The survey conducted in 2011 on the transposition of the
Directive by the Member States42 reveals a mixed picture on
whether Member States made use of the possibility to
forbid or limit the levying of charges in legislation. Half of
the Member States excluding Hungary (e.g. Austria,
Denmark, France, Italy, Sweden) specifically prohibited
such surcharges, two of them did so only in respect of
payment by card though. Thirteen other Member States
(e.g. Belgium, the Netherlands, Germany, Spain, the United
Kingdom), however, did not make use of this option
provided in the Directive, while some of them allow such
charges to be imposed in proportion to the actual costs
incurred by the use of the payment instrument concerned.
At the time of its entry into force on 1 November 2009, the
Act on Payment Services43 transposing the Directive into
Hungarian law was lenient on the imposition of charges and
costs. However, in the amendment of the Act effective as
of 1 January 2011 the legislator prohibited the imposition of
charges or costs in order to promote the use of cash-
substitute payment instruments.
Article 36 (4) The payee may not impose any
charges, costs or other payment obligations for the
use of a cash-substitute payment instrument.
However, the Directive does not discuss whether charges
may be imposed in the case of cash payment.
The issue of cash surcharges divided the experts of euro-
area Member States. Some considered that surcharging cash
is not compatible with the concept of legal tender
(obligation of acceptance at face value) as set out in the
Treaty on the Functioning of the European Union. Another
group of the Member States consider, however, that the
mandatory acceptance of legal tender only concerns the
payment of a debt under a contract, and thus it has no
bearing on the formation of the contract whereby all
material conditions (including the price, with the possibility
of a surcharge for a cash payment) are agreed.44
The use of electronic payment methods can be efficiently
promoted by allowing the payee to charge a fee
corresponding to its direct costs relating to the cash
payment as long as there are other payment methods (such
as credit transfer) available as well. It would also be
desirable in the relationship of payment service providers
and their customers if every customer bore the costs and
charges of their own payment service provider, including
customers making cash payments to payment accounts
37 http://www.dnb.nl/en/news/news-and-archive/nieuws-2010/dnb235121.jsp38 http://www.richmondfed.org/faqs/currency/39 See ELTEG (2010).40 See ELTEG (2010).41 Directive 2007/64/EC of the European Parliament and of the Council on payment services in the internal market.42 http://ec.europa.eu/internal_market/payments/framework/psd_study_en.htm43 Act LXXXV of 2009 on the Pursuit of the Business of Payment Services.44 See ELTEG (2010).
to consider whether retailers could refuse to accept payment with these banknotes. In the Netherlands, for instance, retailers are not
required to accept large denomination banknotes if this fact is clearly indicated by means of a sticker at the entrance to the shop or
filling station.37 The US has adopted a similar practice in respect of large-denomination banknotes.38 The majority of euro-area Member
States, however, reject this practice and accept the refusal of large-denomination banknotes only on an occasional basis under the
proportionality principle.39
MAGYAR NEMZETI BANK
MNB BullETIN • JANuARY 201360
using postal inpayment money orders (yellow cheques).
However, officially there is no uniform position on the issue
of bearing the costs and charges of cash payment. For
instance, the Act on Consumer Protection prohibits public
utility companies from charging a separate fee for the
payment of bills through postal inpayment money orders as
of 29 July 2012,45 and the Act on Electronic Communications
imposes the same prohibition on electronic communications
service providers as of 17 November 2012.46 The law only
allow service providers to give discounts to clients who
choose a method for paying their bills that is less costly for
the service provider. Because of this restriction, utility
companies incorporate the cost of cash management into
their rates and make all clients pay for it, including the ones
using cheaper electronic payment methods.
The evolution of a more efficient payment structure
requires that consumers choosing between payment
methods are aware of their respective costs. The prices of
different payment methods must provide incentives to
users to choose the effective payment structure. This in
turn requires that, on the one hand, the fee structures of
payment service providers reflect costs and are not
distorted through cross-subsidisation between products and
services. On the other hand, the costs of cash payment
should be borne by those who make use of that means of
payment.
SuMMARy
Limiting cash usage is reasonable in the current economic
environment and possible under Hungarian law. The MNB is
in support of the broader use of electronic payment
instruments with an eye to combating the grey and black
economy, promoting efficient payment instruments and
enhancing security. Consequently, the MNB as the issuer of
forint cash is not against retailers accepting exclusively
electronic payment instruments.
In respect of payments to and from the government and the
regulation of B2B cash transactions Hungary has already
taken steps in this direction, but the cash intensity of the
economy is still high in a European comparison. This is why
further measures are needed to promote the spread of
electronic payments. For instance, payees should be
allowed to charge a fee corresponding to their direct costs
relating to the cash payment if there are other payment
methods available as well. Furthermore, in our opinion
consideration should be given to rewording Article 27 (2) of
the Central Bank Act, which regulates the acceptance of
banknotes and coins, so that the rule unambiguously
pertains to the obligatory acceptance of banknotes and
coins at face value rather than the acceptance of cash in all
circumstances.
We do not think that cash as a payment instrument will
disappear in the foreseeable future. Cash has qualities that
remain important for society. For instance, at this point
many people find it easier to manage their monthly
expenditures if the cash in their purse limits overspending
while others find the anonymity of cash important to
protect their privacy. This may be one of the reasons that
even though the overwhelming majority of Hungarian
households have bank accounts, many people still withdraw
their regular income received on the bank account and
settle their utility bills and pay for their daily purchases in
cash.47 Households that have no bank accounts obviously
cannot obtain any regular or occasional income except in
cash. There is yet another consideration that will keep cash
usage necessary and legitimate in the longer term: in
Hungary there are substantial differences between
communities, depending on their population size and
region, in terms of their access to the infrastructure
required for cashless payment (bank branches, POS
terminals).48
Based on the experience of other countries, however, the
spread of electronic payment methods is a clear tendency,
particularly because they are more efficient and cheaper.
The role of cash is likely to decrease in payments in
Hungary as well, if not in terms of volume, but in terms of
proportion.
ReFeReNCeS
bóDi-scHubert anikó (2010), “A készpénz szerepe a rejtett
gazdaságban − kvalitatív eredmények és továbblépési
lehetőségek”, [The role of cash in the hidden economy:
Quantitative effects and further opportunities], MNB
Kutatási jelentés, február.
euro leGal tenDer exPert GrouP (2010), Report of the Euro
Legal Tender Expert Group (ELTEG) on the definition, scope
and effects of legal tender of euro banknotes and coins,
Euro Legal Tender Expert Group, Brussels. URL.
45 Act CLV of 1997 on Consumer Protection, Article 8.46 Act C of 2003 on Electronic Communications, Article 128 (4).47 For more detail see Takács (2011).48 For more detail see Helmeczi (2010).

MNB BulletiN • JaNuary 2013 61
CAN CASH PAyMENT BE LIMITED IN A MODERN PAyMENT SySTEM?
euroPean central bank (2011), “The use of euro banknotes −
results of two surveys among households and firms”, ECB
Monthly Bulletin, April.
HelMeczi, istván (2010), “The map of payments in Hungary”,
MNB Occasional Papers, 84.
leszkó, erika (2009), “Rounding is not to be feared”, MNB
Bulletin, July.
MNB (2012a), Report on Payment Systems.
MNB (2012b), Report on Financial Stability, November.
oDorán, rita anD balázs sisak (2008), “Cash demand of the
Hungarian economy − is the shadow economy still running
smoothly?”, MNB Bulletin, December.
takács kristóF (2011), “A magyar háztartások fizetési
szokásai”, [Payment habits of Hungarian households], MNB
Occasional Papers, 98.
turJán, anikó, éva Divéki, éva keszy-HarMatH, GerGely kóczán
anD kristóF takács (2011), “Nothing is free: A survey of the
social cost of the main payment instruments in Hungary”,
MNB Occasional Papers, 93.
van Hove, leo (2003), “Making electronic money legal
tender: pros & cons”, URL.

MNB BulletiN • JaNuary 201362
− Can you tell us a bit about your research interests and some current projects you are working on?
I am generally interested in the interaction between financial markets and macroeconomics. I also have an interest in
Bayesian time series methods. I have several ongoing projects; some are old and some are new. One project, which I
am excited about, is thinking about sovereign debt crises and bailouts. It is motivated by the current situation in Europe.
It’s a joint work with Francisco Roch, who is now working at the IMF, after having been my PhD student at the University
of Chicago. We are combining existing debt crisis models, as developed by Cole and Kehoe1 as well as Arellano2, and
asking whether there is a potential role for bailouts, and what they will imply. There are many questions one could ask,
obviously. We focused on a particular one: could a debt purchase guarantee as perhaps envisioned by the ECB lead to
the selection of a good equilibrium among several, and how should it go about it? In the model, there is a possibility of
a buyer’s strike. Then, since there is a possibility that for a co-ordination failure in the future, where buyers just refuse
to buy the debt of a country, current buyers will take that into account, and that can lead to yields being very high
compared to a situation without the possibility of such a buyer’s strike. This feature of the model captures the view by
some, that evil speculators are currently ganging up on some countries in Europe right now and driving up yields, and
that therefore policy makers have to step in. In our model, there is nothing evil, of course: debt buyers simply have to
take into account that the country cannot roll over its debt in the future. The buyer’s strike itself can be self-fulfilling:
if buyers go on strike, then the country defaults, and because the country defaults, then going on buyer’s strike was a
good idea in the first place, since buyers will not get their money back from a country that just defaulted. This
coordination problem gives rise to multiple equilibria. We introduce a bailout agency into the model, which really is
simply a large investor. The bailout agency seeks to earn the market return just like everybody else, but it’s large, right?
So it can promise to be there even if nobody else is there to buy the debt of the country. So, if everybody else goes on
a buyer’s strike, this agency does not go on strike, and if their intervention is large enough, the country will not default,
and the other buyers find that they should not have been on strike. The intervention solves the original co-ordination
problem and gets to the good low-yield, no-strike equilibrium. Our bailout agency is not losing money or is not unduly
profiting from the situation: they are just getting the market return on their portfolio. We then analysed how large the
interview with Harald uhlig(katalin Szilágyi and istván kónya)
Harald Uhlig is Professor at the Department of Economics of the University of Chicago since
2007 and chairman of that department since July 2009, after having taught at Princeton,
Tilburg University and the Humboldt Universität Berlin. His research interests are in
macroeconomics, financial markets and Bayesian econometrics, and in particular at the
intersection of these three. He has served co-editor of Econometrica from 2006 to 2010.
He is a consultant of the Bundesbank and the Federal Reserve Bank of Chicago. He is the
current chairman of the CEPR business cycle dating committee. He is a fellow of the
Econometric Society. He is a research fellow of the CEPR and a research associate of the
NBER. In 2003, he received the Gossen Preis of the German ‘Verein für Socialpolitik’.
1 cole, HarolD l. anD tiMotHy J. keHoe (2000), “Self-Fulfilling Debt Crises”, Review of Economic Studies, vol. 67 no. 1, pp. 91−116.2 arellano, cristina (2008), “Default Risk and Income Fluctuations in Emerging Economies”, American Economic Review, vol. 98 no. 3, pp. 690−712.

MNB BulletiN • JaNuary 2013 63
INTERVIEW WITH HARALD UHLIG
promised intervention would have to be. We also wanted to know at what point the bailout agency should get out
altogether, as the situation is so bad that the country will default for fundamental reasons, not for the sunspot3 reasons.
It turns out that there’s a range of debt where the bailout guarantees must become very large very quickly, almost to
the point where this agency has to buy the entire newly issued debt of that country. A bit beyond that, it should get
out completely though, because if the debt burden is too high to begin with, the country will default for fundamental
reasons, even without the possibility of a buyer’s strike. The lesson is that such an agency can help up to a point, but
after that point, it should get out of it. The second lesson is that it has to do so at the right prices, taking into account
that the country may still default due to fundamental reasons. The third lesson is that if the agency gets rid of this
sunspot rollover risk problems, the yield will initially fall, but that then leads the country to borrow more and debt
levels rise. To some degree, the default due to the coordination problems of a buyer’s strike is replaced by fundamental
default, because the country will have accumulated too much debt. The bailout agency eliminates the coordination
problem equilibrium, but it will lower the default probabilities only somewhat. So if you want to get rid of default rates,
that won’t do the trick, but if you just want to get rid of the bad sunspot equilibrium, then this is something that may
be reasonable to do. There are many more questions that one could ask, starting from this framework, and I hope I will
get to think about them in the future.
− You probably have strong views on the current euro crisis. Do you have any thoughts you could share with us on
this topic?
For full disclosure: my views certainly go beyond what one can solidly conclude based on serious research. But here
they are. I don’t quite like where the debate is going, I find it to be rather confused. Some say we have to save the
euro. But what exactly does that mean? Duisenberg has been asked in the past what it means for the euro to fail. He
pointed to keeping inflation stable as the single measuring stick. When people now talk about “saving the euro”, I don’t
think that this is what they mean. Is it saving the financial system in the Eurozone then? That actually is part of the
mandate of the ECB. Does “saving the euro” mean that you want to save countries from defaulting? Where is the
connection? Does “saving the euro” mean you want to prevent countries from exiting the Eurozone? Why would it be so
terrible if, say, Greece joins Denmark and other European nations as being outside the Eurozone? How is that
endangering the euro? In any case, it would be nice if that got clarified: only then can one find the appropriate policy
response. Here is one example. If you want to keep the currency stable, then it is probably a bad idea to print lots of
euros and distribute them against bad collateral: this can create inflation down the road or losses for the central bank.
So if you are really worried about a stable currency, if you use the measuring stick of Duisenberg (Wim Duisenberg, first
President of the ECB between 1998 and 2003 − the Editor.), then that’s not what you should be doing. But clearly that is
what the ECB is doing, so Draghi (Mario Draghi, President of the ECB since November 2011 − the Editor.) and the ECB
decision-makers apparently think about it in a different way. Do they have the financial system in mind; is that what
they want to keep stable? I don’t think so either. In the long-term refinancing operations, the ECB pretty much
encouraged all the banks to purchase the debt of their own country. Now if you have a fragile bank in Greece, the last
thing you ought to buy is Greek bonds. If you have a fragile bank in Spain, the last thing you ought to buy are Spanish
bonds, right? you should encourage the bank to get rid of those Spanish bonds and buy German bonds instead, if you
want to keep the bank stable! Instead, this is done to lower the yields on Spanish sovereign bonds and to prevent Spain
from defaulting or from exiting the Eurozone. But seriously: would Spain or Greece wish to exit the Eurozone, if it came
down to it? I don’t think they would. I think it would be bad for Spain, I think it would be bad for Greece to get out of
the Eurozone. They get a lot of transfers while they are in the Eurozone, and contracts would be written in terms of
euro anyhow: they have no incentives to go out. The one country that has incentives to get out of the Eurozone is
Germany, because it is guaranteeing and ultimately paying a lot of money to maintain the current situation. To me, that
would be the end of the Eurozone and the end of the euro as we know it, if Germany decides to exit. So, it seems the
ECB is playing with fire by starting to bail out Southern European countries, and bailing out the banking system there:
this all could encourage a German exit. The ECB is in violation of the original treaties, it’s a violation of the Maastricht
treaty, and their policy is a violation of the dominant authority of parliaments on fiscal matters. Parliaments should set
expenditure and taxes, not the European Central Bank. It could easily happen that the European Constitutional Court
decides that the ECB is encroaching on the budgetary authority of the parliaments. It could lead to a situation where
3 Sunspot means that the triggers for interactions between economic agents’ behaviour and, consequently, possible equilibria are random rather than fundamental events.

MAGYAR NEMZETI BANK
MNB BullETIN • JANuARY 201364
Germany has no choice but to exit, if the German Constitutional Court agrees that such a violation has taken place.4
So, if Draghi wants to save the euro, then that’s not what he wants to happen. If Draghi wants to be on the safe side,
he shouldn’t play with fire here, but he is. So, clearly he has some rather different objective in mind. I described one
piece of my research, where one can perhaps view bailouts and guarantees as a way to achieve a good equilibrium,
ruling out the buyer’s strike equilibrium. One can think of the ECB as being this large outside investor that can
guarantee this outcome. If the ECB wants to make that argument, then they should be very clear about it. But then,
they have to be very sophisticated, they have to be very careful. They have to make sure that the only thing they do
is to rule out the sunspots. But giving handouts to banks that have gambled with their assets and then lost, or
transferring money to countries that don’t get their matters sorted out sets all kinds of bad incentives. you create moral
hazard down the road. I believe that Spain was well on its way to try to get its fiscal house in order. But now the ECB
says, don’t worry; we’ll buy your bonds. But then, politically, inside Spain, it is going to be impossible to argue for cuts
because you know the ECB is going to buy the bonds if all else fails. Who in his right mind in Spain will now argue in
favour of the necessary, but tough political choices, if an outside rescue is available? But somebody has to pay for that,
these resources do not come for free. Personally, I am therefore in favour of going back to the original rules and to say:
well, if a bank falls, let’s not worry too much about it. We have a resolution mechanism for failing banks that has existed
and worked for a long time. If you have a solvent, but illiquid bank, by all means lend to it, but if the bank is insolvent,
you need to take it over, clean out the shareholders and bondholders, and see what you can do with the remaining
assets, possibly finding a willing buyer. If a country is insolvent, you don’t bail it out, you let it default. Default of a
country is nothing terrible; it’s not the end of the world. It happens. Investors that own these bonds lose money, but
that is how markets work: sometimes you gain, sometimes you lose. If we indeed went back to the original rules and
allowed such defaults, we would probably see a thunderstorm. It would be pretty bad for a while, but then the problems
would clear out and we would continue with healthy banks, healthy fiscal balances, no looming threat of sort of a large
debt purchase by the ECB and so forth. Then, everything would be fine again. A brief period in which things are pretty
bad and then back to a good situation: to me, that sounds much better than to keep kicking the can down the road,
creating all the moral hazard and keeping all those zombie banks alive. Look at Greece. They tried to do the Greek
bailout, but it is clear that Greece is going to default again or that more money needs to be poured into it from the
outside. Why? Do it once, do it right, get it over with, proceed to the future: that is my view.
− Maybe we can move back to your favorite research area. It’s about recent efforts trying to improve DSGE models
(broadly interpreted) using financial frictions and other types of frictions. Do you think this is the right way to go,
preserving the core and fiddle with additional bells and whistles, or do you see something very different happening
in the near future? Or should something very different happen?
I believe that one should let many flowers bloom. So whenever somebody comes up with an interesting new way to
approach a problem, I’m excited. George Soros has created an Institute for New Economic Thinking. Good. I like new
economic thinking. New economic thinking is always a good idea, that’s what we ought to do as researchers. But it’s
hard, right? And, you know, just because something is new does not automatically mean it is good. So, what we really
need is good new economic thinking. If somebody comes up with something new and fantastic, go for it. But while some
of us are doing this, we should also see whether we can amend the approaches used so far. There was a reason it was
successful: it may well be possible to fix it a bit, and that may be the better way forward. So, let some try this, let
some try that and let’s have a race and let’s see what works best in the end. Currently, many people in the profession
try to tackle this from many different angles. There are many approaches on the table, and that makes it fun for
researchers, it makes it confusing for users of research, and certainly more confusing to the outside world, but there
are lots and lots of approaches that people try for different questions.
− Do you see any of these new approaches having a chance to become as successful as the current paradigm?
The question of “success” always needs context. One is able to do a number of things reasonably well within the current
paradigm, with the current set of models. These models don’t live in some abstract space; the models always have a
purpose. Economists are there to answer questions, and different economists answer different questions: therefore,
4 The interview was made in early August. The German Federal Constitutional Court gave the green light for the ECB’s bailout fund, the European Stability Mechanism (ESM), in mid-September.

MNB BulletiN • JaNuary 2013 65
INTERVIEW WITH HARALD UHLIG
different models serve different questions and purposes. Some models are very useful for answering these questions,
and terrible for answering some other questions. Our profession has been blamed for not seeing the 2008 crisis coming
and journalists have blamed our models for being inadequate for predicting it. But often, that was not the aim or the
purpose for these models in the first place. Perhaps professional forecasters should be blamed: forecasting is their job.
Let’s ask why they missed it! But academics like me are for most parts interested in thinking and explaining some
observed phenomenon. I am not in the business of forecasting. Instead, I see the events that have taken place in 2008
and in 2010 and the interesting questions that arise from that. I may then go ahead and write down a model that
answers these questions. Such a model may or may not be particularly helpful to institutions − and I think central banks
are such institutions, or the IMF or the OECD − where the exercise is to think ahead what is going to happen. If these
institutions need better models for their tasks, they might want to think about ways of enticing academics to help them
there. So, here is an interesting question. If you could take a time machine, given that we know now, and then travel
back to 2006, what would be the key tools or the key models that you would take along, what would be the key things
to look at that would help you predict the events as they unfolded? I fear that even the recent financial-friction models
wouldn’t help much. Perhaps you would want to look at things like house price-rent ratios, price dividend ratios, or the
ratio of credit to GDP: these could all be telltale signs. There may be things that build up to a point where they become
very fragile when something potentially large could happen. This idea has been around for a long time, but we have not
completely sorted that out within our leading models. The current slate of DSGE models is more suitable for ex-post
reasoning. Researchers feed data into these DSGE models, like spreads on financial markets, and then some of these
DSGE models interpret that as increasing financial frictions. At best, you can then analyse the consequences of that.
But it is probably fairly impossible right now to predict, say, two years ahead of time that this increase in spreads is
going to happen. So, you couldn’t take one of the new models back to 2006 in your time machine and hope to be able
to predict the emerging crisis a year later. Again, that is OK if what you are interested in is thinking about these facts
afterwards as most academics do. It is not OK in an institution that tries to get ahead of the game. So, to answer your
question, which approach will be successful or not in future: for that, we first have to be clear about the purpose, about
what it is that we wish to achieve here, and what the approach and the model should be for. Perhaps it would be a
good idea for central banks or the OECD to very precisely formulate what it is that they need. I believe they have the
resources to do that, right? Then get academics; give them the small little rewards that they need to start thinking in
those directions and hopefully better tools emerge.
− Macro modeling has been made dramatically more accessible by specialised software, including your own Toolkit
and Dynare. Some argue that the ready availability of packaged code lowers the entry barrier too much, and leads
to large numbers of mindless applications. Do you see this happening, and if yes, is it a problem?
you know, I wrote these “toolkit” programs a while back. I wrote them for myself and then posted them on the web,
just in case others found them useful too. They became remarkably popular. Obviously, I was happy about that. Lots
of people used this “toolkit”, other people even developed it further and did ever more sophisticated things with them
− good! I was thrilled. More recently, Michel Juillard (Banque de France − the Editor) in France developed Dynare. I think
it is more of an open source software, so a number of people have played a role in developing that code. Dynare is more
recent than my programs, and it can do many things that my “toolkit” programs cannot do. Great, that’s technological
progress! Personally, I can still do certain things with my programs more easily than in Dynare. Others only use Dynare
and that is just fine too, of course. It certainly has lowered the entry barrier, and it’s easy to do many things. The
quality of your results depends on what you do with it, of course! Computer scientists sometimes say ‘garbage in,
garbage out’. If you put in a bad model, you get bad output, even if the output looks super-sophisticated. It is still the
human input that matters most. Still, these tools are a fantastic achievement. It made macroeconomists more serious
about data, made them more serious about estimation, and about solution methods and understanding macroeconomic
dynamics. It elevated the level of the debate considerably.
− Are you interested in policy questions; are you involved with macroeconomic policymaking? Do you advise central
banks in Europe or in the USA?
I have some sort of contract with the Bundesbank and with the Chicago Federal Reserve Bank, but I would not say that
I advise them on policy making. It just means that I go there and hang out with the researchers and talk to them.
Perhaps, I give a presentation of my research, or I talk with them about their research, and we talk about economics

MAGYAR NEMZETI BANK
MNB BullETIN • JANuARY 201366
and monetary policy in broad terms. The key policy makers are not involved there, though. I get the impression that a
number of them do not keep much in touch with the researchers. A key exception is Otmar Issing, who was on the
Executive Board of the European Central Bank from 1998 to 2006. He talked to academics quite a bit, I give him a lot
of credit for opening the ECB up to the debate with the scientific community; he’s a real hero in all of this. I don’t know
why policymakers do not do that more frequently. They are perhaps smart, they are certainly busy, and they have many
things to do. But for many policy issues, it is key to think through the underlying economics. It is unclear to me whether
they talk to economists much at all, but my impression is, they do not do it much. It would probably be helpful, if they
did it more. It always puzzles me that many of the central banks, including the central bank of Hungary, have excellent
and sophisticated economists on the research staff. They are in touch with academia, they have great analytical skills
that strike me as very useful for the policy issues at hand, but somehow, these insights do not get used enough at the
top level. In central banks, it works at least somewhat. In fiscal policy, I don’t see that it is working at all; it really is
hard to detect much meaningful interaction between fiscal policy makers and the economics research community. Some
colleagues claim it works for labour market policy, but I remain sceptical. How economic wisdom and good economic
analysis has a chance to get into policy is a mystery to me.
− You used to have a blog if I’m correct.
yeah, I had a blog with the Handelsblatt, a German daily newspaper on matters of economics. From my perspective, it
was a hobby, not my main activity. But I found it refreshing. I might read something in the newspaper about some
economic policy, and I might think that maybe I have something to say on that as an economist. The blog was great for
that. I wrote it up and two hours later, it is on the web and the world knows about it. It became too much of a chore
for me to clean out spam comments: they kept appearing and I had to erase them, they had absolutely nothing to do
with the blog content. It looked like robot programs posted them. Removing them required time. So at some point I
just said, look, this has been fun, but let me stop here, and so the blog was closed. I guess it had some impact. At some
point, in September 2008, I was very worried about a bank run in Germany and I made some rather clear-cut comments
about that in my blog. Someone at Handelsblatt thought that this was too dangerous as a blog entry, and so they erased
it. But the moment they erased this blog entry, readers noticed, the number of visits to my blog shot way up, and
readers found a way to read the entry on some autostorage site or so. Erasing that entry made it actually very popular,
and many more people read it than if Handelsblatt had not done anything. It was a fascinating lesson in Internet culture
for me.
− Macroeconomics has been heavily criticised for not being able to predict the crisis. Do you think this criticism is
justified? What do you think were the main problems with pre-crisis macro?
This question should really go to the professional forecasters. As an academic, I am not in the game of forecasting, it
is not my aim. But even when one does warn, does one get heard? Let me mention one episode. In 2003, the economics
unit within the European Commission organised a conference on the interplay between central banks and fiscal policy,
and they commissioned me to write a paper on that. It was supposed to be an academic piece, but on the level where
you could teach it to undergraduate students in economics or where someone with a bit of training in formal economics
could read it. So, I wrote a paper called ‘One Money, But Many Fiscal Policies in Europe: What are the Consequences?’
The conference papers were published in a conference volume and the paper was generally available on the web. The
paper has two parts: let me talk about the second half of it. The second part asked: what will happen, if a member
country of the European Monetary Union goes into sovereign default or where such a sovereign default becomes a
serious possibility? What should the European Central Bank do? What are some of the issues that one needs to think
through then? I didn’t have enough fantasy to think this through entirely, plus there was a deadline to finish the paper.
But at least, I raised the issue, I presented it at the conference in Brussels, and there were research people somewhat
close to policy in the ECB and other institutions seeing it being presented. So, if any of the policy people would have
thought that this is an issue worth thinking more, or if any journalist had picked it up at that time and figured that this
is worthy of more debate, there could have been some follow-up. But there was not, there was zero interest in that
issue then. What I learned from this is that as an academic, if you warn of bad developments to come while the sun
shines, you are Cassandra and it is very likely that you will simply be ignored. I surely was not the only one with such
an experience.

MNB BulletiN • JaNuary 2013 67
INTERVIEW WITH HARALD UHLIG
− It has been argued by Peter Howitt that the connection between central bank practice and academic macro
research is much weaker than academic economists would like. What are your views on this, and how should
interaction be improved?
I think that central banks are actually doing a pretty good job here. Sure, things could be even better, but central banks
in particular have gone a long way. 30 years ago, I believe they were not particularly sophisticated in terms of the
academic debate. Nowadays, many central banks have high-level research staff, who are also part of the academic
community, write research papers, read research papers, and interact with the academic research community. There
is a lot of interaction between the academic research community and the central bank research community. This in turn
has led to a substantial shift in the questions that macro researchers are interested in. For example, there is lots of
research on the effects of monetary policy shocks, and one of the reasons is that central banks were interested in that
research. By contrast, there is a lot less research on the many issues in fiscal policy. Researchers there have not
received the same kind of attention by policymakers, and may have turned to other issues as a result. I genuinely
believe that fiscal policy could be improved considerably, if there was the same level of interaction there. Why not have
research staffs in finance ministries and economics ministries like they exist in central banks, and give them the time
and resources to be part of the academic research community while also doing their work for the ministries? The next
tricky part, of course, is how to utilise this economic expertise inside for actual policymaking. I do not know enough
about that process. I often think that it would be good for high-level policymakers to have a PhD in economics
themselves and to actually have, say, published some papers in economics. With that, they have an appreciation for
how research works and how to make the best use of their research staff. There is no push button and you get the
perfect answer to some current issue. Rather, it is an ongoing communication that can work well. That helps to sharpen
the issues and helps identify the key forces at work. The leadership of central banks underutilises that resource too.
But if you compare that to fiscal policy, to labour market policy, the difference looks like night and day to me. Central
banks should really be the role models for other policy areas.
− You spent many years in Europe before moving to the United States. What is the current state of the profession
in Europe in your view? is there a convergence across the Atlantic, or is the USA still the place to be?
you know, there are many wonderful economists in Europe, there are some very good departments in Europe, but it’s
still a lot thinner in Europe overall. The density of top-notch economists in the United States is just amazing. Sometimes
it feels to me that if you take all the macroeconomists that are in the Chicago area and compare them to the
macroeconomists in all of Europe taken together, that the greater-Chicago crowd might hold up well in terms of insight
and research activities. Perhaps then, Chicago is all of Europe packed in one city in terms of macroeconomic research.
It is terrific to be part of that community. In Europe, the CEPR (Centre for Economic Policy Research − the Editor) has
done a great job in getting people together, but it is always a challenge. There may still be a long way in Europe to go.
The reasons are many. But it would be entirely feasible for Europe to be on par or even ahead. Europe is as rich as the
United States, and there probably is a more fertile climate for intellectual debates here. I enjoyed living in Europe, and
many European-born economists working in the United States do too. So, there is a lot of potential in Europe, genuine
opportunities. Some universities have become very entrepreneurial and make use of that.
− Any other thoughts?
I think that’s it. It’s the first time that I am at the central bank of Hungary; it’s an impressive place, and I wish you
much success. I spoke to many people here, I found them to be very insightful and interesting, and I really enjoyed
being here. I am very grateful for the invitation.
MNB BulletiN • JaNuary 201368
MNB BulletiN ARtiCleS (2006−2012)
7th year, issue 3 (October 2012)
Divéki, éva anD Dániel listár (2012): Better safe than sorry:
views of the Hungarian public on the security of payment
instruments
Felcser, Dániel anD kristóF leHMann (2012): The Fed’s inflation
target and the background of its announcement
Holló, Dániel (2012): Identifying imbalances in the Hungarian
banking system (‘early warning’ system)
koroknai, Péter anD rita lénárt-oDorán (2012): Developments
in external borrowing by individual sectors
szalai, zoltán (2012): A crisis of crisis management? Debates
over fiscal adjustments in the European Monetary Union
stePancHuk, serHiy (2012): 11th Annual Macroeconomic Policy
Research Workshop at MNB: Microeconomic Behavior and its
Macroeconomic Implications During the Financial Crisis
Interview with Fabio Canova
7th year, issue 2 (June 2012)
Divéki, éva (2012): Card or print? How to issue cafeteria
vouchers electronically?
Fábián, GerGely anD róbert Mátrai (2012): Unconventional
central bank instruments in Hungary
leHMann, kristóF (2012): International experiences with
unconventional central bank instruments
Pulai, GyörGy anD zoltán rePPa (2012): The design and
implementation of the MNB’s euro sale programme
introduced in relation to early repayments
rácz, olivér Miklós (2012): Using confidence indicators for
the assessment of the cyclicalposition of the economy
turJán, anikó anD JuDit broscH (2012): Single Euro Payments
Area (SEPA): Full speed ahead!
7th year, issue 1 (February 2012)
kiss M., norbert anD zoltán Molnár (2012): How do FX market
participants affect the forint exchange rate?
rabitscH, katrin (2012): 10th Annual Macroeconomic Research
Workshop at MNB: Fiscal Rebalancing, Public Debt, and its
National and Global Implications
sziGel, Gábor anD Péter Fáykiss (2012): The effect of
indebtedness on the financial and income position of
Hungarian households
6th year, issue 3 (October 2011)
aczél, ákos anD Dániel HoMolya (2011): Risks of the
indebtedness of the local government sector from the point
of view of financial stability
benczúr, Péter, Gábor kátay, áron kiss, balázs reizer anD MiHály
szoboszlai (2011): Analysis of changes in the tax and transfer
system with a behavioural microsimulation model
Hosszú, zsuzsanna (2011): Pre-crisis household consumption
behaviour and its heterogeneity according to income, on
the basis of micro statistics
kocsis, zalán anD Dénes naGy (2011): Variance decomposition
of sovereign CDS spreads
koroknai, Péter anD rita lénárt-oDorán (2011): The role of
special purpose entities in the Hungarian economy and in
statistics
Páles, JuDit anD Dániel HoMolya (2011): Developments in the
costs of external funds of the Hungarian banking sector
6th year, issue 2 (June 2011)
HoMolya, Dániel (2011): Operational risk and its relationship
with institution size in the Hungarian banking sector
Appendix

MNB BulletiN • JaNuary 2013 69
APPENDIX
HorvátH, áGnes, csaba köber anD katalin sziláGyi (2011): MPM
− The Magyar Nemzeti Bank’s monetary policy model
oDor, luDovit anD Gábor P. kiss (2011): The exception proves
the rule? Fiscal rules in the Visegrád countries
6th year, issue 1 (April 2011)
antal, JuDit anD áron Gereben (2011): Foreign reserve
strategies for emerging Economies − before and after the
crisis
erHart, szilárD anD anDrás kollarik (2011): The launch of
HUFONIA and the related international experience of
overnight indexed swap (OIS) markets
HelMeczi, istván nánDor anD GerGely kóczán (2011): On trade
vouchers called “local money”
kékesi, zsuzsa anD Gábor P. kiss (2011): The reversal of the
pension reform 1998 from a short-term perspective
5th year, issue 4 (December 2010)
HoFFMann, MiHály anD Gábor P. kiss (2010): From those lying
facts to the underlying deficit
krusPer, balázs anD Gábor Pellényi (2010): Impacts of fiscal
adjustments in Western European countries on the
Hungarian economy
Molnár, zoltán (2010): About the interbank HUF liquidity −
what does the MNB’s new liquidity forecast show?
szoMbati, anikó (2010): Systemic level impacts of Basel III on
Hungary and Europe
5th year, issue 3 (October 2010)
balás, taMás anD Márton naGy (2010): Conversion of foreign
currency loans into forints
Fábián, GerGely, anDrás HuDecz anD Gábor sziGel (2010):
Decline in corporate lending in Hungary and across the
Central and East European region during the crisis
Gereben, áron anD istván Mák (2010): Potentials and limitations
of non-governmental forint-denominated bond issues by
non-residents
kiss, GerGely (2010): Experiences of European crisis
management: the reform of economic policy coordination
kiss, Gábor P. anD zoltán rePPa (2010): Quo vadis, deficit?
How high the tax level will be when the economic cycle
reverses?
varGa, lóránt (2010): Introducing optional reserve ratios in
Hungary
5th year, issue 2 (June 2010)
cserMely, áGnes anD zoltán szalai (2010): The role of financial
imbalances in monetary policy
Felcser, Dániel anD GyönGyi körMenDi (2010): International
experiences of banking crises: management tools and
macroeconomic consequences
Habány, levente anD anikó turJán (2010): Channelling
government securities redemption into VIBER and its
effects on payment systems and its participants
kisGerGely, kornél (2010): Carry trade
5th year, issue 1 (March 2010)
boDnár, katalin (2010): Household consumption expenditures
and the consumer confidence index
bóDi-scHubert, anikó (2010): Factors behind high cash usage
in Hungary
krekó, JuDit anD Marianna enDrész (2010): The role of foreign
currency lending in the impact of the exchange rate on the
real economy
4th year, issue 4 (December 2009)
Gyura, Gábor anD anikó szoMbati (2009): Systemic risk in focus
− New directions of financial supervision at home and
abroad
kiss M., norbert anD istván Mák (2009): Developments in
sovereign bond issuance in the Central and Eastern European
region after the Lehman collapse
siMon, béla (2009): The role of cash in corporate financial
management − Where are petty cash holdings high?
vonnák, balázs (2009): Risk premium shocks, monetary
policy and exchange rate pass-through in small, open
countries

MAGYAR NEMZETI BANK
MNB BullETIN • JANuARY 201370
4th year, issue 3 (October 2009)
baloGH, csaba (2009): The role of MNB bills in domestic
financial markets. What is the connection between the
large volume of MNB bills, bank lending and demand in the
government securities markets?
Holló, Dániel (2009): Risk developments on the retail
mortgage loan market
kézDi, Gábor anD istván kónya (2009): Wage setting in
Hungary: evidence from a firm survey
karáDi, Péter (eD.) (2009): Rethinking Business Cycle Models
− Workshop at the MNB
4th year, issue 2 (July 2009)
HoMolya, Dániel (2009): The impact of the capital requirements
on operational risk in the Hungarian banking system
leszkó, erika (2009): Rounding is not to be feared
Munkácsi, zsuzsa (2009): Who exports in Hungary? Export
orientation by corporate size and foreign ownership, and
the effect of foreign ownership on export orientation
Pintér, klára anD GyörGy Pulai (2009): Measuring interest
rate expectations from market yields: topical issues
varGa, lóránt (2009): Hungarian sovereign credit risk
premium in international comparison during the financial
crisis
4th year, issue 1 (May 2009)
bakonyi, ákos anD Dániel HoMolya (2009): Backtesting the
efficiency of MNB’s Lending Survey
baksay, GerGely anD Gábor P. kiss (2009): Act one, act first −
the law on fiscal responsibility
Mák, istván anD JuDit Páles (2009): The role of the FX swap
market in the Hungarian financial system
kiss, Gábor P. anD róbert szeMere (2009): Apples and oranges?
A comparison of the public expenditure of the Visegrád
countries
3rd year, issue 3 (December 2008)
FiscHer, éva (2008): Challenges of financial integration in the
Central and East European region
koroknai, Péter (2008): Hungary’s external liabilities in
international comparison
oDorán, rita anD balázs sisak (2008): Cash demand of the
Hungarian economy − is the shadow economy still running
smoothly?
rePPa, zoltán (2008): Interest rate expectations and
macroeconomic shocks affecting the yield curve
szücs, aDrien (2008): The 200 forint denomination will be a coin
3rd year, issue 2 (September 2008)
karvalits, Ferenc (2008): Challenges of monetary policy − a
global perspective and the Hungarian situation
DáviD, sánDor (2008): The Single Euro Payments Area
HoMolya, Dániel anD Gábor sziGel (2008): Lending to local
governments: Risks and behaviour of Hungarian banks
JuHász, réka (2008): The optimal rate of inflation and the
inflation target: international experience and the Hungarian
perspective
3rd year, issue 1 (April 2008)
Hornok, cecília, zoltán M. Jakab anD Gábor P. kiss (2008):
‘Through a glass darkly’: Fiscal expansion and macro-
economic developments, 2001−2006
koMároMi, anDrás (2008): The structure of external financing:
Is there a reason to worry about financing through debt?
krekó, JuDit anD Gábor P. kiss (2008): Tax evasion and tax
changes in Hungary
naGy, Márton anD viktor e. szabó (2008): The sub-prime crisis
and its impact on the Hungarian banking sector
Páles, JuDit anD lóránt varGa (2008): Trends in the liquidity
of Hungarian financial markets − What does the MNB’s new
liquidity index show?
2nd year, issue 2 (November 2007)
cserMely, áGnes anD anDrás rezessy (2007): The theory and
practice of interest rate smoothing
Delikát, anna (2007): Role of financial markets in monetary
policy

MNB BulletiN • JaNuary 2013 71
APPENDIX
Holló, Dániel (2007): Household indebtedness and financial
stability: Reasons to be afraid?
sánta, lívia (2007): The role of central banks in crisis management
− how do financial crisis simulation exercises help?
tótH, Máté barnabás (2007): Monetary policy rules and a
normative approach to the central bank’s objective function
zsáMboki, balázs (2007): Impacts of financial regulation on
the cyclicality of banks’ capital requirements and on
financial stability
2nd year, issue 1 (June 2007)
balás, taMás anD csaba Móré (2007): How resilient are
Hungarian banks to liquidity shocks?
Gál, Péter (2007): Unfavourable investment data − risks to
economic growth?
kiss M., norbert anD klára Pintér (2007): How do
macroeconomic announcements and FX market transactions
affect exchange rates?
koMároMi, anDrás (2007): The effect of the monetary base
on money supply − Does the quantity of central bank money
carry any information?
1st year, issue 2 (December 2006)
Gábriel, Péter anD klára Pintér (2006): Whom should we
believe? Information content of the yield curve and analysts’
expectations
Gábriel, Péter anD áDáM reiFF (2006): The effect of the
change in VAT rates on the consumer price index
Gereben, áron anD norbert kiss M. (2006): A brief overview of
the characteristics of interbank forint/euro trading
Jakab, zoltán M. (2006): Consequences of global imbalance
corrections for Hungary
rezessy, anDrás (2006): Considerations for setting the
medium-term inflation target
széPlaki, valéria (2006): Reform of the Hungarian corporate
insolvency regulation and its financial stability aspects
1st year, issue 1 (June 2006)
boDnár, katalin (2006): Survey evidence on the exchange
rate exposure of Hungarian SMEs
csávás, csaba anD lóránt varGa (2006): Main characteristics of
non-residents’ trading on the foreign exchange and
government bond markets
Holló, Dániel anD Márton naGy (2006): Analysis of banking
system efficiency in the European Union
kiss, GerGely (2006): Fast credit growth: equilibrium
convergence or risky indebtedness?
Párkányi, balázs (2006): Myths and Maths: Macroecono-mic
Effects of Fiscal Adjustments in Hungary

MNB BulletiN • JaNuary 201372
Publications of the Magyar Nemzeti Bank
All publications of the Magyar Nemzeti Bank on the economy and finance are available on its website at
http://english.mnb.hu/Kiadvanyok. From 2009, the publications have been published only in electronic format.
Papers
MNB Bulletin / MNB-szemle
http://english.mnb.hu/Root/ENMNB/Kiadvanyok/mnben_mnbszemle
http://english.mnb.hu/Kiadvanyok/mnben_mnbszemle/mnben_szemle_cikkei
In Hungarian and English; published three or four times a year.
The aim of the short articles published in the Bulletin is to provide regular and readily comprehensible information to
professionals and the public at large about underlying developments in the economy, topical issues and the results of
research work at the Bank, which are of interest to the public. Private sector participants, university professors and
students, analysts and other professionals working at central banks and international organisations may find the Bulletin
an interesting read.
MNB Occasional Papers / MNB-tanulmányok
http://english.mnb.hu/Kiadvanyok/mnben_muhelytanulmanyok
In Hungarian and/or English; published irregularly.
Economic analyses related to monetary policy decision making at the Magyar Nemzeti Bank are published in the Occasional
Paper series. The aim of the series is to enhance the transparency of monetary policy. Typically, the papers present the
results of applied, practical research, review the technical details of projection work and discuss economic issues arising
during the policy making process.
MNB Working Papers
http://english.mnb.hu/Kiadvanyok/mnben_mnbfuzetek
Only in English; published irregularly.
The series presents the results of analytical and research work carried out in the Bank. The papers published in the series
may be of interest mainly to researchers in academic institutions, central banks and other research centres. Their aim is
to encourage readers to make comments which the authors can use in their further research work.
Regular publications
Quarterly report on inflation / Jelentés az infláció alakulásáról
In Hungarian and English; published four times a year.
Report on financial stability / Jelentés a pénzügyi stabilitásról
In Hungarian and English; published twice a year.
Report on payment systems / Jelentés a fizetési rendszerről
In Hungarian and English; published once a year.
Annual report: Business report and financial statements of the Magyar Nemzeti Bank / Éves jelentés: A Magyar
Nemzeti Bank adott évről szóló üzleti jelentése és beszámolója
In Hungarian and English; published once a year.

MNB BulletiN • JaNuary 2013 73
Féléves jelentés: Beszámoló az MNB adott félévi tevékenységéről (Semi-annual report: Report on the MNB’s
operations in a given half-year)
Only in Hungarian; published once a year.
időközi jelentés: Beszámoló az MNB adott negyedévi tevékenységéről (interim report: Report on the MNB’s
operations in a given quarter)
Only in Hungarian; published twice a year.
Analysis of the convergence process / elemzés a konvergenciafolyamatokról
In Hungarian and English; published yearly or biennially.
Senior loan officer opinion survey on bank lending practices / Felmérés a hitelezési vezetők körében a bankok
hitelezési gyakorlatának vizsgálatára
In Hungarian and English; published four times a year.
Public finance review / elemzés az államháztartásról
In Hungarian and English; published three or four times a year.
In addition to those listed above, the Bank also occasionally publishes other materials.


MNB BulletiN Vol. 8 No. 1
January 2013
Print: D-Plus
H−1037 Budapest, Csillaghegyi út 19−21.
